The study presents mixture experiment models for predicting the compressive strength and water absorption of sand-quarry dust blocks, which are produced by partially replacing sand with quarry dust. The models are formulated using augmented Scheffe’s simplex lattice design and provide predictions for compressive strength ranging from 2.74 to 5.22 N/mm² and water absorption from 3.21% to 7.84%, aiding Nigerian block producers in meeting industrial standards. The results indicate that cement is the most significant contributor to strength, while sand is the primary factor affecting water absorption.


![Mixture Experiment Models For Predicting…
www.theijes.com The IJES Page 31
0.80.60.40.20.0-0.2
5.5
5.0
4.5
4.0
3.5
3.0
deviation fromreference blend in pseudocomponent
FittedCompressivestrength
Water 0.25
Cement 0.25
Sand 0.25
Quarry dust 0.25
0.20.10.0-0.1-0.2
99
95
90
80
70
60
50
40
30
20
10
5
1
Residuals
Percent
Mean -3.87884E-16
StDev 0.06791
N 20
AD 0.130
P-Value 0.978
Normal - 95% CI
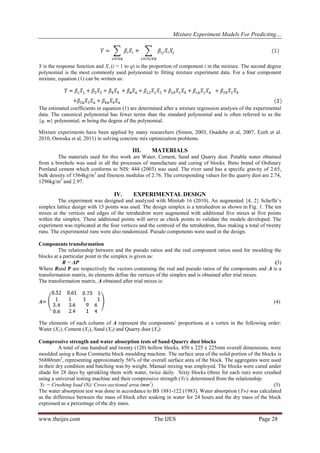
Fig. 1: Augmented {4, 2} Scheffe’s Fig.2 Normal probability plot for
simplex lattice showing the points and run order compressive strength
0.80.60.40.20.0-0.2
8
7
6
5
4
3
deviation fromreference blend in pseudocomponent
FittedWaterabsorption
Water 0.25
Cement 0.25
Sand 0.25
Quarry dust 0.25
(a) Compressive strength (b) Water absorption
Fig.3 Piepel response trace plots (Pseudo components)
VIII. ACKNOWLEGEMENT
We are grateful to Mr Ifeanyi Diogu of ACI Blocks, Owerri, Nigeria who gave us free use of the Rosa
Commetta block moulding machine used for this work.
REFERENCES
[1]. Anya, C. U. (2015) Models for Predicting the Structural Characteristics of Sand-Quarry dust Blocks. Unpublished Ph.D. Thesis.
Department of Civil Engineering, University of Nigeria, Nsukka
[2]. British Standard Institution, (1983). BS 1881-122. Testing concrete. Method for determining of Water absorption. London
[3]. Cornell, J., (2002). Experiments with Mixtures: Designs, Models and the Analysis of Mixture Data. 3ed. John Wiley and Sons
Inc. New York.
[4]. Ezeh, J.C., Ibearugbulem, O. M., Anya, U. C, (2010). Optimization of aggregate composition of laterite/sand hollow block using
Scheffe’s simplex method. International Journal of Engineering, 4(4), 471 - 478
[5] Minitab Inc. (2010). Minitab Statistical Software Release 16 Minitab Inc. State College Pennsylvania
[6] Nigeria Industrial Standards (2003) NIS 444: Quality standard for Ordinary Portland cement. Standard Organization of Nigeria,
Lagos
[7] Nigerian Industrial Standards (2004) .NIS 87: Standards for Sandcrete blocks. Standard Organization of Nigeria (SON), Lagos
[8] Onwuka, D. O., Okere, C. E., Arimanwa, J. I. and Onwuka, S. U., (2011). Prediction of concrete mix ratios using modified
regression theory. Computational. Method in Civil Engineering. Vol. 2, No 1. pp 95 – 107.
[9] Oyekan, G. L. and Kamiyo, O. M (2008). Effects of Granite Fines on the Structural and Hygrothermal Properties of Sandcrete
Blocks. Journal of Engineering and Applied Sciences 3 (9), 735 - 741.
[10] Osadebe, N. N., Mbajiorgu, C. C. and Nwakonobi, T. U. (2007): An optimization model development for laterized concrete mix
proportioning in building constructions. Nigerian Journal of Technology, Vol. 26 (1), 37- 46
[11] Scheffe, H., (1958): Experiments with mixtures. Journal of Royal Statistical Society, Series B. Vol. 20, No 2, pp 344 -360.
[12] Simon, M. J. (2003). Concrete Mixture Optimization Using Statistical Methods: Final Report. FHWA Office of Infrastructure
Research and Development, 6300.](https://image.slidesharecdn.com/e42027031-150218035131-conversion-gate01/85/Mixture-Experiment-Models-for-Predicting-the-Compressive-Strength-and-Water-Absorption-of-Sand-Quarry-Dust-Blocks-5-320.jpg)