
Recommended
Recommended
More Related Content
Similar to DZS ClinPlus CTMS
Similar to DZS ClinPlus CTMS (20)
Recently uploaded
Recently uploaded (20)
DZS ClinPlus CTMS
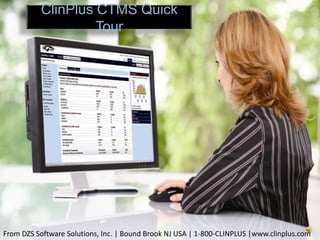
- 1. ClinPlus CTMS Quick Tour From DZS Software Solutions, Inc. | Bound Brook NJ USA | 1-800-CLINPLUS |www.clinplus.com
- 18. The Value of ClinPlusCTMS Installed, hosted, or subscription model Can be mapped to your existing process Integrated with CDM or EDC System supports multiple studies/protocols Multi-level customer support
- 19. ClinPlusCTMS is flexible! Scalable to fit your needs Tracks, filters, analyzes all trial operations data Configure views and reports by user roles Flexible finance options Entry level pricing for a hosted solution for as little as $1800./mo for 10 users
- 21. END
- 22. ClinPlus CTMS Track, measure and report on virtually every aspect of a clinical trial or study program. The relational database at the heart of the CTMS groups, analyses and filters clinical trial operations information at various levels including, among others, trial, country, site, investigator, product, clinical research associate (CRA) etc. Configure views of trial management data suited to a variety of individuals within the organization, including high-level, consolidated metrics for senior managers. View the progress of multiple studies and compare protocols to optimize future studies.
Editor's Notes
- Thanks for taking the time to look at our ClinPlus Clinical Trial Management System (CTMS) . We think the system is one of the best available, and we’d like to give you a quick tour of the system and show you the value it can provide.
- As you can see, The main user interface of the system is designed for easy navigation and consistency. A clean and logical representation of all the trial activity allows you to move easily between the various areas of the trial activities including site activity, patient enrollment, finances and system administration with a click of the mouse.
- Quick access tabs provide immediate access to all trial summary data, projected progress and important milestones and events
- Most screens present summary information first, and allow users to drill down for more detail.Color coded icons flag items that need immediate attention
- Real-time, graphically displayed snapshot summaries of enrollment, screening, site activity, site visits appear on the right and help keep trials on track and alert monitors to any bottlenecks.New Messages and upcoming Tasks are immediately visible to be acted upon
- Access to projects, sites, menus and features is restricted using role=based security. and is controlled using tabs. What a user sees, is based on defined user roles. Users only see what is pertinent to their roles and responsibilities and unnecessary menus and features can be enhidEach tab has sub categories that are accessible in the upper left menu area
- The “My Favorites” section allows users to add shortcuts to quickly access their most frequently used screens or reports.If you click on th CTMS configuration link….
- It will bring you to this screen…Here, system configuration is easy for administrators and project managers. While default configuration choices are defined at the system level, these can easily be overridden at the project level.
- The system will use the existing enrollment and site startup data to estimate project enrollment completion dates. In this example, the rate of enrollment would almost have to double (from.5 to .92 subjects/site month) in order to achieve an on-time completion.
- Under the Project events tab, both scheduled and completed key milestones can be viewed and tracked during the course of a clinical research project. Of course Events can be customized for each project.
- Startup Events are used to manage the process of moving a Site through the various stages from Initial Contact through Site Initiation. Study Events maintain a history of key events during the study.
- All types of project specific site visits can be tracked. Associated documents such as confirmation and follow-up letters and trip reports can also be uploaded and shared with the project team.
- Here users can track the status of essential documents for each site. Optionally, sites or CRAs can upload electronic copies of each document to share with team members; letters and trip reports can also be uploaded and shared with the project team.
- Blogs (or “Weblogs”) are used to manage and share communications, issues, or messages to all members of the project team. Blogs are available at the Project, Site, and Subject level, and can also include customizable Tags for easy searchingand reporting. Team members can add comments to each blog entry.
- Payments to Investigators are calculated for each Subject Visit, and can be set for eithermanual or automatic approval. Multiple payment budget amounts can be defined for eachInvestigator based on the subject’s gender, group, or protocol amendment.
- Financial overview screens give you a complete picture of study finances, with summaries of all your key finance metrics. View total payables, pending transactions and payments, holdback amounts, even the last check that was issued.
- One of the most powerful capabilities of the system, the site visit report tool. Let’s you easily configure templates for your workflow and provide real-time snapshots on all of your site visit activity and customizable from project to project. Both authors and reviewers use same screen, with copies of the report captured at every stage in the workflow.
- So just to recap, ClinPlus CTMS can be licensed and delivered as an installed or subscription-based solution And can be mapped to your current process and easily managed and integrated with ClinPlus and other EDC and Data Mangement systems. The system supports multiple studies and protocols and finally, DZS has a staff of developers who can help configure the system, keep you up and running and produce any custom templates or reports.
- ClinPlus CTMS is totally flexible and can scale as your needs grow. Give you the ability to track trial data and configure dashboards based on user roles, and finally, DZS offers a variety of lease, purchase or SaaS pricing options to meet your budget. and a very attractive entry level pricingWe hope this gives you a better idea of the capabilities of ClinPlusCTMS, and I invite you to contact us if you have questions or would like to arrange a more detailed demonstration.
- Thank You again for viewing our overview…My name is Patrick Champoux and here is my contact information….If you have any questions or would like to arrange a more detailed demo or explore pricing, please give me a call or email……I look forward to hearing from you soon!
- The system acts as a dashboard to all your clinical trial information…And allows you to manage all aspects of your trials. You can also analyze and filter information at a variety of levels And configure views for different audiencesThe system also facilitates views of multiple studies and protocols … Lets take a look