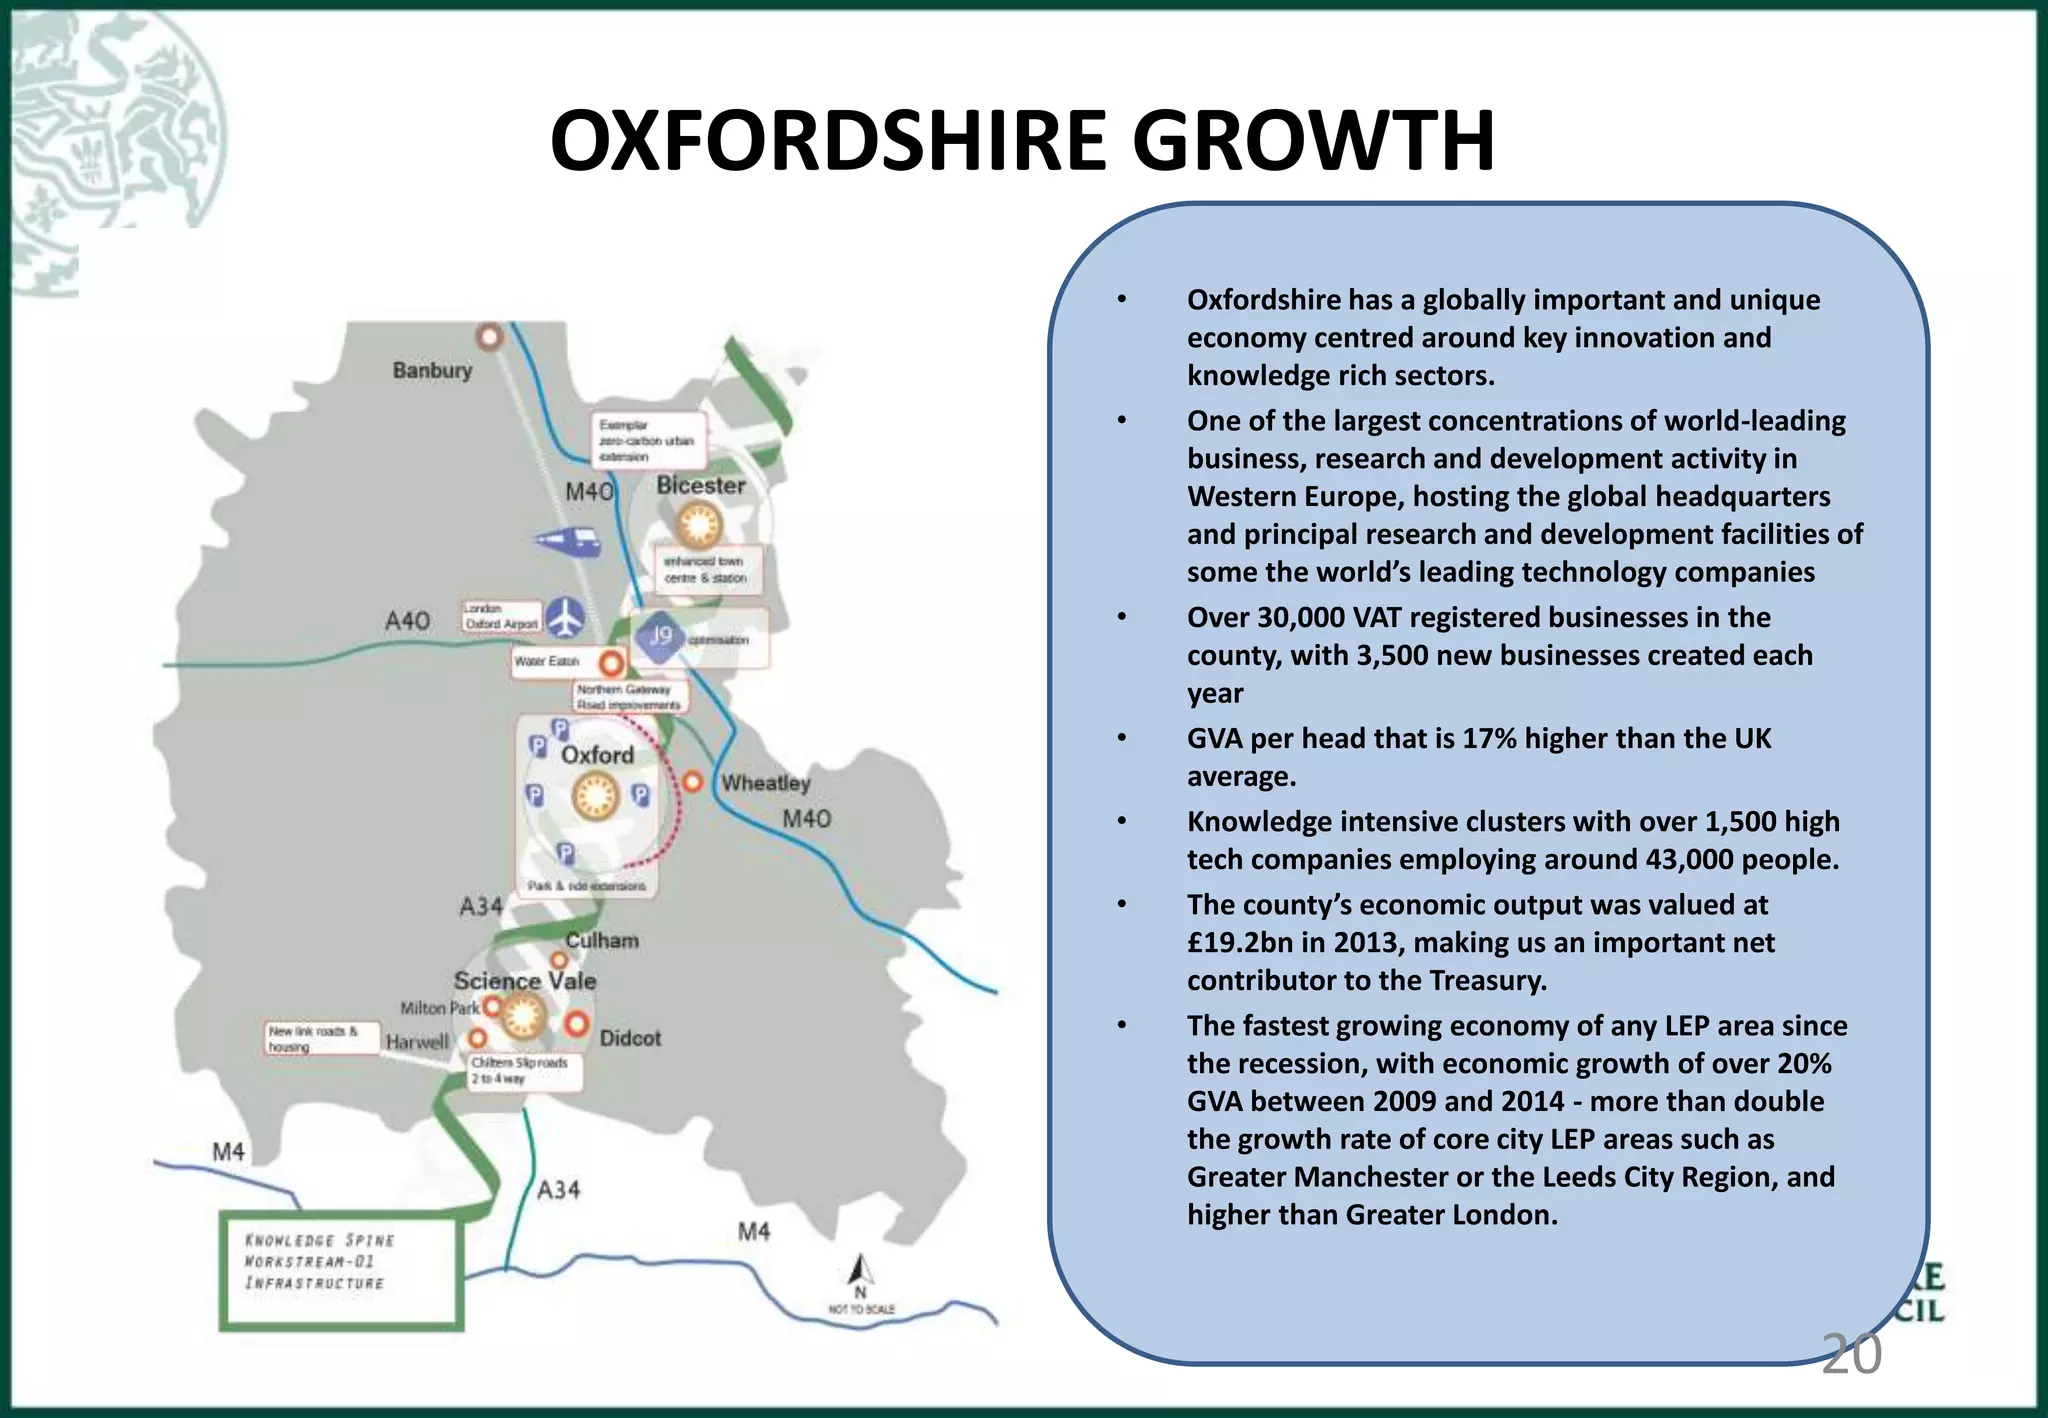
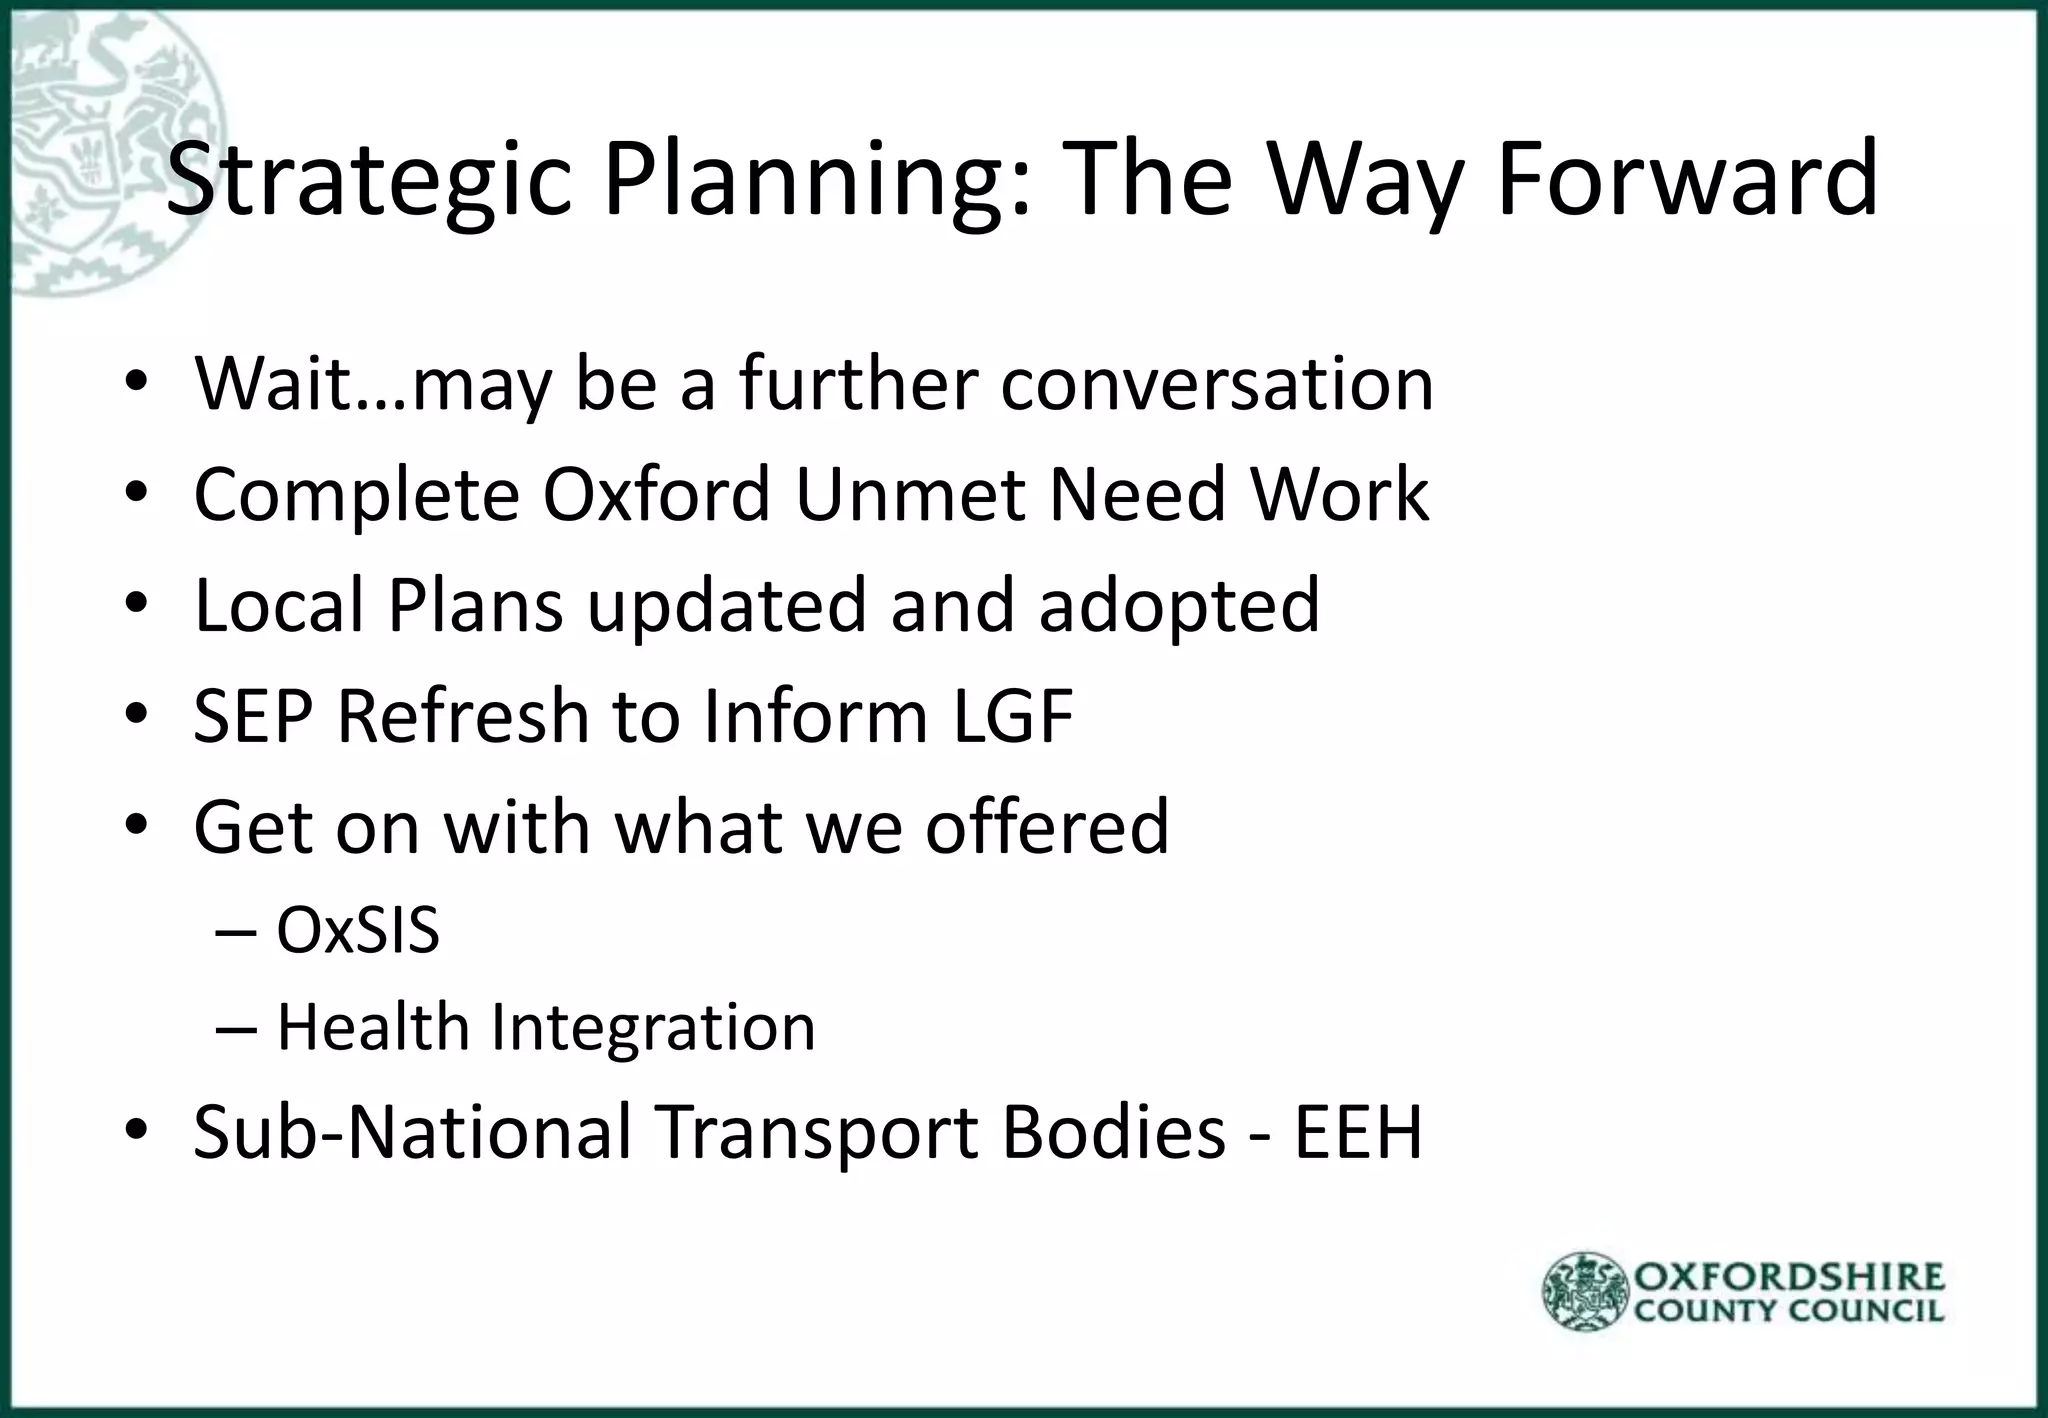
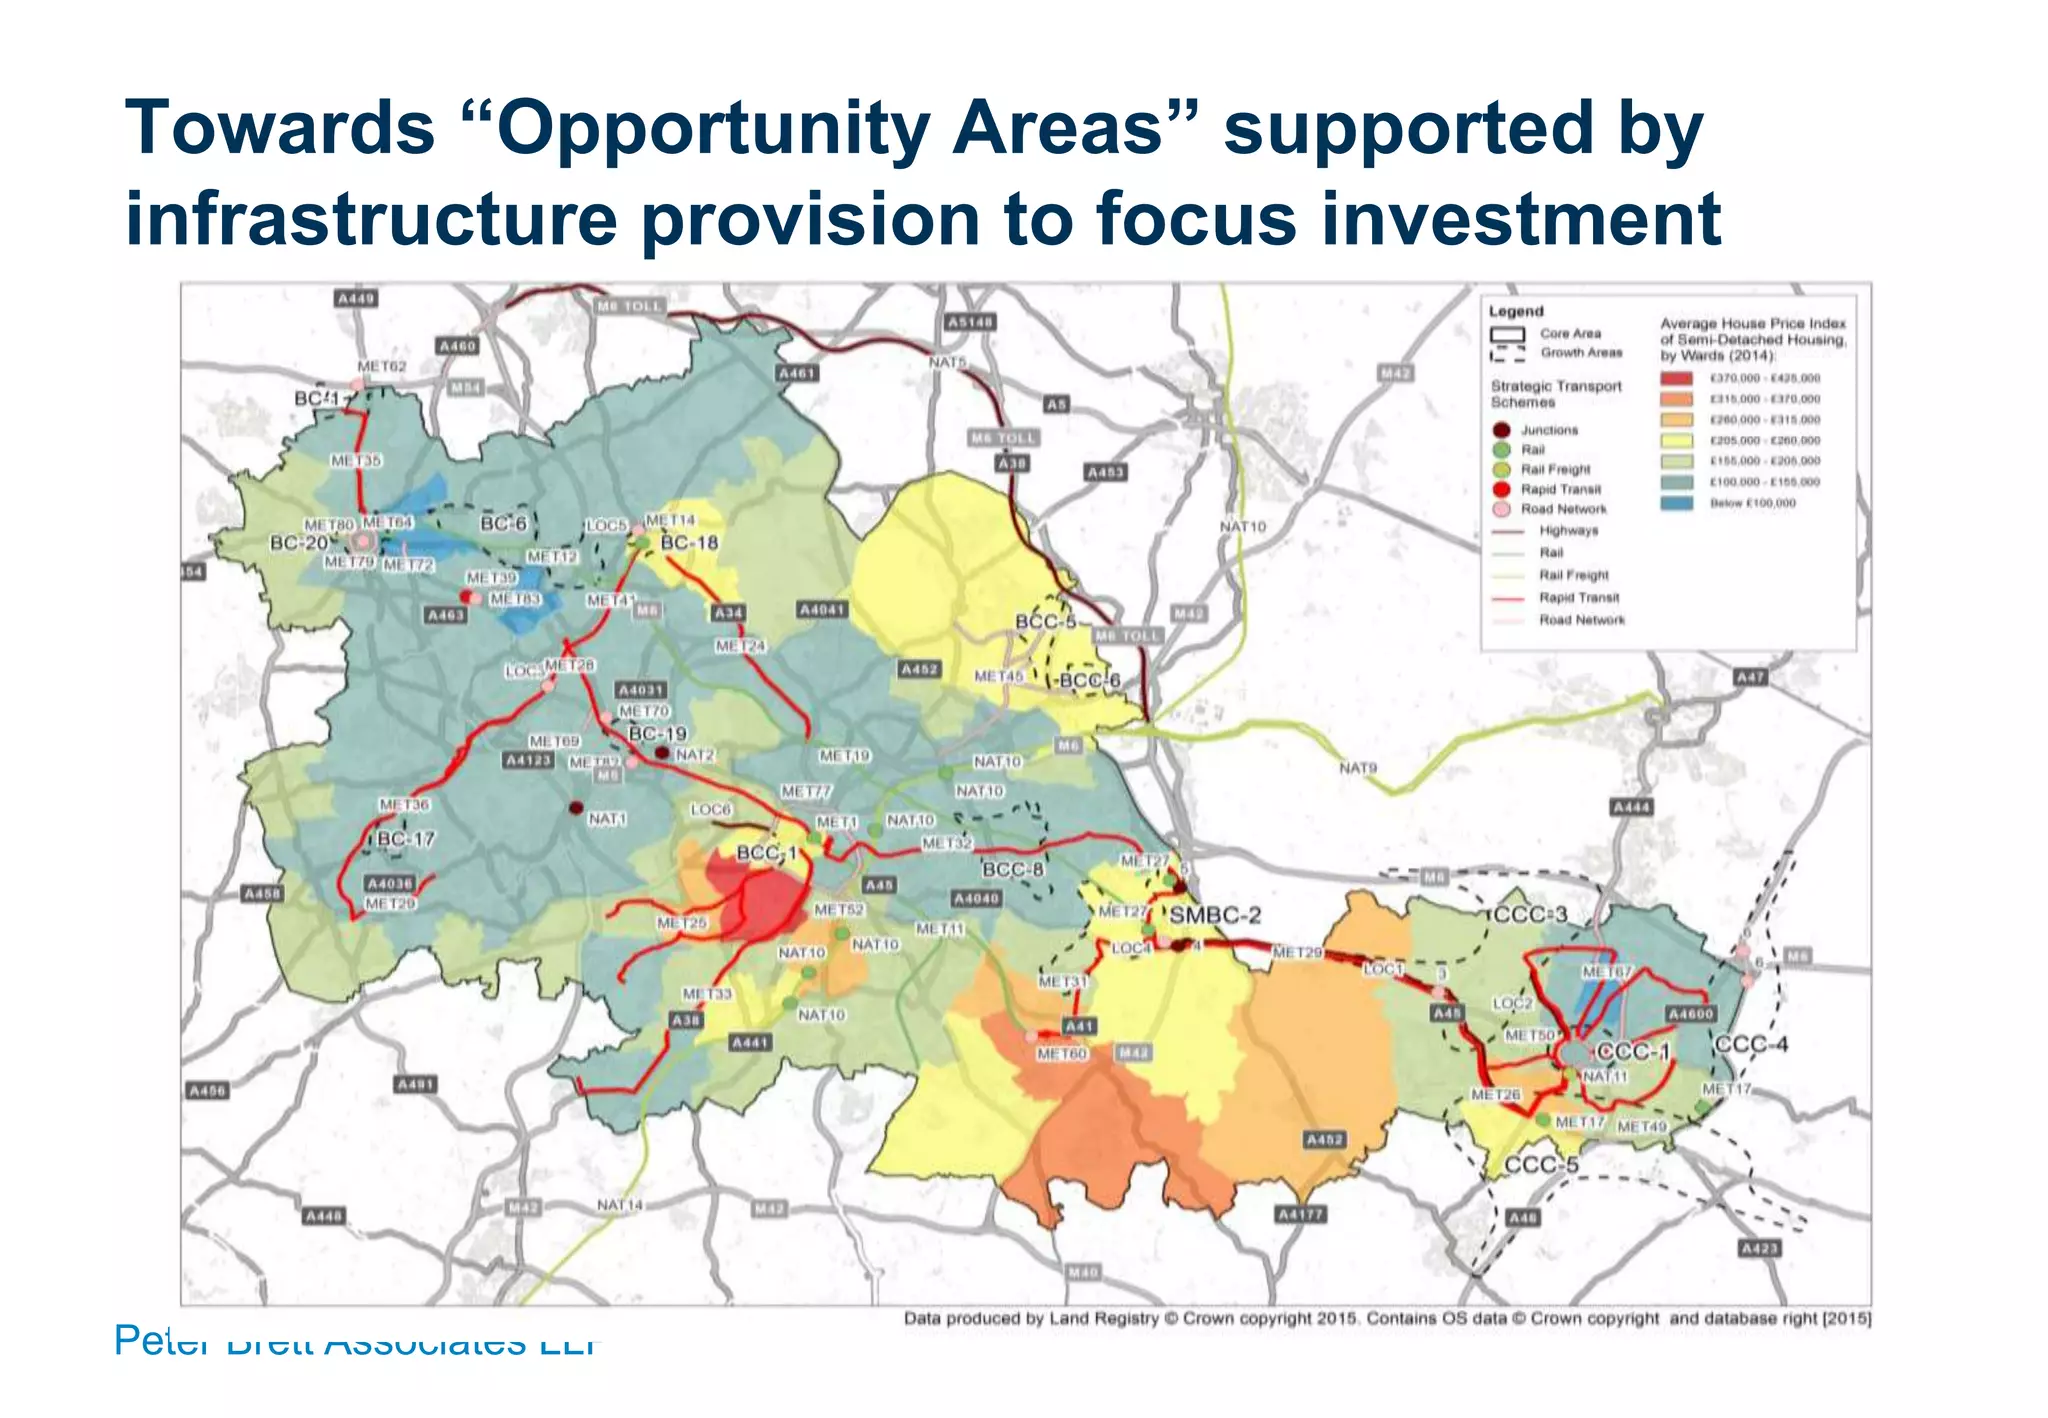
Beyond the Duty to Co-operate…
…and towards strategic planning
Welcome!
February/March 2016 www.pas.gov.uk
Introduction
Andrew Pritchard
PAS Principal Consultant
The Story So Far…
Keith Holland
Former PINS Assistant Director
Beyond the Duty to Co-operate…
…and towards effective strategic
planning
www.pas.gov.uk
Background
• Research into the Duty to Cooperate conducted
by Shared Intelligence (Si) in 2015.
• Involving interviews with over 100 planning
officers, chief executives, lead members,
leaders, and industry professionals.
• Aiming to understand what concerns authorities
have regarding the duty, and their current and
future support needs.
Mixed views about the Duty
• Research unearthed a wide mix of views about the
Duty
• From hostility from some who saw it as a “half
measure” in the absence of “proper strategic planning”
• To a cautious welcome as a locally-led alternative to
the old “top down way of doing things”
• Introduction of the Duty – “dropped in…at the last
moment” - had created considerable confusion
• Common view that it would not survive after the May
election…
• In that context, authorities had been on a steep
learning curve
• Initial perception that the Duty was a narrow process
requirement
• Replaced by an understanding that the Duty was a
“pretty fundamental test”
• Many officers faced an internal task of raising
awareness amongst senior officers and elected
members
Learning curve
Learning curve
“They thought regional officers had been abolished. It
wasn’t – it was delegated”.
“The removal of top-down planning, whatever you
thought of it, created a void”.
“Most now appreciate that the Duty is a pretty
fundamental test”.
“We thought we were doing everything right. Up until the
point we failed”.
• The response to the Duty was shaped by local context
• For areas with a history of cooperation and a shared /
emerging vision, the Duty was a continuation of
business as normal
“We have a strong bond [with neighbours]. The Duty just
gives us another reason for talking at that strategic level,
for seeing out inter-relationships”.
Local context
• The response to the Duty was shaped by local context
• For areas with a history of cooperation and a shared /
emerging vision, the Duty was a continuation of
business as normal.
• For areas with little or such history and / or conflicting
planning goals, the Duty raised issues that were not
being answered – or even addressed
“We have a strong bond [with neighbours]. The Duty just
gives us another reason for talking at that strategic level,
for seeing out inter-relationships”.
Local context
We asked interviewees to rate the main challenges facing
their authority in terms of compliance:
• “Agreeing a distribution of housing / employment land
with neighbouring authorities”
• “Doing effective cross-boundary strategic planning at
the local authority level”
• “Political differences”
• “Lack of alignment with neighbouring areas in terms of
local plan development”
• “Capacity in the authority”
Top 5 challenges
Reflections on the challenges
“If you have an uncooperative partner, and they’re
prepared to put up with the consequences and blame the
government, there is no real sanction.”
“It’s a hard duty to carry out effectively…The level of
collaboration is a bit pick and mix as we’re all at different
stages.”
“The difficulty is selling it to members.”
We also asked interviewees to identify the features of a
support package:
• Bringing authorities together to focus on strategic,
cross-boundary issues
• Engaging elected member and senior managers
• Providing a review / critical friend function
• Illustrating examples of joint working arrangements
• Working with individual authorities to develop capacity
and raise awareness
Support
Changing context
• Devolution:
– operating at a level larger than and across strategic
housing markets
– Delivering powers and resources that should enable
faster delivery of planned homes
– Ramping up pressure for more housing to match
ambitious growth plans
• Mayoral corporations
That was then…
• To what extent are those issues and concerns
still relevant today?
• What do we need to do to address them?
• What other support needs remain?
Strategic Planning and Devolution
Oxfordshire Devolution Proposal
Bev Hindle
Strategy & Infrastructure Planning
23 February 2016
“Strategic Planning” in Oxfordshire
Context
• Post-Coalition – very limited
• Forced working through DtC and SHMA
• “Considered Approach” – external advice
• Post-SHMA – Oxford’s Unmet Need
• Tri-County Alliance
• Devolution – answers looking for a question
Ian Hudspeth
Leader Oxfordshire
County Council
Bob Price
Leader Oxford
City Council
David Smith
Chief Executive
Oxfordshire CCG
Sir Barry Norton
Leader
West Oxfordshire
David Buckle
Chief Executive
South & Vale DC’s
Nigel Tipple
Chief executive
OxLEP
Oxfordshire Devolution
A Deal for Greater Economic Success
The Challenge
and Opportunity
Oxfordshire Economy and context
• Oxfordshire has a globally important and unique
economy centred around key innovation and
knowledge rich sectors.
• One of the largest concentrations of world-leading
business, research and development activity in
Western Europe, hosting the global headquarters
and principal research and development facilities of
some the world’s leading technology companies
• Over 30,000 VAT registered businesses in the
county, with 3,500 new businesses created each
year
• GVA per head that is 17% higher than the UK
average.
• Knowledge intensive clusters with over 1,500 high
tech companies employing around 43,000 people.
• The county’s economic output was valued at
£19.2bn in 2013, making us an important net
contributor to the Treasury.
• The fastest growing economy of any LEP area since
the recession, with economic growth of over 20%
GVA between 2009 and 2014 - more than double
the growth rate of core city LEP areas such as
Greater Manchester or the Leeds City Region, and
higher than Greater London.
20
OXFORDSHIRE GROWTH
Devolution “Process”
• Never a defined process – evolved
• Started in earnest mid-2015
• First Submission considered – further dialogue
• Meet with Minister and MPs
• Revised Submission January 2016…
• Two Main Threads – health and infrastructure
Oxfordshire Devolution Proposal:
Infrastructure
• Infrastructure investment programme to support growth;
• Integrated approach to strategic planning for
infrastructure, housing and employment through a
Combined Authority;
• Partnership with HCA to develop a housing investment
strategy and consolidated funding allocation;
• Development of a Land and Property Partnership Board;
• Development of Housing Development Companies;
• Locally set planning fees to support the significant
growth.
Deliver:
• By 2031, over £6bn will have been invested in infrastructure including rail,
road and public transport networks
• By 2031:
– 85,600 jobs will have been created
– The jobs from 2015 – 2031 will have generated £11.8bn of GVA and a gross
increase of £4.1bn of GVA each year from 2031 onwards
– Construction activity will have generated a boost to GVA of £15.5bn and support
326,000 FTE Temporary construction job years (21,000 construction jobs for 15
years)
• By 2020:
– Construction job activity will generate a one off boost to GVA of £5.4bn
– 21,000 Construction jobs will have been supported each year on average
– There will be an increase of 30,000 full time jobs
– An annual GVA increase of £1.5bn (that will continue each year after 2020).
Oxfordshire Devolution Proposal:
Infrastructure
Where Are We Now?
• Many of the second round devolution bids
have fallen away
• Criteria for success changed
• SoS powers – where will that take us?
• Emphasis on elected mayor, reorganisation
• D-Evolution
Strategic Planning: The Way Forward
• Wait…may be a further conversation
• Complete Oxford Unmet Need Work
• Local Plans updated and adopted
• SEP Refresh to Inform LGF
• Get on with what we offered
– OxSIS
– Health Integration
• Sub-National Transport Bodies - EEH
Thank you
Peter Brett Associates LLP
Strategic investment plans: what they
are, aren’t, and how they can really
work
Peter Brett Associates LLP
What are “area-wide strategic investment
plans”?
About plans which co-ordinate land use and infrastructure
investment which cross boundaries
1) Emerging Combined Authorities Investment / Growth Plans
• Frantic devolution deals 2015: Treasury only really interested in
• A) Elected mayor as focus of responsibility
• B) Strategic planning powers for investment
• Different results in different places: Manchester, Sheffield, NE,
Liverpool Mayor taking on strategic planning powers;
• Tees Valley, West Midlands CA – Mayors have smaller (stated) role
2) Emerging Regional Partnership Investment Plans / Strategies
• (eg Northern Gateway HS2 - Stoke, Crewe, Cheshire)
3) Local authority cross-border investment plans
• eg some London Opportunity Area DIFS, County documents
Peter Brett Associates LLP
Saving money through joint commissioning
• Scale economies exist through joint commissioning
• But not the real benefit?
• Benefits are in
• quality of output arising from looking at wider spatial scale
• greater ability to lever meaningful infrastructure investment able
to trigger private investment
Peter Brett Associates LLP
Strategic investment plans are not about this
Peter Brett Associates LLP
They’re about this: innovation and
information flows
Peter Brett Associates LLP
Strategic investment plans are not about this
Peter Brett Associates LLP
They’re about this: improving underlying
economic geographies
Peter Brett Associates LLP
Strategic investment plans are not about this (not
really)
The old starting point
Peter Brett Associates LLP
They’re about this: stimulating private sector
investment
Peter Brett Associates LLP
They’re about this: stimulating private sector
investment
• Your challenge:
• To set up investible propositions that will get delivered
• Through de-risking investment
• Making intelligent use of any capital spend available
Peter Brett Associates LLP
Information de-risks investment: quality
Peter Brett Associates LLP
Information de-risks investment: neighbours
Peter Brett Associates LLP
Information de-risks investment: S106/CIL (land
price)
Peter Brett Associates LLP
Information de-risks investment: co-ordination
Peter Brett Associates LLP
Example: West Midlands – contaminated
sites, lack of viability, fractured plans?
Peter Brett Associates LLP
Integrating infrastructure and focused site
delivery to accelerate investment
Peter Brett Associates LLP
Towards “Opportunity Areas” supported by
infrastructure provision to focus investment
Peter Brett Associates LLP
Telling the delivery and implementation story
Total cost share Top-ten project costs
Transport
70%
Education
18%
Parks, open
space & public
realm, leisure/
sports
7%
Community &
Cultural
facilities
2%
Emergency
Services
1%
Other
2%
-£1412.9m
-£368.6m
£0.0m
-£136.8m
-£46.9m
-£10.2m
-£7.7m
£0.0m
-£8.0m
-£4.0m
-£3.8m
-£7.7m
-£5.1m
-£5.3m
-£1600.0m
-£1400.0m
-£1200.0m
-£1000.0m
-£800.0m
-£600.0m
-£400.0m
-£200.0m
£0.0m
Balance between costs and main funding Infrastructure costs by strategic site
-£998.7m
-£314.6m
-£114.2m
-£35.0m
-£5.0m
-£5.6m
-£1.7m
-£5.0m
-£5.3m
-£1.1m
-£4.0m
-£3.8m
£0.0m
£0.0m
£0.0m
£0.0m
£0.0m
£0.0m
£0.0m
£0.0m
-£2000.0m
-£1500.0m
-£1000.0m
-£500.0m
£0.0m
£500.0m
£1000.0m
Total Cost Estimated Mainstream Funding Funding Gap (excluding developer contributions)
Strategic site 1, 2, 3 etc
-£15,000,000
-£10,000,000
-£5,000,000
£-
£5,000,000
£10,000,000
2012 2013 2014 2015 2016 2017-21 2022-31 Total
2 weeks commencing 15-Feb 22-Feb 29-Feb 07-Mar 14-Mar 21-Mar 28-Mar 04-Apr 11-Apr 18-Apr 25-Apr 02-May 09-May 16-May 23-May
Stage 0 Inception Easter float
0A Pre-inception familiarisation Easter float
0B Inception meeting with steering group Easter float
0C Walking audit with your team Easter float
0D Team-building dinner Easter float
0E Workshop (brief 2) Easter float
Stage 1 understanding the tow n centres Easter float
1A Future strategy Easter float
1B Economics Easter float
1C Demographics Easter float
1D Movement and connections Easter float
1E Viability and land ownerships Easter float
1F Retail Easter float
1G Leisure Easter float
1H Flood Easter float
1J Utilities Easter float
**1K Understanding the other centres (brief 1B) Easter float
Stage 2 Focusing the study on vision and objectives Easter float
2A the draft strategic framework Easter float
2B Charrette workshop (plus progress meeting) Easter float
Stage 3 design stage Easter float
3A Strategic spatial masterplan Easter float
**3B Other centres: concept masterplans Easter float
Stage 4 investment& implementation plan Easter float
4A Investment strategy/implementation Easter float
Stage 5 report finalisation Easter float
5A Draft report production Easter float
5B Final comments Easter float
Easter float
Peter Brett Associates LLP
Focusing your firepower to get investment
moving
Infrastructure
planning
Land use
planning
Finance and
funding
Governance
& delivery
Opportunity
Areas
Other infrastructure investments
Peter Brett Associates LLP
Getting from LEP/Combined Authority Strategic
Economic Plans to implementation
• Problem: like LEP plans, SEPs frequently boosterist - big job
claims
• Needed to get Government’s attention at the time
• But disconnected from the (statutory plan) means of delivering
the targets
• Plans don’t match the targets
• And possible unintended consequences?
• Jobs claims not backed by housing land supply for workers
• The SEPs risk wrecking the local plans
• Eg Oxfordshire and Cheshire
• Land use planning is quasi-judicial process: keep separate
• the economic aspirations in the model
• Numbers in land use plan
Peter Brett Associates LLP
Understanding the gap, and plugging it
• If there is a gap between the SEP and the total homes and
jobs number
• You need to understand it and quantify it
• You need to know shortfall in homes and jobs
• And find schemes to plug it?
• Challenging local authorities to grow is part of the SEP’s role
• How do you do that?
Peter Brett Associates LLP
Challenging local authorities to grow
• Planning has become a system of legal compliance
• Forget all that for a day or two
• Give yourselves permission to think more fluidly
• The grand example: Birmingham’s 1989 Highbury Initiative
• More micro examples: Northern Gateway Workshop
• Some possible success factors?
• Talk to each other!
Peter Brett Associates LLP
Success factor: a willingness to think
creatively, heretically about existing plans.
Instead, think markets and viability
Peter Brett Associates LLP
Success factor: Chatham House Rules?
Peter Brett Associates LLP
Success factor: a willingness to return to the old
classics?
Peter Brett Associates LLP
Success factor: don’t talk your silo.
Think like a disinterested alien?
Peter Brett Associates LLP
Success factor: pulling the high falutin’
back to plausible, practical local context?
Peter Brett Associates LLP
Talk to investors as soon as you have ideas:
road test concepts with them. You might be
surprised
• Eg Birmingham Vision for
Movements
• City Council and
investors met informally
• Found common ground
• Created Vision for
Movement
• Helped precipitate public
realm and major metro
projects
Peter Brett Associates LLP
Getting real about investment actualises
creativity
Acknowledgements to Farrells
Peter Brett Associates LLP
Strategic investment plans: what they
are, aren’t, and how they can really
work
Panel Q & A
Where can I get some help?
Andrew Pritchard
PAS Principal Consultant
For More information…
www.pas.gov.uk

Duty to Cooperate Composite

  • 1.
    Beyond the Dutyto Co-operate… …and towards strategic planning Welcome! February/March 2016 www.pas.gov.uk
  • 2.
  • 3.
    The Story SoFar… Keith Holland Former PINS Assistant Director
  • 4.
    Beyond the Dutyto Co-operate… …and towards effective strategic planning www.pas.gov.uk
  • 5.
    Background • Research intothe Duty to Cooperate conducted by Shared Intelligence (Si) in 2015. • Involving interviews with over 100 planning officers, chief executives, lead members, leaders, and industry professionals. • Aiming to understand what concerns authorities have regarding the duty, and their current and future support needs.
  • 6.
    Mixed views aboutthe Duty • Research unearthed a wide mix of views about the Duty • From hostility from some who saw it as a “half measure” in the absence of “proper strategic planning” • To a cautious welcome as a locally-led alternative to the old “top down way of doing things” • Introduction of the Duty – “dropped in…at the last moment” - had created considerable confusion • Common view that it would not survive after the May election…
  • 7.
    • In thatcontext, authorities had been on a steep learning curve • Initial perception that the Duty was a narrow process requirement • Replaced by an understanding that the Duty was a “pretty fundamental test” • Many officers faced an internal task of raising awareness amongst senior officers and elected members Learning curve
  • 8.
    Learning curve “They thoughtregional officers had been abolished. It wasn’t – it was delegated”. “The removal of top-down planning, whatever you thought of it, created a void”. “Most now appreciate that the Duty is a pretty fundamental test”. “We thought we were doing everything right. Up until the point we failed”.
  • 9.
    • The responseto the Duty was shaped by local context • For areas with a history of cooperation and a shared / emerging vision, the Duty was a continuation of business as normal “We have a strong bond [with neighbours]. The Duty just gives us another reason for talking at that strategic level, for seeing out inter-relationships”. Local context
  • 10.
    • The responseto the Duty was shaped by local context • For areas with a history of cooperation and a shared / emerging vision, the Duty was a continuation of business as normal. • For areas with little or such history and / or conflicting planning goals, the Duty raised issues that were not being answered – or even addressed “We have a strong bond [with neighbours]. The Duty just gives us another reason for talking at that strategic level, for seeing out inter-relationships”. Local context
  • 11.
    We asked intervieweesto rate the main challenges facing their authority in terms of compliance: • “Agreeing a distribution of housing / employment land with neighbouring authorities” • “Doing effective cross-boundary strategic planning at the local authority level” • “Political differences” • “Lack of alignment with neighbouring areas in terms of local plan development” • “Capacity in the authority” Top 5 challenges
  • 12.
    Reflections on thechallenges “If you have an uncooperative partner, and they’re prepared to put up with the consequences and blame the government, there is no real sanction.” “It’s a hard duty to carry out effectively…The level of collaboration is a bit pick and mix as we’re all at different stages.” “The difficulty is selling it to members.”
  • 13.
    We also askedinterviewees to identify the features of a support package: • Bringing authorities together to focus on strategic, cross-boundary issues • Engaging elected member and senior managers • Providing a review / critical friend function • Illustrating examples of joint working arrangements • Working with individual authorities to develop capacity and raise awareness Support
  • 14.
    Changing context • Devolution: –operating at a level larger than and across strategic housing markets – Delivering powers and resources that should enable faster delivery of planned homes – Ramping up pressure for more housing to match ambitious growth plans • Mayoral corporations
  • 15.
    That was then… •To what extent are those issues and concerns still relevant today? • What do we need to do to address them? • What other support needs remain?
  • 16.
    Strategic Planning andDevolution Oxfordshire Devolution Proposal Bev Hindle Strategy & Infrastructure Planning 23 February 2016
  • 17.
    “Strategic Planning” inOxfordshire Context • Post-Coalition – very limited • Forced working through DtC and SHMA • “Considered Approach” – external advice • Post-SHMA – Oxford’s Unmet Need • Tri-County Alliance • Devolution – answers looking for a question
  • 18.
    Ian Hudspeth Leader Oxfordshire CountyCouncil Bob Price Leader Oxford City Council David Smith Chief Executive Oxfordshire CCG Sir Barry Norton Leader West Oxfordshire David Buckle Chief Executive South & Vale DC’s Nigel Tipple Chief executive OxLEP Oxfordshire Devolution A Deal for Greater Economic Success
  • 19.
  • 20.
    Oxfordshire Economy andcontext • Oxfordshire has a globally important and unique economy centred around key innovation and knowledge rich sectors. • One of the largest concentrations of world-leading business, research and development activity in Western Europe, hosting the global headquarters and principal research and development facilities of some the world’s leading technology companies • Over 30,000 VAT registered businesses in the county, with 3,500 new businesses created each year • GVA per head that is 17% higher than the UK average. • Knowledge intensive clusters with over 1,500 high tech companies employing around 43,000 people. • The county’s economic output was valued at £19.2bn in 2013, making us an important net contributor to the Treasury. • The fastest growing economy of any LEP area since the recession, with economic growth of over 20% GVA between 2009 and 2014 - more than double the growth rate of core city LEP areas such as Greater Manchester or the Leeds City Region, and higher than Greater London. 20 OXFORDSHIRE GROWTH
  • 21.
    Devolution “Process” • Nevera defined process – evolved • Started in earnest mid-2015 • First Submission considered – further dialogue • Meet with Minister and MPs • Revised Submission January 2016… • Two Main Threads – health and infrastructure
  • 22.
    Oxfordshire Devolution Proposal: Infrastructure •Infrastructure investment programme to support growth; • Integrated approach to strategic planning for infrastructure, housing and employment through a Combined Authority; • Partnership with HCA to develop a housing investment strategy and consolidated funding allocation; • Development of a Land and Property Partnership Board; • Development of Housing Development Companies; • Locally set planning fees to support the significant growth.
  • 23.
    Deliver: • By 2031,over £6bn will have been invested in infrastructure including rail, road and public transport networks • By 2031: – 85,600 jobs will have been created – The jobs from 2015 – 2031 will have generated £11.8bn of GVA and a gross increase of £4.1bn of GVA each year from 2031 onwards – Construction activity will have generated a boost to GVA of £15.5bn and support 326,000 FTE Temporary construction job years (21,000 construction jobs for 15 years) • By 2020: – Construction job activity will generate a one off boost to GVA of £5.4bn – 21,000 Construction jobs will have been supported each year on average – There will be an increase of 30,000 full time jobs – An annual GVA increase of £1.5bn (that will continue each year after 2020). Oxfordshire Devolution Proposal: Infrastructure
  • 26.
    Where Are WeNow? • Many of the second round devolution bids have fallen away • Criteria for success changed • SoS powers – where will that take us? • Emphasis on elected mayor, reorganisation • D-Evolution
  • 27.
    Strategic Planning: TheWay Forward • Wait…may be a further conversation • Complete Oxford Unmet Need Work • Local Plans updated and adopted • SEP Refresh to Inform LGF • Get on with what we offered – OxSIS – Health Integration • Sub-National Transport Bodies - EEH
  • 28.
  • 29.
    Peter Brett AssociatesLLP Strategic investment plans: what they are, aren’t, and how they can really work
  • 30.
    Peter Brett AssociatesLLP What are “area-wide strategic investment plans”? About plans which co-ordinate land use and infrastructure investment which cross boundaries 1) Emerging Combined Authorities Investment / Growth Plans • Frantic devolution deals 2015: Treasury only really interested in • A) Elected mayor as focus of responsibility • B) Strategic planning powers for investment • Different results in different places: Manchester, Sheffield, NE, Liverpool Mayor taking on strategic planning powers; • Tees Valley, West Midlands CA – Mayors have smaller (stated) role 2) Emerging Regional Partnership Investment Plans / Strategies • (eg Northern Gateway HS2 - Stoke, Crewe, Cheshire) 3) Local authority cross-border investment plans • eg some London Opportunity Area DIFS, County documents
  • 31.
    Peter Brett AssociatesLLP Saving money through joint commissioning • Scale economies exist through joint commissioning • But not the real benefit? • Benefits are in • quality of output arising from looking at wider spatial scale • greater ability to lever meaningful infrastructure investment able to trigger private investment
  • 32.
    Peter Brett AssociatesLLP Strategic investment plans are not about this
  • 33.
    Peter Brett AssociatesLLP They’re about this: innovation and information flows
  • 34.
    Peter Brett AssociatesLLP Strategic investment plans are not about this
  • 35.
    Peter Brett AssociatesLLP They’re about this: improving underlying economic geographies
  • 36.
    Peter Brett AssociatesLLP Strategic investment plans are not about this (not really) The old starting point
  • 37.
    Peter Brett AssociatesLLP They’re about this: stimulating private sector investment
  • 38.
    Peter Brett AssociatesLLP They’re about this: stimulating private sector investment • Your challenge: • To set up investible propositions that will get delivered • Through de-risking investment • Making intelligent use of any capital spend available
  • 39.
    Peter Brett AssociatesLLP Information de-risks investment: quality
  • 40.
    Peter Brett AssociatesLLP Information de-risks investment: neighbours
  • 41.
    Peter Brett AssociatesLLP Information de-risks investment: S106/CIL (land price)
  • 42.
    Peter Brett AssociatesLLP Information de-risks investment: co-ordination
  • 43.
    Peter Brett AssociatesLLP Example: West Midlands – contaminated sites, lack of viability, fractured plans?
  • 44.
    Peter Brett AssociatesLLP Integrating infrastructure and focused site delivery to accelerate investment
  • 45.
    Peter Brett AssociatesLLP Towards “Opportunity Areas” supported by infrastructure provision to focus investment
  • 46.
    Peter Brett AssociatesLLP Telling the delivery and implementation story Total cost share Top-ten project costs Transport 70% Education 18% Parks, open space & public realm, leisure/ sports 7% Community & Cultural facilities 2% Emergency Services 1% Other 2% -£1412.9m -£368.6m £0.0m -£136.8m -£46.9m -£10.2m -£7.7m £0.0m -£8.0m -£4.0m -£3.8m -£7.7m -£5.1m -£5.3m -£1600.0m -£1400.0m -£1200.0m -£1000.0m -£800.0m -£600.0m -£400.0m -£200.0m £0.0m Balance between costs and main funding Infrastructure costs by strategic site -£998.7m -£314.6m -£114.2m -£35.0m -£5.0m -£5.6m -£1.7m -£5.0m -£5.3m -£1.1m -£4.0m -£3.8m £0.0m £0.0m £0.0m £0.0m £0.0m £0.0m £0.0m £0.0m -£2000.0m -£1500.0m -£1000.0m -£500.0m £0.0m £500.0m £1000.0m Total Cost Estimated Mainstream Funding Funding Gap (excluding developer contributions) Strategic site 1, 2, 3 etc -£15,000,000 -£10,000,000 -£5,000,000 £- £5,000,000 £10,000,000 2012 2013 2014 2015 2016 2017-21 2022-31 Total 2 weeks commencing 15-Feb 22-Feb 29-Feb 07-Mar 14-Mar 21-Mar 28-Mar 04-Apr 11-Apr 18-Apr 25-Apr 02-May 09-May 16-May 23-May Stage 0 Inception Easter float 0A Pre-inception familiarisation Easter float 0B Inception meeting with steering group Easter float 0C Walking audit with your team Easter float 0D Team-building dinner Easter float 0E Workshop (brief 2) Easter float Stage 1 understanding the tow n centres Easter float 1A Future strategy Easter float 1B Economics Easter float 1C Demographics Easter float 1D Movement and connections Easter float 1E Viability and land ownerships Easter float 1F Retail Easter float 1G Leisure Easter float 1H Flood Easter float 1J Utilities Easter float **1K Understanding the other centres (brief 1B) Easter float Stage 2 Focusing the study on vision and objectives Easter float 2A the draft strategic framework Easter float 2B Charrette workshop (plus progress meeting) Easter float Stage 3 design stage Easter float 3A Strategic spatial masterplan Easter float **3B Other centres: concept masterplans Easter float Stage 4 investment& implementation plan Easter float 4A Investment strategy/implementation Easter float Stage 5 report finalisation Easter float 5A Draft report production Easter float 5B Final comments Easter float Easter float
  • 47.
    Peter Brett AssociatesLLP Focusing your firepower to get investment moving Infrastructure planning Land use planning Finance and funding Governance & delivery Opportunity Areas Other infrastructure investments
  • 48.
    Peter Brett AssociatesLLP Getting from LEP/Combined Authority Strategic Economic Plans to implementation • Problem: like LEP plans, SEPs frequently boosterist - big job claims • Needed to get Government’s attention at the time • But disconnected from the (statutory plan) means of delivering the targets • Plans don’t match the targets • And possible unintended consequences? • Jobs claims not backed by housing land supply for workers • The SEPs risk wrecking the local plans • Eg Oxfordshire and Cheshire • Land use planning is quasi-judicial process: keep separate • the economic aspirations in the model • Numbers in land use plan
  • 49.
    Peter Brett AssociatesLLP Understanding the gap, and plugging it • If there is a gap between the SEP and the total homes and jobs number • You need to understand it and quantify it • You need to know shortfall in homes and jobs • And find schemes to plug it? • Challenging local authorities to grow is part of the SEP’s role • How do you do that?
  • 50.
    Peter Brett AssociatesLLP Challenging local authorities to grow • Planning has become a system of legal compliance • Forget all that for a day or two • Give yourselves permission to think more fluidly • The grand example: Birmingham’s 1989 Highbury Initiative • More micro examples: Northern Gateway Workshop • Some possible success factors? • Talk to each other!
  • 51.
    Peter Brett AssociatesLLP Success factor: a willingness to think creatively, heretically about existing plans. Instead, think markets and viability
  • 52.
    Peter Brett AssociatesLLP Success factor: Chatham House Rules?
  • 53.
    Peter Brett AssociatesLLP Success factor: a willingness to return to the old classics?
  • 54.
    Peter Brett AssociatesLLP Success factor: don’t talk your silo. Think like a disinterested alien?
  • 55.
    Peter Brett AssociatesLLP Success factor: pulling the high falutin’ back to plausible, practical local context?
  • 56.
    Peter Brett AssociatesLLP Talk to investors as soon as you have ideas: road test concepts with them. You might be surprised • Eg Birmingham Vision for Movements • City Council and investors met informally • Found common ground • Created Vision for Movement • Helped precipitate public realm and major metro projects
  • 57.
    Peter Brett AssociatesLLP Getting real about investment actualises creativity Acknowledgements to Farrells
  • 58.
    Peter Brett AssociatesLLP Strategic investment plans: what they are, aren’t, and how they can really work
  • 59.
  • 60.
    Where can Iget some help? Andrew Pritchard PAS Principal Consultant
  • 61.

Editor's Notes

  • #3 2
  • #20 This represents the totality of growth from 100k houses, to 85k jobs – delivers massive GVA and private sector investment
  • #25 Developing a strategic approach to infrastructure planning and delivery Major infrastructure delivered by authorities but expanding to include wider schools delivery, utilities and public services
  • #33 These This bloke is doing something unspeakable to Birmingham He thought he could put his head under a towel and come up with the answer He can’t Modern economies are too complex and fast moving
  • #36 the project they need, not the project we want to do
  • #58 doesn’t make you a breadhead