Download as PDF, PPTX
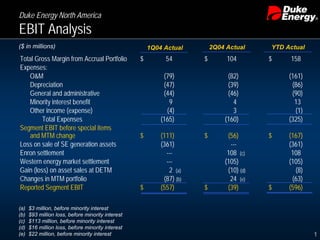
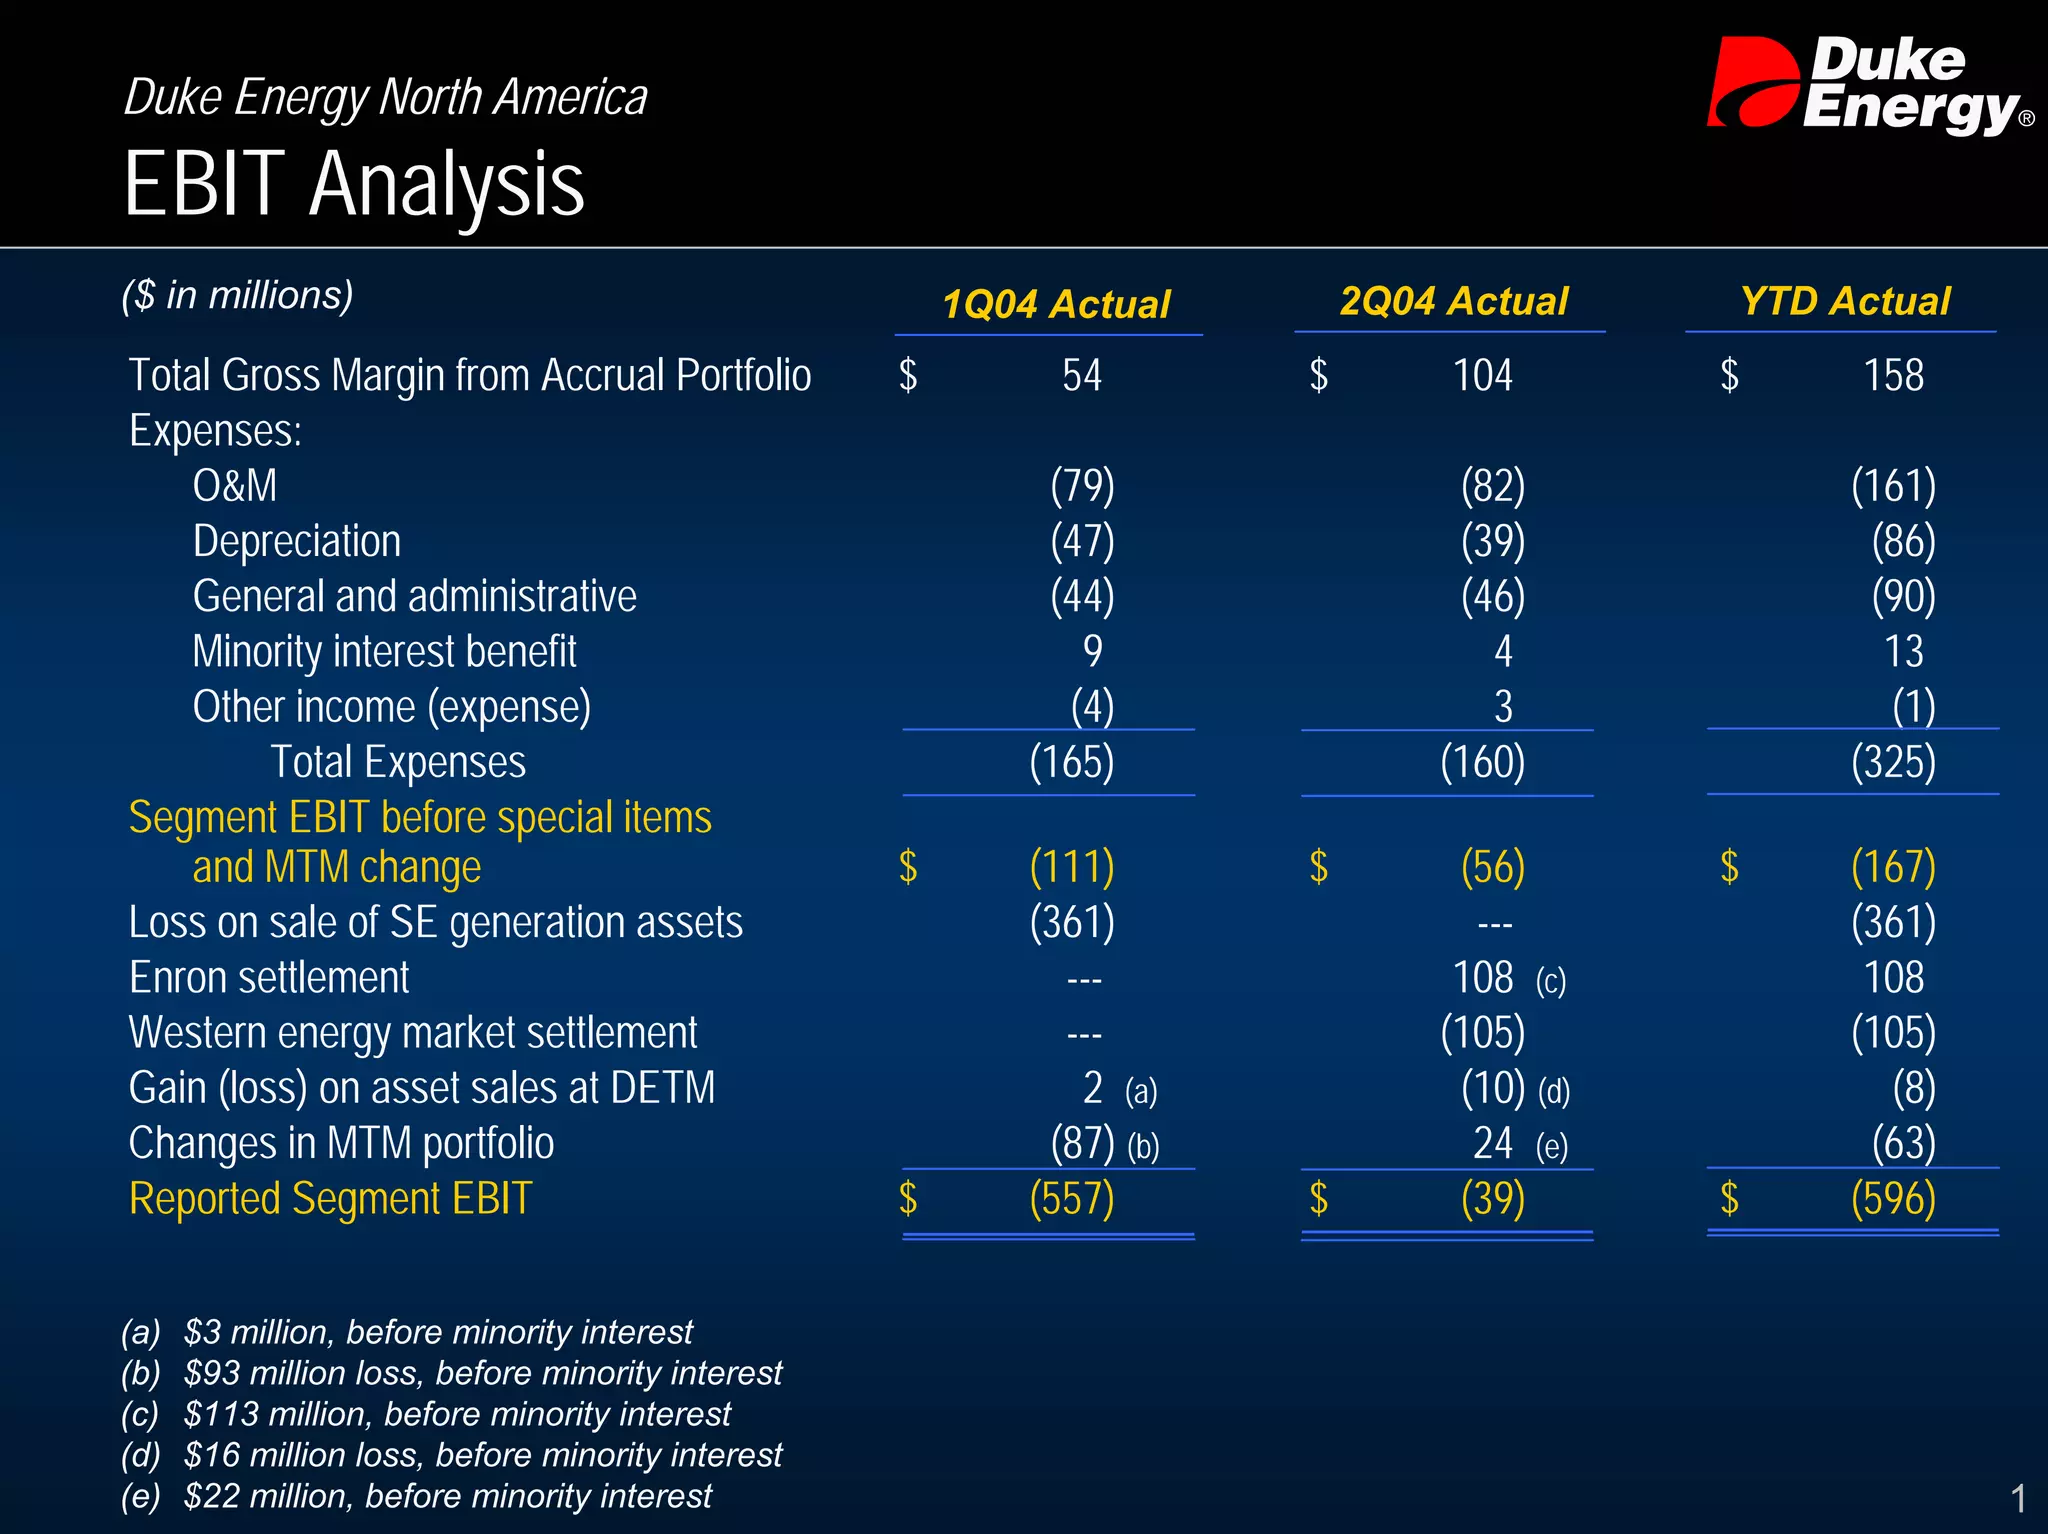
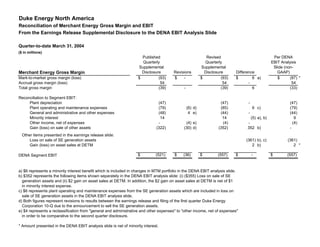
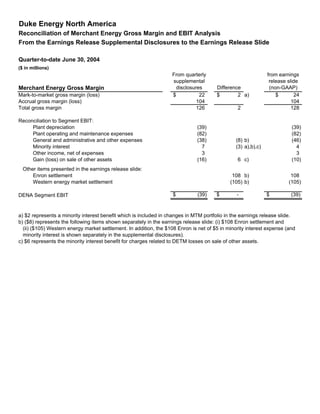
- Total expenses for Duke Energy North America were $325 million for the first half of 2004, driven by operations and maintenance costs of $161 million and depreciation of $86 million. - Reported segment EBIT was negative $596 million due to special items including a $361 million loss on the sale of southeast generation assets and $105 million settlement related to the western energy market. - Reconciliations between quarterly reports and additional financial disclosures show reclassifications between various expense categories but no changes to the overall EBIT amounts.


