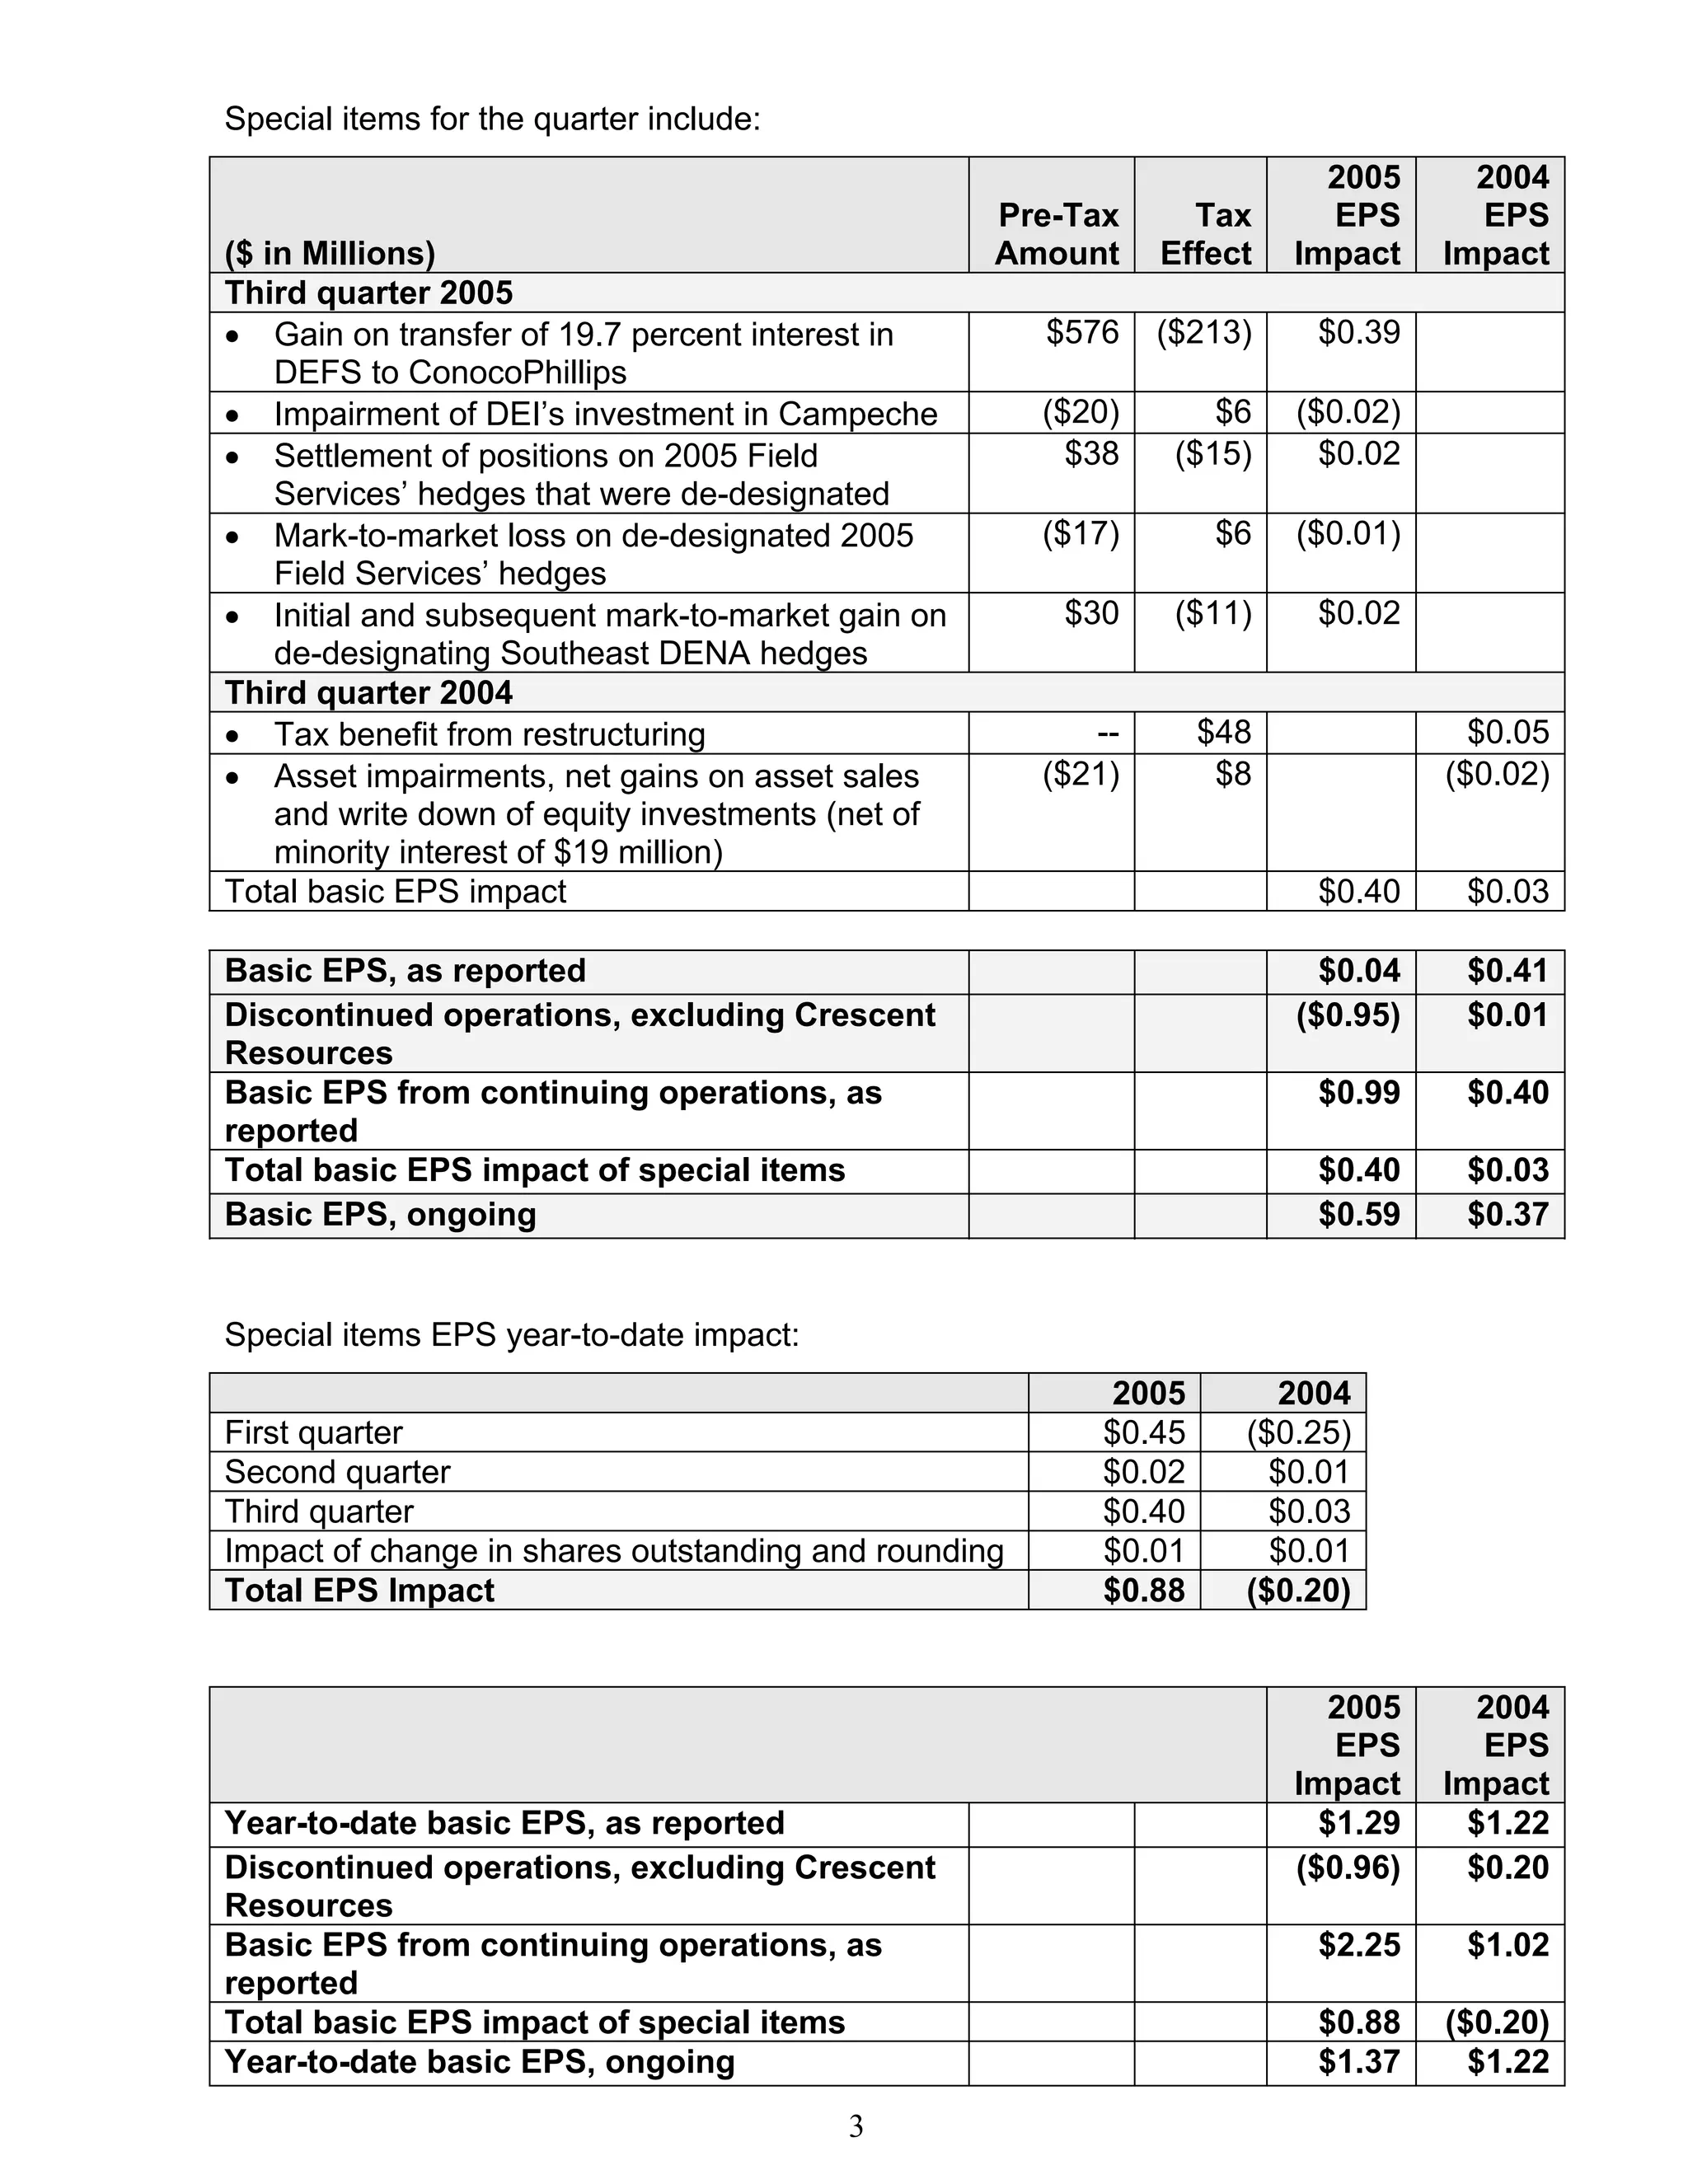
Duke Energy reported third quarter 2005 earnings per share of $0.04 compared to $0.41 in the third quarter of 2004. Ongoing earnings per share, which excludes special items, were $0.59 compared to $0.37 in the prior year. Results were boosted by warmer weather and strong performance in gas and electric businesses, but hurt by charges from exiting the DENA business. Duke Energy remains confident in exceeding its $1.65 per share employee incentive target for the year.
Duke Energy reported second quarter 2005 earnings per share of $0.33, down from $0.46 in the second quarter of 2004. Mild weather led to lower sales for the Franchised Electric and DENA segments. Field Services and International posted strong results. Despite weather impacts, Duke Energy expects to meet its 2005 EPS target of $1.60 per share due to anticipated stronger performance in the second half of the year.
Duke Energy reported higher earnings per share in the first quarter of 2005 compared to the previous year. Earnings per share were $0.91 versus $0.34 in 2004, driven by gains from the sale of assets in the Field Services business and improved performance across most business units. Interest expense was lower due to debt reduction efforts. Duke Energy will hold an earnings call to discuss the results and outlook further.
- Duke Energy reported higher earnings per share in 2004 compared to a loss in 2003, exceeding its debt reduction and asset sale targets for the year.
- The Natural Gas Transmission and Field Services businesses produced record results in 2004.
- Duke Energy expects higher earnings in 2005 driven by increased earnings from Field Services, lower losses from Duke Energy North America, and lower interest expenses due to debt reduction.
Duke Energy reported higher third quarter 2004 earnings compared to third quarter 2003. Earnings per share increased to $0.41 per share from $0.05 per share in the prior year. Excluding special items, ongoing earnings per share were $0.38 compared to $0.35 in 2003. All business units are positioned to meet or exceed 2004 financial goals. Debt reduction for the year will exceed the $4 billion target, including $840 million retired through Australian asset sales.
Duke Energy reported first quarter 2006 results, with ongoing diluted EPS of 48 cents, up from 43 cents in the prior year. Reported diluted EPS was 37 cents compared to 88 cents last year. Results improved at Franchised Electric, Natural Gas Transmission, and International Energy segments due to factors like customer growth, currency impacts, and improved prices and volumes. Duke Energy is on track to achieve its 2006 target of $1.90 in ongoing diluted EPS and remains comfortable after merging with Cinergy that it can achieve this target for the combined company.
Duke Energy reported third quarter 2006 results, with ongoing diluted EPS of 48 cents, down from 56 cents in the prior year's quarter. Reported diluted EPS was 60 cents, up from 4 cents in 2005. The company remains on track to meet its 2006 ongoing EPS target after adjusting for the sale of its Commercial Marketing and Trading business. During the quarter, Duke Energy created a joint venture for its Crescent Resources business, yielding $1.4 billion in after-tax cash proceeds. Business unit results were mixed compared to the prior year, with the Franchised Electric & Gas unit up but other units such as Natural Gas Transmission down due to various factors including costs and weather.
- U.S. Bancorp reported record net income of $1.008 billion for Q1 2004, up 14% from Q1 2003.
- Net interest income was relatively flat at $1.779 billion compared to Q1 2003. Noninterest income declined 3.5% to $1.318 billion.
- Provision for credit losses declined 29.9% to $235 million, reflecting an improving credit quality profile.
The document provides financial information on special items that impacted earnings per share (EPS) for Duke Energy in the second quarter of 2004 and 2003, as well as the first quarter of 2004 and 2003. Some of the notable special items include an $130 million pre-tax Enron settlement that increased EPS by $0.09 in Q2 2004, and $229 million pre-tax gains on asset sales that increased EPS by $0.16 in Q2 2003. For the first half of 2004, special items have resulted in a $0.04 increase in EPS compared to a $0.01 decrease for the first half of 2003.
Duke Energy reported higher ongoing diluted EPS of $0.43 per share compared to $0.32 in the prior year's quarter. Revenues were lower at $4.04 billion compared to $5.27 billion due to the deconsolidation of DEFS, but this was partially offset by the addition of Cinergy's operations. Strong performances from Gas Transmission, Field Services and Crescent helped deliver solid results, and the company remains on track to achieve its 2006 EPS target.
Major brands in the Consumer Foods segment that posted sales growth included Egg Beaters, Healthy Choice, and Slim Jim. Brands that posted sales declines included ACT II and Blue Bonnet. Total depreciation and amortization from continuing operations was $88 million for the quarter and $177 million year-to-date. Capital expenditures were $66 million for the quarter and $111 million year-to-date. Net interest expense was $52 million for the quarter and $110 million year-to-date.
This document summarizes Duke Energy's financial results for the fourth quarter and full year 2006. Some key points:
- 2006 ongoing EPS was $1.81, up from $1.73 in 2005, due to contributions from the Cinergy merger and tax benefits, offset by new shares issued.
- 4Q 2006 ongoing EPS was flat at $0.43 compared to 4Q 2005. Gains were offset by impacts of selling 50% of Crescent and lower Crescent earnings.
- Franchised Electric & Gas and Natural Gas Transmission saw higher earnings due to the Cinergy merger and tax benefits. Field Services, Commercial Power, and International Energy saw lower earnings.
-
The Walt Disney Company reported sharply higher earnings for the first quarter of fiscal year 2004, ended December 31, 2003. Earnings per share increased to $0.33 from $0.05 in the prior year quarter, driven by growth across all business segments. Revenues increased 19% to $8.5 billion due to strong performance of home entertainment releases from Studios and higher affiliate fees and advertising at Media Networks. The company expects continued earnings growth of over 30% for fiscal year 2004.
1) In Q4 2007, the company repurchased 4.8 million shares for $222 million, and a total of 12.4 million shares in 2007 for $591 million. They also repurchased an additional 1 million shares in early 2008 for $40 million.
2) In Q4 2007, the company completed two acquisitions for a total of $97.1 million and seven acquisitions in 2007 for a total of $273.6 million. They also finalized the sale of six businesses in 2007 resulting in an after-tax loss of $17.1 million.
3) Organic revenue growth was 2.3% for 2007, with acquisitions contributing 9.7
Spectra Energy reported a 56% increase in first quarter 2008 net income compared to first quarter 2007. The company announced a $600 million share repurchase program and a proposed $0.02 per share quarterly dividend increase. All business segments performed strongly in the quarter with higher earnings driven by factors such as higher commodity prices and a stronger Canadian dollar.
Anthem, Inc. Reports Record Second Quarter Resultsfinance4
Anthem reported record second quarter results in 2003 with adjusted net income per share increasing 31% compared to the second quarter of 2002. Membership increased 10% over the same period last year and expectations for full year 2003 adjusted net income per share were increased by 10 cents. Operating revenue grew 10% compared to the second quarter of 2002, driven by disciplined pricing and membership gains. The benefit expense ratio improved by 280 basis points due to lower than anticipated medical costs and disciplined pricing.
The document summarizes Duke Energy's first quarter 2006 earnings review presentation. It discusses Duke Energy and Cinergy's first quarter results, including higher ongoing earnings compared to the previous year for most business segments. It also discusses the companies' commitments to investors around growing earnings, achieving full portfolio value, and transparent communication. Key highlights are Duke Energy's continued progress exiting the DENA business and confidence in Cinergy contributing $800 million in ongoing EBIT for the remaining year.
u.s.bancorp 4Q 2005 Earnings Release - pdf versionfinance13
U.S. Bancorp reported record net income of $1,143 million for Q4 2005, an 8.2% increase from Q4 2004. Net income for full year 2005 was $4,489 million, a 7.7% increase over 2004. This growth was driven by increases in noninterest income from fee businesses and valuation of mortgage servicing rights, partially offset by lower net interest margin and higher credit losses. While average earning assets grew 7.1% from a year ago, net interest income declined slightly due to competitive pricing pressure and growth in lower-spread loans. Noninterest expenses declined due to debt restructuring charges in 2004.
This document provides a summary of Time Warner Inc.'s financial results for the full year and fourth quarter of 2008. It reports that revenues grew 1% to $47 billion for the full year, while adjusted operating income before depreciation and amortization rose 1% to $13 billion. However, the company posted an operating loss of $16 billion for the full year due to a $24 billion non-cash impairment charge. For the fourth quarter, revenues declined 3% to $12.3 billion while adjusted operating income fell 8% to $3.2 billion, and the operating loss was $22.2 billion. Segment results are also provided.
Sprint Nextel reported financial results for the first quarter of 2008, with consolidated revenues declining 8% year-over-year to $9.3 billion due to lower contributions from Wireless. Wireless revenues fell 9% to $8 billion as average revenue per user and subscriber numbers declined. Wireline revenues grew 2% to $1.6 billion on strong demand for IP services. The company reported a net loss of $505 million for the quarter and saw post-paid subscriber losses of over 1 million. Sprint focused on improving the customer experience and reducing costs, while making progress on wireless integration goals.
first energy 4Q 06 Consolidated Report to the Financial_Communityfinance21
This document is Consolidated Energy's quarterly report for Q4 2006. It provides an analysis of changes in EPS from Q4 2005 to Q4 2006. Normalized non-GAAP EPS increased from $0.77 to $0.84 primarily due to regulatory changes in Ohio that increased earnings. However, lower distribution deliveries and generation revenues, along with higher fuel and purchase power costs reduced earnings. Guidance for 2007 normalized non-GAAP EPS is $4.05 to $4.25.
Progress Energy reported quarterly ongoing earnings of $0.63 per share and GAAP net loss of $0.01 per share for Q2 2005. Key highlights included milder weather negatively impacting earnings, writing off unrecoverable 2004 storm costs, and one less planned nuclear outage. Year-to-date ongoing earnings were $1.14 per share and GAAP earnings were $0.37 per share. Progress Energy reaffirmed its 2005 ongoing earnings guidance of $2.90-$3.20 per share.
Goodrich Corporation announced its second quarter 2004 results, reporting a net income of $39 million compared to $14 million in the second quarter of 2003. Sales increased to $1,134 million from $1,095 million. Goodrich also increased its full year 2004 outlook, expecting sales between $4.7-4.75 billion and fully diluted earnings per share between $1.30-1.40. The increased outlook was due to improving conditions in commercial aerospace aftermarket and military and space markets.
Danaher Corporation announced record results for the second quarter and first half of 2005. Net earnings for the second quarter increased 25.5% compared to 2004, and sales increased 19%. For the first six months, net earnings increased 27.5% and sales increased 19%. The company's president stated that growth from existing businesses accounted for 5.5% sales growth in the quarter and that the company saw broad-based strength across its businesses.
Bank of America reported fourth quarter 2006 results. Key highlights include:
- Net income of $5.26 billion, up 34% from fourth quarter 2005. Excluding merger charges, net income was $5.41 billion, up 37%.
- Global Consumer & Small Business Banking earnings grew 8% over fourth quarter 2005 to $10.63 billion in revenue, driven by increases in net interest income and noninterest income.
- Credit quality remained stable, with the provision for credit losses down 7% from fourth quarter 2005.
- The company achieved earnings growth while completing two large acquisitions, focusing on expense management and maintaining a strong capital position.
first energy 4Q 08 Consolidated Report NEW NEW209finance21
- FirstEnergy reported normalized non-GAAP earnings per share of $1.21 for Q4 2008, up from $0.90 in Q4 2007. Normalized non-GAAP earnings for 2008 were $4.57 per share.
- Key drivers of the increase were lower generation O&M expenses due to fewer outages and emission allowance gains, as well as lower energy delivery and transmission costs from cost control measures. Higher wholesale and retail electricity prices also contributed.
- These increases were partially offset by higher fuel costs due to fuel surcharges and transportation costs, as well as impairment of securities held for nuclear decommissioning trust funds.
- FirstEnergy did not provide 2009 earnings guidance
The document provides the quarterly and annual financial results for a company. Some key highlights include:
- Several consumer brands posted sales growth for the quarter including Banquet, Blue Bonnet, and Chef Boyardee, while others like ACT II and Eckrich saw declines.
- Total depreciation and amortization was around $93 million for the quarter and $352 million for the fiscal year.
- Capital expenditures were around $106 million for the quarter and $352 million for the fiscal year.
- Net interest expense was $80 million for the quarter and $275 million for the fiscal year.
- Corporate expenses were around $95 million for the quarter and $342 million
Duke Energy reported first quarter 2003 earnings per share of $0.48, driven by favorable weather conditions and increased wholesale power sales in its franchised electric business. However, earnings were lowered by $0.25 per share from exiting proprietary trading activities at DENA and adopting new accounting standards. Duke is focused on reducing risks through asset sales, debt reduction, and exiting merchant energy to strengthen performance and meet its 2003 financial goals.
The document is a joint notice of annual meetings and proxy statement for Edison International and Southern California Edison Company to be held on May 15, 2003. Shareholders will vote on the election of directors and other matters. Edison International shareholders will also vote on a shareholder proposal regarding the shareholder rights agreement. Shareholders are encouraged to vote by mail, telephone, or internet in order to have their shares represented at the meetings and reduce costs.
edison international 2003_annual_sce_1166finance21
The document is Southern California Edison Company's 2003 Annual Report. It discusses SCE focusing in 2003 on restoring financial health by completing recovery of power procurement costs from the 2000-2002 energy crisis, rebalancing its capital structure, and achieving an investment grade credit rating. It also outlines SCE's objectives for 2004 of achieving fair regulatory outcomes, developing new resources, and investing in capital projects. The report provides an overview of key issues facing SCE including high planned capital expenditures, new generation needs, and ensuring cost recovery and rate stability.
Duke Energy 10-30-03_Third_Quarter_Earnings_slides_web_(revised)finance21
This document provides a summary of Duke Energy's earnings for the third quarter of 2003. It reports earnings per share of $0.51 excluding special items, compared to $0.35 in the prior year. Key drivers for the quarter included solid results from franchised electric, natural gas transmission, and international energy, but earnings were down due to unfavorable weather, lower results at DENA due to market challenges, and various one-time costs including goodwill impairments and severance costs. For the full year, earnings are expected to be in the range of $1.20 to $1.25 per share excluding special items.
This document provides an overview of Edison International and its subsidiaries for 2006. Edison International is a power generator and distributor with $36 billion in assets as of 2006. It operates through its main subsidiaries: Southern California Edison, an electric utility serving over 13 million customers; Mission Energy Holding Company, an independent power producer with over 9,000 MW of generation capacity; and Edison Capital, which invests in energy and infrastructure projects globally. Key details are provided on the financial performance, operations, and investments of these principal subsidiaries in 2006.
This document contains the prepared remarks and Q&A from Duke Energy Corporation's earnings conference call for Q2 2004.
The key points are:
1) Duke Energy reported earnings per share of $0.46 for Q2 2004, which included $0.04 per share in special items. Ongoing earnings were $0.42 per share.
2) The company's largest business segments - Franchised Electric and Gas Transmission - generated solid earnings and cash flows for the quarter. Field Services also had strong results due to high natural gas liquid prices and operating improvements.
3) Duke Energy reduced its mark-to-market trading position, but results were still affected by changing commodity prices
Duke Energy 02/02/05_prepared_remarks_and_qafinance21
This document provides a summary of Duke Energy Corporation's Q4 2004 earnings conference call. Key points include:
- Duke Energy reported 2004 EPS of $1.59, including special items, and ongoing EPS of $1.38, exceeding its $1.20 target.
- Business units like Field Services and Crescent Resources had strong years. Field Services benefited from higher commodity prices.
- For Q4 2004, Duke Energy reported EPS of $0.38 including special items. Ongoing segment EBIT increased at Franchised Electric and Natural Gas Transmission.
- Guidance for 2005 includes a $150M loss for DENA and $350-500M EBIT for Field Services depending
This document is Edison International's 2002 financial and statistical report. It provides an overview of Edison International and its subsidiaries, including Southern California Edison, Edison Mission Energy, and Edison Capital. It summarizes key financial details such as earnings per share, assets, liabilities, operating revenue, and energy costs for Edison International and its subsidiaries. It also provides brief profiles of each subsidiary, their operations, and assets.
Duke Energy 3Q 03_Reg_G_Recon_rev_103103afinance21
This document provides a reconciliation of earnings per share (EPS) between what was reported and ongoing/before special items for 2003 and 2002. It also reconciles changes in net debt and provides a reconciliation between earnings before interest and taxes (EBIT) and net income for the third quarter of 2003. Special items that impacted EPS included write-offs, settlements, and asset sale gains/losses. Net debt was reduced by $1.7 billion primarily through debt redemptions exceeding new issuances and an increase in cash. The EBIT to net income reconciliation shows the components used to derive net income from the starting point of EBIT.
This document summarizes Duke Energy's and Cinergy's first quarter 2006 earnings conference call. David Hauser, Duke Energy's CFO, discussed the financial results of both companies. For Duke Energy, earnings per share were $0.48, up from the prior year. Segment EBIT increased across most business units due to factors like customer and volume growth. For Cinergy, ongoing earnings per share were $0.62, up slightly from the prior year, while reported earnings were $0.39 due to merger costs. Hauser provided an overview of key financial metrics and outlook for both companies.
This document provides reconciliations between Duke Energy Corporation's ongoing (non-GAAP) earnings per share and reported (GAAP) earnings per share for the second quarter of 2005 and year-to-date 2005. It identifies special items excluded from ongoing EPS, including mark-to-market changes on hedges and gains/losses from sales of assets, and reconciles their impact. Segment earnings before interest and taxes are also reconciled from ongoing to reported figures.
Duke Energy reported third quarter earnings per share of $0.41, which included $0.03 from special items primarily related to additional tax benefits from asset sales. Ongoing earnings were $0.38 per share. Key business segments like Franchised Electric and Natural Gas Transmission reported solid results. Field Services benefited from strong natural gas liquid prices. Duke Energy North America continued working to reduce losses from its merchant energy business. The company has reduced its debt by $2.4 billion year-to-date through asset sales and cash flows. Management expects to meet or exceed its financial goals for 2004 and continues working to improve the company's performance.
The document reviews Duke Energy's 2005 financial results, provides an outlook for 2006 earnings per share of $1.90, and details expected 2006 capital expenditures of $4.325 billion as the company integrates Cinergy operations following their planned merger. Key assumptions for 2006 include normal weather, sales growth, and $140 million in annual merger savings beginning in mid-2006.
Cinergy Corp. reported second quarter 2005 earnings of $51 million, or $0.25 per share, compared to $59 million, or $0.32 per share in the second quarter of 2004. Earnings were negatively impacted by $0.04 per share from mark-to-market losses on hedging contracts and $0.07 per share for merger-related costs. Excluding these impacts, adjusted earnings were $0.36 per share. Cinergy also announced it was lowering its 2005 earnings guidance to $2.50 to $2.65 per share due to weaker-than-expected performance from its commercial gas operations.
The document outlines lessons learned from inclusivity, clear communication, embracing appropriate technology, finding and redistributing surplus resources, sharing power horizontally through committees and consensus, enjoying open space meeting models that allow simultaneous discussions, valuing physical community spaces, and building solidarity, community, and networks based on trust and accountability.
- Revenue for CMC was up 20% year-over-year for the quarter at Rs. 240.84 crore compared to Rs. 201.35 crore in the same quarter last year.
- EBITDA was Rs. 17.14 crore for the quarter, up 103% year-over-year. However, the quarter was impacted by a Rs. 12.58 crore provision for a contract under dispute.
- Profit before tax was Rs. 15.38 crore for the quarter, up 9% year-over-year.
edison international 2001_annual_sce_3186finance21
Southern California Edison Company (SCE) is one of the largest electric utilities in the US, serving central and southern California. SCE earned $2.4 billion in 2001 after incurring losses in 2000 due to deregulation issues. SCE's earnings included a $2.1 billion benefit from establishing regulatory assets to recover past power costs. Operating revenue increased in 2001 due to surcharges and decreased credits for direct access customers, partially offset by lower sales and penalties. SCE continues working to stabilize rates and recover prior power procurement costs.
Duke Energy reported its year-end and fourth quarter 2005 financial results. Key highlights include:
- 2005 ongoing basic EPS of $1.79, up from $1.51 in 2004. Reported basic EPS was $1.94.
- Fourth quarter 2005 ongoing basic EPS of $0.43, up from $0.29 in fourth quarter 2004. Reported basic EPS was $0.65.
- All major business units performed well driven by higher commodity prices and real estate operations. The company exceeded its 2005 earnings target and set a 2006 target of $1.90 per diluted share, a 10% increase.
The document summarizes Duke Energy's financial results for the third quarter of 2005. It reports higher earnings in the company's franchised electric, natural gas transmission, and international energy segments. It also discusses the financial impacts of Duke Energy's decision to exit its North American commercial power business. Finally, it provides expectations for 2005 ongoing earnings per share and 2007 ongoing earnings following the planned merger with Cinergy.
This document provides a summary of FirstEnergy Corp.'s financial results for the third quarter of 2006.
- Normalized non-GAAP earnings were $1.42 per share for Q3 2006, up from $1.04 per share in Q3 2005. GAAP earnings were $1.41 per share for Q3 2006 compared to $1.01 per share in Q3 2005.
- Factors that increased earnings included regulatory changes in Ohio and lower fuel and purchased power costs. Factors that decreased earnings included lower distribution deliveries due to mild weather and lower generation revenues from lower wholesale prices and sales volumes.
- Guidance for 2006 normalized non-GAAP earnings was increased to
first energy 4Q06 Consolidated Report to the Financial_Communityfinance21
- FirstEnergy reported normalized non-GAAP earnings of $0.84 per share for Q4 2006, up from $0.77 per share in Q4 2005. GAAP earnings were $0.85 per share compared to $0.58 per share in Q4 2005.
- Earnings were positively impacted by Ohio regulatory changes which increased earnings by $0.23 per share. However, lower distribution deliveries and generation revenues reduced earnings. Higher fuel and purchased power costs also decreased earnings.
- For full-year 2006, normalized non-GAAP earnings were $3.88 per share, exceeding guidance of $3.75-$3.85 per share. GAAP earnings were $3.
- Goodrich Corporation reported first quarter 2005 results, with sales growth of 10% and net income per share growth of 21% compared to first quarter 2004.
- The company increased its 2005 outlook with expected sales of $5.1-5.2 billion and net income per share of $1.80-$1.95.
- Segment operating income grew 28% in the first quarter due to increases in all market channels and reportable segments.
1) Goodrich Corporation reported first quarter 2005 results with sales growth of 10% and net income per share growth of 21% compared to first quarter 2004.
2) Financial outlook for 2005 was increased with sales expected to be $5.1-5.2 billion and net income per share of $1.80-1.95.
3) Recent developments included higher sales and profits in all business segments, debt reduction of $100 million, and new contracts including providing nacelles for the Airbus A350.
progress energy 2Q 02earnings release Finalfinance25
Progress Energy reported second quarter 2002 earnings per share of $0.56, or $0.83 excluding non-operating items. This was in line with guidance. Key highlights included reaching long-term rate agreements in Florida and North Carolina that stabilize rates through 2005 and 2007 respectively. For 2002, the company expects ongoing earnings between $3.90-$4.00 per share, within previous guidance despite industrial slowdowns impacting some regions.
Duke Energy reported lower earnings in Q1 2004 compared to Q1 2003. Earnings per share were $0.36 compared to $0.25 the prior year. Ongoing earnings per share excluding special items were $0.32 compared to $0.42. Several business units experienced lower earnings including Franchised Electric, Natural Gas Transmission and Duke Energy North America which was impacted by mark-to-market losses. However, Field Services more than doubled its earnings and the company exceeded its asset sales target for the year.
Duke Energy reported strong financial results in the second quarter of 2004. Net income was $432 million, or $0.46 per share, matching the previous year's results. Excluding special items, ongoing earnings per share were $0.42 compared to $0.30 in 2003. Several of Duke Energy's business units performed well, including Duke Energy Field Services and Crescent Resources which both posted significant increases in earnings compared to the previous year. Duke Energy continued progress on meeting financial targets such as debt reduction and asset sales.
- DuPont reported second quarter 2006 earnings of $1.04 per share, up from $1.01 per share in second quarter 2005. Excluding significant items, earnings per share were $1.01, up 12% from $0.90 per share last year.
- Local prices were up 2% while volumes increased 1%, but currency effects reduced sales by 1%, for a total sales increase of 2%.
- The company expects strong earnings growth in the second half of 2006 compared to 2005, and reaffirms its full year 2006 earnings outlook.
This document summarizes Duke Energy's financial performance in the 4th quarter and full year of 2006. Key points include:
- Ongoing diluted EPS for 2006 was $1.81, up from $1.73 in 2005, due to the addition of Cinergy offset by lower results at Crescent and International.
- Commercial Power results declined due to purchase accounting charges related to the Cinergy merger and losses from Midwest gas plants.
- International Energy results decreased because of lower earnings at National Methanol.
- Interest expense increased in 4Q06 primarily due to the Cinergy merger. The effective tax rate also declined due to tax settlements and other factors.
Q4 2008 Earnings Press Release and Financial Tablesfinance7
Motorola reported financial results for the fourth quarter of 2008 with $7.1 billion in sales and a GAAP net loss of $3.6 billion or $1.57 per share. For the full year 2008, Motorola had $30.1 billion in sales and a net loss of $4.2 billion or $1.84 per share. Motorola generated $201 million in positive operating cash flow for the fourth quarter. Motorola also announced cost-reduction actions of $1.5 billion for 2009 in response to economic challenges.
motorola Q4 2008 Earnings Press Release and Financial Tablesfinance7
Motorola reported financial results for the fourth quarter of 2008 with $7.1 billion in sales and a GAAP net loss of $3.6 billion or $1.57 per share. The company implemented cost reduction actions of approximately $1.5 billion for 2009 in response to economic challenges. Mobile Devices sales were $2.35 billion with an operating loss of $595 million, while Home and Networks Mobility operating earnings increased 34% to $257 million on sales of $2.6 billion. The company expects cost savings of more than $1.2 billion from Mobile Devices restructuring in 2009.
Raytheon reported strong financial results for the fourth quarter and full year 2005. Fourth quarter sales increased 9% to $6.2 billion and income from continuing operations grew 15% to $282 million. For the full year, sales rose 8% to $21.9 billion and income from continuing operations increased 115% to $942 million. Raytheon also reduced its net debt by $1.3 billion in 2005 to $3.3 billion, the lowest level in ten years, and generated $2.1 billion in free cash flow from continuing operations for the full year. Looking ahead, Raytheon expects 2006 sales between $23.1-23.6 billion and earnings per share from continuing operations of $
U.S. Bancorp reported record net income for the second quarter of 2005 of $1.121 billion, an 8.1% increase from the second quarter of 2004. Key factors contributing to increased earnings included strong growth in fee-based revenue across most categories, lower credit costs, and reduced tax expenses. However, net interest income declined slightly due to margin compression from tighter credit spreads and changes in asset/liability management. Overall, the results demonstrated continued strong performance and returns, with loan growth, improving credit quality, and investments positioned to further enhance the business.
This document summarizes ConAgra Foods' earnings results for fiscal year 2005 (FY05) in a question and answer format. Some key details include:
- FY05 diluted EPS was $1.23, including $0.12 in expenses that impacted comparability.
- Major brands in the Retail Products segment that saw sales growth included ACT II, Banquet, and Blue Bonnet. Brands that saw declines included Armour and Butterball.
- Retail Products volume increased 2% while Foodservice Products volume decreased 2% in Q4.
- Total depreciation and amortization was approximately $351 million for FY05 and $90 million for Q4. Capital expenditures
The document provides an overview of Goodrich Corporation's financial and operational performance in the first quarter of 2004. Key points include:
- Sales increased 6% to $1.162 billion compared to the same period in 2003.
- Segment operating income increased significantly to $118 million from $19 million due to lower restructuring charges and higher sales.
- New program wins on the 7E7 and A380 are expected to fuel future growth.
- Debt has been reduced by 29% since acquiring Aeronautical Systems in 2002.
- The outlook for 2004 is sales of $4.65-4.7 billion and diluted EPS at the upper end of $1.20-1.35 range.
- Revenue increased 14% to $1.49 billion due to growth across all business segments.
- Earnings per diluted share were $0.98, up 20% from $0.82 in the prior year, driven by improved performance across business segments.
- Fleet Management Solutions saw the largest earnings growth of 20% due to higher used vehicle sales, improved fuel margins, and lower costs.
ConAgra Foods is selling its chicken business to focus on branded and value-added food items. The sale includes chicken processing operations and will generate cash for ConAgra to reinvest. ConAgra will receive Class A shares in Pilgrim's Pride, the chicken company acquiring its business, representing 7% of voting shares and 49% of equity. It can sell up to 1/3 of these shares annually but expects to reduce ownership over time based on market conditions. ConAgra will also receive notes from Pilgrim's Pride due in 2011 with a 10.5% interest rate to be paid semi-annually.
This document summarizes the Q1 FY2004 earnings results of a large packaged foods company. Key points include:
- Q1 EPS was $0.37 compared to $0.43 in Q1 FY2003, impacted by various one-time gains and losses.
- Packaged foods sales were down $168M excluding divested businesses, with a 5% volume decline.
- Several major brands saw growth, while others like Butterball declined.
- Corporate expenses increased due to litigation expenses from a past joint venture.
- The effective tax rate for FY2004 is estimated at 38%.
ConAgra Foods is selling its United Agri Products business to focus on branded and value-added products, as part of a broader strategy of divesting non-core businesses over the past year including fresh beef/pork, canned seafood, and cheese operations. The sale is expected to close by December 31, 2003 for cash and $60-75 million in preferred stock. ConAgra will retain some international UAP operations generating $250 million in annual sales, concentrated in several countries. Proceeds will be used for debt paydown and general corporate purposes including acquisitions and stock buybacks.
ConAgra Foods divested its poultry business to focus on branded, value-added foods with strong margins and growth. The $300 million cash and 25 million Pilgrim's Pride shares valued at $245 million totaled less than the poultry business' estimated $545 million book value due to the shares being valued based on past prices, not current prices. ConAgra Foods can sell up to 1/3 of the shares each year and account for shares eligible for resale within a year as securities, and other shares using cost accounting. The poultry business was previously reported in Meat Processing but is now in Discontinued Operations.
ConAgra Foods completed the divestiture of its chicken processing and crop inputs businesses, finalizing its strategy to focus on branded, value-added food opportunities. The company received $300 million in cash and 25 million shares of Pilgrim's Pride stock worth $245 million for the chicken business. ConAgra can sell up to 1/3 of the Pilgrim's Pride shares per year and will account for the shares as securities held for resale within one year or using the cost method if the eligibility for resale is over one year away. The chicken business was previously reported as part of ConAgra's Meat Processing segment but is now in Discontinued Operations.
ConAgra Foods has divested several commodity businesses and acquired branded and value-added food products to focus on higher margin businesses. The company is planning a share repurchase program using cash from strong operating cash flows and recent divestitures. ConAgra expects to continue investing in growth through acquisitions and paying down debt while deploying cash to dividends, debt repayment, and share repurchases as appropriate.
The document provides a Q&A summary of ConAgra Foods' financial results for Q2 FY04 compared to Q2 FY03. Key points include:
- Q2 FY04 diluted EPS was $0.51 compared to $0.44 in Q2 FY03, impacted by $0.04 in discontinued operations in FY04 and $0.03 in divestiture expenses in FY03.
- Sales comparability was impacted by $506M in divested fresh meat businesses in FY03 and $154M in divested canned food businesses in FY03.
- Examples of brand sales growth included Banquet, Chef Boyardee, Egg Beaters
Packaged Foods sales increased 4% excluding divestitures, with 2% volume growth. Several brands posted sales growth including Armour, Banquet, and Blue Bonnet, while others like ACT II and Butterball declined. Sales comparability was affected by $155 million in divested businesses last year. Operating profit grew 5% in Packaged Foods and 10% overall when adjusting for divested businesses and cost savings initiatives. The company is implementing cost cutting measures expected to save more than implementation costs in the future.
- Major brands in the Retail Products segment that posted sales growth included ACT II, Armour, Banquet, and Blue Bonnet. Brands that posted sales declines included Healthy Choice, Slim Jim, and Snack Pack.
- Retail volume increased 8% while foodservice volume was flat excluding divested businesses.
- Increased input costs negatively impacted operating profits in the Retail Products segment by approximately $45 million.
- Capital expenditures were approximately $105 million, reflecting increased investment in information systems.
This document contains the questions and answers from ConAgra Foods' Q2 FY2005 earnings call. Some key details include:
- Several major brands in the Retail Products segment posted sales growth, while others saw declines.
- Retail volume increased 7% and Foodservice volume decreased 1% excluding divested businesses.
- Capital expenditures increased significantly year-over-year due to investments in information systems.
- The company received proceeds from the sale of its minority interest in Swift Foods and shares of Pilgrim's Pride stock.
This document summarizes the Q3 2005 earnings results of a major food company. Some key highlights include: 1) Major brands in the Retail Products segment saw mixed sales results, with growth for brands like Chef Boyardee but declines for brands like Butterball. 2) Unit volumes declined 3% for Retail Products but increased 4% for Foodservice Products. 3) The packaged meats operations were slightly profitable but profits were over $45 million lower than the previous year. The company expects some improvement but not year-over-year profit gains for packaged meats in Q4.
The document provides the questions and answers from the Q1 FY06 earnings call for ConAgra Foods. Some key details from the summary include:
- Sales grew for major brands like Butterball but declined for brands like ACT II. Retail Products volume declined 3% while Foodservice increased 4%.
- Depreciation and amortization was $89 million. Capital expenditures were $71 million and net interest expense was $68 million. Corporate expense was $73 million.
- Gross margin was 21.6% and operating margin was 10.9%. The effective tax rate for FY06 is estimated to be 36%.
Major brands in the Retail Products segment that posted sales growth included ACT II, Blue Bonnet, Butterball, Kid Cuisine, Marie Callender's, Reddi-wip and Ro*Tel. Brands that posted sales declines included Armour, Banquet, Cook's, DAVID, Eckrich, Egg Beaters, Healthy Choice, Hebrew National, Hunt's, LaChoy, Orville Redenbacher, PAM, Parkay, Peter Pan, Slim Jim, Snack Pack, Swiss Miss, Van Camp's and Wesson. Retail Products volume declined 5% for the quarter while Foodservice Products volume increased 2%. Corporate expense for the quarter was approximately $103 million
The document provides financial information from ConAgra Foods' Q3 FY06 quarterly earnings call. Some key details include:
- Retail segment sales grew 4% and Foodservice grew 1% over the prior year. Several major brands posted sales growth while others declined.
- Gross margin was 24.8% and operating margin was 12.5% for the quarter.
- Net debt was $3.6 billion, down from $4.5 billion a year prior due to debt repayment of $500 million during the quarter.
- Capital expenditures for the quarter and fiscal year-to-date were below prior year levels. Projected fiscal year expenditures are up to $400
- Major brands in the Consumer Foods segment that posted sales growth in Q4 FY06 included Blue Bonnet, Chef Boyardee, DAVID, Egg Beaters, Hebrew National, and Hunt's. Brands that posted sales declines included ACT II, Banquet, Healthy Choice, Peter Pan, Slim Jim, Snack Pack, and Van Camp's.
- Consumer Foods volume declined 2% in Q4 while Food and Ingredients volume increased 1%.
- Total depreciation and amortization for Q4 was approximately $85 million and approximately $353 million for all of FY06. Capital expenditures were approximately $92 million for Q4 and $288 million for FY
This document summarizes the Q1 FY07 financial results of ConAgra Foods. Some key highlights include:
- Consumer Foods volume increased 1% and Food and Ingredients volume increased 2% in Q1.
- Gross margin was 24.7% and operating margin was 11.7% for the quarter.
- Net debt decreased to $2.88 billion from $3.97 billion in Q1 FY06.
- Restructuring charges totaled $39 million pre-tax, impacting costs in Consumer Foods and corporate expenses.
1) Several major brands in the Consumer Foods segment posted sales growth for the quarter, while others like ACT II and Banquet saw declines. Overall, Consumer Foods volume declined 1% excluding divested businesses.
2) Total depreciation and amortization from continuing operations was around $91 million for the quarter and $268 million year-to-date. Capital expenditures were around $147 million for the quarter and $258 million year-to-date.
3) The company's net debt at the end of the quarter was around $3 billion, with a net debt to total capital ratio of 39%.
1) Several major brands in the Consumer Foods segment posted sales growth for the quarter, while others such as ACT II and Knott's Berry Farm saw declines.
2) Consumer Foods volume was flat excluding divested businesses, while Food and Ingredients volume increased 3%.
3) Capital expenditures increased significantly both for the quarter and full fiscal year compared to the previous year.
Major brands in the Consumer Foods segment that posted sales growth for Q1 FY08 included Banquet, Blue Bonnet, Chef Boyardee, DAVID, Egg Beaters, Healthy Choice, Hebrew National, Hunt's, Kid Cuisine, Libby's, Marie Callender's, Manwich, Orville Redenbacher's, Reddi-wip, Rosarita, Ro*Tel, Snack Pack, Van Camp's, and Wesson. Brands that posted sales declines included ACT II, Crunch N Munch, Knott's Berry Farm, PAM, Parkay, Slim Jim, and Swiss Miss. Consumer Foods volume increased 3% excluding divested
The document summarizes Conagra Foods' Q2 FY08 earnings results. Major brands in the Consumer Foods segment that posted sales growth included Blue Bonnet, Chef Boyardee, and Egg Beaters. Brands that posted sales declines included ACT II, Knott's Berry Farm, and Orville Redenbacher's. Consumer Foods volume decreased 1% but excluding items increased 3%, while Food and Ingredients volume was flat. Depreciation and amortization was $77 million, capital expenditures were $111 million, and net interest expense was $64 million. The company's net debt ratio increased to 43% from 37% a year ago.
Confirmation of Payee (CoP) is a vital security measure adopted by financial institutions and payment service providers. Its core purpose is to confirm that the recipient’s name matches the information provided by the sender during a banking transaction, ensuring that funds are transferred to the correct payment account.
Confirmation of Payee was built to tackle the increasing numbers of APP Fraud and in the landscape of UK banking, the spectre of APP fraud looms large. In 2022, over £1.2 billion was stolen by fraudsters through authorised and unauthorised fraud, equivalent to more than £2,300 every minute. This statistic emphasises the urgent need for robust security measures like CoP. While over £1.2 billion was stolen through fraud in 2022, there was an eight per cent reduction compared to 2021 which highlights the positive outcomes obtained from the implementation of Confirmation of Payee. The number of fraud cases across the UK also decreased by four per cent to nearly three million cases during the same period; latest statistics from UK Finance.
In essence, Confirmation of Payee plays a pivotal role in digital banking, guaranteeing the flawless execution of banking transactions. It stands as a guardian against fraud and misallocation, demonstrating the commitment of financial institutions to safeguard their clients’ assets. The next time you engage in a banking transaction, remember the invaluable role of CoP in ensuring the security of your financial interests.
For more details, you can visit https://technoxander.com.
The Rise and Fall of Ponzi Schemes in America.pptxDiana Rose
Ponzi schemes, a notorious form of financial fraud, have plagued America’s investment landscape for decades. Named after Charles Ponzi, who orchestrated one of the most infamous schemes in the early 20th century, these fraudulent operations promise high returns with little or no risk, only to collapse and leave investors with significant losses. This article explores the nature of Ponzi schemes, notable cases in American history, their impact on victims, and measures to prevent falling prey to such scams.
Understanding Ponzi Schemes
A Ponzi scheme is an investment scam where returns are paid to earlier investors using the capital from newer investors, rather than from legitimate profit earned. The scheme relies on a constant influx of new investments to continue paying the promised returns. Eventually, when the flow of new money slows down or stops, the scheme collapses, leaving the majority of investors with substantial financial losses.
Historical Context: Charles Ponzi and His Legacy
Charles Ponzi is the namesake of this deceptive practice. In the 1920s, Ponzi promised investors in Boston a 50% return within 45 days or 100% return in 90 days through arbitrage of international reply coupons. Initially, he paid returns as promised, not from profits, but from the investments of new participants. When his scheme unraveled, it resulted in losses exceeding $20 million (equivalent to about $270 million today).
Notable American Ponzi Schemes
1. Bernie Madoff: Perhaps the most notorious Ponzi scheme in recent history, Bernie Madoff’s fraud involved $65 billion. Madoff, a well-respected figure in the financial industry, promised steady, high returns through a secretive investment strategy. His scheme lasted for decades before collapsing in 2008, devastating thousands of investors, including individuals, charities, and institutional clients.
2. Allen Stanford: Through his company, Stanford Financial Group, Allen Stanford orchestrated a $7 billion Ponzi scheme, luring investors with fraudulent certificates of deposit issued by his offshore bank. Stanford promised high returns and lavish lifestyle benefits to his investors, which ultimately led to a 110-year prison sentence for the financier in 2012.
3. Tom Petters: In a scheme that lasted more than a decade, Tom Petters ran a $3.65 billion Ponzi scheme, using his company, Petters Group Worldwide. He claimed to buy and sell consumer electronics, but in reality, he used new investments to pay off old debts and fund his extravagant lifestyle. Petters was convicted in 2009 and sentenced to 50 years in prison.
4. Eric Dalius and Saivian: Eric Dalius, a prominent figure behind Saivian, a cashback program promising high returns, is under scrutiny for allegedly orchestrating a Ponzi scheme. Saivian enticed investors with promises of up to 20% cash back on everyday purchases. However, investigations suggest that the returns were paid using new investments rather than legitimate profits. The collapse of Saivian l
“Amidst Tempered Optimism” Main economic trends in May 2024 based on the results of the New Monthly Enterprises Survey, #NRES
On 12 June 2024 the Institute for Economic Research and Policy Consulting (IER) held an online event “Economic Trends from a Business Perspective (May 2024)”.
During the event, the results of the 25-th monthly survey of business executives “Ukrainian Business during the war”, which was conducted in May 2024, were presented.
The field stage of the 25-th wave lasted from May 20 to May 31, 2024. In May, 532 companies were surveyed.
The enterprise managers compared the work results in May 2024 with April, assessed the indicators at the time of the survey (May 2024), and gave forecasts for the next two, three, or six months, depending on the question. In certain issues (where indicated), the work results were compared with the pre-war period (before February 24, 2022).
✅ More survey results in the presentation.
✅ Video presentation: https://youtu.be/4ZvsSKd1MzE
Monthly Market Risk Update: June 2024 [SlideShare]Commonwealth
Markets rallied in May, with all three major U.S. equity indices up for the month, said Sam Millette, director of fixed income, in his latest Market Risk Update.
For more market updates, subscribe to The Independent Market Observer at https://blog.commonwealth.com/independent-market-observer.
In World Expo 2010 Shanghai – the most visited Expo in the World History
https://www.britannica.com/event/Expo-Shanghai-2010
China’s official organizer of the Expo, CCPIT (China Council for the Promotion of International Trade https://en.ccpit.org/) has chosen Dr. Alyce Su as the Cover Person with Cover Story, in the Expo’s official magazine distributed throughout the Expo, showcasing China’s New Generation of Leaders to the World.
Madhya Pradesh, the "Heart of India," boasts a rich tapestry of culture and heritage, from ancient dynasties to modern developments. Explore its land records, historical landmarks, and vibrant traditions. From agricultural expanses to urban growth, Madhya Pradesh offers a unique blend of the ancient and modern.
1. Nov. 2, 2005 MEDIA CONTACT: Randy Wheeless
Phone: 704/382-8379
24-Hour: 704/382-8333
ANALYST CONTACT: Julie Dill
Phone: 980/373-4332
Investor Relations: 800/488-3853
Duke Energy Reports Third Quarter 2005 Results
• Third quarter ongoing basic earnings per share of 59 cents versus
37 cents in prior year’s quarter
• Reported basic earnings per share, which reflect charges associated
with the decision to exit DENA, of 4 cents in third quarter 2005 versus
41 cents in previous year
• Company confident of exceeding $1.65 employee incentive target –
based on annual ongoing basic EPS
• Weather, commodity prices and real estate operations help ongoing
results
CHARLOTTE, N.C. – Duke Energy today reported third quarter 2005 basic
earnings per share (EPS) of $0.04, or $41 million in net income, compared to $0.41
per share in third quarter 2004, or $389 million in net income. This quarter’s results
include charges related to the previously announced plan to exit substantially all of
Duke Energy North America’s (DENA) business outside of the Midwest, which
totaled $0.84 per share. This amount was partially offset by a gain on the transfer of
a 19.7 percent interest of Duke Energy Field Services to ConocoPhillips, which
totaled $0.39 per share.
Third quarter 2005 basic EPS from continuing operations was $0.99, or $924 million
in income, compared to $0.40 per share in third quarter 2004, or $381 million in
income. On a diluted basis, third quarter 2005 EPS from continuing operations was
$0.96 per share, compared to $0.39 in the third quarter 2004.
2. Ongoing basic EPS for third quarter 2005 was $0.59 versus $0.37 in third quarter
2004. On a diluted basis, ongoing EPS for third quarter 2005 was $0.56 compared to
$0.36 in third quarter 2004.
“The quality of our assets, along with the focused efforts of our employees, delivered
outstanding results despite the external events affecting the energy industry. Not only
did we perform for our customers during this period of supply disruptions, we delivered
solid results for our investors,” said Paul Anderson, Duke Energy’s chairman of the
board and chief executive officer.
“Our strategic decision to exit much of our merchant generation business in DENA
had a large earnings impact this quarter. But that move, along with our proposed
merger with Cinergy, will position us for stronger long-term results going forward,” he
added.
Anderson said the company expects to exceed its employee incentive goal of $1.65
per share – based on annual ongoing basic earnings. That figure was recently revised
upward from $1.60 to reflect the exit of the DENA business.
2
3. Special items for the quarter include:
2005 2004
Pre-Tax Tax EPS EPS
($ in Millions) Amount Effect Impact Impact
Third quarter 2005
• Gain on transfer of 19.7 percent interest in $576 ($213) $0.39
DEFS to ConocoPhillips
• Impairment of DEI’s investment in Campeche ($20) $6 ($0.02)
• Settlement of positions on 2005 Field $38 ($15) $0.02
Services’ hedges that were de-designated
• Mark-to-market loss on de-designated 2005 ($17) $6 ($0.01)
Field Services’ hedges
• Initial and subsequent mark-to-market gain on $30 ($11) $0.02
de-designating Southeast DENA hedges
Third quarter 2004
• Tax benefit from restructuring -- $48 $0.05
• Asset impairments, net gains on asset sales ($21) $8 ($0.02)
and write down of equity investments (net of
minority interest of $19 million)
Total basic EPS impact $0.40 $0.03
Basic EPS, as reported $0.04 $0.41
Discontinued operations, excluding Crescent ($0.95) $0.01
Resources
Basic EPS from continuing operations, as $0.99 $0.40
reported
Total basic EPS impact of special items $0.40 $0.03
Basic EPS, ongoing $0.59 $0.37
Special items EPS year-to-date impact:
2005 2004
First quarter $0.45 ($0.25)
Second quarter $0.02 $0.01
Third quarter $0.40 $0.03
Impact of change in shares outstanding and rounding $0.01 $0.01
Total EPS Impact $0.88 ($0.20)
2005 2004
EPS EPS
Impact Impact
Year-to-date basic EPS, as reported $1.29 $1.22
Discontinued operations, excluding Crescent ($0.96) $0.20
Resources
Basic EPS from continuing operations, as $2.25 $1.02
reported
Total basic EPS impact of special items $0.88 ($0.20)
Year-to-date basic EPS, ongoing $1.37 $1.22
3
4. BUSINESS UNIT RESULTS
Franchised Electric
Third quarter 2005 segment EBIT from continuing operations for Franchised Electric
was $606 million, compared to $453 million in the prior year’s quarter. The increase
was driven primarily by warmer weather, which pushed residential sales up
12.4 percent, and strong bulk power marketing (BPM) results.
Also, Franchised Electric recorded approximately $25 million less regulatory
amortization this quarter than the prior year’s quarter. These increases to segment
EBIT were partially offset by higher operating and maintenance expenses, primarily
related to nuclear outage and maintenance costs.
Overall industrial kilowatt-hour sales were up 0.7 percent for the quarter as textile
plant closings were more than offset by increased usage in other industries. Regional
growth continued to add to Franchised Electric’s total customer base, with 43,000
customers – about 2 percent -- over the prior year.
Year-to-date segment EBIT from continuing operations for Franchised Electric was
$1.22 billion in both 2005 and 2004.
Natural Gas Transmission
Duke Energy Gas Transmission (DEGT) reported third quarter 2005 segment EBIT
from continuing operations of $329 million compared to $269 million in the prior year’s
quarter. The increase was driven by improved U.S. operations, domestic business
expansion projects and higher earnings by natural gas distribution operations in
eastern Canada. In addition, earnings benefited from operations in Canada that were
purchased or transferred to DEGT in the third quarter.
DEGT’s third quarter earnings continued to benefit from the stronger Canadian
currency over comparable periods. This was mainly offset by a gain of a prior year
asset sale. The favorable Canadian currency impacts on DEGT’s EBIT were partially
offset in Duke Energy’s net income by currency impacts on Canadian interest and
taxes.
4
5. Year-to-date EBIT from continuing operations for Natural Gas Transmission was
$1.04 billion, compared with $986 million in 2004.
Field Services
The Field Services business segment, which in the quarter represented
Duke Energy's 50-percent interest in Duke Energy Field Services (DEFS), reported
third quarter 2005 equity earnings of $126 million -- in addition to a one-time gain on
the transfer of a 19.7 percent interest in DEFS of $576 million -- compared to
$63 million in EBIT in third quarter 2004.
The equity earnings amount for the third quarter 2005 includes deductions primarily
for interest totaling $15 million, which were not included in the prior quarter’s EBIT.
The equity earnings amount for third quarter 2005 does not include the negative
impact of hedge settlements during the quarter, which are now reported in Other and
were reported in third quarter 2004 Field Services’ EBIT.
Results were driven by strong commodity prices, operational improvements and the
absence of a $26 million impairment charge reported in the prior year’s quarter. These
were partly offset by higher operating costs from pipeline integrity work and lower
volumes due to hurricane interruptions.
On July 5, 2005, Duke Energy transferred a 19.7 percent interest in DEFS to
ConocoPhillips in exchange for cash and assets of approximately $1.1 billion. DEFS is
now a 50/50 joint venture between Duke Energy and ConocoPhillips.
Duke Energy North America
As a result of the decision to exit substantially all of the Duke Energy North America
(DENA) business outside of the Midwest, results for DENA’s continuing operations for
2005 is included in Other. Its discontinued results are reported in Discontinued
Operations.
International Energy
For third quarter 2005, Duke Energy International (DEI) reported segment EBIT from
continuing operations of $63 million, compared to $64 million in third quarter 2004.
5
6. The 2005 results include a $20 million impairment charge on DEI’s investment in the
Campeche plant in Mexico. Excluding that item, results were driven by favorable
hydrology and pricing in Peru and Argentina, higher commodity prices at National
Methanol and favorable currency impacts in Brazil – offset by higher expenses in
Ecuador and Guatemala, and lower margins in Brazil. The favorable currency impacts
on DEI’s EBIT were partially offset in Duke Energy’s net income by currency impacts
on Brazilian interest and taxes.
Year-to-date EBIT from continuing operations for International Energy was
$217 million, compared with $161 million in 2004.
Crescent Resources
Crescent Resources reported third quarter 2005 segment EBIT from continuing
operations of $120 million, compared to $43 million in the previous year’s quarter.
The increase was driven by continued active management of Crescent’s real estate
holdings, which this quarter included a gain on the sale of an interest in a portfolio of
office buildings, the sale of a legacy land tract in South Carolina and increased
residential lot sales. These were partially offset by a $16 million impairment on a
residential development in South Carolina.
Year-to-date EBIT from continuing operations for Crescent Resources was
$210 million, compared with $190 million in 2004.
Other
Other primarily includes the cost of corporate governance, Duke Energy’s captive
insurance company, Bison Insurance Co. Limited, de-designated hedges resulting
from the decision to transfer a 19.7 percent interest in DEFS to ConocoPhillips and
DENA’s continuing operations for 2005. Other reported an EBIT loss from continuing
operations of $175 million in third quarter 2005, compared to a loss of $25 million in
third quarter 2004. The additional losses were due mainly to mark-to-market losses
on 2005 and 2006 de-designated Field Services’ hedges, realized losses on the 2005
de-designated hedges due to settlements in the quarter, timing of recognition of
losses at Bison and adjustments to the mutual insurance liability.
6
7. The reported losses were partially offset by a mark-to-market gain on de-designated
Southeast DENA hedges.
Year-to-date EBIT loss from continuing operations for Other was $495 million,
compared with a $56 million EBIT loss in 2004.
Discontinued Operations
Discontinued Operations showed a third quarter 2005 loss of $883 million, compared
to a gain of $8 million in third quarter 2004. This is primarily due to the company’s
decision to exit DENA.
Year-to-date, Discontinued Operations posted a loss of $894 million, compared with a
gain of $183 million in 2004.
INTEREST EXPENSE
Interest expense was $228 million for third quarter 2005, compared to $329 million for
third quarter 2004. The decrease was primarily due to the company’s debt reduction
efforts in 2004 and the transfer of Duke Energy’s 19.7 percent interest in DEFS, which
resulted in reporting Duke Energy’s proportionate share of DEFS’ interest expense in
equity earnings.
Year-to-date interest expense was $813 million, compared with interest expense of
$984 million in 2004.
INCOME TAX
Third quarter 2005 income tax expense from continuing operations was $487 million,
compared to $147 million in third quarter 2004. This increase was primarily due to
higher earnings during the quarter compared to last year’s quarter. The effective tax
rate increased from 27.9 percent in the third quarter 2004 to 34.5 percent in the third
quarter 2005 primarily due to benefits resulting from a change in effective state tax
rates in the prior year. The effective tax rate calculation includes equity earnings in
pre-tax income.
7
8. Year-to-date income tax expense from continuing operations was $1.1 billion,
compared to $365 million in 2004.
LIQUIDITY AND CAPITAL RESOURCES
Duke Energy's consolidated capital structure at the end of third quarter 2005,
including short-term debt, was 49 percent debt, 49 percent common equity and
2 percent minority interests. The company had approximately $1.44 billion in cash,
cash equivalents and short-term investments at the end of third quarter 2005.
ADDITIONAL INFORMATION
Additional information, including EPS reconciliation data and a schedule for
Duke Energy Field Services’ gas volume and margin by contract type can be obtained
at Duke Energy’s third quarter 2005 earnings information Web site at:
http://www.duke-energy.com/investors/.
NON-GAAP FINANCIAL MEASURES
The primary performance measure used by management to evaluate segment
performance is segment EBIT from continuing operations, which at the segment level
represents all profits from continuing operations (both operating and non-operating),
including any equity in earnings of unconsolidated affiliates, before deducting interest
and taxes, and is net of the minority interest expense related to those profits.
Management believes segment EBIT from continuing operations, which is the GAAP
measure used to report segment results, is a good indicator of each segment’s
operating performance as it represents the results of our ownership interests in
continuing operations without regard to financing methods or capital structures.
Duke Energy’s management uses ongoing basic and diluted EPS, which are non-
GAAP financial measures as they represent basic and diluted EPS from continuing
operations plus any discontinued operations from its Crescent Resources real estate
unit, adjusted for the impact of special items, as two of the measures to evaluate
operations of the company. Special items represent certain charges and credits which
management believes will not be recurring on a regular basis. Management believes
8
9. that the presentation of ongoing basic and diluted EPS provides useful information to
investors, as it allows them to more accurately compare the company’s ongoing
performance across all periods. Ongoing basic EPS is also the basis used for
employee incentive bonuses. The most directly comparable GAAP measures for
ongoing basic and diluted EPS are reported basic and diluted EPS from continuing
operations, respectively, which include the impact of special items. Due to the
forward-looking nature of ongoing basic and diluted EPS for future periods,
information to reconcile such non-GAAP financial measures to the most directly
comparable GAAP financial measure is not available at this time as the company is
unable to forecast any special items for future periods.
Duke Energy is a diversified energy company with a portfolio of natural gas and
electric businesses, both regulated and unregulated, and an affiliated real estate
company. Duke Energy supplies, delivers and processes energy for customers in the
Americas. Headquartered in Charlotte, N.C., Duke Energy is a Fortune 500 company
traded on the New York Stock Exchange under the symbol DUK. More information
about the company is available on the Internet at: www.duke-energy.com.
An earnings conference call for analysts is scheduled for 10 a.m. ET today. The
conference call can be accessed via the investors' section of Duke Energy’s Web site
http://www.duke-energy.com/investors/ or by dialing 800/967-7185 in the United
States or 719/457-2634 outside the United States. The confirmation code is 8492249.
Please call in five to 10 minutes prior to the scheduled start time. A replay of the
conference call will be available until Nov. 11, 2005, midnight ET, by dialing
888/203-1112 with a confirmation code of 8492249. The international replay number is
719/457-0820, confirmation code 8492249. A replay and transcript also will be
available by accessing the investors' section of the company’s Web site. The
presentation may include certain non-GAAP financial measures as defined under SEC
rules. In such event, a reconciliation of those measures to the most directly
comparable GAAP measures will be available on our investor relations Web site at:
http://www.duke-energy.com/investors/publications/gaap/.
This release includes statements that do not directly or exclusively relate to historical
facts. Such statements are quot;forward-looking statementsquot; within the meaning of Section
27A of the Securities Act of 1933 and Section 21E of the Securities Exchange Act of
9
10. 1934. Those statements represent Duke Energy’s intentions, plans, expectations,
assumptions and beliefs about future events and are subject to risks, uncertainties
and other factors, many of which are outside Duke Energy’s control and could cause
actual results to differ materially from the results expressed or implied by those
forward-looking statements. Those factors include: industrial, commercial and
residential growth in Duke Energy’s service territories; the influence of weather and
other natural phenomena on company operations, including the economic, operational
and other effects of hurricanes Katrina and Rita; general economic conditions,
including any potential effects arising from terrorist attacks and any consequential
hostilities or other hostilities or other external factors over which Duke Energy has no
control; changes in environmental and other laws and regulations to which Duke
Energy and its subsidiaries are subject; the results of financing efforts, including Duke
Energy’s ability to obtain financing on favorable terms, which can be affected by
various factors, including Duke Energy’s credit ratings and general economic
conditions; declines in the market prices of equity securities and resultant cash
funding requirements for Duke Energy’s defined benefit pension plans; the
performance of electric generation, pipeline and gas processing facilities; the extent of
success in connecting natural gas supplies to gathering and processing systems and
in connecting and expanding gas and electric markets; conditions of the capital
markets and equity markets during the periods covered by the forward-looking
statements; the effect of accounting pronouncements issued periodically by
accounting standard-setting bodies; the outcomes of litigation and regulatory
investigations, proceedings or inquiries and other contingencies; the level of
creditworthiness of counterparties to Duke Energy’s transactions; the amount of
collateral required to be posted from time to time in Duke Energy’s transactions;
opportunities for Duke Energy’s business units, including the timing and success of
efforts to develop domestic and international power, pipeline, gathering, liquefied
natural gas, processing and other infrastructure projects; state, federal and foreign
legislative and regulatory initiatives that affect cost and investment recovery, have an
impact on rate structures, and affect the speed at and the degree to which competition
enters the electric and natural gas industries; the timing and extent of changes in
commodity prices, interest rates and foreign currency exchange rates; competition
and regulatory limitations affecting the success of Duke Energy’s divestiture plans,
including the prices at which Duke Energy is able to sell its assets; the ability to
successfully complete merger, acquisitions or divestiture plans (including the merger
10
11. with Cinergy Corp.); regulatory or other limitations imposed as a result of a merger,
acquisition or divestiture; and the success of the business following a merger,
acquisition or divestiture.
In light of these risks, uncertainties and assumptions, the events described in the
forward-looking statements might not occur or might occur to a different extent or at a
different time than Duke Energy has described. Duke Energy undertakes no obligation
to publicly update or revise any forward-looking statements, whether as a result of
new information, future events or otherwise. Information contained in this release is
unaudited, and is subject to change.
###
11
12. SEPTEMBER 2005
QUARTERLY HIGHLIGHTS
(Unaudited)
Three Months Ended Nine Months Ended
September 30, September 30,
(In millions, except where noted) 2005 2004 2005 2004
COMMON STOCK DATA
Earnings Per Share (from continuing operations)
Basic $ 0.99 $ 0.40 $ 2.25 $ 1.02
Diluted $ 0.96 $ 0.39 $ 2.17 $ 0.99
(Loss) Earnings Per Share (from discontinued operations)
Basic $ (0.95) $ 0.01 $ (0.96) $ 0.20
Diluted $ (0.92) $ 0.01 $ (0.92) $ 0.19
Earnings Per Share
Basic $ 0.04 $ 0.41 $ 1.29 $ 1.22
Diluted $ 0.04 $ 0.40 $ 1.25 $ 1.18
Dividends Per Share $ - $ - $ 0.860 $ 0.825
Weighted-Average Shares Outstanding
Basic 926 938 936 925
Diluted 964 973 973 960
INCOME
Operating Revenues $ 3,028 $ 5,081 $ 13,630 $ 15,007
Total Reportable Segment EBIT 1,819 865 4,471 2,281
Other EBIT (175) (25) (495) (56)
Interest Expense 228 329 813 984
Interest Income and Other (a) 5 (17) (44) (73)
Income Tax Expense from Continuing Operations 487 147 1,095 365
(Loss) Income from Discontinued Operations (883) 8 (894) 183
Net Income 41 389 1,218 1,132
Dividends and Premiums on Redemption of Preferred and Preference Stock 3 2 7 7
Earnings Available for Common Stockholders $ 38 $ 387 $ 1,211 $ 1,125
CAPITALIZATION
Common Equity 49% 41%
Preferred Stock 0% 0%
Total Common Equity and Preferred Securities 49% 41%
Minority Interests 2% 4%
Total Debt 49% 55%
Total Debt $ 16,112 $ 20,653
Book Value Per Share $ 17.18 $ 16.30
Actual Shares Outstanding 926 938
CAPITAL AND INVESTMENT EXPENDITURES
Franchised Electric $ 335 $ 253 $ 913 $ 781
Natural Gas Transmission 478 131 716 387
Field Services - 31 86 163
Duke Energy North America (1) 5 4 19
International Energy 8 9 20 24
Crescent (b) 139 122 470 406
Other (1) - 9 24
Total Capital and Investment Expenditures $ 958 $ 551 $ 2,218 $ 1,804
EBIT BY BUSINESS SEGMENT
Franchised Electric $ 606 $ 453 $ 1,216 $ 1,215
Natural Gas Transmission 329 269 1,044 986
Field Services 701 63 1,784 243
Duke Energy North America - (27) - (514)
International Energy 63 64 217 161
Crescent 120 43 210 190
Total reportable segment EBIT 1,819 865 4,471 2,281
Other EBIT (175) (25) (495) (56)
Interest expense (228) (329) (813) (984)
Equity in earnings of unconsolidated affiliates in Segment EBIT (176) (33) (256) (110)
Interest Income and Other (a) (5) 17 44 73
Consolidated earnings from continuing operations before income taxes and equity in earnings of unconsolidated affiliates $ 1,235 $ 495 $ 2,951 $ 1,204
(a) Other includes foreign currency remeasurement gains and losses and additional minority interest not allocated to the segment results.
(b) Amounts include capital expenditures for residential real estate included in operating cash flows of $67 million and $80 million for the three months ended September 30, 2005 and 2004
respectively, and $276 million and $218 million for the nine months ended September 30, 2005 and 2004, respectively.
Note: Certain prior period amounts have been reclassified due to discontinued operations.
12
13. SEPTEMBER 2005
QUARTERLY HIGHLIGHTS
(Unaudited)
Three Months Ended Nine Months Ended
September 30, September 30,
(In millions, except where noted) 2005 2004 2005 2004
FRANCHISED ELECTRIC
Operating Revenues $ 1,619 $ 1,419 $ 4,118 $ 3,918
Operating Expenses 1,026 967 2,916 2,714
Gains on Sales of Other Assets, net 1 - 2 3
Other Income, net of expenses 12 1 12 8
EBIT $ 606 $ 453 $ 1,216 $ 1,215
Sales, GWh 23,724 21,904 65,318 63,954
NATURAL GAS TRANSMISSION
Operating Revenues $ 869 $ 652 $ 2,824 $ 2,408
Operating Expenses 549 398 1,809 1,453
Gains on Sales of Other Assets, net - 3 4 12
Other Income, net of expenses 17 19 48 39
Minority Interest Expense 8 7 23 20
EBIT $ 329 $ 269 $ 1,044 $ 986
Proportional Throughput, TBtu 759 652 2,534 2,467
FIELD SERVICES (a)
Operating Revenues $ - $ 2,490 $ 5,530 $ 7,154
Operating Expenses - 2,368 5,211 6,785
Gains on Sales of Other Assets, net 576 1 577 1
Other Income (Expense), net (1) (17) 1,259 17
Equity in Earnings of Unconsolidated Affiliates (b) 126 - 126 -
Minority Interest Expense - 43 497 144
EBIT $ 701 $ 63 $ 1,784 $ 243
Natural Gas Gathered and Processed/Transported, TBtu/day (c) 6.7 6.8 6.8 6.8
Natural Gas Liquids Production, MBbl/d (c) 342 357 355 354
Average Natural Gas Price per MMBtu $ 8.37 $ 5.76 $ 7.12 $ 5.81
Average Natural Gas Liquids Price per Gallon $ 0.91 $ 0.72 $ 0.80 $ 0.64
DUKE ENERGY NORTH AMERICA (a) (d)
Operating Revenues $ - $ 75 $ - $ 169
Operating Expenses - 88 - 318
Losses on Sales of Other Assets, net (e) - (4) - (373)
Other Income, net of expenses - 5 - 6
Minority Interest Expense (Benefit) - 15 - (2)
EBIT $ - $ (27) $ - $ (514)
Actual Plant Production, GWh (DENA Continuing Operations) 887 3,300
Proportional MW Capacity in Operation (DENA Continuing Operations) 3,600
INTERNATIONAL ENERGY
Operating Revenues $ 186 $ 146 $ 536 $ 447
Operating Expenses 139 109 385 338
Gains on Sales of Other Assets, net 1 1 1 1
Other Income, net of expenses 19 29 74 60
Minority Interest Expense 4 3 9 9
EBIT $ 63 $ 64 $ 217 $ 161
Sales, GWh 4,493 4,277 13,555 13,088
Proportional MW Capacity in Operation 4,064 4,136
CRESCENT (a)
Operating Revenues $ 105 $ 77 $ 281 $ 216
Operating Expenses 95 62 225 173
Gains on Sales of Investments in Commercial and Multi-Family Real Estate 63 28 117 149
Other Income, net of expenses 46 - 44 -
Minority Interest (Benefit) Expense (1) - 7 2
EBIT $ 120 $ 43 $ 210 $ 190
OTHER (d)
Operating Revenues $ 282 $ 295 $ 510 $ 929
Operating Expenses 360 316 920 1,014
Gains (Losses) on Sales of Other Assets, net 3 (3) 6 4
Other (Expense) Income, net (103) (1) (98) 25
Minority Interest Benefit (3) - (7) -
EBIT $ (175) $ (25) $ (495) $ (56)
Actual Plant Production, GWh (DENA Continuing Operations) 958 1,664
Proportional MW Capacity in Operation (DENA Continuing Operations) 3,600
(a) Certain prior year amounts have been reclassified due to discontinued operations.
(b) Represents the 50% interest in Duke Energy Field Services LLC
(c) Represents 100% of joint venture volumes.
(d) 2005 Segment EBIT balances for DENA's continuing operations are included in Other.
(e) Prior year amounts for the nine months ended September 30, 2004 include DENA Southeast plant impairment of approximately $360 million.
Note: See GAAP reconciliation associated with the 2005 third quarter Earnings Release on the Investor Relations
Web site at http://www.duke-energy.com/investors/publications/gaap/.
13
14. DUKE ENERGY CORPORATION
CONDENSED CONSOLIDATED STATEMENTS OF OPERATIONS
(Unaudited)
(In millions, except per-share amounts)
Three Months Ended Nine Months Ended
September 30, September 30,
2005 2004 2005 2004
Operating Revenues $ 3,028 $ 5,081 $ 13,630 $ 15,007
Operating Expenses 2,138 4,236 11,308 12,567
Gains on Sales of Investments in Commercial and Multi-Family Real Estate 63 28 117 149
Gains (Losses) on Sales of Other Assets, net 580 (3) 589 (353)
Operating Income 1,533 870 3,028 2,236
Other Income and Expenses (60) 16 1,244 98
Interest Expense 228 329 813 984
Minority Interest Expense 10 62 508 146
Earnings From Continuing Operations Before Income Taxes and Equity in Earnings of Unconsolidated Affiliates 1,235 495 2,951 1,204
Income Tax Expense from Continuing Operations 487 147 1,095 365
Income From Continuing Operations Before Equity in Earnings of Unconsolidated Affiliates 748 348 1,856 839
Equity in Earnings of Unconsolidated Affiliates 176 33 256 110
Income From Continuing Operations 924 381 2,112 949
(Loss) Income From Discontinued Operations, net of tax (883) 8 (894) 183
Net Income 41 389 1,218 1,132
Dividends and Premiums on Redemption of Preferred and Preference Stock 3 2 7 7
Earnings Available For Common Stockholders $ 38 $ 387 $ 1,211 $ 1,125
Common Stock Data
Weighted-average shares outstanding
Basic 926 938 936 925
Diluted 964 973 973 960
Earnings per share (from continuing operations)
Basic $ 0.99 $ 0.40 $ 2.25 $ 1.02
Diluted $ 0.96 $ 0.39 $ 2.17 $ 0.99
(Loss) Earnings per share (from discontinued operations)
Basic $ (0.95) $ 0.01 $ (0.96) $ 0.20
Diluted $ (0.92) $ 0.01 $ (0.92) $ 0.19
Earnings per share
Basic $ 0.04 $ 0.41 $ 1.29 $ 1.22
Diluted $ 0.04 $ 0.40 $ 1.25 $ 1.18
Dividends per share $ - $ - $ 0.860 $ 0.825
Note: Amounts remain subject to change until the Company's Form 10-Q is filed with the Securities and Exchange Commission.
14
15. DUKE ENERGY CORPORATION
CONDENSED CONSOLIDATED BALANCE SHEETS
(Unaudited)
(In millions)
September 30, December 31,
2005 2004
ASSETS
Current Assets $ 8,357 $ 7,971
Investments and Other Assets 14,152 11,533
Net Property, Plant and Equipment 28,600 33,506
Regulatory Assets and Deferred Debits 2,568 2,460
Total Assets $ 53,677 $ 55,470
LIABILITIES AND COMMON STOCKHOLDERS' EQUITY
Current Liabilities $ 7,756 $ 7,502
Long-term Debt 15,062 16,932
Deferred Credits and Other Liabilities 14,161 12,975
Minority Interests 650 1,486
Preferred and preference stock without sinking fund requirements 134 134
Common Stockholders' Equity 15,914 16,441
Total Liabilities and Common Stockholders' Equity $ 53,677 $ 55,470
Note: Amounts remain subject to change until the Company's Form 10-Q is filed with the Securities and Exchange Commission.
15
16. DUKE ENERGY CORPORATION
CONDENSED CONSOLIDATED STATEMENTS OF CASH FLOWS
(Unaudited)
(In millions)
Nine Months Ended
September 30,
2005 2004
CASH FLOWS FROM OPERATING ACTIVITIES
Net income $ 1,218 $ 1,132
Adjustments to reconcile net income to net cash provided by
operating activities 1,221 2,371
Net cash provided by operating activities 2,439 3,503
CASH FLOWS FROM INVESTING ACTIVITIES
Net cash used in investing activities (261) (1,601)
CASH FLOWS FROM FINANCING ACTIVITIES
Net cash used in financing activities (2,337) (1,543)
Changes in cash and cash equivalents associated with assets held for sale 3 38
Net (decrease) increase in cash and cash equivalents (156) 397
Cash and cash equivalents at beginning of period 533 397
Cash and cash equivalents at end of period $ 377 $ 794
Note: Amounts remain subject to change until the Company's Form 10-Q is filed with the Securities and Exchange Commission.
16
17. Supplemental Disclosures
Quarter Ended September 30, 2005
Duke Energy Corporation
Mark-to-market Portfolio (in millions) Non-AHFS AHFS Total
As of 09/30/2005 $ 15 $ (1,109) $ (1,094)
Daily Earnings at Risk (DER) (in millions) Continuing Discontinued
95% Confidence Level, One-Day Holding Period, Two-Tailed
$ 6 $ 61 $ 65 a
As of 09/30/2005
a This figure excludes effects of the February 22, 2005 de-designation of certain hedges of Field Services' commodity risk, which have been retained as
undesignated derivatives. DER is higher than prior quarter due to restructuring of DENA's hedge books due to the decision to exit the components of its
business outside the Midwest.
Duke Energy North America
Owned Assets - Contracted Level Remaining 2005 2006
Millions Millions
% Contracted % Contracted
MWs MWh MWh
Region Capacity Available Capacity Energy Available Capacity Energy
Midwest 3,600 b 7c 17% 0% 28 c 11% 0%
b Capacity excludes assets held for sale and classified as quot;Discontinued Operationsquot;.
c Midwest capacity includes 1.8 million MWh from peaking facilities in 2005 and 6.6 million in 2006.
Terms of Reference
MWs Capacity
Represents the official rated capacity of DENA’s percentage ownership of its merchant assets, excluding assets held for sale
and classified as discontinued operations.
Millions MWhs Available
Represents the amount of electric power capable of being generated from owned merchant assets, excluding assets held
for sale and classified as discontinued operations, after adjusting for scheduled maintenance and outage factors. For simple cycle
facilities, only peak demand periods were included in this calculation.
% Contracted:
Capacity: Volumes contracted under tolls as well as Regulatory Must Run (“RMR”).
Energy: Volumes sold as forward power hedges.
AHFS
Assets Held For Sale
17
18. Duke Energy Corporation
Quarterly Highlights
Supplemental Franchised Electric Information
September 30, 2005
Quarter Ended Year To Date
September 30, September 30,
% %
2005 2004 Inc.(Dec.) 2005 2004 Inc.(Dec.)
GWH Sales
Residential 7,654 6,807 12.4% 19,696 19,469 1.2%
General Service 7,303 6,937 5.3% 19,173 18,987 1.0%
Industrial - Textile 1,749 1,925 (9.1%) 5,004 5,390 (7.2%)
Industrial - Other 5,082 4,861 4.5% 14,101 13,415 5.1%
Total Industrial 6,831 6,786 0.7% 19,105 18,805 1.6%
Other Energy Sales 67 67 - 201 199 1.0%
Regular Resale 457 438 4.3% 1,123 1,132 (0.8%)
Total Regular Sales Billed 22,312 21,035 6.1% 59,298 58,592 1.2%
Special Sales (A) 1,079 908 18.8% 5,229 4,844 7.9%
Total Electric Sales 23,391 21,943 6.6% 64,527 63,436 1.7%
Unbilled Revenue 9 (342) 102.6% (164) (398) 58.8%
Total Duke Power Electric Sales 23,400 21,601 8.3% 64,363 63,038 2.1%
Nantahala Electric Sales 324 303 6.9% 955 916 4.3%
Total DP Consolidated Electric Sales 23,724 21,904 8.3% 65,318 63,954 2.1%
Average Number of Customers
Residential 1,843,208 1,808,955 1.9% 1,835,402 1,801,039 1.9%
General Service 312,135 305,924 2.0% 310,122 304,006 2.0%
Industrial - Textile 786 846 (7.1%) 802 859 (6.6%)
Industrial - Other 6,661 6,670 (0.1%) 6,665 6,674 (0.1%)
Total Industrial 7,447 7,516 (0.9%) 7,467 7,533 (0.9%)
Other Energy Sales 12,659 12,424 1.9% 12,977 11,936 8.7%
Regular Resale 15 15 - 15 15 -
Total Regular Sales 2,175,464 2,134,834 1.9% 2,165,983 2,124,529 2.0%
Special Sales (A) 28 37 (24.3%) 32 38 (15.8%)
Total Duke Power Electric Sales 2,175,492 2,134,871 1.9% 2,166,015 2,124,567 2.0%
Nantahala Electric Sales 68,733 67,346 2.1% 68,162 66,814 2.0%
Total DP Average Number of Customers 2,244,225 2,202,217 1.9% 2,234,177 2,191,381 2.0%
(A) Excludes sales to Nantahala Power and Light Company
Heating and Cooling Degree Days
Actual
Heating Degree Days 1 9 (89.9%) 1,976 2,094 (5.6%)
Cooling Degree Days 1,122 831 35.0% 1,474 1,400 5.3%
Variance from Normal
Heating Degree Days (95.4%) (59.2%) n/a 1.5% 9.0% n/a
Cooling Degree Days 18.6% (14.1%) n/a 4.5% (1.8%) n/a
18
19. DUKE ENERGY CORPORATION
ONGOING TO REPORTED EARNINGS RECONCILIATION
September 2004 Quarter-to-date
(Dollars in Millions) Special Items (Note 1)
Gains
Discontinued
Gains (Losses) on
Tax Benefit Operations,
Ongoing (Losses) on sales and Total Reported
Impairment from DEA excluding
Earnings Sale impairments Adjustments Earnings
Restructuring Crescent
of Assets of equity
Resources
investments
SEGMENT EARNINGS BEFORE INTEREST AND TAXES
FROM CONTINUING OPERATIONS
Franchised Electric $ 453 $ - $ - $ - $ - $ - $ - $ 453
Gas Transmission 262 2 - 5A - - 7 269
Field Services 88 1 (10) B (16) C - - (25) 63
Duke Energy North America (23) (4) D - - - - (4) (27)
International Energy 63 - - 1 - - 1 64
Crescent 43 - - - - - - 43
Total reportable segment EBIT 886 (1) (10) (10) - - (21) 865
Other (25) (3) - 3 - - - (25)
Total reportable segment EBIT and other EBIT $ 861 $ (4) $ (10) $ (7) $ - $ - $ (21) $ 840
EARNINGS FOR COMMON
Total reportable segment EBIT and other EBIT $ 861 $ (4) $ (10) $ (7) $ - $ - $ (21) $ 840
Foreign Currency Translation Gains / (Losses) (3) - - - - - - (3)
Interest Income and Other 14 - - - - - - 14
Interest Expense (329) - - - - - - (329)
Minority Interest - Interest Expense 6 - - - - - - 6
Income taxes on continuing operations (203) 1 4 3 48 - 56 (147)
Discontinued operations, net of taxes 4 - - - - 4 4 8
Trust Preferred/Preferred Dividends (2) - - - - - - (2)
Total Earnings for Common $ 348 $ (3) (6) (4) $ 48 $ 4 $ 39 $ 387
$ 0.37 $ - $ (0.01) $ (0.01) $ 0.05 $ 0.01 $ 0.04 $ 0.41
EARNINGS PER SHARE, BASIC
$ 0.36 $ - $ (0.01) $ (0.01) $ 0.05 $ 0.01 $ 0.04 $ 0.40
EARNINGS PER SHARE, DILUTED
Note 1 - Amounts for special items are entered net of minority interest
A - Millennium Pipeline
B - Recorded in Impairment and other charges on the Consolidated Statements of Operations. Amount net of $12 million of minority interest.
C - Amount net of $7 million of minority interest.
D - Southeast assets
Weighted Average Shares (reported and ongoing) - in millions
Basic 938
Diluted 973
19
20. DUKE ENERGY CORPORATION
ONGOING TO REPORTED EARNINGS RECONCILIATION
September 2005 Quarter-to-date
(Dollars in Millions) Special Items (Note 1)
Initial and
MTM change on Discontinued
Gain on Field Services Subsequent
Impairment of de-designated Operations,
Ongoing transfer of hedge de- gain on de- Total Reported
equity Field Services excluding
Earnings 19.7% interest designation, designating Adjustments Earnings
investments hedges for 2005, Crescent
in DEFS net Southeast DENA
net Resources
hedges
SEGMENT EARNINGS BEFORE INTEREST AND TAXES
FROM CONTINUING OPERATIONS
Franchised Electric $ 606 $ - $ - $ - $ - $ - $ - $ - $ 606
Gas Transmission 329 - - - - - - - 329
Field Services 87 576 A - 38 B - - - 614 701
Duke Energy North America - - - - - - - - -
International Energy 83 - (20) C - - - - (20) 63
Crescent 120 - - - - - - - 120
Total reportable segment EBIT 1,225 576 (20) 38 - - - 594 1,819
Other (188) - - - (17) D 30 E - 13 (175)
Total reportable segment EBIT and other EBIT $ 1,037 $ 576 $ (20) $ 38 $ (17) $ 30 $ - $ 607 $ 1,644
EARNINGS FOR COMMON
Total reportable segment EBIT and other EBIT $ 1,037 $ 576 $ (20) $ 38 $ (17) $ 30 $ - $ 607 $ 1,644
Foreign Currency Translation Gains / (Losses) (14) - - - - - - - (14)
Interest Income and Other 10 - - - - - - - 10
Interest Expense (228) - - - - - - - (228)
Minority Interest (Expense) Benefit - Interest Expense (1) - - - - - - - (1)
Income taxes on Continuing Operations (260) (213) 6 (15) 6 (11) - (227) (487)
Discontinued Operations, net of taxes 1 - - - - - (884) F (884) (883)
Trust Preferred/Preferred Dividends (3) - - - - - - - (3)
Total Earnings for Common $ 542 $ 363 $ (14) $ 23 $ (11) $ 19 $ (884) $ (504) $ 38
$ 0.59 $ 0.39 $ (0.02) $ 0.02 $ (0.01) $ 0.02 $ (0.95) $ (0.55) $ 0.04
EARNINGS PER SHARE, BASIC
$ 0.56 $ 0.38 $ (0.01) $ 0.02 $ (0.01) $ 0.02 $ (0.92) $ (0.52) $ 0.04
EARNINGS PER SHARE, DILUTED
Note 1 - Amounts for special items are entered net of minority interest
A - Recorded in Gains (Losses) on Sales of Other Assets, net on the Consolidated Statements of Operations.
B - Third quarter settlements of the 2005 portion of the Field Services de-designated hedges as of 2/22/05, recorded in Equity in Earnings of Unconsolidated Affiliates on the Consolidated Statements of Operations.
C - Equity investment impairment, recorded in (Losses) Gains on sales and impairments of equity investments on the Consolidated Statements of Operations.
D - Recorded in Other income and expenses, net on the Consolidated Statements of Operations.
E - Recorded in Non-regulated electric, natural gas, natural gas liquids and other revenues on the Consolidated Statements of Operations.
F - Primarily the non-cash, after-tax charge related to the planned exit of substantially all of DENA's physical and commercial assets outside the midwestern United States
and the reclassification of DENA 2005 operations. Recorded in (Loss) Income From Discontinued Operations, net of tax on the Consolidated Statements of Operations.
Weighted Average Shares (reported and ongoing) - in millions
Basic 926
Diluted 964
20
21. DUKE ENERGY CORPORATION
ONGOING TO REPORTED EARNINGS RECONCILIATION
September 2004 Year-to-date
(Dollars in Millions) Special Items (Note 1)
Gains
Discontinued
Gains (losses) on
Tax Benefit from Operations,
Ongoing (Losses) on sales and Enron Total Reported
Impairment DEA excluding
Earnings sale impairments Settlement Adjustments Earnings
Restructuring Crescent
of assets of equity
Resources
investments
SEGMENT EARNINGS BEFORE INTEREST AND TAXES
FROM CONTINUING OPERATIONS
Franchised Electric $ 1,212 $ 3 $ - $ - $ - $ - $ - $ 3 $ 1,215
Gas Transmission 970 11 - 5A - - - 16 986
Field Services 267 1 (10) B (16) C 1 D - - (24) 243
Duke Energy North America (149) (373) E - - 8 D,F - - (365) (514)
International Energy 172 1 (13) G 1 - - - (11) 161
Crescent 190 - - - - - - - 190
Total reportable segment EBIT 2,662 (357) (23) (10) 9 - - (381) 2,281
Other (84) 4H - 3 21 D - - 28 (56)
Total reportable segment EBIT and other EBIT $ 2,578 $ (353) $ (23) $ (7) $ 30 $ - $ - $ (353) $ 2,225
EARNINGS FOR COMMON
Total reportable segment EBIT and other EBIT $ 2,578 $ (353) $ (23) $ (7) $ 30 $ - $ - $ (353) $ 2,225
Foreign Currency Translation Gains / (Losses) - - - - - - - - -
Interest Income and other 46 - - - - - - - 46
Interest Expense (984) - - - - - - - (984)
Minority Interest - Interest Expense 27 - - - - - - - 27
Income taxes on continuing operations (537) 124 8 3 (11) 48 - 172 (365)
Discontinued operations, net of taxes 4 - - - - - 179 I 179 183
Trust Preferred/Preferred Dividends (7) - - - - - - - (7)
Total Earnings for Common $ 1,127 $ (229) $ (15) $ (4) $ 19 $ 48 $ 179 $ (2) $ 1,125
$ 1.22 $ (0.25) $ (0.02) $ - $ 0.02 $ 0.05 $ 0.20 $ - $ 1.22
EARNINGS PER SHARE, BASIC
$ 1.18 $ (0.24) $ (0.02) $ - $ 0.02 $ 0.05 $ 0.19 $ - $ 1.18
EARNINGS PER SHARE, DILUTED
Note 1 - Amounts for special items are entered net of minority interest
A - Millennium Pipeline
B - Recorded in Impairment and other charges on the Consolidated Statements of Operations. Amount net of $12 million of minority interest.
C - Amount net of $7 million of minority interest.
D - Recorded in Operation, maintenance and other on the Consolidated Statements of Operations.
E - Approximately $(360) million related to loss on sale of the Southeast assets and approximately $(9) million related to losses on liquidation of DETM contracts (net of $5 million of minority interest).
$(367) million recorded in Gains (Losses) on Sales of Other Assets, net (net of $5 million of minority interest) and $(6) million recorded in Operation, maintenance and other on the Consolidated Statements of Operations.
F - Amount is net of $5 million of minority interest.
G - Charge related to Cantarell, recorded in Operation, maintenance and other on the Consolidated Statements of Operations.
H - Includes $13 million related to the sale of Caribbean Nitrogen Co.
I - Primarily the approximate $280 million gain on the sale of International Energy's Asia-Pacific business, partially offset by DENA discontinued operations.
Weighted Average Shares (reported and ongoing) - in millions
Basic 925
Diluted 960
21
22. DUKE ENERGY CORPORATION
ONGOING TO REPORTED EARNINGS RECONCILIATION
September 2005 Year-to-date
(Dollars in Millions) Special Items (Note 1)
Initial and
Gain on Gains (Losses) MTM change on Discontinued
Mutual Field Services Subsequent
transfer of on sales and de-designated Operations,
Ongoing insurance hedge de- gain on de- Total Reported
19.7% impairments of Field Services excluding
Earnings liability designation, designating Adjustments Earnings
interest in equity hedges for 2005, Crescent
adjustment net Southeast DENA
DEFS investments net Resources
hedges
SEGMENT EARNINGS BEFORE INTEREST AND TAXES
FROM CONTINUING OPERATIONS
Franchised Electric $ 1,216 $ - $ - $ - $ - $ - $ - $ - $ - $ 1,216
Gas Transmission 1,044 - - - - - - - - 1,044
Field Services 378 - 576 C 888 A (58) B - - - 1,406 1,784
Duke Energy North America - - - - - - - - - -
International Energy 237 - - (20) F - - - - (20) 217
Crescent 210 - - - - - - - - 210
Total reportable segment EBIT 3,085 - 576 868 (58) - - - 1,386 4,471
Other (433) (28) D - - - (64) E 30 G - (62) (495)
Total reportable segment EBIT and other EBIT $ 2,652 $ (28) $ 576 $ 868 $ (58) $ (64) $ 30 $ - $ 1,324 $ 3,976
EARNINGS FOR COMMON
Total reportable segment EBIT and other EBIT $ 2,652 $ (28) $ 576 $ 868 $ (58) $ (64) $ 30 $ - $ 1,324 $ 3,976
Foreign Currency Translation Gains / (Losses) (12) - - - - - - - - (12)
Interest Income and Other 34 - - - - - - - - 34
Interest Expense (813) - - - - - - - - (813)
Minority Interest (Expense) Benefit - Interest Expense 22 - - - - - - - - 22
Income taxes on Continuing Operations (599) 10 (213) (323) 20 21 (11) - (496) (1,095)
Discontinued Operations, net of taxes 1 - - - - - - (895) H (895) (894)
Trust Preferred/Preferred Dividends (7) - - - - - - - - (7)
Total Earnings for Common $ 1,278 $ (18) $ 363 $ 545 $ (38) $ (43) $ 19 $ (895) $ (67) $ 1,211
$ 1.37 $ (0.02) $ 0.39 $ 0.58 $ (0.04) $ (0.05) $ 0.02 $ (0.96) $ (0.08) $ 1.29
EARNINGS PER SHARE, BASIC
$ 1.32 $ (0.02) $ 0.37 $ 0.56 $ (0.04) $ (0.04) $ 0.02 $ (0.92) $ (0.07) $ 1.25
EARNINGS PER SHARE, DILUTED
Note 1 - Amounts for special items are entered net of minority interes
A - Gain on sale of investment in units of TEPPCO LP, $97 million, and TEPPCO GP, $791 million net of $343 million of minority interes
B - De-designation of hedges due to proposed transfer of 19.7% interest in DEFS to ConocoPhillips. $125 million loss recorded in Impairment and other charges on the Consolidated Statements of Operations, reduced by $29 million of hedge settleme
recorded in Non-regulated electric, natural gas, natural gas liquids and other revenues, and $38 million of hedge settlements recorded in Equity in Earnings of Unconsolidated Affiliates on the Consolidated Statements of Operatio
C - Recorded in Gains (Losses) on Sales of Other Assets, net on the Consolidated Statements of Operation
D - Recorded in Operation, maintenance and other on the Consolidated Statements of Operations
E - $47 million loss recorded in Non-regulated electric, natural gas, natural gas liquids and other revenues, and $17 million loss recorded in Other income and expenses, net on the Consolidated Statements of Operatio
F - Equity investment impairment, recorded in (Losses) Gains on sales and impairments of equity investments on the Consolidated Statements of Operation
G - Recorded in Non-regulated electric, natural gas, natural gas liquids and other revenues on the Consolidated Statements of Operation
H - Primarily the non-cash, after-tax charge related to the planned exit of substantially all of DENA's physical and commercial assets outside the midwestern United Stat
and the reclassification of DENA 2005 operations. Recorded in (Loss) Income From Discontinued Operations, net of tax on the Consolidated Statements of Operation
Weighted Average Shares (reported and ongoing) - in millions
Basic 936
Diluted 973
22