1. News Release
Contact:
Steve Dale H.D. McCullough Judith T. Murphy
Media Relations Investor Relations Investor Relations
(612) 303-0784 (612) 303-0786 (612) 303-0783
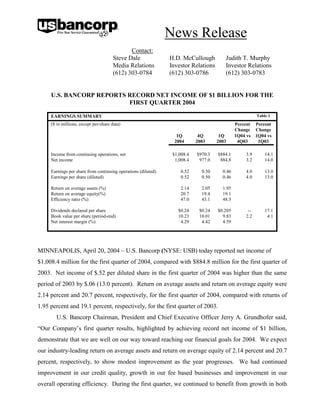
U.S. BANCORP REPORTS RECORD NET INCOME OF $1 BILLION FOR THE
FIRST QUARTER 2004
Table 1
EARNINGS SUMMARY
($ in millions, except per-share data) Percent Percent
Change Change
1Q 4Q 1Q 1Q04 vs 1Q04 vs
2004 2003 2003 4Q03 1Q03
Income from continuing operations, net $1,008.4 $970.3 $884.1 3.9 14.1
Net income 1,008.4 977.0 884.8 3.2 14.0
Earnings per share from continuing operations (diluted) 0.52 0.50 0.46 4.0 13.0
Earnings per share (diluted) 0.52 0.50 0.46 4.0 13.0
Return on average assets (%) 2.14 2.05 1.95
Return on average equity(%) 20.7 19.4 19.1
Efficiency ratio (%) 47.0 43.1 48.5
Dividends declared per share $0.24 $0.24 $0.205 -- 17.1
Book value per share (period-end) 10.23 10.01 9.83 2.2 4.1
Net interest margin (%) 4.29 4.42 4.59
MINNEAPOLIS, April 20, 2004 – U.S. Bancorp (NYSE: USB) today reported net income of
$1,008.4 million for the first quarter of 2004, compared with $884.8 million for the first quarter of
2003. Net income of $.52 per diluted share in the first quarter of 2004 was higher than the same
period of 2003 by $.06 (13.0 percent). Return on average assets and return on average equity were
2.14 percent and 20.7 percent, respectively, for the first quarter of 2004, compared with returns of
1.95 percent and 19.1 percent, respectively, for the first quarter of 2003.
U.S. Bancorp Chairman, President and Chief Executive Officer Jerry A. Grundhofer said,
“Our Company’s first quarter results, highlighted by achieving record net income of $1 billion,
demonstrate that we are well on our way toward reaching our financial goals for 2004. We expect
our industry-leading return on average assets and return on average equity of 2.14 percent and 20.7
percent, respectively, to show modest improvement as the year progresses. We had continued
improvement in our credit quality, growth in our fee based businesses and improvement in our
overall operating efficiency. During the first quarter, we continued to benefit from growth in both
2. U.S. Bancorp Reports First Quarter 2004 Results
April 20, 2004
Page 2
consumer deposit accounts and loans, and we began to see signs of growth in commercial loans.
As the economy improves, we are optimistic that this segment will become even stronger.
“With all integration activity completed and credit quality issues abating, we are now
focused on generating revenue growth. We remain committed to growing revenue faster than
expense, achieving industry leading performance metrics, reaching the top quartile in credit
quality, sustaining industry leading capital generation, and returning 80% of our earnings to
shareholders; all while providing exceptional customer service. We have the people, the products
and services, the advanced technology, the low-cost provider leadership position and the
commitment to customer service we need to continue to build and grow this franchise. I am
looking forward to the rest of 2004 and what our Company can, and will, accomplish.”
The Company’s results for the first quarter of 2004 improved over the same period of 2003,
primarily due to growth in fee based products and services, as well as controlled operating expense
and lower credit costs. Included in the current quarter was a $90.0 million reduction in income tax
expense related to the resolution of federal tax examinations covering substantially all of the
Company’s legal entities for the years 1995 through 1999. The first quarter of 2004 also included
the recognition of $109.3 million ($71.7 million on an after-tax basis) of mortgage servicing rights
(“MSR”) impairment, driven by lower interest rates and related prepayments, and a $35.4 million
expense ($23.2 million on an after-tax basis) associated with the prepayment of a portion of the
Company’s long term debt. The Company took no securities gains in the quarter to offset MSR
impairment.
Total net revenue on a taxable-equivalent basis for the first quarter of 2004 was $45.5 million
(1.4 percent) lower than the first quarter of 2003, primarily reflecting a $140.7 million reduction in
gains on the sale of securities. Favorable revenue growth in the majority of fee based products and
services categories partially offset the reduction in securities gains.
Total noninterest expense in the first quarter of 2004 was essentially flat to the first quarter of
2003, primarily reflecting a $17.6 million reduction in merger and restructuring-related charges, an
$11.6 million favorable change in the recognition of MSR impairment and cost savings from
completed integration activities. These positive variances were partially offset by expense
increases in employee benefits, professional services, marketing and business development and
other expense, the latter of which included a $35.4 million charge related to the debt prepayment.
(MORE)
3. U.S. Bancorp Reports First Quarter 2004 Results
April 20, 2004
Page 3
Provision for credit losses for the first quarter of 2004 was $235.0 million, a decrease of
$100.0 million (29.9 percent) from the first quarter of 2003. Net charge-offs in the first quarter of
2004 were $233.9 million, compared with the fourth quarter of 2003 net charge-offs of $285.1
million and the first quarter of 2003 net charge-offs of $333.8 million. The decline in losses from
a year ago was primarily the result of an improving credit risk profile and collection efforts. Total
nonperforming assets declined to $1,046.6 million at March 31, 2004, from $1,148.1 million at
December 31, 2003 (8.8 percent), and $1,362.6 million at March 31, 2003 (23.2 percent). The
ratio of the allowance for credit losses to nonperforming loans was 258 percent at March 31, 2004,
compared with 232 percent at December 31, 2003, and 194 percent at March 31, 2003.
On December 31, 2003, the Company completed the spin-off of Piper Jaffray Companies
(NYSE: PJC). In connection with the spin-off, accounting rules require that the financial
statements be restated for all prior periods. As such, historical financial results related to Piper
Jaffray Companies have been segregated and accounted for in the Company’s financial statements
as discontinued operations. Net income in the first quarter of 2003 and fourth quarter of 2003
included after-tax income from the discontinued operations of Piper Jaffray Companies of $.7
million and $6.7 million, respectively, which had an immaterial impact on diluted earnings per
share.
(MORE)
4. U.S. Bancorp Reports First Quarter 2004 Results
April 20, 2004
Page 4
Table 2
INCOME STATEMENT HIGHLIGHTS
(Taxable-equivalent basis, $ in millions, Percent Percent
except per-share data) Change Change
1Q 4Q 1Q 1Q04 vs 1Q04 vs
2004 2003 2003 4Q03 1Q03
Net interest income $1,779.0 $1,816.7 $1,776.7 (2.1) 0.1
Noninterest income 1,318.3 1,296.6 1,366.1 1.7 (3.5)
Total net revenue 3,097.3 3,113.3 3,142.8 (0.5) (1.4)
Noninterest expense 1,454.9 1,342.4 1,454.6 8.4 --
Provision for credit losses 235.0 286.0 335.0 (17.8) (29.9)
Income from continuing operations before income taxes 1,407.4 1,484.9 1,353.2 (5.2) 4.0
Taxable-equivalent adjustment 7.2 7.2 7.3 -- (1.4)
Applicable income taxes 391.8 507.4 461.8 (22.8) (15.2)
Income from continuing operations 1,008.4 970.3 884.1 3.9 14.1
Income from discontinued operations (after-tax) -- 6.7 0.7 nm nm
Net income $1,008.4 $977.0 $884.8 3.2 14.0
Diluted earnings per share:
Income from continuing operations $0.52 $0.50 $0.46 4.0 13.0
Discontinued operations -- -- -- -- --
Net income $0.52 $0.50 $0.46 4.0 13.0
Net Interest Income
First quarter net interest income on a taxable-equivalent basis was $1,779.0 million,
compared with $1,776.7 million recorded in the first quarter of 2003. Average earning assets for
the period increased over the first quarter of 2003 by $10.2 billion (6.6 percent), primarily driven
by increases in investment securities, residential mortgages, and retail loans, partially offset by a
decline in commercial loans and loans held for sale related to mortgage banking activities. The net
interest margin in the first quarter of 2004 was 4.29 percent, compared with 4.42 percent in the
fourth quarter of 2003 and 4.59 percent in the first quarter of 2003. The decline in the net interest
margin in the first quarter of 2004 from the first quarter of 2003 primarily reflected growth in
lower-yielding investment securities as a percent of total earning assets, a change in loan mix, and
a decline in the margin benefit from net free funds due to lower interest rates. In addition, the net
interest margin declined year-over-year as a result of consolidating high credit quality, low margin
(MORE)
5. U.S. Bancorp Reports First Quarter 2004 Results
April 20, 2004
Page 5
loans from Stellar Funding Group, Inc., a commercial loan conduit, onto the Company’s balance
sheet during the third quarter of 2003. The decline in the net interest margin in the first quarter of
2004 from the fourth quarter of 2003 reflected a similar change in earning asset mix.
NET INTEREST INCOME Table 3
(Taxable-equivalent basis; $ in millions)
Change Change
1Q 4Q 1Q 1Q04 vs 1Q04 vs
2004 2003 2003 4Q03 1Q03
Components of net interest income
Income on earning assets $2,265.3 $2,294.9 $2,338.5 $ (29.6) $ (73.2)
Expense on interest-bearing liabilities 486.3 478.2 561.8 8.1 (75.5)
Net interest income $1,779.0 $1,816.7 $1,776.7 $ (37.7) $ 2.3
Average yields and rates paid
Earning assets yield 5.47 % 5.58 % 6.05 % (0.11) % (0.58) %
Rate paid on interest-bearing liabilities 1.45 1.44 1.82 0.01 (0.37)
Gross interest margin 4.02 % 4.14 % 4.23 % (0.12) % (0.21) %
Net interest margin 4.29 % 4.42 % 4.59 % (0.13) % (0.30) %
Average balances
Investment securities $44,744 $40,774 $34,220 $3,970 $10,524
Loans 118,810 119,300 116,311 (490) 2,499
Earning assets 166,359 163,705 156,126 2,654 10,233
Interest-bearing liabilities 134,966 131,990 124,669 2,976 10,297
Net free funds* 31,393 31,715 31,457 (322) (64)
* Represents noninterest-bearing deposits, allowance for loan losses, unrealized gain (loss)
on available-for-sale securities, non-earning assets, other non-interest bearing liabilities and equity
(MORE)
6. U.S. Bancorp Reports First Quarter 2004 Results
April 20, 2004
Page 6
Table 4
AVERAGE LOANS
($ in millions) Percent Percent
Change Change
1Q 4Q 1Q 1Q04 vs 1Q04 vs
2004 2003 2003 4Q03 1Q03
Commercial $33,629 $35,080 $36,339 (4.1) (7.5)
Lease financing 4,902 4,959 5,251 (1.1) (6.6)
Total commercial 38,531 40,039 41,590 (3.8) (7.4)
Commercial mortgages 20,554 20,230 20,241 1.6 1.5
Construction and development 6,556 7,060 6,542 (7.1) 0.2
Total commercial real estate 27,110 27,290 26,783 (0.7) 1.2
Residential mortgages 13,610 13,374 10,124 1.8 34.4
Credit card 5,878 5,713 5,389 2.9 9.1
Retail leasing 6,192 5,895 5,750 5.0 7.7
Home equity and second mortgages 13,376 13,084 13,470 2.2 (0.7)
Other retail 14,113 13,905 13,205 1.5 6.9
Total retail 39,559 38,597 37,814 2.5 4.6
Total loans $118,810 $119,300 $116,311 (0.4) 2.1
Average loans for the first quarter of 2004 were $2.5 billion (2.1 percent) higher than the first
quarter of 2003, primarily due to growth in average residential mortgages of $3.5 billion (34.4
percent) and retail loans of $1.7 billion (4.6 percent) year-over-year. Total commercial loans
declined by $3.1 billion (7.4 percent), while total commercial real estate loans increased by $327
million (1.2 percent). Although the consolidation of loans from the Stellar commercial loan
conduit had a positive impact on average loan balances year-over-year, soft economic conditions
throughout much of 2003 led to the overall decrease in total commercial loans. Average loans for
the first quarter of 2004 were lower than the fourth quarter of 2003 by $490 million (.4 percent),
reflecting reductions in commercial and commercial real estate loans, partially offset by growth in
both residential mortgages and retail loans. While average commercial loans declined for the
quarter, the Company’s ending commercial loan balances increased by $480 million from
December 31, 2003.
Average investment securities in the first quarter of 2004 were $10.5 billion (30.8 percent)
higher than the first quarter of 2003, reflecting the reinvestment of proceeds from declining
(MORE)
7. U.S. Bancorp Reports First Quarter 2004 Results
April 20, 2004
Page 7
commercial loan balances and deposit growth from a year ago. Investment securities at March 31,
2004, were $15.0 billion higher than at March 31, 2003, and $2.1 billion higher than the balance at
December 31, 2003. During the first quarter of 2004, the Company continued to acquire floating-
rate securities and shorter-term fixed-rate securities as part of its asset/liability management
activities.
Table 5
AVERAGE DEPOSITS
($ in millions) Percent Percent
Change Change
1Q 4Q 1Q 1Q04 vs 1Q04 vs
2004 2003 2003 4Q03 1Q03
Noninterest-bearing deposits $29,025 $29,647 $32,824 (2.1) (11.6)
Interest-bearing deposits
Interest checking 20,948 20,595 17,536 1.7 19.5
Money market accounts 34,397 35,351 28,683 (2.7) 19.9
Savings accounts 5,898 5,708 5,272 3.3 11.9
Savings products 61,243 61,654 51,491 (0.7) 18.9
Time certificates of deposit less
than $100,000 13,618 14,182 17,218 (4.0) (20.9)
Time deposits greater than $100,000 12,133 10,786 14,282 12.5 (15.0)
Total interest-bearing deposits 86,994 86,622 82,991 0.4 4.8
Total deposits $116,019 $116,269 $115,815 (0.2) 0.2
Average noninterest-bearing deposits for the first quarter of 2004 were lower than the first
quarter of 2003 by $3.8 billion (11.6 percent). The change was primarily due to lower deposits
associated with mortgage banking activities and a decline in Federal government deposits related
to their decision in the third quarter of 2003 to pay for treasury management services rather than
maintain compensating balances. Average interest-bearing deposits increased by $4.0 billion (4.8
percent) over the first quarter of 2003, driven by increases in savings products balances, partially
offset by decreases in time certificates of deposit less than $100,000 and time deposits greater than
$100,000.
Average noninterest-bearing deposits for the first quarter of 2004 were $622 million (2.1
percent) lower than the fourth quarter of 2003 due to lower deposits associated with mortgage
banking activities and corporate banking. Average interest-bearing deposits were slightly higher
than the fourth quarter of 2003 (.4 percent), primarily due to increases in time deposits greater than
(MORE)
8. U.S. Bancorp Reports First Quarter 2004 Results
April 20, 2004
Page 8
$100,000, interest checking and savings accounts, partially offset by decreases in money market
accounts and time certificates of deposit less than $100,000. Noninterest-bearing deposits at
March 31, 2004, were lower than at March 31, 2003, by $3.4 billion (9.8 percent) and were $1.4
billion (4.3 percent) lower than at December 31, 2003.
Table 6
NONINTEREST INCOME
($ in millions) Percent Percent
Change Change
1Q 4Q 1Q 1Q04 vs 1Q04 vs
2004 2003 2003 4Q03 1Q03
Credit and debit card revenue $141.8 $153.4 $127.4 (7.6) 11.3
Corporate payment products revenue 94.8 88.7 86.0 6.9 10.2
ATM processing services 42.2 40.3 42.4 4.7 (0.5)
Merchant processing services 141.1 146.0 127.3 (3.4) 10.8
Trust and investment management fees 248.6 246.6 228.6 0.8 8.7
Deposit service charges 185.2 186.6 163.2 (0.8) 13.5
Treasury management fees 117.5 116.3 112.0 1.0 4.9
Commercial products revenue 110.4 98.5 104.2 12.1 6.0
Mortgage banking revenue 94.2 91.9 95.4 2.5 (1.3)
Investment products fees and commissions 39.3 36.2 35.1 8.6 12.0
Securities gains (losses), net -- (0.1) 140.7 nm nm
Other 103.2 92.2 103.8 11.9 (0.6)
Total noninterest income $1,318.3 $1,296.6 $1,366.1 1.7 (3.5)
Noninterest Income
First quarter noninterest income was $1,318.3 million, a decrease of $47.8 million (3.5
percent) from the same quarter of 2003, and a $21.7 million (1.7 percent) increase over the fourth
quarter of 2003. The decline in noninterest income in the first quarter of 2004 from the first
quarter of 2003 was driven by a $140.7 million reduction in gains on the sale of securities, partially
offset by increases in most other categories of noninterest income. Credit and debit card revenue
and corporate payment products revenue were higher in the first quarter of 2004 than the first
quarter of 2003 by $14.4 million (11.3 percent) and $8.8 million (10.2 percent), respectively.
Although credit and debit card revenue grew year-over-year, the growth was somewhat muted due
to the impact of the settlement of the antitrust litigation brought against VISA USA and Mastercard
by Wal-Mart Stores, Inc., Sears Roebuck & Co. and other retailers, which lowered the interchange
(MORE)
9. U.S. Bancorp Reports First Quarter 2004 Results
April 20, 2004
Page 9
rate on signature debit transactions beginning in August 2003. The year-over-year impact of the
VISA settlement on credit and debit card revenue was approximately $8.2 million. This change in
the interchange rate, in addition to higher customer loyalty rewards expenses, however, were more
than offset by increases in transaction volumes and other rate adjustments. The corporate payment
products revenue growth reflected growth in sales and card usage. Merchant processing services
revenue was higher in the first quarter of 2004 than the same quarter of 2003 by $13.8 million
(10.8 percent), reflecting an increase in transaction volume, partially offset by lower processing
spreads due to a change in the mix of merchants. The favorable variance in trust and investment
management fees of $20.0 million (8.7 percent) in the first quarter of 2004 over the same period of
2003 was principally driven by higher equity market valuations year-over-year. Deposit service
charges were higher year-over-year by $22.0 million (13.5 percent) due to account growth and
revenue enhancement initiatives. Treasury management fees grew by $5.5 million (4.9 percent) in
the first quarter of 2004 over the same period of 2003. The increase in treasury management fees
year-over-year was partially driven by a change during the third quarter of 2003 in the Federal
government’s payment methodology for treasury management services from compensating
balances, reflected in net interest income, to fees. Commercial products revenue increased by $6.2
million (6.0 percent) over the first quarter of 2003 due to higher letter of credit, foreign exchange,
syndication, and leasing fees, partially offset by a reduction in conduit servicing revenue. The $4.2
million (12.0 percent) increase in investment products fees and commissions reflected higher sales
activity in the Consumer Banking business line. Offsetting these favorable variances were slight
declines in mortgage banking revenue and other income year-over-year.
Noninterest income increased in the first quarter of 2004 by $21.7 million (1.7 percent) over
the fourth quarter of 2003, the net result of favorable variances in corporate payment products
revenue, ATM processing services, trust and investment management fees, treasury management
fees, commercial products revenue, mortgage banking revenue, investment products fees and
commissions and other income, partially offset by seasonally lower credit and debit card revenue
and merchant processing services. Corporate payment products revenue, ATM processing
services, commercial products revenue, and investment products fees and commissions rose due to
higher processing volumes and product sales. Mortgage banking revenue increased due to higher
servicing fee income, partially offset by lower fees from originations and loan sales. Other income
was higher by $11.0 million (11.9 percent), the net result of lower end of term lease residual losses
(MORE)
10. U.S. Bancorp Reports First Quarter 2004 Results
April 20, 2004
Page 10
partially offset by a decrease in revenue from equity investments relative to the fourth quarter of
2003.
Table 7
NONINTEREST EXPENSE
($ in millions) Percent Percent
Change Change
1Q 4Q 1Q 1Q04 vs 1Q04 vs
2004 2003 2003 4Q03 1Q03
Compensation $535.8 $539.4 $546.0 (0.7) (1.9)
Employee benefits 100.2 81.3 91.7 23.2 9.3
Net occupancy and equipment 155.7 161.6 161.3 (3.7) (3.5)
Professional services 32.4 44.2 26.4 (26.7) 22.7
Marketing and business development 35.3 50.8 29.8 (30.5) 18.5
Technology and communications 101.7 106.3 104.9 (4.3) (3.1)
Postage, printing and supplies 61.6 61.8 60.4 (0.3) 2.0
Other intangibles 226.1 124.2 235.1 82.0 (3.8)
Merger and restructuring-related charges -- 7.6 17.6 nm nm
Other 206.1 165.2 181.4 24.8 13.6
Total noninterest expense $1,454.9 $1,342.4 $1,454.6 8.4 --
Noninterest Expense
First quarter noninterest expense totaled $1,454.9 million, essentially flat to noninterest
expense for the first quarter of 2003. Favorable variances in merger and restructuring-related
charges of $17.6 million and other intangibles of $9.0 million (3.8 percent), along with general cost
savings from completed integration activities were offset by increases in employee benefits,
professional services, marketing and business development, postage, printing and supplies and
other expense. Other expense in the first quarter of 2004 included a $35.4 million charge related to
the prepayment of a portion of the Company’s debt.
Noninterest expense in the first quarter of 2004 was higher than the fourth quarter of 2003 by
$112.5 million (8.4 percent). The unfavorable variance from the fourth quarter of 2003 was
primarily due to the recognition of $109.3 million of MSR impairment and a $35.4 million charge
in other expense related to the prepayment of a portion of the Company’s debt in the first quarter of
2004. The fourth quarter of 2003 did not include expense related to changes in MSR valuations.
In addition, seasonally high payroll taxes contributed to the unfavorable variance in employee
(MORE)
11. U.S. Bancorp Reports First Quarter 2004 Results
April 20, 2004
Page 11
benefits quarter-over-quarter. Partially offsetting these variances were reductions in all other
expense categories, reflecting on-going expense management activities.
(MORE)
12. U.S. Bancorp Reports First Quarter 2004 Results
April 20, 2004
Page 12
Table 8
ALLOWANCE FOR CREDIT LOSSES
($ in millions) 1Q 4Q 3Q 2Q 1Q
2004 2003 2003 2003 2003
Balance, beginning of period $2,368.6 $2,367.7 $2,367.6 $2,408.5 $2,422.0
Net charge-offs
Commercial 53.6 100.9 123.9 122.9 137.9
Lease financing 21.3 14.9 19.2 26.9 23.0
Total commercial 74.9 115.8 143.1 149.8 160.9
Commercial mortgages 4.6 10.0 5.9 9.3 2.9
Construction and development 4.7 2.9 4.6 2.5 1.0
Total commercial real estate 9.3 12.9 10.5 11.8 3.9
Residential mortgages 7.3 7.2 7.3 6.5 5.9
Credit card 63.4 62.3 59.3 64.5 68.7
Retail leasing 11.0 11.3 12.2 12.6 13.9
Home equity and second mortgages 19.5 20.4 23.2 23.9 25.4
Other retail 48.5 55.2 54.3 53.8 55.1
Total retail 142.4 149.2 149.0 154.8 163.1
Total net charge-offs 233.9 285.1 309.9 322.9 333.8
Provision for credit losses 235.0 286.0 310.0 323.0 335.0
Acquisitions and other changes -- -- -- (41.0) (14.7)
Balance, end of period $2,369.7 $2,368.6 $2,367.7 $2,367.6 $2,408.5
Components
Allowance for loan losses $2,238.3 $2,235.0 $2,241.2 $2,266.2 $2,295.0
Liability for unfunded credit commitments * 131.4 133.6 126.5 101.4 113.5
Total allowance for credit losses $2,369.7 $2,368.6 $2,367.7 $2,367.6 $2,408.5
Net charge-offs to average loans (%) 0.79 0.95 1.02 1.10 1.16
Allowance for credit losses as a percentage of:
Period-end loans 1.98 2.00 1.98 1.98 2.06
Nonperforming loans 258 232 202 194 194
Nonperforming assets 226 206 180 174 177
* During the first quarter of 2004, the Company reclassified the portion of its allowance for credit losses related to commercial
off-balance sheet loan commitments and letters of credit to a separate liability account.
Credit Quality
The allowance for credit losses was $2,369.7 million at March 31, 2004, compared with the
allowance for credit losses of $2,368.6 million at December 31, 2003, and $2,408.5 million at
March 31, 2003. The ratio of the allowance for credit losses to period-end loans was 1.98 percent
at March 31, 2004, compared with 2.00 percent at December 31, 2003, and 2.06 percent at March
(MORE)
13. U.S. Bancorp Reports First Quarter 2004 Results
April 20, 2004
Page 13
31, 2003. The ratio of the allowance for credit losses to nonperforming loans was 258 percent at
March 31, 2004, compared with 232 percent at December 31, 2003, and 194 percent at March 31,
2003. Total net charge-offs in the first quarter of 2004 were $233.9 million, compared with the
fourth quarter of 2003 net charge-offs of $285.1 million and the first quarter of 2003 net charge-
offs of $333.8 million.
Commercial and commercial real estate loan net charge-offs were $84.2 million for the first
quarter of 2004, or .52 percent of average loans outstanding, compared with $128.7 million, or .76
percent of average loans outstanding, in the fourth quarter of 2003 and $164.8 million, or .98
percent of average loans outstanding, in the first quarter of 2003. The decline in net charge-offs
was broad-based across most industries within the commercial loan portfolio.
Retail loan net charge-offs of $142.4 million in the first quarter of 2004 were $6.8 million (4.6
percent) lower than the fourth quarter of 2003 and $20.7 million (12.7 percent) lower than the first
quarter of 2003. Retail loan net charge-offs as a percent of average loans outstanding were 1.45
percent in the first quarter of 2004, compared with 1.53 percent and 1.75 percent in the fourth
quarter of 2003 and first quarter of 2003, respectively. Lower levels of retail loan net charges-offs
principally reflected the Company’s improvement in ongoing collection efforts and risk
management.
(MORE)
14. U.S. Bancorp Reports First Quarter 2004 Results
April 20, 2004
Page 14
CREDIT RATIOS Table 9
(Percent) 1Q 4Q 3Q 2Q 1Q
2004 2003 2003 2003 2003
Net charge-offs ratios*
Commercial 0.64 1.14 1.33 1.35 1.54
Lease financing 1.75 1.19 1.52 2.11 1.78
Total commercial 0.78 1.15 1.35 1.44 1.57
Commercial mortgages 0.09 0.20 0.12 0.19 0.06
Construction and development 0.29 0.16 0.25 0.14 0.06
Total commercial real estate 0.14 0.19 0.15 0.17 0.06
Residential mortgages 0.22 0.21 0.24 0.24 0.24
Credit card 4.34 4.33 4.20 4.80 5.17
Retail leasing 0.71 0.76 0.83 0.88 0.98
Home equity and second mortgages 0.59 0.62 0.70 0.72 0.76
Other retail 1.38 1.57 1.55 1.59 1.69
Total retail 1.45 1.53 1.54 1.63 1.75
Total net charge-offs 0.79 0.95 1.02 1.10 1.16
Delinquent loan ratios - 90 days or more past due excluding nonperforming loans**
Commercial 0.06 0.06 0.11 0.09 0.10
Commercial real estate 0.01 0.02 0.01 0.02 0.03
Residential mortgages 0.56 0.61 0.63 0.65 0.82
Retail 0.54 0.56 0.57 0.63 0.71
Total loans 0.27 0.28 0.29 0.30 0.34
Delinquent loan ratios - 90 days or more past due including nonperforming loans**
Commercial 1.67 1.97 2.31 2.27 2.33
Commercial real estate 0.85 0.82 0.75 0.82 0.85
Residential mortgages 0.87 0.91 0.98 1.13 1.37
Retail 0.59 0.62 0.63 0.70 0.77
Total loans 1.03 1.14 1.27 1.32 1.40
* annualized and calculated on average loan balances
** ratios are expressed as a percent of ending loan balances
The overall level of net charge-offs in the first quarter of 2004 reflected the Company’s
ongoing efforts to reduce the overall risk profile of the organization. Net charge-offs are expected
to continue to trend modestly lower.
(MORE)
15. U.S. Bancorp Reports First Quarter 2004 Results
April 20, 2004
Page 15
ASSET QUALITY Table 10
($ in millions)
Mar 31 Dec 31 Sep 30 Jun 30 Mar 31
2004 2003 2003 2003 2003
Nonperforming loans
Commercial $510.7 $623.5 $793.9 $795.2 $808.4
Lease financing 115.6 113.3 111.6 126.6 129.4
Total commercial 626.3 736.8 905.5 921.8 937.8
Commercial mortgages 184.9 177.6 161.5 182.0 174.6
Construction and development 43.6 39.9 40.2 35.3 46.1
Commercial real estate 228.5 217.5 201.7 217.3 220.7
Residential mortgages 42.1 40.5 46.1 56.0 57.4
Retail 20.4 25.2 21.6 24.2 23.9
Total nonperforming loans 917.3 1,020.0 1,174.9 1,219.3 1,239.8
Other real estate 76.0 72.6 70.4 71.5 66.2
Other nonperforming assets 53.3 55.5 73.0 68.9 56.6
Total nonperforming assets* $1,046.6 $1,148.1 $1,318.3 $1,359.7 $1,362.6
Accruing loans 90 days or more past due $319.2 $329.4 $352.4 $360.7 $403.5
Nonperforming assets to loans
plus ORE (%) 0.87 0.97 1.10 1.14 1.16
*does not include accruing loans 90 days or more past due
Nonperforming assets at March 31, 2004, totaled $1,046.6 million, compared with $1,148.1
million at December 31, 2003, and $1,362.6 million at March 31, 2003. The ratio of
nonperforming assets to loans and other real estate was .87 percent at March 31, 2004, compared
with .97 percent at December 31, 2003, and 1.16 percent at March 31, 2003. Given the Company’s
ongoing efforts to reduce the overall risk profile of the organization, nonperforming assets are
expected to continue to trend lower.
(MORE)
16. U.S. Bancorp Reports First Quarter 2004 Results
April 20, 2004
Page 16
Table 11
CAPITAL POSITION
($ in millions) Mar 31 Dec 31 Sep 30 Jun 30 Mar 31
2004 2003 2003 2003 2003
Total shareholders' equity $19,452 $19,242 $19,771 $19,521 $18,862
Tier 1 capital 14,499 14,623 14,589 13,950 13,215
Total risk-based capital 21,559 21,710 21,859 21,392 20,242
Common equity to assets 10.1 % 10.2 % 10.5 % 10.0 % 10.4 %
Tangible common equity to assets 6.4 6.5 6.6 6.0 6.0
Tier 1 capital ratio 8.9 9.1 9.0 8.5 8.2
Total risk-based capital ratio 13.3 13.6 13.5 13.0 12.6
Leverage ratio 8.0 8.0 8.0 7.8 7.6
Total shareholders’ equity was $19.5 billion at March 31, 2004, compared with $18.9
billion at March 31, 2003. The increase was the result of corporate earnings offset primarily by
dividends, including the special dividend of $685 million related to the spin-off of Piper Jaffray
Companies, and share buybacks.
Tangible common equity to assets was 6.4 percent at March 31, 2004, compared with 6.5
percent at December 31, 2003, and 6.0 percent at March 31, 2003. The Tier 1 capital ratio was 8.9
percent at March 31, 2004, compared with 9.1 percent at December 31, 2003, and 8.2 percent at
March 31, 2003. The total risk-based capital ratio was 13.3 percent at March 31, 2004, compared
with 13.6 percent at December 31, 2003, and 12.6 percent at March 31, 2003. The leverage ratio
was 8.0 percent at March 31, 2004, compared with 8.0 percent at December 31, 2003, and 7.6
percent at March 31, 2003. All regulatory ratios continue to be in excess of stated “well
capitalized” requirements.
(MORE)
17. U.S. Bancorp Reports First Quarter 2004 Results
April 20, 2004
Page 17
Table 12
COMMON SHARES
(Millions) 1Q 4Q 3Q 2Q 1Q
2004 2003 2003 2003 2003
Beginning shares outstanding 1,922.9 1,927.4 1,924.5 1,919.0 1,917.0
Shares issued for stock option and stock purchase
plans, acquisitions and other corporate purposes 12.1 10.5 2.9 5.5 2.0
Shares repurchased (33.8) (15.0) -- -- --
Ending shares outstanding 1,901.2 1,922.9 1,927.4 1,924.5 1,919.0
On December 16, 2003, the board of directors of U.S. Bancorp approved an authorization
to repurchase 150 million shares of outstanding common stock during the following 24 months.
During the first quarter of 2004, the Company repurchased 33.8 million shares of common stock in
both open market and privately negotiated transactions. As of March 31, 2004, there were
approximately 108 million shares remaining to be repurchased under the current authorization.
(MORE)
18. U.S. Bancorp Reports First Quarter 2004 Results
April 20, 2004
Page 18
Table 13
LINE OF BUSINESS FINANCIAL PERFORMANCE*
($ in millions)
Net Operating Earnings** Percent Change 1Q 2004
1Q 4Q 1Q 1Q04 vs 1Q04 vs Earnings
Business Line 2004 2003 2003 4Q03 1Q03 Composition
Wholesale Banking $264.7 $234.8 $226.0 12.7 17.1 26 %
Consumer Banking*** 321.2 367.7 349.5 (12.6) (8.1) 32
Private Client, Trust
and Asset Management 123.8 117.6 98.0 5.3 26.3 12
Payment Services 160.5 163.3 132.9 (1.7) 20.8 16
Treasury and Corporate Support 138.2 91.9 89.2 50.4 54.9 14
Consolidated Company $1,008.4 $975.3 $895.6 3.4 12.6 100 %
* preliminary data
** earnings before merger and restructuring-related items and discontinued operations
*** In 1Q04 Consumer Banking's retail banking business grew net operating earnings by 8.5 percent and 18.6 percent over
4Q03 and 1Q03, respectively. The Consumer Bank's mortgage banking business profitability declined in 1Q04 due to
MSR impairment of $109.3 million that was not offset by realizing securities gains in the quarter.
Lines of Business
Within the Company, financial performance is measured by major lines of business which
include Wholesale Banking, Consumer Banking, Private Client, Trust and Asset Management,
Payment Services, and Treasury and Corporate Support. These operating segments are
components of the Company about which financial information is available and is evaluated
regularly in deciding how to allocate resources and assess performance. Designations, assignments
and allocations may change from time to time as management systems are enhanced, methods of
evaluating performance or product lines change or business segments are realigned to better
respond to our diverse customer base. During 2004, a methodology change was made to allocate
operational expenses incurred by Treasury and Corporate Support on behalf of the other major
lines of business back to the appropriate operating segment. These allocations are identified as net
shared services expense on the business lines’ income statements. Accordingly, results for 2003
have been restated and presented on a comparable basis.
Wholesale Banking offers lending, depository, treasury management and other financial
services to middle market, large corporate and public sector clients. Wholesale Banking
(MORE)
19. U.S. Bancorp Reports First Quarter 2004 Results
April 20, 2004
Page 19
contributed $264.7 million of the Company’s operating earnings in the first quarter of 2004, a 17.1
percent increase over the same period of 2003 and a 12.7 percent increase over the fourth quarter
of 2003. The increase in Wholesale Banking’s first quarter 2004 contribution over the first quarter
of 2003 was the result of favorable variances in total noninterest expense (5.5 percent) and the
provision for credit losses (70.4 percent), partially offset by a decrease in total net revenue (4.6
percent). Total net revenue in the first quarter of 2004 was lower than in the first quarter of 2003,
reflecting unfavorable variances in both net interest income (5.3 percent) and noninterest income
(3.4 percent). The decrease in net interest income was primarily due to declines in average total
loans outstanding (6.2 percent), partially offset by higher average total deposits (4.6 percent).
Although treasury management fees were higher (9.7 percent) year-over-year, the growth was more
than offset by unfavorable variances in commercial products revenue (5.9 percent), primarily
conduit servicing fees, and other revenue. The increase in treasury management fees was
principally driven by a change during the third quarter of 2003 in the Federal government’s
payment methodology for treasury management services from compensating balances to fees.
Wholesale Banking’s favorable variance in total noninterest expense year-over-year was driven by
a decrease in other expense, the result of lower loan workout-related expense relative to the first
quarter of 2003, partially offset by an increase in net shared services expense, which is primarily
driven by customer transaction volume and account activities. The decrease in the provision for
credit losses year-over-year was the result of a reduction in net charge-offs. The increase in
Wholesale Banking’s contribution to operating earnings in the first quarter of 2004 over the fourth
quarter of 2003 was the net result of favorable variances in total noninterest expense (4.4 percent)
and the provision for credit losses, partially offset by slightly lower total net revenue (.2 percent).
Total net revenue in the first quarter of 2004 was lower than the previous quarter due to lower net
interest income (2.8 percent) partially offset by growth in noninterest income (5.6 percent). The
change in net interest income reflected reductions from the prior quarter in the business line’s
average loans outstanding and average deposits. The growth quarter-to-quarter in noninterest
income was attributed to higher commercial products revenue, primarily syndication revenue, lease
residual gains and letter of credit fees. The decrease in noninterest expense was principally due to
lower loan-related expense. Lower net charge-offs from improving credit quality drove the
favorable variance in provision for credit losses.
(MORE)
20. U.S. Bancorp Reports First Quarter 2004 Results
April 20, 2004
Page 20
Consumer Banking delivers products and services to the broad consumer market and small
businesses through banking offices, telemarketing, on-line services, direct mail and automated
teller machines (“ATMs”). It encompasses community banking, metropolitan banking, small
business banking, including lending guaranteed by the Small Business Administration, small-ticket
leasing, consumer lending, mortgage banking, workplace banking, student banking, 24-hour
banking, and investment product and insurance sales. Consumer Banking contributed $321.2
million of the Company’s operating earnings in the first quarter of 2004, an 8.1 percent decrease
from the same period of 2003 and a 12.6 percent decline from the fourth quarter of 2003. While
the retail banking business segment grew net operating earnings by 18.6 percent and 8.5 percent
over the first quarter of 2003 and the fourth quarter of 2003, respectively, the contribution of the
mortgage banking business declined. The decrease in the mortgage banking business from the first
quarter of 2003 was primarily the result of a reduction in gains on the sale of securities of $105.8
million that, generally, are utilized by the Company to offset impairment of mortgage servicing
rights. In the first quarter of 2004, the Company elected not to sell higher yielding securities to
offset MSR impairment within the mortgage banking business segment.
For the Consumer Banking business, as a whole, the unfavorable variance in gains on the sale
of securities was partially offset with favorable variances in net interest income (.4 percent),
noninterest income (9.7 percent), total noninterest expense (2.2 percent) and the provision for
credit losses (3.9 percent). Net interest income improved year-over-year (.4 percent), the result of
increases in average loans and average core deposits, partially offset by a decline in the business
line’s net interest margin. Noninterest income also improved in the first quarter of 2004 over the
same period of 2003, primarily due to growth in deposit service charges, investment products fees
and commissions and other revenue. Other revenue was higher due to lower lease residual losses
relative to the first quarter of 2003. Total noninterest expense in the first quarter of 2004 was
lower than the first quarter of 2003 (2.2 percent), mainly due to favorable changes in net shared
services expense and lower MSR impairment relative to 2003. A reduction in net charge-offs year-
over-year drove the positive variance in the business line’s provision for credit losses. The decline
in Consumer Banking’s contribution in the first quarter of 2004 from the fourth quarter of 2003
was primarily the result of the recognition of $109.3 million of MSR impairment in 2004.
Offsetting this unfavorable variance were positive changes in total net revenue (1.0 percent),
noninterest expense (3.8 percent) and the provision for credit losses (1.2 percent).
(MORE)
21. U.S. Bancorp Reports First Quarter 2004 Results
April 20, 2004
Page 21
Private Client, Trust and Asset Management provides trust, private banking, financial
advisory, investment management and mutual fund and alternative investment product services
through five businesses: Private Client Group, Corporate Trust, Asset Management, Institutional
Trust, and Custody and Fund Services, LLC. Private Client, Trust and Asset Management
contributed $123.8 million of the Company’s operating earnings in the first quarter of 2004, 26.3
percent higher than the same period of 2003 and 5.3 percent higher than the fourth quarter of 2003.
The favorable variance in the business line’s contribution in the first quarter of 2004 over the first
quarter of 2003 was the result of favorable variances in total net revenue (12.0 percent) and total
noninterest expense (2.1 percent). Higher average total deposit balances (45.5 percent) favorably
impacted net interest income year-over-year, while noninterest income benefited from higher asset
management revenue due to improving equity market valuations. The favorable variance in
expense was primarily due to business line cost savings year-over-year and slightly lower
intangible amortization. The increase in the business line’s contribution (5.3 percent) in the first
quarter of 2004 over the fourth quarter of 2003 was the result of higher total net revenue (2.0
percent), lower total noninterest expense (1.4 percent) and a decrease in the provision for credit
losses. The increase in net interest income from the fourth quarter of 2003 to the first quarter of
2004 was primarily driven by an increase in average total deposits (8.2 percent), while noninterest
income benefited from higher equity market valuations.
Payment Services includes consumer and business credit cards, corporate and purchasing
card services, consumer lines of credit, ATM processing, merchant processing, and debit cards.
Payment Services contributed $160.5 million of the Company’s operating earnings in the first
quarter of 2004, a 20.8 percent increase over the same period of 2003, but a 1.7 percent decrease
over the fourth quarter of 2003. The increase in Payment Services’ contribution in the first quarter
of 2004 from the same period of 2003 was the result of higher total net revenue (5.2 percent) and a
lower provision for credit losses (14.6 percent). The increase in total net revenue year-over-year
was primarily due to growth in noninterest income (10.5 percent), partially offset by lower net
interest income (7.1 percent), which reflected lower spreads on retail credit cards and a reduction
in late fees relative to the prior year’s quarter. The increase in noninterest income was principally
the result of growth in credit and debit card revenue (11.1 percent), corporate payment products
revenue (10.2 percent) and merchant processing services revenue (10.8 percent). Although credit
and debit card revenue was negatively impacted in the first quarter of 2004 by the VISA debit card
(MORE)
22. U.S. Bancorp Reports First Quarter 2004 Results
April 20, 2004
Page 22
settlement and higher customer loyalty rewards expense, increases in transaction volumes and
other rate adjustments more than offset these detrimental changes. The decrease in Payment
Services’ contribution in the first quarter of 2004 from the fourth quarter of 2003 was primarily
due to seasonally lower total net revenue (2.1 percent), offset by a reduction in the provision for
credit losses, the result of a favorable change in net charge-offs.
Treasury and Corporate Support includes the Company’s investment portfolios, funding,
capital management and asset securitization activities, interest rate risk management, the net effect
of transfer pricing related to average balances and business activities managed on a corporate basis,
including enterprise-wide operations and administrative support functions. Operational expenses
incurred by Treasury and Corporate Support on behalf of the other business lines are allocated back
primarily based on customer transaction volume and account activities to the appropriate business
unit and are identified as net shared services expense. Treasury and Corporate Support recorded
operating earnings of $138.2 million in the first quarter of 2004, compared with operating earnings
of $89.2 million in the first quarter of 2003 and $91.9 million in the fourth quarter of 2003. The
increase in operating earnings in the current quarter over the first quarter of 2003 was largely the
net result of a $90.0 million reduction in income tax expense related to the resolution of federal tax
examinations for the years 1995 through 1999 and a $35.4 million charge associated with the
prepayment of a portion of the Company’s debt in the first quarter of 2004. In addition, revenue
declined year-over-year due to a $35.8 million decrease in gains on the sale of securities. The
favorable variance in operating earnings in the first quarter of 2004 over the fourth quarter of 2003
was principally the net result of the reduction in income tax expense and the charge associated with
the prepayment of debt, as well as lower revenue from equity investments relative to the fourth
quarter of 2003.
Additional schedules containing more detailed information about the Company’s business line
results are available on the web at usbank.com or by calling Investor Relations at 612-303-0781.
(MORE)
23. U.S. Bancorp Reports First Quarter 2004 Results
April 20, 2004
Page 23
CHAIRMAN, PRESIDENT AND CHIEF EXECUTIVE OFFICER, JERRY A.
GRUNDHOFER, AND VICE CHAIRMAN AND CHIEF FINANCIAL OFFICER, DAVID
M. MOFFETT, WILL HOST A CONFERENCE CALL TO REVIEW THE FINANCIAL
RESULTS ON TUESDAY, April 20, 2004, AT 3:00 p.m. (CDT). To access the conference call,
please dial 800-540-0559 and ask for the U.S. Bancorp earnings conference call. Participants
calling from outside the United States, please call 785-832-1508. For those unable to participate
during the live call, a recording of the call will be available approximately one hour after the
conference call ends on Tuesday, April 20, 2004, and will run through Tuesday, April 27, 2004, at
11:00 p.m. (CDT). To access the recorded message dial 888-276-5315. If calling from outside the
United States, please dial 402-220-2332.
Minneapolis-based U.S. Bancorp (“USB”), with $192 billion in assets, is the 7th largest
financial services holding company in the United States. The company operates 2,275 banking
offices and 4,472 ATMs, and provides a comprehensive line of banking, brokerage, insurance,
investment, mortgage, trust and payment services products to consumers, businesses and
institutions. U.S. Bancorp is the parent company of U.S. Bank. Visit U.S. Bancorp on the web at
usbank.com.
(MORE)
24. U.S. Bancorp Reports First Quarter 2004 Results
April 20, 2004
Page 24
Forward-Looking Statements
This press release contains forward-looking statements. Statements that are not historical
or current facts, including statements about beliefs and expectations, are forward-looking
statements. These statements often include the words “may,” “could,” “would,” “should,”
“believes,” “expects,” “anticipates,” “estimates,” “intends,” “plans,” “targets,” “potentially,”
“probably,” “projects,” “outlook” or similar expressions. These forward-looking statements cover,
among other things, anticipated future revenue and expenses, and the future prospects of the
Company. Forward-looking statements involve inherent risks and uncertainties, and important
factors could cause actual results to differ materially from those anticipated, including the
following, in addition to those contained in the Company's reports on file with the SEC: (i) general
economic or industry conditions could be less favorable than expected, resulting in a deterioration
in credit quality, a change in the allowance for credit losses, or a reduced demand for credit or fee-
based products and services; (ii) changes in the domestic interest rate environment could reduce
net interest income and could increase credit losses; (iii) inflation, changes in securities market
conditions and monetary fluctuations could adversely affect the value or credit quality of the
Company's assets, or the availability and terms of funding necessary to meet the Company's
liquidity needs; (iv) changes in the extensive laws, regulations and policies governing financial
services companies could alter the Company's business environment or affect operations; (v) the
potential need to adapt to industry changes in information technology systems, on which the
Company is highly dependent, could present operational issues or require significant capital
spending; (vi) competitive pressures could intensify and affect the Company's profitability,
including as a result of continued industry consolidation, the increased availability of financial
services from non-banks, technological developments, or bank regulatory reform; (vii) changes in
consumer spending and savings habits could adversely affect the Company’s results of operations;
(viii) changes in the financial performance and condition of the Company’s borrowers could
negatively affect repayment of such borrowers’ loans; (ix) acquisitions may not produce revenue
enhancements or cost savings at levels or within time frames originally anticipated, or may result
in unforeseen integration difficulties; (x) capital investments in the Company's businesses may not
produce expected growth in earnings anticipated at the time of the expenditure; and (xi) acts or
threats of terrorism, and/or political and military actions taken by the U.S. or other governments in
response to acts or threats of terrorism or otherwise could adversely affect general economic or
industry conditions. Forward-looking statements speak only as of the date they are made, and the
Company undertakes no obligation to update them in light of new information or future events.
###
(MORE)
25. U.S. Bancorp
Consolidated Statement Of Income
Three Months Ended
(Dollars and Shares in Millions, Except Per Share Data) March 31,
(Unaudited) 2004 2003
Interest Income
Loans $1,747.0 $1,836.7
Loans held for sale 19.9 59.6
Investment securities
Taxable 464.0 396.1
Non-taxable 5.3 8.9
Other interest income 21.9 29.9
Total interest income 2,258.1 2,331.2
Interest Expense
Deposits 227.0 306.6
Short-term borrowings 49.9 39.5
Long-term debt 185.9 184.3
Company-obligated mandatorily redeemable preferred securities of subsidiary
trusts holding solely the junior subordinated debentures of the parent company 23.5 31.4
Total interest expense 486.3 561.8
Net interest income 1,771.8 1,769.4
Provision for credit losses 235.0 335.0
Net interest income after provision for credit losses 1,536.8 1,434.4
Noninterest Income
Credit and debit card revenue 141.8 127.4
Corporate payment products revenue 94.8 86.0
ATM processing services 42.2 42.4
Merchant processing services 141.1 127.3
Trust and investment management fees 248.6 228.6
Deposit service charges 185.2 163.2
Treasury management fees 117.5 112.0
Commercial products revenue 110.4 104.2
Mortgage banking revenue 94.2 95.4
Investment products fees and commissions 39.3 35.1
Securities gains, net -- 140.7
Other 103.2 103.8
Total noninterest income 1,318.3 1,366.1
Noninterest Expense
Compensation 535.8 546.0
Employee benefits 100.2 91.7
Net occupancy and equipment 155.7 161.3
Professional services 32.4 26.4
Marketing and business development 35.3 29.8
Technology and communications 101.7 104.9
Postage, printing and supplies 61.6 60.4
Other intangibles 226.1 235.1
Merger and restructuring-related charges -- 17.6
Other 206.1 181.4
Total noninterest expense 1,454.9 1,454.6
Income from continuing operations before income taxes 1,400.2 1,345.9
Applicable income taxes 391.8 461.8
Income from continuing operations 1,008.4 884.1
Income (loss) from discontinued operations (after-tax) -- .7
Net income $1,008.4 $884.8
Earnings Per Share
Income from continuing operations $.53 $.46
Discontinued operations -- --
Net income $.53 $.46
Diluted Earnings Per Share
Income from continuing operations $.52 $.46
Discontinued operations -- --
Net income $.52 $.46
Dividends declared per share $.240 $.205
Average common shares 1,915.4 1,919.0
Average diluted common shares 1,941.1 1,925.6
Page 25
26. U.S. Bancorp
Consolidated Ending Balance Sheet
March 31, December 31, March 31,
(Dollars in Millions) 2004 2003 2003
Assets (Unaudited) (Unaudited)
Cash and due from banks $7,177 $8,630 $8,910
Investment securities
Held-to-maturity 137 152 220
Available-for-sale 45,268 43,182 30,231
Loans held for sale 1,644 1,433 3,102
Loans
Commercial 39,006 38,526 42,011
Commercial real estate 27,215 27,242 26,893
Residential mortgages 13,717 13,457 10,329
Retail 39,945 39,010 37,939
Total loans 119,883 118,235 117,172
Less allowance for loan losses (2,238) (2,369) (2,409)
Net loans 117,645 115,866 114,763
Premises and equipment 1,924 1,957 1,655
Customers' liability on acceptances 148 121 140
Goodwill 6,095 6,025 6,332
Other intangible assets 2,025 2,124 2,181
Other assets 10,030 9,796 14,697
Total assets $192,093 $189,286 $182,231
Liabilities and Shareholders' Equity
Deposits
Noninterest-bearing $31,086 $32,470 $34,459
Interest-bearing 74,262 74,749 68,909
Time deposits greater than $100,000 13,616 11,833 11,853
Total deposits 118,964 119,052 115,221
Short-term borrowings 13,431 10,850 6,576
Long-term debt 30,851 31,215 32,068
Junior subordinated debentures issued to unconsolidated
subsidiary trusts * 2,717 2,601 2,983
Acceptances outstanding 148 121 140
Other liabilities 6,530 6,205 6,381
Total liabilities 172,641 170,044 163,369
Shareholders' equity
Common stock 20 20 20
Capital surplus 5,832 5,851 5,823
Retained earnings 15,059 14,508 13,596
Less treasury stock (1,853) (1,205) (1,222)
Other comprehensive income 394 68 645
Total shareholders' equity 19,452 19,242 18,862
Total liabilities and shareholders' equity $192,093 $189,286 $182,231
* Amounts prior to 2004 represented Company-obligated mandatorily redeemable preferred securities. The subsidiary grantor trusts, which
issue mandatorily redeemable preferred securities, were de-consolidated under the provisions of FIN 46 on March 31, 2004.
Page 26
28. U.S. Bancorp
Income Statement Highlights
Financial Results and Ratios on an Operating Basis
(Excluding Merger and Restructuring-Related Items and Discontinued Operations)
Three Months Ended Percent Change v. March 31, 2004
(Dollars in Millions, Except Per Share Data) March 31, December 31, March 31, December 31, March 31,
(Unaudited) 2004 2003 2003 2003 2003
Net interest income (taxable-equivalent basis) $1,779.0 $1,816.7 $1,776.7 (2.1) % .1 %
Noninterest income 1,318.3 1,296.6 1,366.1 1.7 (3.5)
Total net revenue 3,097.3 3,113.3 3,142.8 (.5) (1.4)
Noninterest expense 1,454.9 1,334.8 1,437.0 9.0 1.2
Operating income before merger and restructuring-related
items and discontinued operations 1,642.4 1,778.5 1,705.8 (7.7) (3.7)
Provision for credit losses 235.0 286.0 335.0 (17.8) (29.9)
Income before income taxes, merger and restructuring-related
items and discontinued operations 1,407.4 1,492.5 1,370.8 (5.7) 2.7
Taxable-equivalent adjustment 7.2 7.2 7.3 -- (1.4)
Applicable income taxes 391.8 510.0 467.9 (23.2) (16.3)
Income before merger and restructuring-related items and
discontinued operations 1,008.4 975.3 895.6 3.4 12.6
Merger and restructuring-related items (after-tax) -- (5.0) (11.5) * *
Discontinued operations (after-tax) -- 6.7 .7 * *
Net income in accordance with GAAP $1,008.4 $977.0 $884.8 3.2 14.0
Diluted earnings per share
Earnings, before merger and restructuring-related items and
discontinued operations $.52 $.50 $.47 4.0 10.6
Net income .52 .50 .46 4.0 13.0
Financial Ratios
Net interest margin** 4.29 % 4.42 % 4.59 %
Interest yield on average loans ** 5.93 5.99 6.41
Rate paid on interest-bearing liabilities 1.45 1.44 1.82
Return on average assets 2.14 2.04 1.98
Return on average equity 20.7 19.3 19.3
Efficiency ratio *** 47.0 42.9 47.9
Tangible efficiency ratio **** 39.7 38.9 40.0
* Not meaningful
** On a taxable-equivalent basis
*** Computed as noninterest expense divided by the sum of net interest income on a taxable-equivalent basis and noninterest income excluding securities gains (losses), net
**** Computed as noninterest expense divided by the sum of net interest income on a taxable-equivalent basis and noninterest income excluding securities gains (losses), net
and intangible amortization
Page 28
29. U.S. Bancorp
Quarterly Consolidated Statement of Income - Operating Basis
Financial Results and Ratios on an Operating Basis
(Excluding Merger and Restructuring-Related Items and Discontinued Operations)
Three Months Ended
(Dollars and Shares in Millions, Except Per Share Data) March 31, December 31, September 30, June 30, March 31,
(Unaudited) 2004 2003 2003 2003 2003
Net interest income (taxable-equivalent basis) $1,779.0 $1,816.7 $1,825.5 $1,798.6 $1,776.7
Noninterest Income
Credit and debit card revenue 141.8 153.4 137.6 142.3 127.4
Corporate payment products revenue 94.8 88.7 95.7 90.9 86.0
ATM processing services 42.2 40.3 41.3 41.9 42.4
Merchant processing services 141.1 146.0 146.3 141.8 127.3
Trust and investment management fees 248.6 246.6 239.8 238.9 228.6
Deposit service charges 185.2 186.6 187.0 179.0 163.2
Treasury management fees 117.5 116.3 126.2 111.8 112.0
Commercial products revenue 110.4 98.5 97.8 100.0 104.2
Mortgage banking revenue 94.2 91.9 89.5 90.3 95.4
Investment products fees and commissions 39.3 36.2 35.5 38.1 35.1
Securities gains (losses), net -- (.1) (108.9) 213.1 140.7
Other 103.2 92.2 89.6 84.8 103.8
Total noninterest income 1,318.3 1,296.6 1,177.4 1,472.9 1,366.1
Total net revenue 3,097.3 3,113.3 3,002.9 3,271.5 3,142.8
Noninterest Expense
Compensation 535.8 539.4 543.8 547.6 546.0
Employee benefits 100.2 81.3 75.8 79.6 91.7
Net occupancy and equipment 155.7 161.6 161.3 159.5 161.3
Professional services 32.4 44.2 39.9 32.9 26.4
Marketing and business development 35.3 50.8 48.6 51.1 29.8
Technology and communications 101.7 106.3 102.1 104.1 104.9
Postage, printing and supplies 61.6 61.8 61.6 61.8 60.4
Other intangibles 226.1 124.2 10.8 312.3 235.1
Other 206.1 165.2 199.2 186.9 181.4
Total noninterest expense 1,454.9 1,334.8 1,243.1 1,535.8 1,437.0
Operating income before merger and restructuring-related items
and discontinued operations 1,642.4 1,778.5 1,759.8 1,735.7 1,705.8
Provision for credit losses 235.0 286.0 310.0 323.0 335.0
Income before income taxes, merger and restructuring-
related items and discontinued operations 1,407.4 1,492.5 1,449.8 1,412.7 1,370.8
Taxable-equivalent adjustment 7.2 7.2 7.0 6.7 7.3
Applicable income taxes 391.8 510.0 495.4 483.8 467.9
Income before merger and restructuring-related items
and discontinued operations 1,008.4 975.3 947.4 922.2 895.6
Merger and restructuring-related items (after-tax) -- (5.0) (6.7) (7.2) (11.5)
Discontinued operations (after-tax) -- 6.7 10.2 4.9 .7
Net income in accordance with GAAP $1,008.4 $977.0 $950.9 $919.9 $884.8
Diluted Earnings Per Share
Average diluted common shares 1,941.1 1,950.8 1,939.8 1,931.6 1,925.6
Diluted operating earnings per share $.52 $.50 $.49 $.48 $.47
Financial Ratios
Net interest margin* 4.29 % 4.42 % 4.43 % 4.52 % 4.59 %
Interest yield on average loans * 5.93 5.99 6.03 6.21 6.41
Rate paid on interest-bearing liabilities 1.45 1.44 1.49 1.68 1.82
Return on average assets 2.14 2.04 1.98 1.98 1.98
Return on average equity 20.7 19.3 19.4 19.0 19.3
Efficiency ratio ** 47.0 42.9 39.9 50.2 47.9
Tangible efficiency ratio *** 39.7 38.9 39.6 40.0 40.0
* On a taxable-equivalent basis
Computed as noninterest expense divided by the sum of net interest income on a taxable-equivalent basis and noninterest income excluding securities gains (losses), net
**
Computed as noninterest expense divided by the sum of net interest income on a taxable-equivalent basis and noninterest income excluding securities gains (losses), net
***
and intangible amortization
Page 29