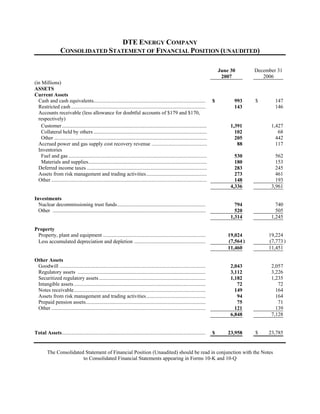
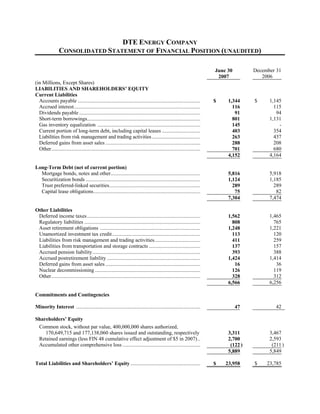
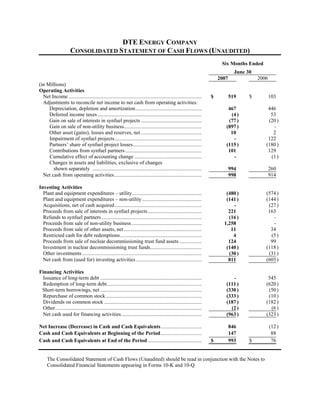
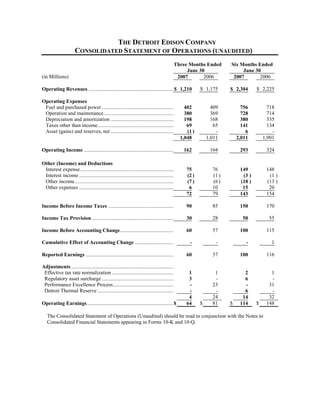
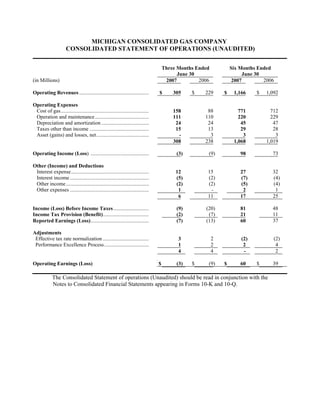
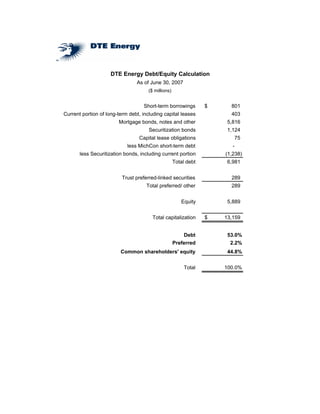
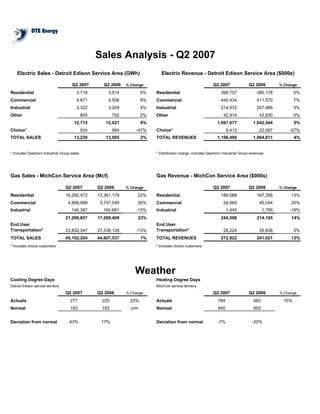
This document provides supplemental financial information for DTE Energy Company for the second quarter of 2007. It includes consolidated statements of financial position, cash flows, and operations for DTE Energy and its subsidiaries Detroit Edison and Michigan Consolidated Gas. Some key details are:
- Total assets for DTE Energy as of June 30, 2007 were $23.958 billion, with current assets of $4.336 billion and property, plant and equipment of $11.451 billion.
- Total debt for DTE Energy as of June 30, 2007 was $6.981 billion, or 53% of its total capitalization of $13.159 billion.
- For the second quarter of 2007, Detroit E
DTE Energy's consolidated financial statements for Q1 2006 show:
- Total assets of $22.4 billion, with current assets of $4.7 billion including cash of $75 million.
- Total liabilities of $16.7 billion including long-term debt of $7.1 billion.
- Shareholders' equity of $5.8 billion.
- Operating revenues for Detroit Edison increased 5% to $1.05 billion due to higher sales across all customer classes as weather was warmer.
- DTE Energy's consolidated statement of financial position as of September 30, 2006 showed total assets of $22.3 billion and total liabilities and shareholders' equity of $22.3 billion.
- Key assets included property, plant and equipment of $10.5 billion, goodwill of $2.1 billion, and regulatory and intangible assets of $3.5 billion. Total debt was $6.7 billion.
- Detroit Edison reported operating revenues of $1.5 billion for the third quarter of 2006, with operating earnings of $145 million. Michigan Consolidated Gas reported an operating loss of $7 million on revenues of $167 million.
- DTE Energy's total assets as of March 31, 2008 were $23.2 billion, with current assets of $3.4 billion and total liabilities of $17.2 billion.
- For the first quarter of 2008, DTE Energy reported net income of $212 million and operating cash flow of $890 million.
- Electric sales for Detroit Edison increased 2% in the first quarter compared to the same period in 2007, while gas sales for MichCon decreased 3%.
- DTE Energy's total assets increased slightly to $23.8 billion in 2006 from $23.3 billion in 2005. Total liabilities also increased slightly to $15.2 billion from $14.5 billion.
- Electric sales for Detroit Edison decreased 5% to 57 billion kWh while revenues increased 8% to $4.5 billion, driven by higher commercial and industrial sales.
- Gas sales for MichCon decreased 16% to 271 billion cubic feet while revenues decreased 10% to $1.7 billion due to lower residential and commercial usage.
- DTE Energy's consolidated statement of financial position as of June 30, 2006 showed total assets of $22.2 billion and total liabilities and shareholders' equity of $22.2 billion. Cash and cash equivalents totaled $76 million as of June 30, 2006.
- Detroit Edison's electric sales increased 7% in the second quarter of 2006 compared to the same period in 2005, while gas sales at MichCon decreased 21% over the same period.
- DTE Energy's debt to total capitalization as of June 30, 2006 was 52.9% with long-term debt totaling $6.7 billion.
- DTE Energy's consolidated financial position as of March 31, 2007 included total assets of $23.4 billion and total liabilities and shareholders' equity of $23.4 billion. Debt accounted for 53.6% of DTE's total capitalization.
- For the first quarter of 2007, DTE Energy reported net income of $134 million, while Detroit Edison and MichCon reported operating earnings of $48 million and $62 million, respectively.
- Electric sales for Detroit Edison increased 5% from the prior year quarter due to higher sales in all customer classes except choice customers. Gas sales for MichCon increased 8% due to higher residential and industrial sales.
Service tax pdf e book - 7th vces edn- ca pritam mahureParag Jain
This document provides an overview and compilation of key provisions related to the Service Tax Negative List Regime introduced in India from July 1, 2012. It includes definitions of key terms, applicable statutory provisions, rules related to CENVAT Credit, Point of Taxation, Place of Provision of Services, and various notifications issued. The author has compiled this information to help readers understand the new indirect tax system in a concise and organized manner.
The us-contact-center-decision-makers-guide-2012blueC 802
This document provides an overview and guide for contact center decision-makers. It discusses topics related to improving quality and performance such as interaction recording, customer interaction analytics, dynamic scripting, customer satisfaction, and training. It also covers maximizing efficiency and agent optimization, including contact center performance metrics, budgets, new ways of working, and increasing efficiency within calls. Finally, it addresses new media and the customer of the future as well as increasing profitability through topics like CRM, cloud solutions, outbound calling, and outsourcing. The document is intended to help contact center leaders make strategic decisions through analysis of industry data and trends.
The document provides an overview of Apex development for the Winter '13 release of Salesforce:
- It introduces Apex and how it can be used to extend Salesforce with custom application logic. The basic development process is outlined including using sandboxes, writing code, testing, and deployment.
- Core Apex concepts like data types, variables, expressions, and control structures are explained. Invoking Apex via triggers, schedulers, and anonymous blocks is also covered at a high level.
- The document serves as a reference for Apex classes, interfaces, exceptions and standard methods that can be used in development. Debugging and testing techniques are also summarized.
This article aims to provide a comprehensive knowledge and understanding of the Sub ledger accounting (SLA) in Oracle E-Business Suite (EBS) R12. It uncovers some of implementation tips and techniques and also shows how users can meet their financial and reporting needs using SLA.
The article highlights how to use SLA functionality to automate and control various scenarios using specific business rules.
Statutory demands are a great way to attempt to recover debts from an insolvent debtor company. This eBook is a complete guide to drafting and serving statutory demands.
133
533
633
733
433
533
633
733
433
533
633
733
433
533
633
733
433
533
633
The document appears to be a list of names and terms in Arabic script. It does not contain enough context in English to form a meaningful summary.
133
533
633
733
933
143
443
643
743
943
153
553
653
753
853
953
163
663
The document appears to be a list of names and terms in Arabic script. It does not contain enough context in English or other languages I understand to form a meaningful multi-sentence summary.
133
533
633
733
933
143
443
643
743
943
153
553
653
753
853
953
163
663
The document appears to be a list of names and terms in Arabic script. It does not contain enough context in English to form a meaningful summary.
Le Livre noir sur le système de propagande de Ben AliBabnet Tunisie
133
533
633
733
933
143
443
643
743
943
153
553
653
753
853
953
163
663
The document appears to be a list of names and terms in Arabic script. It does not contain enough context in English or other languages I understand to form a meaningful multi-sentence summary.
DTE Energy reported strong third quarter 2006 earnings of $188 million compared to $4 million in third quarter 2005. Operating earnings, which exclude non-recurring items, were $255 million in third quarter 2006 compared to $5 million in third quarter 2005. All of DTE Energy's business segments experienced increased operating earnings except for Gas Utility which typically has a seasonal loss in the third quarter. DTE Energy tightened its full year 2006 operating earnings guidance excluding synthetic fuels to be between $2.42 to $2.53 per share.
- Detroit Edison filed an application with the Michigan Public Service Commission to change retail electric rates for the first time in 10 years. The application proposed phased-in rate increases of 8.02% between 2004-2006 for different customer classes as existing rate caps expire. It also requested recovery of deferred regulatory assets and reinstatement of its Power Supply Cost Recovery mechanism.
- The filing aimed to provide a long-term rate structure to address cost pressures while continuing to offer value to customers, maintain reliable electric service, allow Detroit Edison to earn a reasonable return, and access capital markets. The proposed increases and recovery measures totaled $416 million in additional revenues by 2006.
- The document is DTE Energy Company's consolidated statements of financial position for the third quarter of 2007.
- As of September 30, 2007, DTE Energy's total assets were $23.8 billion and total liabilities were $11.6 billion.
- Major assets included property, plant and equipment of $19.2 billion, nuclear decommissioning trust funds of $740 million, and regulatory assets of $3.2 billion. Major liabilities included long-term debt of $7.4 billion, accounts payable of $1.1 billion, and deferred gains and reserves of $208 million.
Dollar General Corporation is the largest small-box retailer in the US, operating 6,700 stores across 27 states. In fiscal year 2003, Dollar General saw record results with $6.87 billion in sales and $301 million in net income. Dollar General plans to continue its rapid growth by opening 675 new stores in 2004, including entering 3 new states. The company aims to become a leading provider of consumable basic products for underserved customers through conveniently located small stores offering unique products at low prices.
- DTE Energy's total assets as of March 31, 2008 were $23.2 billion, with current assets of $3.4 billion and property, plant and equipment of $11.5 billion. Total liabilities were $17.1 billion and shareholders' equity was $6.1 billion.
- For the first quarter of 2008, DTE Energy reported net income of $212 million and operating cash flow of $890 million. Electric sales increased 2-4% for Detroit Edison compared to the prior year.
- Key subsidiaries Detroit Edison and MichCon both saw higher earnings in the first quarter of 2008 compared to the prior year, with weather slightly positively impacting Detroit Edison
The document provides an update on DTE Energy's mid-year business performance. It discusses proposed energy legislation in Michigan that would reform electric choice, phase in cost-of-service rates, and establish renewable portfolio and energy efficiency standards. It also provides details on DTE Energy's Detroit Edison rate case filing and use of proceeds from asset monetization and synfuel partnerships. DTE Energy raises its 2008 operating earnings guidance while maintaining EPS guidance and provides a preliminary outlook for higher non-utility earnings in 2009 driven by retaining its power and industrial projects.
- Yellow Transportation, Roadway Express, and New Penn Motor Express reported increased revenue and tonnage for the second quarter and year-to-date periods compared to the previous year.
- Revenue per hundredweight and revenue per shipment also increased across the board for LTL and TL categories in both periods, with a few exceptions.
- Operating income increased for all three companies after adjustments to conform accounting policies and revenue recognition between periods.
DTE Energy reported a loss for the second quarter of 2006 compared to earnings in the same period in 2005. Operating earnings excluding special items were nearly break-even, with higher earnings from the electric utility offset by losses in other segments due to oil hedging costs and falling natural gas prices. Despite the quarterly loss, DTE maintained its full-year 2006 earnings guidance. Capital investment continued across all business segments to improve operations and support growth.
This document provides financial information for DTE Energy Company for the year ended December 31, 2008. It includes consolidated statements of financial position, operations, and cash flows for DTE Energy and its subsidiaries Detroit Edison and Michigan Consolidated Gas. The financial position statement shows the company had total assets of $24.6 billion and total liabilities and equity of the same amount. Key line items include property, plant and equipment of $11.4 billion, total debt of $7 billion and total equity of $6 billion. The statements of operations and cash flows provide details on the company's financial performance and cash flows for 2008.
DTE Energy reported its business and financial results for 2007. Key points include:
- Operating earnings for 2007 were $2.82 per share, driven by strong results across utility and non-utility segments.
- Detroit Edison and MichCon earned near their authorized returns on equity despite challenges from new computer systems.
- Non-utility segments like coal/gas midstream and energy trading significantly contributed to earnings.
- The company is making investments to grow its utilities and pipelines, with plans to file an updated rate case for Detroit Edison.
DTE Energy reported financial results for the second quarter and first six months of 1999. Operating revenues increased 8.1% and 8.2% respectively compared to the same periods in 1998. However, higher operating expenses led to a decrease in operating income of 14.9% and 11.4%. Net income increased by 8.9% and 9.8% due to lower income tax expenses. Cash used for investing activities increased as the company spent more on plant and equipment expenditures.
- Yellow Transportation reported a 14.2% increase in total revenue for Q4 2004 compared to Q3 2003, driven by increases in both LTL and TL revenue. For the full year 2004, revenue increased 13.1% versus 2003.
- Tonnage and shipments increased across most business segments for both Q4 and full year 2004 compared to the prior year.
- Revenue per hundredweight and revenue per shipment increased for most segments in Q4 2004 and for the full year 2004 compared to 2003, indicating improved pricing.
DTE Energy reported financial results for the fourth quarter and full year 1999. For the quarter, operating revenues increased 10.1% to $1.1 billion but net income decreased 9.3% to $97 million due to higher fuel and operating costs. For the full year, operating revenues rose 12.0% to $4.7 billion while net income grew 9.0% to $483 million due to increased industrial sales and non-regulated business income, partially offset by higher fuel expenses. Cash from operating activities totaled $1.1 billion for 1999.
DTE Energy Company's consolidated statements of financial position for the years ending December 31, 2007 and December 31, 2006 are presented. As of December 31, 2007, DTE Energy reported total assets of $23.9 billion, total liabilities of $11.3 billion, and total shareholders' equity of $12.6 billion. Major assets included property, plant and equipment of $11.5 billion, nuclear decommissioning trust funds of $824 million, and regulatory assets of $2.8 billion. Major liabilities included long-term debt of $7.1 billion and deferred gains and reserves of $400 million.
This document is Dollar General Corporation's annual report (Form 10-K) filed with the SEC for the fiscal year ended February 1, 2008. It provides information on Dollar General's business operations, including that it is the largest discount retailer in the US by number of stores. In July 2007, Dollar General was acquired by investment funds affiliated with Kohlberg Kravis Roberts in a $6.9 billion deal that took the company private. The report discusses Dollar General's strategic focus on offering everyday low prices on consumable goods and other products in a small-format, convenient store setting.
The document is the 2005 annual report and proxy statement from PHI (Pepco Holdings Inc.). It discusses PHI's strategy of focusing on stable power delivery and growing energy businesses. In 2005, PHI achieved earnings of $371.2 million and strengthened its balance sheet by paying down over $1 billion in debt. Rising energy prices present challenges for PHI and its customers. The proxy statement announces the annual meeting to elect directors and ratify the independent auditor.
Yellow Roadway Corporation reported strong financial results for the first quarter of 2004, with earnings per share of $0.38, operating revenue of $1.55 billion (up 7.7% from 2003), and operating income of $41.3 million (up 20.3% from 2003). Each of the company's business units - Yellow Transportation, Roadway Express, New Penn Motor Express, and Meridian IQ - exceeded financial targets for the quarter and saw increased revenue and improved operating results compared to the prior year. The company also updated its full-year 2004 earnings guidance to a range of $3.00 per share.
- DTE Energy's consolidated statement of financial position as of September 30, 2006 showed total assets of $22.3 billion and total liabilities and shareholders' equity of the same amount.
- Key assets included property, plant and equipment of $10.5 billion, goodwill of $2.1 billion, and regulatory and intangible assets of $3.5 billion. Total debt was $6.7 billion.
- Detroit Edison reported operating revenues of $1.5 billion for the third quarter of 2006 with operating earnings of $145 million. Michigan Consolidated Gas had operating revenues of $167 million and an operating loss of $7 million for the same period.
- DTE Energy's consolidated statement of financial position as of June 30, 2006 showed total assets of $22.2 billion and total liabilities and shareholders' equity of $22.2 billion. Cash and cash equivalents totaled $76 million as of June 30, 2006.
- Detroit Edison's electric sales increased 7% in the second quarter of 2006 compared to the same period in 2005, while gas sales at MichCon decreased 21% over the same period.
- DTE Energy's debt to total capitalization as of June 30, 2006 was 52.9% with long-term debt totaling $6.7 billion.
DTE Energy's consolidated financial statements for Q1 2006 show:
- Total assets of $22.4 billion, with current assets of $4.7 billion including cash of $75 million.
- Total liabilities of $16.7 billion including long-term debt of $7.1 billion.
- Shareholders' equity of $5.8 billion.
- Operating revenues for Detroit Edison increased 5% to $1.05 billion due to higher sales across all customer classes as weather was warmer.
- DTE Energy's total assets increased slightly to $23.8 billion in 2006 from $23.3 billion in 2005. Total liabilities also increased slightly to $15.2 billion from $14.5 billion.
- Electric sales for Detroit Edison decreased 5% to 57 billion kWh while revenues increased 8% to $4.5 billion, driven by higher commercial and industrial sales.
- Gas sales for MichCon decreased 16% to 271 billion cubic feet while revenues decreased 10% to $1.7 billion due to lower residential and commercial usage.
- DTE Energy's consolidated financial position as of March 31, 2007 included total assets of $23.4 billion and total liabilities and shareholders' equity of $23.4 billion. Debt accounted for 53.6% of DTE's total capitalization.
- For the first quarter of 2007, DTE Energy reported net income of $134 million, while Detroit Edison and MichCon reported operating earnings of $48 million and $62 million, respectively.
- Electric sales for Detroit Edison increased 5% from the prior year quarter due to higher sales in all customer classes except choice customers. Gas sales for MichCon increased 8% due to higher residential and industrial sales.
This document is a financial supplement providing quarterly financial results for Genworth Financial, Inc. for 3Q 2008. It includes sections on net income, net operating income by business segment, balance sheets, investment portfolio details, and non-GAAP financial measures reconciliations. New metrics were added this quarter to provide more transparency into financial trends for the International and U.S. Mortgage Insurance segments.
1) The document is Archer Daniels Midland Company's 2006 Annual Report.
2) It discusses the retirement of G. Allen Andreas as CEO and Chairman of the Board after over 30 years of service, during which he led global expansion and improvements in governance.
3) Under his leadership, ADM transitioned from a focus on U.S. processing to a more global business model, establishing leadership positions in important international markets.
This instructor's manual provides guidance for teaching a course on client casework and providing emergency assistance. The manual includes:
1) An overview of the course purpose, objectives, schedule, materials, and responsibilities of instructors and host chapters.
2) Detailed content for teaching the key areas of client casework including an overview of the role, conducting interviews, documenting assistance, and assignment settings like offices, fields and shelters.
3) Instructions and forms for instructors to train participants on client registration, case records, assistance cards and disbursing orders to provide standardized disaster assistance.
This document is a product disclosure statement that describes Zurich's Taxi Insurance Composite Cover. It outlines what the policy covers, including own damage to the taxi and third party liability. It also describes how premiums are calculated, how to make a claim, privacy policies, and complaint procedures. The policy provides insurance protection for taxis and taxi drivers.
This document is the policy wording for a Zurich Steadfast General and Products Liability Insurance policy. It includes definitions of key terms used in the policy such as advertising injury, bodily injury, occurrence, named insured, and products liability. It also outlines important information for policyholders regarding cooling-off periods, complaints handling, and claims procedures. The document provides the detailed terms and conditions of the general liability and products liability coverage provided by the insurance policy.
This document is a financial supplement providing quarterly financial results for Genworth Financial, Inc. for the fourth quarter of 2007. It includes sections on net income, net operating income by business segment, consolidated balance sheets, investments information, and reconciliations of non-GAAP measures to GAAP measures. The supplement provides detailed financial results and key metrics for Genworth's business segments to allow for analysis of performance on a quarterly basis.
This document is a financial supplement providing quarterly financial results for Genworth Financial, Inc. for the fourth quarter of 2007. It includes sections on net income, net operating income by business segment, consolidated and segment balance sheets, investment portfolio details, and reconciliations of non-GAAP measures. The supplement provides detailed performance metrics for Genworth's business segments to allow for analysis of results.
This document is an interim shareholders report from Berkshire Hathaway Inc. for the second quarter of 2004. It includes consolidated balance sheets, statements of earnings, and condensed consolidated statements of cash flows for the periods ended June 30, 2004 and 2003. The balance sheet shows total assets of $203.4 billion as of June 30, 2004, including $150.4 billion in insurance and other assets and $48.9 billion in finance and financial products assets. Total liabilities were $122.1 billion, including $79.9 billion in insurance and other liabilities and $42.2 billion in finance and financial products liabilities. Shareholders' equity totaled $80.4 billion. The statements of earnings show
This document provides an outline for forecasting revenues and costs for a business. It discusses developing a strategic vision that includes understanding customers, making realistic assumptions, and getting started with forecasts. Key areas for forecasting revenues include product sales, pricing, geographical expansion, new products, partnerships, and other income sources. Key areas for forecasting costs include cost of sales, operating expenses like marketing, IT, personnel, and taxes. It also covers forecasting the balance sheet, working capital, and capital expenditures.
This document is the table of contents for a Calculus II textbook. It outlines the chapters and topics that will be covered, including integration techniques, applications of integrals, parametric equations, polar coordinates, sequences and series, vectors, and three dimensional space. The document provides a high-level overview of the essential concepts and methods that will be discussed in the Calculus II course.
This document outlines the policy wording for Zurich Business Insurance. It includes information about Zurich as the insurer, the insured's legal agreement with Zurich, general information and exclusions that apply to the policy, procedures for claims, and coverage details for various types of business insurance like property, business interruption, theft, money, machinery, electronic equipment, liability and more. Key terms are defined.
This document outlines the policy wording for Zurich Business Insurance. It includes information about Zurich as the insurer, the insured's legal agreement with Zurich, general information and exclusions that apply to the policy, procedures for claims, and coverage details for various types of business insurance policies (e.g. property, business interruption, theft, money, machinery). It provides the terms and conditions of the insurance contracts between Zurich and its business customers.
Pepco Holdings, Inc. held an analyst conference on October 5-6, 2004 to discuss the company's performance. The presentation included an overview of PHI's businesses, strategy, and corporate governance practices. It noted PHI has $7.1 billion in revenues and focuses on its regulated electric and gas delivery business, which accounts for 72% of operating income. The Power Delivery segment was discussed, which includes the transmission and distribution of electricity to 1.8 million customers across several mid-Atlantic states.
The document discusses Joseph Rigby's presentation on the strategic positioning of Southeast Utilities. It summarizes the company's strategic focus on power delivery, Conectiv Energy, and Pepco Energy Services. It also outlines the goals for the power delivery business, including sales growth, infrastructure investment, operational excellence, and constructive regulatory outcomes to deliver average annual earnings growth of at least 4%. Key infrastructure projects are highlighted.
The document summarizes a presentation given by Joseph M. Rigby, CFO of Pepco Holdings, Inc. (PHI) at an investor conference on March 28, 2006. The presentation outlines PHI's strategy to remain a regional diversified energy delivery and competitive services company focused on operational excellence. It discusses PHI's power delivery business, Conectiv Energy, and Pepco Energy Services. The presentation also provides financial performance summaries and projections showing PHI's ability to cover dividends and capital expenditures with cash from operations.
The document provides an overview and summary of PHI's strategy and performance across its various business segments. PHI aims to remain a regional diversified energy delivery and competitive services company focused on value creation and operational excellence. Key aspects include achieving constructive regulatory outcomes and 4% annual earnings growth for its power delivery utilities, optimizing assets and market opportunities for Conectiv Energy, and expanding Pepco Energy Services into additional markets. Financial performance has been positively impacted by infrastructure investments and sales growth, though earnings have been reduced in some jurisdictions due to higher standard offer service pricing.
This document provides an overview of PHI and its strategy for positioning itself for success in a dynamic industry. PHI's strategy is to remain a diversified regional energy delivery and competitive services company focused on value creation and operational excellence. For its power delivery utility operations, PHI's goals are to operate with excellence, achieve constructive regulatory outcomes, invest in infrastructure, and deliver at least 4% annual average earnings growth. PHI's service territory has a robust economy that is less susceptible to downturns and includes diverse government and private sectors.
This document provides an overview of PHI's 41st EEI Financial Conference held from November 5-8, 2006. It includes sections on PHI's financial performance for Q3 and year-to-date 2006, drivers of performance, sales and customer trends, regulated distribution summaries, upcoming regulatory activities including transmission formula rate filings and rate cases, and PHI's proposed MAPP transmission project. Key highlights are lower sales due to mild weather, lower transmission revenue, and plans to file rate cases in late 2006/early 2007.
This document provides an overview and summary of Power Holdings Inc.'s (PHI) various business segments. It discusses PHI's regulated electric and gas delivery business, which accounts for 67% of operating income. It also summarizes Conectiv Energy's competitive merchant generation and load service business, which accounts for 33% of operating income. Key highlights from rate cases and recent regulatory activities involving PHI's delivery businesses are also provided. The document contains forward-looking statements and non-GAAP financial measures.
The document provides an overview of Pepco Holdings Inc.'s (PHI) power delivery business and regulatory environment. It summarizes PHI's sales and customer growth projections, infrastructure investment strategy including the proposed Mid-Atlantic Power Pathway transmission project and Blueprint for the Future initiative. Recent distribution rate case outcomes for PHI's utilities are also summarized. The document is intended as a presentation for investors on PHI's positioned for success through its regulated electric and gas delivery business.
The document provides an overview of Pepco Holdings Inc.'s (PHI) various businesses including its regulated electric and gas delivery business, competitive energy generation business, and energy services business. It discusses PHI's infrastructure investment strategies, the status of major projects like the Mid-Atlantic Power Pathway, and the company's regulatory environment. Financial projections show expectations for continued investment and growth across PHI's businesses.
The document discusses Pepco Holdings' strategic focus on infrastructure investments and customer programs to position the company for continued success. It outlines plans to invest $1.2 billion in the Mid-Atlantic Power Pathway transmission project through 2014 and $646 million in advanced metering infrastructure and other programs through the company's Blueprint for the Future initiative between 2008-2014. Regulatory support is essential for cost recovery for these investments, which aim to enhance reliability, manage costs and protect the environment for customers.
This document provides an overview of Pepco Holdings' transmission and distribution business. It discusses plans to invest over $5 billion from 2007-2012 to upgrade aging infrastructure and improve reliability. A key project is the $1.05 billion Mid-Atlantic Power Pathway, a 230-mile 500kV transmission line from Northern Virginia to Southern New Jersey to be completed by 2013. The presentation outlines the project timeline, environmental stewardship efforts, and cost recovery approach through PJM and FERC. It also reviews the company's focus on replacing aging transmission equipment to further enhance reliability.
The document provides an overview of Pepco Holdings, Inc.'s (PHI) strategy to build shareholder value. PHI aims to increase investment in infrastructure through its Blueprint programs to modernize its electric grid. It also plans growth for its competitive energy businesses, Conectiv Energy and Pepco Energy Services. PHI expects its regulated Power Delivery business to remain the primary driver of earnings, contributing 60-70% of operating income over the planning period through infrastructure investments and favorable regulatory outcomes.
This document provides an overview of Pepco Holdings, Inc.'s power delivery business. It discusses planned infrastructure investments totaling $4.99 billion from 2008-2012 to improve reliability, support load growth, and implement new technology. A key project is the $1.05 billion Mid-Atlantic Power Pathway transmission line. The document also reviews regulatory highlights, including recent rate cases, and outlines operational and financial summaries for the company's distribution and transmission businesses.
- Pepco Holdings held its annual meeting and provided its annual report to shareholders.
- In 2002, Pepco Holdings earned $210.5 million in consolidated earnings, or $1.61 per share. Earnings were driven by strong performance from regulated utility businesses and some competitive energy businesses.
- The letter discusses the company's strategy, leadership, and financial and operational performance across its various business segments in 2002. It also encourages shareholders to vote and continue supporting the company.
- Pepco Holdings provided its first annual report after merging Pepco and Conectiv in August 2002.
- In 2002, PHI earned $210.5 million, or $1.61 per share, on $4.3 billion in revenue. Excluding merger costs, earnings were $1.74 per share.
- The letter discusses the company's regulated utility and competitive energy businesses, noting stable earnings from utilities and growth potential from competitive businesses. It encourages shareholders to vote and thanks them for their confidence and investment.
This document provides a summary of Pepco Holdings' 2004 annual report and proxy statement. Key points include:
1) Pepco Holdings reported improved financial performance in 2004 with consolidated earnings of $258.7 million, up from $113.5 million in 2003, driven by improved performance of competitive energy businesses.
2) The company made progress on reducing debt and preferred stock by $480 million in 2004 and achieved a total shareholder return of over 22% for 2003-2004.
3) The regulated power delivery business continues as the primary focus and driver of steady cash flow. Earnings from this segment improved to $233.4 million in 2004.
4) Competitive energy businesses also posted
The document provides details on Pepco Holdings' 2003 performance and future plans. It discusses challenges faced in 2003 including an energy trading loss, Mirant's bankruptcy, and Hurricane Isabel. However, actions taken in 2003 such as divesting non-core businesses and reducing risk are expected to set the stage for future earnings growth. The company remains focused on strengthening its core power delivery business and improving customer satisfaction.
This document provides a summary of Pepco Holdings' 2004 annual report and proxy statement. Key points include:
1) Pepco Holdings reported improved financial performance in 2004 with consolidated earnings of $258.7 million, up from $113.5 million in 2003, driven by improved performance of competitive energy businesses.
2) The company made progress on reducing debt and preferred stock by $480 million in 2004 as part of its balance sheet improvement goals.
3) The regulated power delivery business continues as the primary focus due to its stability and cash generation. Earnings from this segment grew to $233.4 million in 2004.
4) Competitive energy businesses also posted profits in 2004 despite challenging markets
The document is the 2005 annual report and proxy statement from PHI (Pepco Holdings Inc.). It discusses PHI's strategy of focusing on stable power delivery and growing energy businesses. In 2005, PHI achieved earnings of $371.2 million and strengthened its balance sheet by paying down over $1 billion in debt. Rising energy prices present challenges for PHI and its customers. The proxy statement announces the annual meeting to elect directors and ratify the independent auditor.
A toxic combination of 15 years of low growth, and four decades of high inequality, has left Britain poorer and falling behind its peers. Productivity growth is weak and public investment is low, while wages today are no higher than they were before the financial crisis. Britain needs a new economic strategy to lift itself out of stagnation.
Scotland is in many ways a microcosm of this challenge. It has become a hub for creative industries, is home to several world-class universities and a thriving community of businesses – strengths that need to be harness and leveraged. But it also has high levels of deprivation, with homelessness reaching a record high and nearly half a million people living in very deep poverty last year. Scotland won’t be truly thriving unless it finds ways to ensure that all its inhabitants benefit from growth and investment. This is the central challenge facing policy makers both in Holyrood and Westminster.
What should a new national economic strategy for Scotland include? What would the pursuit of stronger economic growth mean for local, national and UK-wide policy makers? How will economic change affect the jobs we do, the places we live and the businesses we work for? And what are the prospects for cities like Glasgow, and nations like Scotland, in rising to these challenges?
Abhay Bhutada, the Managing Director of Poonawalla Fincorp Limited, is an accomplished leader with over 15 years of experience in commercial and retail lending. A Qualified Chartered Accountant, he has been pivotal in leveraging technology to enhance financial services. Starting his career at Bank of India, he later founded TAB Capital Limited and co-founded Poonawalla Finance Private Limited, emphasizing digital lending. Under his leadership, Poonawalla Fincorp achieved a 'AAA' credit rating, integrating acquisitions and emphasizing corporate governance. Actively involved in industry forums and CSR initiatives, Abhay has been recognized with awards like "Young Entrepreneur of India 2017" and "40 under 40 Most Influential Leader for 2020-21." Personally, he values mindfulness, enjoys gardening, yoga, and sees every day as an opportunity for growth and improvement.
South Dakota State University degree offer diploma Transcriptynfqplhm
办理美国SDSU毕业证书制作南达科他州立大学假文凭定制Q微168899991做SDSU留信网教留服认证海牙认证改SDSU成绩单GPA做SDSU假学位证假文凭高仿毕业证GRE代考如何申请南达科他州立大学South Dakota State University degree offer diploma Transcript
OJP data from firms like Vicinity Jobs have emerged as a complement to traditional sources of labour demand data, such as the Job Vacancy and Wages Survey (JVWS). Ibrahim Abuallail, PhD Candidate, University of Ottawa, presented research relating to bias in OJPs and a proposed approach to effectively adjust OJP data to complement existing official data (such as from the JVWS) and improve the measurement of labour demand.
Discover the Future of Dogecoin with Our Comprehensive Guidance36 Crypto
Learn in-depth about Dogecoin's trajectory and stay informed with 36crypto's essential and up-to-date information about the crypto space.
Our presentation delves into Dogecoin's potential future, exploring whether it's destined to skyrocket to the moon or face a downward spiral. In addition, it highlights invaluable insights. Don't miss out on this opportunity to enhance your crypto understanding!
https://36crypto.com/the-future-of-dogecoin-how-high-can-this-cryptocurrency-reach/
Economic Risk Factor Update: June 2024 [SlideShare]Commonwealth
May’s reports showed signs of continued economic growth, said Sam Millette, director, fixed income, in his latest Economic Risk Factor Update.
For more market updates, subscribe to The Independent Market Observer at https://blog.commonwealth.com/independent-market-observer.
Independent Study - College of Wooster Research (2023-2024) FDI, Culture, Glo...AntoniaOwensDetwiler
"Does Foreign Direct Investment Negatively Affect Preservation of Culture in the Global South? Case Studies in Thailand and Cambodia."
Do elements of globalization, such as Foreign Direct Investment (FDI), negatively affect the ability of countries in the Global South to preserve their culture? This research aims to answer this question by employing a cross-sectional comparative case study analysis utilizing methods of difference. Thailand and Cambodia are compared as they are in the same region and have a similar culture. The metric of difference between Thailand and Cambodia is their ability to preserve their culture. This ability is operationalized by their respective attitudes towards FDI; Thailand imposes stringent regulations and limitations on FDI while Cambodia does not hesitate to accept most FDI and imposes fewer limitations. The evidence from this study suggests that FDI from globally influential countries with high gross domestic products (GDPs) (e.g. China, U.S.) challenges the ability of countries with lower GDPs (e.g. Cambodia) to protect their culture. Furthermore, the ability, or lack thereof, of the receiving countries to protect their culture is amplified by the existence and implementation of restrictive FDI policies imposed by their governments.
My study abroad in Bali, Indonesia, inspired this research topic as I noticed how globalization is changing the culture of its people. I learned their language and way of life which helped me understand the beauty and importance of cultural preservation. I believe we could all benefit from learning new perspectives as they could help us ideate solutions to contemporary issues and empathize with others.
Every business, big or small, deals with outgoing payments. Whether it’s to suppliers for inventory, to employees for salaries, or to vendors for services rendered, keeping track of these expenses is crucial. This is where payment vouchers come in – the unsung heroes of the accounting world.
2. DTE ENERGY COMPANY
CONSOLIDATED STATEMENT OF FINANCIAL POSITION (UNAUDITED)
December 31
June 30
2006
2007
(in Millions)
ASSETS
Current Assets
Cash and cash equivalents..................................................................................... $ 147
$ 993
Restricted cash ...................................................................................................... 146
143
Accounts receivable (less allowance for doubtful accounts of $179 and $170,
respectively)
Customer .............................................................................................................. 1,427
1,391
Collateral held by others ...................................................................................... 68
102
Other .................................................................................................................... 442
205
Accrued power and gas supply cost recovery revenue .......................................... 117
88
Inventories
Fuel and gas ......................................................................................................... 562
530
Materials and supplies.......................................................................................... 153
180
Deferred income taxes ........................................................................................... 245
283
Assets from risk management and trading activities.............................................. 461
273
Other ...................................................................................................................... 193
148
3,961
4,336
Investments
Nuclear decommissioning trust funds................................................................... 740
794
Other .......................................................................................................................... 505
520
1,245
1,314
Property
Property, plant and equipment .............................................................................. 19,224
19,024
(7,773 )
(7,564 )
Less accumulated depreciation and depletion ......................................................
11,451
11,460
Other Assets
Goodwill ............................................................................................................... 2,057
2,043
Regulatory assets ................................................................................................. 3,226
3,112
Securitized regulatory assets ................................................................................. 1,235
1,182
Intangible assets .................................................................................................... 72
72
Notes receivable.................................................................................................... 164
149
Assets from risk management and trading activities............................................. 164
94
Prepaid pension assets........................................................................................... 71
75
Other ..................................................................................................................... 139
121
7,128
6,848
$ 23,785
Total Assets............................................................................................................. $ 23,958
The Consolidated Statement of Financial Position (Unaudited) should be read in conjunction with the Notes
to Consolidated Financial Statements appearing in Forms 10-K and 10-Q
3. DTE ENERGY COMPANY
CONSOLIDATED STATEMENT OF FINANCIAL POSITION (UNAUDITED)
December 31
June 30
2006
2007
(in Millions, Except Shares)
LIABILITIES AND SHAREHOLDERS’ EQUITY
Current Liabilities
Accounts payable ............................................................................................. $ 1,145
$ 1,344
Accrued interest................................................................................................ 115
116
Dividends payable ............................................................................................ 94
91
Short-term borrowings...................................................................................... 1,131
801
Gas inventory equalization .............................................................................. -
145
Current portion of long-term debt, including capital leases ............................. 354
403
Liabilities from risk management and trading activities ...................................... 437
263
Deferred gains from asset sales ........................................................................ 208
288
Other................................................................................................................. 680
701
4,164
4,152
Long-Term Debt (net of current portion)
Mortgage bonds, notes and other.................................................................... 5,918
5,816
Securitization bonds ....................................................................................... 1,185
1,124
Trust preferred-linked securities..................................................................... 289
289
Capital lease obligations................................................................................. 82
75
7,474
7,304
Other Liabilities
Deferred income taxes...................................................................................... 1,465
1,562
Regulatory liabilities ........................................................................................ 765
808
Asset retirement obligations ............................................................................ 1,221
1,248
Unamortized investment tax credit................................................................... 120
113
Liabilities from risk management and trading activities................................... 259
411
Liabilities from transportation and storage contracts ....................................... 157
137
Accrued pension liability.................................................................................. 388
393
Accrued postretirement liability ....................................................................... 1,414
1,424
Deferred gains from asset sales ........................................................................ 36
16
Nuclear decommissioning ................................................................................ 119
126
Other................................................................................................................. 312
328
6,256
6,566
Commitments and Contingencies
42
Minority Interest .............................................................................................. 47
Shareholders’ Equity
Common stock, without par value, 400,000,000 shares authorized,
170,649,715 and 177,138,060 shares issued and outstanding, respectively 3,467
3,311
Retained earnings (less FIN 48 cumulative effect adjustment of $5 in 2007) .. 2,593
2,700
Accumulated other comprehensive loss ........................................................... (211 )
(122 )
5,849
5,889
$ 23,785
Total Liabilities and Shareholders’ Equity ..................................................... $ 23,958
4. DTE ENERGY COMPANY
CONSOLIDATED STATEMENT OF CASH FLOWS (UNAUDITED)
Six Months Ended
June 30
2006
2007
(in Millions)
Operating Activities
Net Income ..................................................................................................... $ 103
$ 519
Adjustments to reconcile net income to net cash from operating activities:
Depreciation, depletion and amortization .................................................. 446
467
Deferred income taxes ............................................................................... 53
(4 )
Gain on sale of interests in synfuel projects .............................................. (20 )
(77 )
Gain on sale of non-utility business........................................................... -
(897 )
Other asset (gains), losses and reserves, net .............................................. 2
10
Impairment of synfuel projects.................................................................. 122
-
Partners’ share of synfuel project losses.................................................... (180 )
(115 )
Contributions from synfuel partners .......................................................... 129
101
Cumulative effect of accounting change ................................................... (1 )
-
Changes in assets and liabilities, exclusive of changes
shown separately ................................................................................... 260
994
Net cash from operating activities .................................................................. 914
998
Investing Activities
Plant and equipment expenditures – utility..................................................... (574 )
(480 )
Plant and equipment expenditures – non-utility ............................................. (144 )
(141 )
Acquisitions, net of cash acquired .................................................................. (27 )
-
Proceeds from sale of interests in synfuel projects......................................... 163
221
Refunds to synfuel partners ............................................................................ -
(16 )
Proceeds from sale of non-utility business ..................................................... -
1,258
Proceeds from sale of other assets, net ........................................................... 34
11
Restricted cash for debt redemptions.............................................................. (5 )
4
Proceeds from sale of nuclear decommissioning trust fund assets ................. 99
124
Investment in nuclear decommissioning trust funds....................................... (118 )
(140 )
Other investments........................................................................................... (31 )
(30 )
Net cash from (used for) investing activities .................................................. (603 )
811
Financing Activities
Issuance of long-term debt ............................................................................. 545
-
Redemption of long-term debt........................................................................ (620 )
(111 )
Short-term borrowings, net ............................................................................. (50 )
(330 )
Repurchase of common stock......................................................................... (10 )
(333 )
Dividends on common stock .......................................................................... (182 )
(187 )
Other............................................................................................................... (6 )
(2 )
Net cash used for financing activities ............................................................. (323 )
(963 )
(12 )
Net Increase (Decrease) in Cash and Cash Equivalents............................... 846
88
Cash and Cash Equivalents at Beginning of the Period............................... 147
$ 76
Cash and Cash Equivalents at End of the Period ......................................... $ 993
The Consolidated Statement of Cash Flows (Unaudited) should be read in conjunction with the Notes to
Consolidated Financial Statements appearing in Forms 10-K and 10-Q
5. THE DETROIT EDISON COMPANY
CONSOLIDATED STATEMENT OF OPERATIONS (UNAUDITED)
Three Months Ended Six Months Ended
June 30 June 30
(in Millions) 2006 2006
2007 2007
$ 1,175 $ 2,225
Operating Revenues .................................................................$ 1,210 $ 2,304
Operating Expenses
Fuel and purchased power ....................................................... 409 718
402 756
Operation and maintenance ..................................................... 369 714
380 728
Depreciation and amortization ................................................ 168 335
198 380
Taxes other than income.......................................................... 65 134
69 141
Asset (gains) and reserves, net ................................................ - -
(1 ) 6
1,011 1,901
1,048 2,011
164 324
Operating Income .................................................................... 162 293
Other (Income) and Deductions
Interest expense ....................................................................... 76 148
75 149
Interest income ........................................................................ (1 ) (1 )
(2 ) (3 )
Other income ........................................................................... (6 ) (13 )
(7 ) (18 )
Other expenses ........................................................................ 10 20
6 15
79 154
72 143
85 170
Income Before Income Taxes .................................................. 90 150
28 55
Income Tax Provision .............................................................. 30 50
57 115
Income Before Accounting Change......................................... 60 100
- 1
Cumulative Effect of Accounting Change .............................. - -
57 116
Reported Earnings ................................................................... 60 100
Adjustments ..............................................................................
Effective tax rate normalization ............................................... 1 1
1 2
Regulatory asset surcharge ....................................................... - -
3 6
Performance Excellence Process .............................................. 23 31
- -
Detroit Thermal Reserve .......................................................... - -
- 6
24 32
4 14
$ 81 $ $ 148
Operating Earnings..................................................................$ 64 114
The Consolidated Statement of Operations (Unaudited) should be read in conjunction with the Notes to
Consolidated Financial Statements appearing in Forms 10-K and 10-Q.
6. MICHIGAN CONSOLIDATED GAS COMPANY
CONSOLIDATED STATEMENT OF OPERATIONS (UNAUDITED)
Three Months Ended Six Months Ended
June 30 June 30
(in Millions) 2006 2006
2007 2007
$ 229 $ 1,092
Operating Revenues ..................................................... $ 305 $ 1,166
Operating Expenses
Cost of gas................................................................... 88 712
158 771
Operation and maintenance ......................................... 110 229
111 220
Depreciation and amortization .................................... 24 47
24 45
Taxes other than income ............................................. 13 28
15 29
Asset (gains) and losses, net........................................ 3 3
- 3
238 1,019
308 1,068
Operating Income (Loss) ............................................ (9) 73
(3) 98
Other (Income) and Deductions
Interest expense ........................................................... 15 32
12 27
Interest income ............................................................ (2) (4)
(5) (7)
Other income............................................................... (2) (4)
(2) (5)
Other expenses ............................................................ - 1
1 2
11 25
6 17
(20) 48
Income (Loss) Before Income Taxes ........................... (9) 81
(7) 11
Income Tax Provision (Benefit)................................... (2) 21
(13) 37
Reported Earnings (Loss)............................................ (7) 60
Adjustments
Effective tax rate normalization ................................... 2 (2)
3 (2)
Performance Excellence Process.................................. 2 4
1 2
4 2
4 -
$ (9) $ 39
Operating Earnings (Loss) $ (3) $ 60
The Consolidated Statement of operations (Unaudited) should be read in conjunction with the
Notes to Consolidated Financial Statements appearing in Forms 10-K and 10-Q.
7. DTE Energy Debt/Equity Calculation
As of June 30, 2007
($ millions)
Short-term borrowings $ 801
Current portion of long-term debt, including capital leases 403
Mortgage bonds, notes and other 5,816
Securitization bonds 1,124
Capital lease obligations 75
less MichCon short-term debt -
less Securitization bonds, including current portion (1,238)
Total debt 6,981
Trust preferred-linked securities 289
Total preferred/ other 289
Equity 5,889
Total capitalization $ 13,159
Debt 53.0%
Preferred 2.2%
Common shareholders' equity 44.8%
Total 100.0%
8. Sales Analysis - Q2 2007
Electric Sales - Detroit Edison Service Area (GWh) Electric Revenue - Detroit Edison Service Area ($000s)
Q2 2007 Q2 2006 Q2 2007 Q2 2006
% Change % Change
Residential 3,718 3,514 6% Residential 398,757 380,178 5%
Commercial 4,871 4,506 8% Commercial 440,434 411,570 7%
Industrial 3,322 3,209 4% Industrial 214,972 207,966 3%
Other 804 792 2% Other 42,914 42,830 0%
12,715 12,021 6% 1,097,077 1,042,544 5%
Choice* Choice*
524 984 -47% 9,412 22,067 -57%
TOTAL SALES 13,239 13,005 2% TOTAL REVENUES 1,106,489 1,064,611 4%
* Includes Dearborn Industrial Group sales * Distribution charge, includes Dearborn Industrial Group revenues
Gas Sales - MichCon Service Area (Mcf) Gas Revenue - MichCon Service Area ($000s)
Q2 2007 Q2 2006 Q2 2007 Q2 2006
% Change % Change
Residential 16,260,472 13,361,179 22% Residential 189,088 167,356 13%
Commercial 4,868,998 3,747,549 30% Commercial 54,065 45,044 20%
Industrial 140,387 160,681 -13% Industrial 1,445 1,785 -19%
21,269,857 17,269,409 23% 244,598 214,185 14%
End User End User
Transportation* Transportation*
23,832,347 27,338,128 -13% 28,224 26,836 5%
TOTAL SALES 45,102,204 44,607,537 1% TOTAL REVENUES 272,822 241,021 13%
* Includes choice customers * Includes choice customers
Weather
Cooling Degree Days Heating Degree Days
Detroit Edison service territory MichCon service territory
Q2 2007 Q2 2006 Q2 2007 Q2 2006
% Change % Change
Actuals 277 225 23% Actuals 784 683 15%
Normal 193 193 n/m Normal 840 853
43% 17% -7% -20%
Deviation from normal Deviation from normal