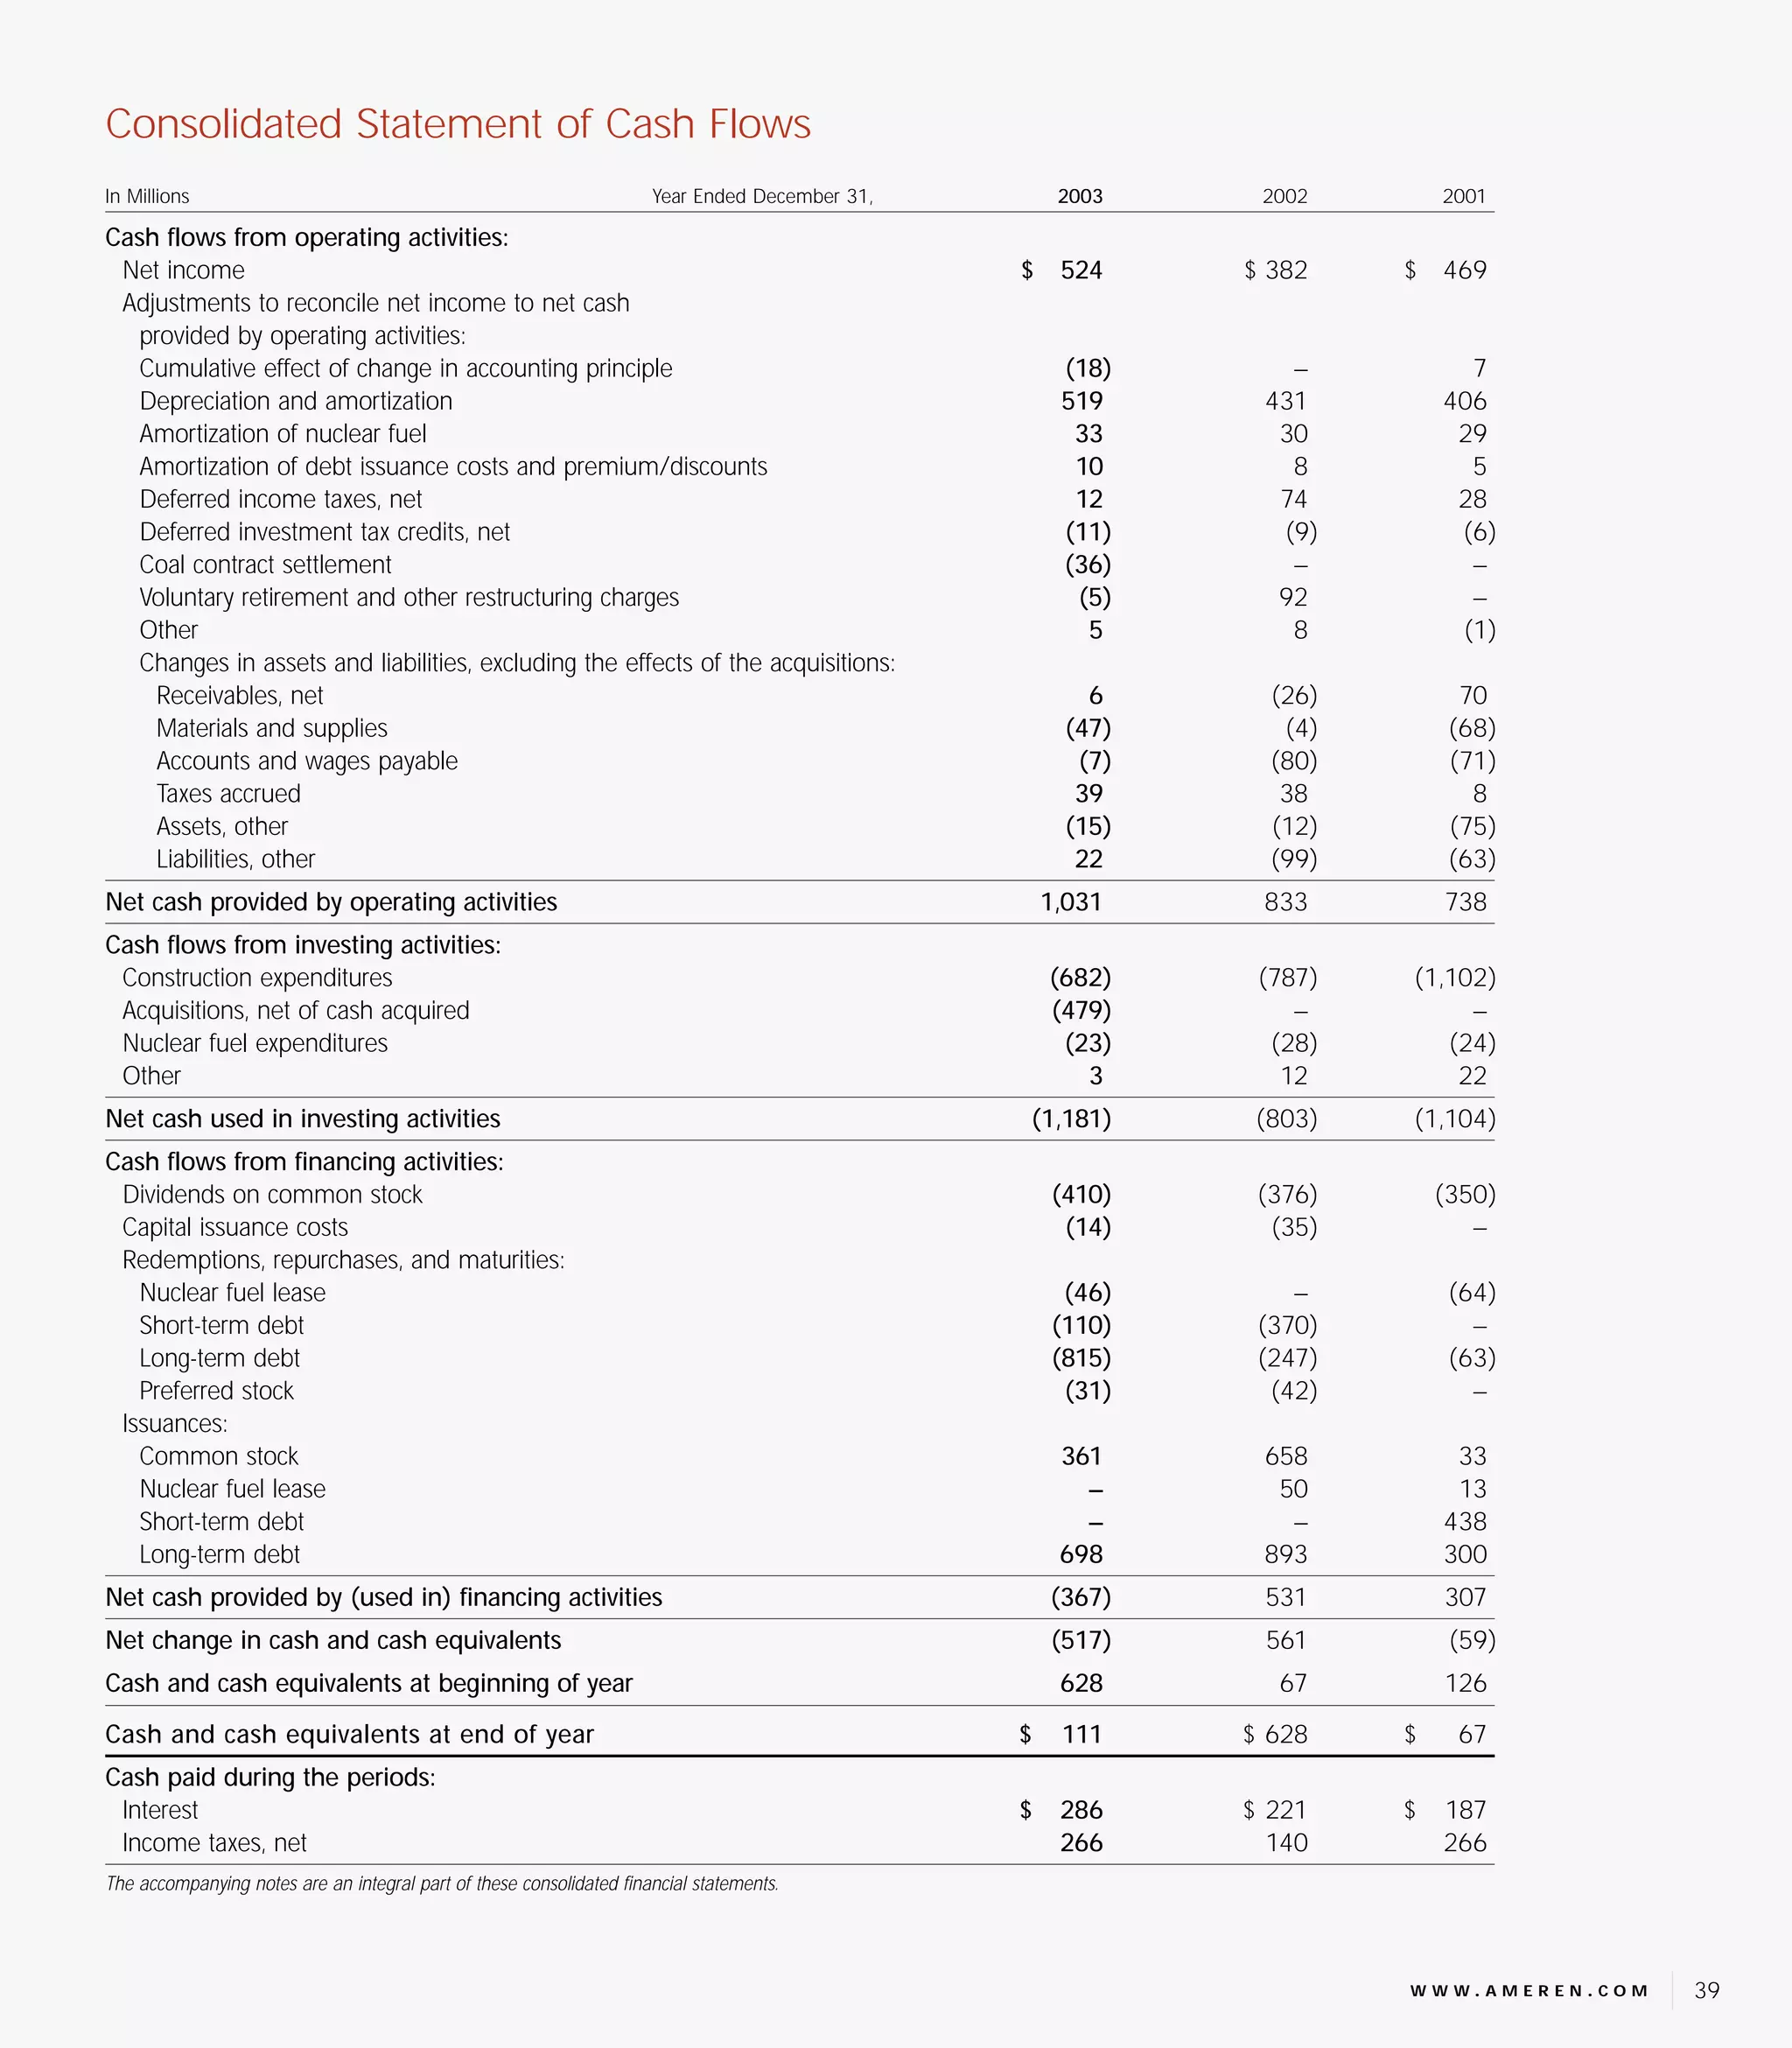
This document is Ameren's consolidated statement of income, balance sheet, and cash flows for the years ended December 31, 2003, 2002, and 2001.
In 2003, Ameren reported total operating revenues of $4.6 billion and net income of $524 million. Total assets were $14.2 billion as of December 31, 2003, with long-term debt of $4.1 billion and total stockholders' equity of $4.4 billion.
Cash provided by operating activities was $1 billion in 2003. Cash used in investing activities included $682 million for construction expenditures and $479 million for acquisitions. Financing activities included $410 million in dividends paid and $815 million in
- ConocoPhillips reported revenues of $34.7 billion for Q3 2004, up from $26.5 billion in Q3 2003, and net income of $2 billion, up from $1.3 billion.
- Earnings per share for Q3 2004 were $2.86, up from $1.90 in Q3 2003.
- Oil and gas production volumes were up slightly from Q3 2003, with crude oil production of 733 thousand barrels per day consolidated and 844 thousand barrels per day total.
- ConocoPhillips reported revenues of $47.9 billion for Q1 2006, up 23% from $38.9 billion in Q1 2005, with net income of $3.29 billion, up 13% from $2.91 billion.
- Oil and gas production increased from Q1 2005, with oil production up 777 thousand barrels per day, and gas production up 3.55 billion cubic feet per day.
- Refining and marketing sales volumes also increased compared to Q1 2005, with US refinery crude oil runs up 1.84 million barrels per day from 1.96 million.
This document provides financial highlights and selected financial data for ConocoPhillips for the first quarter of 2005 compared to the first quarter of 2004. Some key figures include:
- Net income for Q1 2005 was $2.912 billion compared to $1.616 billion in Q1 2004.
- Income from continuing operations was $2.923 billion in Q1 2005 compared to $1.603 billion in Q1 2004.
- Total worldwide crude oil and natural gas production was 942 thousand barrels of oil equivalent per day in Q1 2005.
- Total revenues for Q1 2005 were $38.918 billion compared to $30.217 billion in Q1 2004.
ConocoPhillips reported financial highlights for the second quarter of 2004 including revenues of $31.9 billion and net income of $2.1 billion. Earnings per share were $3.01 for the quarter. The company experienced higher crude oil and natural gas sales prices and volumes compared to the prior year. However, costs and expenses also increased, including purchases of crude oil and products, production and operating expenses, and taxes.
This document provides preliminary financial highlights and operating metrics for ConocoPhillips for the first quarter of 2004 compared to the first quarter of 2003. Some key figures include:
- Total revenues of $30.2 billion for the first quarter of 2004, up from $27.1 billion in the same period of 2003.
- Net income of $1.6 billion for the first quarter of 2004, up from $1.2 billion in the first quarter of 2003.
- Oil and gas production of 941 thousand barrels per day for the first quarter of 2004, up slightly from 935 thousand barrels per day in the same period of 2003.
el paso 22758BEF-CBE8-4368-BDC6-D02434EE5C13_EP_4Q08OpStatsFinalfinance49
The document provides operating statistics for El Paso Corporation for the fourth quarter of 2008. It includes consolidated statements of income, operating results, and business segment results for Pipelines, Exploration and Production, Marketing, Power, and Corporate/Other. Key details include a net loss of $1.68 billion for Q4 2008 driven by $2.66 billion in ceiling test charges in Exploration and Production. Pipelines EBIT was $319 million for Q4. Exploration and Production had an EBIT loss of $2.526 billion for the quarter due to the ceiling test charges.
The document provides operating statistics for El Paso Corporation for the first quarter of 2008. It includes:
1) Consolidated statements of income showing revenues of $1.269 billion for Q1 2008, operating income of $550 million, and net income of $219 million.
2) Segment information on earnings before interest and taxes for the company's four business segments: Pipelines at $405 million, Exploration and Production at $208 million, Marketing at $39 million, and Power at $52 million.
3) Additional data on throughput, volumes, prices and costs for the Pipelines and Exploration and Production segments.
This document provides financial highlights and selected financial data for ConocoPhillips for the three month and twelve month periods ending December 31, 2005 and 2004. Some key details include:
- Revenues for the three months ending December 31, 2005 were $52.2 billion compared to $40.1 billion for the same period in 2004.
- Net income for the twelve months ending December 31, 2005 was $13.5 billion compared to $8.1 billion for the same period in 2004.
- Earnings per share (diluted) for continuing operations for the twelve months ending December 31, 2005 were $9.63 compared to $5.79 for the same period in 2004.
This document provides financial highlights and operating data for ConocoPhillips for the fourth quarter and full year 2006 compared to 2005. Some key details:
- Revenues for Q4 2006 were $42.5 billion compared to $52.2 billion for Q4 2005. Full year revenues were $188.5 billion in 2006 versus $183.4 billion in 2005.
- Net income for Q4 2006 was $3.2 billion compared to $3.7 billion for Q4 2005. Full year net income was $15.6 billion in 2006 versus $13.5 billion in 2005.
- Average daily oil and gas production for Q4 2006 was 859 thousand barrels of oil equivalent for consolidated
Texas Eastern Transmission reported financial results for the second quarter of 2008. Revenue increased slightly from the prior year to $228 million, while net income decreased to $94 million from $107 million. Total assets increased to $5.3 billion from $5.1 billion at the end of 2007. The company continued to invest in pipeline infrastructure, with capital expenditures of $72 million for the first half of the year.
The document provides operating statistics for El Paso Corporation for the second quarter of 2008. It includes consolidated statements of income, consolidated operating results, and business segment results for Pipelines, Exploration and Production, Marketing, and Power. The Pipelines segment saw a decrease in throughput compared to the first quarter but an increase compared to the same period last year. The Exploration and Production segment saw higher earnings before interest and taxes compared to both periods last year. Overall, the company saw higher earnings from continuing operations compared to the same period last year.
marriott international Third Quarter 2007finance20
Marriott International reported financial results for the third quarter of 2007. Total revenues increased 12% compared to the prior year. Operating income decreased 20% due to higher expenses. Net income decreased 7% to $131 million. For the first nine months of 2007, total revenues increased 10% while net income increased 34% to $520 million compared to the prior year.
This document contains financial statements and exhibits from Covanta Holding Corporation for the first quarter of 2009 compared to the first quarter of 2008. It includes statements of income, reconciliation of net income to adjusted EBITDA, reconciliation of cash flow to adjusted EBITDA, and statements of cash flows. Adjusted EBITDA is a non-GAAP measure used to evaluate performance and compliance with debt covenants, and excludes items such as interest, taxes, depreciation, and amortization.
- ConocoPhillips reported financial results for the third quarter and first nine months of 2006. Total revenues were $49.6 billion for Q3 2006 and $146 billion for the first nine months of the year.
- Net income was $3.9 billion for Q3 2006, comparable to $3.8 billion for the same period in 2005. For the first nine months, net income was $12.4 billion in 2006 compared to $9.9 billion in 2005.
- Earnings per share on a diluted basis were $2.31 for Q3 2006 and $7.78 for the first nine months of 2006.
This document summarizes the expected effects of the merger between Duke Energy and Cinergy. Shareholders and customers can expect value and reliable, affordable service. Local communities can anticipate support and enhancement. Employees will find a safe workplace that supports growth while sustaining the environment. The merger aims to increase value for investors while serving customers, communities, employees, and protecting the environment. Financial details of both companies from 2001-2005 are provided.
This document provides financial highlights and operating data for ConocoPhillips for the first quarter of 2007 compared to the first quarter of 2006. Some key figures include:
- Net income of $3.546 billion in Q1 2007 compared to $3.291 billion in Q1 2006.
- Oil and gas production increased from the year-ago period, with crude oil production of 840 thousand barrels per day in Q1 2007 versus 777 thousand barrels per day in Q1 2006.
- Capital expenditures and investments totaled $2.847 billion in Q1 2007 compared to $4.514 billion in the same period of 2006.
- ConocoPhillips reported significantly higher revenues and net income for both the fourth quarter and full year 2004 compared to the same periods in 2003, driven by higher oil and gas prices and increased production volumes.
- Revenues for the fourth quarter of 2004 were $40.1 billion, up 54% from $26 billion in the fourth quarter of 2003. Net income for the fourth quarter was $2.4 billion, up 138% from $1 billion.
- For the full year 2004, revenues were $136.9 billion compared to $105.1 billion in 2003. Net income was $8.1 billion compared to $4.7 billion in 2003.
PPG Industries reported financial results for the second quarter and first half of 2008. Net sales increased 42% to $4.5 billion for the quarter due to acquisitions. Income from continuing operations was $250 million for the quarter and $350 million for the first half. Total debt increased to fund the acquisition of SigmaKalon, which contributed to higher interest expense. Segment income increased due to acquisitions, but was reduced by one-time acquisition related costs including inventory step-up costs and in-process R&D write-offs associated with SigmaKalon.
Texas Eastern Transmission reported financial results for the third quarter and first nine months of 2005. Revenues for the quarter were $230 million compared to $205 million for the same period in 2004. Net income for the quarter was $72 million compared to $58 million in 2004. For the first nine months of the year, revenues were $664 million and net income was $201 million, increases from the prior year. The company continues to transport and store natural gas through its pipeline systems while managing costs and obligations related to environmental remediation and ongoing legal matters.
This document summarizes Aetna's financial performance for the third quarter and first nine months of 2005 compared to the same periods in 2004. It shows that total revenue, health care costs, and income from continuing operations increased from the prior year periods. However, net income decreased due to a large tax refund received in 2004 that was not repeated in 2005. On a per share basis, income from continuing operations increased while net income decreased year-over-year due to the one-time tax refund in the prior period. Shareholders' equity also increased over this time period.
el paso 160DAEF8-9761-4AE9-925F-15301F29A4B9_2008_Summary_Reportfinance49
This document is El Paso Corporation's 2008 annual report which summarizes the company's financial and operating highlights for 2008. It discusses declines in operating income and earnings compared to previous years due to a $2.7 billion non-cash ceiling test charge in its Exploration & Production segment. However, it notes the Pipeline segment placed seven growth projects into service and increased its backlog of committed growth projects to $8 billion. The report provides an overview of accomplishments in 2008 and challenges faced by the company in a difficult market environment.
The document summarizes Henkel's financial results for the second quarter and first half of 2004 compared to the same periods in 2003. Net sales increased 9% in the second quarter and 6% year-to-date. Earnings from continuing operations rose 26% in the second quarter and 9% year-to-date due to growth across all business segments. Discontinued operations generated a large gain of $550 million from the exchange of businesses and increased earnings from discontinued operations significantly for both periods. As a result, net earnings increased substantially.
The document is Dover Corporation's 2007 Annual Report. It provides an overview of Dover as a diversified global manufacturer serving industrial and commercial markets. It discusses Dover's realignment into four business segments: Industrial Products, Engineered Systems, Fluid Management, and Electronic Technologies. The realignment enhances sharing of best practices, identifies synergy opportunities, provides direction for acquisitions, and creates leadership opportunities while providing clarity to shareholders.
community health systems annual reports 2003finance30
Community Health Systems is a leading operator of 72 general acute care hospitals across 22 states. It is headquartered in Brentwood, Tennessee and trades on the New York Stock Exchange under the symbol CYH. In 2003, the company reported net operating revenues of $2.8 billion, net income of $131 million, and earnings per share of $1.30 diluted. The document provides an overview of Community Health Systems including its hospital locations, key financial data, and operating performance over time.
This document provides a summary of Ameren's Q1 2007 earnings and earnings guidance for 2007. Some key points:
- Q1 2007 GAAP earnings per share were $0.59, excluding costs related to severe January 2007 storms. Non-GAAP earnings were $0.63 per share.
- Factors that impacted Q1 2007 earnings both positively and negatively compared to Q1 2006 are listed, such as higher electric and gas margins but also higher fuel prices and labor costs.
- 2007 earnings guidance on a non-GAAP basis is provided as $3.15-$3.60 per share, excluding costs from January 2007 storms and potential future charges. A reconciliation of the factors expected to
1) Mohawk Industries is a leading global flooring manufacturer with over 120 years in business. It produces carpet, ceramic tile, wood, stone, laminate, vinyl and other flooring products.
2) In 2004, Mohawk achieved record financial results with $5.9 billion in sales and $369 million in net earnings, increases of 18% and 19% respectively over the previous year.
3) Mohawk has a diverse customer base and end-use markets. It aims to cover all flooring needs through its broad portfolio of products, brands, manufacturing and distribution capabilities.
This document provides selected financial data for Mohawk Industries for the years 2002-1997. It includes income statement data such as net sales, costs, expenses, earnings, and earnings per share. It also includes balance sheet data such as working capital, assets, liabilities, and stockholders' equity. Key notes provide additional details on items in the financial statements such as restructuring costs, asset write-downs, legal settlements, and stock splits. The document also identifies two operating segments for Mohawk Industries following its acquisition of Dal-Tile in 2002 - the Mohawk segment and the Dal-Tile segment.
Mohawk Industries is a leading global flooring manufacturer that produces carpet, rugs, ceramic tile, wood, stone, laminate, and other flooring products. In 2006, Mohawk saw sales growth of 19% to $7.9 billion despite challenges in the housing market, due to its recent acquisition of Unilin and price increases. Earnings per share grew 17% compared to 2005. Mohawk invested $166 million in capital expenditures to increase production capacity and enhance customer service. Going forward, Mohawk aims to continue expanding its product categories, customer markets, and global presence through strategic investments and organizational changes.
1) Ameren reported 2007 earnings per share of $2.98 but expects 2008 EPS to be between $2.68-$3.08 due to various factors including weather, fuel prices, plant maintenance costs and regulatory proceedings.
2) Ameren aims for 4-6% annual EPS growth through 2010 and beyond, targeting over $4 EPS by 2011 and strong long-term shareholder returns.
3) Ameren provided its 2008 EPS guidance breakdown by segment and an overview of its regulatory proceedings calendar.
Dover's annual report outlines its consistent business philosophy of achieving and maintaining market leadership in every market it serves. The report discusses Dover's goals of perceiving customers' needs, providing better products/services than competitors, investing to maintain competitive advantages, and expecting a fair price. It emphasizes focusing on quality, innovation, service, and long-term orientation. Dover enhances leadership through acquisitions that strengthen existing markets or offer new ones. Intrinsic to Dover's success is decentralized management that gives autonomy to company presidents.
This document is Ameren Corporation's 2006 annual report. It highlights that in 2006 Ameren was committed to generating, delivering, and distributing electricity and natural gas safely and reliably while protecting the environment. It also discusses how Ameren worked to reduce plant emissions to meet new clean air regulations, responded effectively to severe storms to restore power to customers, and helped customers adapt to changing energy markets in Illinois. The financial highlights section at the end summarizes Ameren's 2006 financial results including operating revenues, expenses, income, earnings per share, dividends, stock information, assets, liabilities, and capitalization ratios.
This document provides selected financial data for Mohawk Industries for the years 2003-2002. It includes statements of earnings, balance sheets, and cash flows. It also discusses critical accounting policies including inventory valuation, accounts receivable, revenue recognition, goodwill and intangible asset impairments, and deferred taxes. The company acquired Dal-Tile in 2002 and Lees Carpet in 2003 to expand into ceramic tile and commercial carpet markets.
During the fourth quarter of 2008:
- The company repurchased 10 million shares at an average price of $46.15 per share, completing its $500 million share repurchase program.
- It acquired one company for $3.9 million to boost its Fluid Management segment.
- It sold a line of business for a $7.5 million gain in its Electronic Technologies segment.
- It incurred tax expenses of $28 million related to prior tax matters and discontinued operations.
Mohawk Industries is the second largest carpet manufacturer in the US. In 1999, Mohawk saw increases in net sales (12% to $3.1 billion), net earnings (23% to $157.2 million), and earnings per share (23% to $2.61 per share). Mohawk achieved strong growth through a combination of internal expansion and acquisitions, gaining market share despite only a 3% industry growth. While Mohawk's financial performance was strong, its stock price did not reflect this, leading the board to approve a share repurchase program to demonstrate confidence in the company's future.
Dover Corporation reported strong financial results for the second quarter of 2007, with record revenue, earnings, and bookings. Revenue increased 12% year-over-year to $1.9 billion, driven by both organic growth and acquisitions. Earnings per share grew 10% to $0.85 per share. Several industrial segments performed well including oil and gas equipment, mobile equipment, and process equipment. The company continued to generate strong free cash flow. Overall, Dover exceeded targets for most key financial metrics in the second quarter.
This document provides an agenda and background information for an investor presentation by Mohawk Industries. The presentation will be held in Charlotte, NC and include management presentations in the morning and tours of two Mohawk manufacturing facilities in the afternoon. Mohawk is a leading flooring manufacturer with market positions across major categories. It aims to deliver consistent financial performance through disciplined management and a vertically integrated business model.
The document is a transcript of Dover Corporation's third quarter 2008 earnings conference call. The key points are:
1) Dover reported solid third quarter results with EPS of $1.01, up 13% year-over-year, and revenues of $2 billion, up 5%.
2) Segment performance was mixed, with strong growth at Fluid Management but declines at Industrial Products and Engineered Systems.
3) Dover generated $306 million in free cash flow for the quarter, up from the prior year, and remains focused on acquisitions and returning capital to shareholders.
This document provides an overview and summary of Ameren Corporation's financial condition and results of operations. Some key points:
- Ameren is a public utility holding company with rate-regulated electric, gas, and non-rate regulated generation subsidiaries operating in Missouri and Illinois.
- In 2003, Ameren acquired CILCORP, adding over 200,000 electric and gas customers. Ameren also plans to acquire Illinois Power, adding over 1 million more customers, pending regulatory approval.
- Ameren's 2003 net income was positively impacted by the CILCORP acquisition, higher power prices on interchange sales, and cost reductions. This was partially offset by cooler weather reducing sales and an electric rate reduction in
Dover Corporation reported a 16% increase in EPS to $0.88 for Q3 2007 compared to $0.76 for Q3 2006. Revenue increased 15% to $1.84 billion. For the first nine months of 2007, EPS increased 11% to $2.36 while revenue increased 15% to $5.37 billion. The company achieved organic growth of 3.3% and acquisition growth of 9.6% in Q3. Looking ahead, Dover expects continued solid business in Q4 but with moderating growth and restructuring charges of $0.02-0.03 per share.
This document provides an annual report from Pilgrim's Pride Corporation for the year 2003. It summarizes the company's financial performance for the fiscal year, noting record sales of $2.6 billion and net income of $56 million. It highlights the acquisition of ConAgra Foods' chicken division, which doubled Pilgrim's Pride in size. The report expresses confidence that the acquisition will create significant growth opportunities by expanding Pilgrim's Pride's product offerings, distribution capabilities, and earnings potential. It outlines the company's strategic priorities going forward and optimism about realizing the full potential of the new, larger organization.
Revenues increased from $11.5 billion in 2006 to $12.8 billion in 2007 primarily due to higher electric utility revenues. Operating income increased from $2.6 billion to $2.8 billion between 2006 and 2007. Net income increased from $1.25 billion in 2006 to $1.31 billion in 2007, while basic earnings per share increased from $3.84 to $4.27 over the same period.
This document summarizes the reconciliation of total segment and other EBIT (earnings before interest and taxes) to net income and earnings available for common stockholders for Duke Energy for the three and six month periods ended June 30, 2003 and 2002. It shows EBIT by business segment and other items, total EBIT, expenses (interest, minority interest, income taxes), cumulative effect of accounting changes, net income, dividends/redemptions, and earnings available for common stockholders.
- The document contains financial statements and notes for American Express Bank Ltd for the years ended December 31, 2006 and 2005.
- It includes the consolidated statements of operations, balance sheets, cash flows, and changes in shareholder's equity.
- The notes provide information on significant accounting policies such as basis of presentation, foreign currency, amounts based on estimates, revenue recognition, and credit loss reserves.
This document contains the 2010 annual report and consolidated financial statements for an unnamed company. It includes the income statement, balance sheet, cash flow statement, and changes in shareholders' equity for 2010 and 2009. It also provides notes to the financial statements covering topics such as accounting principles, segment information, income statement notes, balance sheet notes, net financial debt, business combinations, risk management, and related party transactions. The scope of consolidation for 2010 is also included.
- Motorola reported net earnings of $692 million for the quarter ended April 2, 2005, up from $609 million in the previous year. Net sales increased 10% to $8.161 billion.
- Gross margin was $2.67 billion compared to $2.366 billion in 2004. Operating earnings increased to $865 million from $685 million the previous year.
- The Mobile Devices segment saw a 6% increase in net sales and operating earnings of $440 million compared to $406 million in 2004.
The document provides operating statistics for El Paso Corporation for the fourth quarter of 2008. It includes consolidated statements of income, operating results, and business segment results for Pipelines, Exploration and Production, Marketing, Power, and Corporate/Other. Key details include a net loss of $1.68 billion for Q4 2008 driven by $2.66 billion in ceiling test charges in Exploration and Production. Pipelines contributed operating income of $291 million in Q4. Exploration and Production had an operating loss of $2.39 billion in Q4 due to the ceiling test charges.
el paso 22758BEF-CBE8-4368-BDC6-D02434EE5C13_EP_4Q08OpStatsFinalfinance49
The document provides operating statistics for El Paso Corporation for the fourth quarter of 2008. It includes consolidated statements of income, operating results, and business segment results for Pipelines, Exploration and Production, Marketing, Power, and Corporate/Other. Key details include a net loss of $1.68 billion for Q4 2008 driven by $2.66 billion in ceiling test charges in Exploration and Production. Pipelines generated $319 million in EBIT for Q4. Exploration and Production had an EBIT loss of $2.53 billion for the quarter due to the ceiling test charges.
Motorola's net sales increased 23% to $10.01 billion in the first quarter of 2006 compared to $8.16 billion in the same period in 2005. Gross margin improved to $3.02 billion in 2006 from $2.66 billion previously. Overall earnings from continuing operations were $686 million in 2006, nearly flat compared to $692 million in 2005. Mobile Devices segment sales grew 45% and operating earnings increased 60% year-over-year.
The document provides operating statistics for El Paso Corporation for the second quarter of 2008. It includes consolidated statements of income, consolidated operating results, and business segment results for Pipelines, Exploration and Production, Marketing, and Power. The Pipelines segment reported earnings before interest and taxes of $295 million on throughput of 16,144 billion British thermal units per day for the quarter. Exploration and Production reported earnings of $281 million with average daily production volumes of 3.1 million barrels of oil equivalent. Marketing reported a loss of $154 million.
marriott international Second Quarter 2007finance20
Marriott International reported higher revenues and net income for the 12 and 24 week periods ending June 15, 2007 compared to the same periods in 2006. Revenues increased 11% and net income grew 11% for the quarterly period. For the half year, revenues rose 9% and net income increased 57%, which included the impact of a prior accounting change. Higher revenues were driven by increased rates across all lodging segments and timeshare sales.
GMAC reported a net loss of $724 million in Q4 2007 compared to a net income of $7.4 billion in Q4 2008. For the full year, GMAC reported a net loss of $2.3 billion in 2007 compared to a net income of $1.8 billion in 2008. Key factors contributing to the changes included an $11.4 billion gain on extinguishment of debt in Q4 2008 and impairment charges taken in both years. Revenues declined across most business segments from 2007 to 2008.
Nationwide reported strong financial results in 2005. Total revenue increased 6.7% to $21.8 billion due to growth in property and casualty premiums and life insurance premiums and policy charges. Net income rose 13.8% to $1.149 billion, driven by a 39.3% increase in profits for the property and casualty segment. However, earnings were partially offset by hurricane losses of $907 million and $725 million in reserve strengthening for asbestos and environmental exposures. Nationwide consists of property and casualty insurance, life insurance and retirement savings, and asset management businesses.
Marriott International reported financial results for the 16 and 52 week periods ending December 28, 2007. For the 16 week period, total revenues increased 8% to $4.089 billion compared to the same period in 2006. Net income decreased 20% to $176 million due primarily to a $60 million loss from discontinued synthetic fuel operations. For the 52 week period, base management fees increased 12% to $620 million and franchise fees grew 13% to $439 million, while total revenues rose to $1.240 billion.
- El Paso Corporation reported operating revenues of $1.598 billion and net income of $445 million for the third quarter of 2008.
- The Pipelines segment earned $278 million in earnings before interest and taxes, with throughput volumes averaging 4.605 trillion British thermal units per day on the Tennessee Gas Pipeline and 4.649 trillion British thermal units per day on the El Paso Natural Gas Pipeline.
- The Exploration and Production segment earned $528 million in operating income on average daily production volumes of 881 million cubic feet equivalent per day.
- El Paso Corporation reported financial results for the third quarter of 2008 with consolidated net income of $445 million compared to $155 million in the third quarter of 2007.
- The Pipelines segment saw earnings before interest and taxes of $278 million in the third quarter of 2008 compared to $275 million in the third quarter of 2007, while throughput increased.
- Exploration and Production saw earnings before interest and taxes increase to $528 million in the third quarter of 2008 from $228 million in the third quarter of 2007, with production volumes and realized prices increasing.
- Overall, the company reported higher earnings across most business segments in the third quarter of 2008 compared to the same period in 2007.
el paso 160DAEF8-9761-4AE9-925F-15301F29A4B9_2008_Summary_Reportfinance49
This document is El Paso Corporation's 2008 annual report which summarizes the company's financial and operating highlights for 2008. It discusses declines in operating income and earnings compared to previous years due to a $2.7 billion non-cash ceiling test charge in its Exploration & Production segment. However, it notes the Pipeline segment placed seven growth projects into service and increased its backlog of committed growth projects to $8 billion. The report provides an overview of accomplishments in 2008 and challenges faced by the company in a difficult market environment.
el paso 160DAEF8-9761-4AE9-925F-15301F29A4B9_2008_Summary_Reportfinance49
This document summarizes the financial and operating highlights for El Paso Corporation for the years 2008, 2007, and 2006. Some key points include:
- In 2008, El Paso reported a net loss of $860 million compared to net income of $1.073 billion in 2007. Operating revenues were $5.363 billion in 2008.
- Significant non-cash charges in 2008 included $2.7 billion in ceiling test charges for its Exploration & Production segment and a $125 million impairment related to its investment in Four Star.
- Pipeline throughput volumes across El Paso's owned and equity systems increased slightly from 2007 to 2008 but were up overall from 2006 levels. Exploration and production of natural gas declined slightly from
Comcast's 2005 annual report highlights that the company saw increases in revenues, operating cash flow, depreciation and amortization, operating income, income from continuing operations, and revenue generating units from 2004 to 2005. Some key financial details are revenues of $22.2 billion, operating cash flow of $8.5 billion, and operating income of $3.7 billion for 2005. The number of employees also grew to approximately 80,000 in 2005.
Smurfit-Stone reported a net loss of $19 million for Q1 2005, an improvement from a $66 million loss in Q1 2004. Net sales increased 8% to $2.1 billion. The company continued to face cost pressures from higher energy, fiber, and employee benefit costs which narrowed margins. However, demand was improving and costs were expected to moderate for the rest of the year, leading the company to expect a return to profitability in Q2 2005.
Smurfit-Stone Container Corporation reported second quarter 2005 net income of $1 million, an improvement from a $10 million net loss in the second quarter of 2004. Sales increased to $2.2 billion from $2 billion in the prior year period. For the first half of 2005, the company reported a net loss of $18 million, an improvement from a $76 million net loss in the first half of 2004, with sales of $4.2 billion compared to $4 billion in the prior year. The company expects third quarter results to be negatively impacted by unfavorable pricing trends but anticipates increased packaging demand in the seasonally strong period.
Smurfit-Stone Container Corporation reported a net loss of $229 million or $0.90 per share for Q3 2005, primarily due to a $293 million pretax restructuring charge related to mill closures in Canada and a paper machine closure. Net sales were $2.1 billion, down from $2.2 billion in Q3 2004. For the first nine months of 2005, the net loss was $247 million or $0.97 per share, compared to a net loss of $48 million or $0.19 per share for the same period in 2004. The company expects costs to increase in Q4 due to higher energy and freight expenses, while average corrugated prices are expected to
- Smurfit-Stone Container Corporation reported a net loss of $92 million for Q4 2005 and a net loss of $339 million for the full year 2005.
- Market conditions were unfavorable in the first half of 2005 with declining containerboard and corrugated prices but began to improve in Q4 2005. However, higher energy and fiber costs negatively impacted results.
- The company expects better comparisons going forward as market conditions improve but not meaningful sequential earnings growth in Q1 2006 due to seasonal factors and cost pressures.
- Smurfit-Stone Container Corporation reported a net loss of $64 million for Q1 2006 compared to a net loss of $19 million in Q1 2005.
- Net sales were $2.1 billion for Q1 2006, comparable to Q1 2005. However, higher costs such as energy and freight, as well as lower containerboard and corrugated prices, negatively impacted year-over-year results.
- The company expects results to improve in Q2 2006 but not reach breakeven, and anticipates returning to profitability in Q3 2006 as prices have rebounded and benefits from strategic initiatives continue.
Smurfit-Stone Container Corporation reported financial results for the second quarter of 2006. The company reported a net loss of $44 million compared to net income of $1 million in the second quarter of 2005. Sales were flat at $1.76 billion. For the first half of 2006 the company reported a net loss of $108 million compared to a net loss of $18 million in the first half of 2005, with sales of $3.5 billion, consistent with the previous year. The company's containerboard and corrugated containers segment saw improved operating profits compared to the previous quarter and previous year.
1) Smurfit-Stone Container Corporation reported a net income of $22 million or $0.09 per diluted share for Q4 2006, compared to a net loss of $0.36 per diluted share in Q4 2005.
2) For full year 2006, Smurfit-Stone reported a net loss of $71 million or $0.28 per diluted share, an improvement from a net loss of $339 million or $1.33 per diluted share in 2005.
3) The company exceeded its cost reduction target for 2006 from its strategic initiatives program, achieving $243 million in savings, and expects further meaningful earnings growth in 2007.
1) Smurfit-Stone Container Corporation reported a net loss of $55 million for the first quarter of 2007 compared to a net loss of $0.25 per share in the first quarter of 2006.
2) The company announced plans to close two containerboard mills with 200,000 tons of annual capacity and restart a previously idled paper machine with 170,000 tons of annual capacity to realign its mill system.
3) While costs increased due to higher wood and recycled fiber prices, the company expects improved second quarter results and a return to profitability due to moderating costs and stronger demand.
Smurfit-Stone Container Corporation reported financial results for the second quarter of 2007, with the following highlights:
1) Operating profits were up 59% from the previous quarter and 16% from the second quarter of 2006, driven by higher average prices across major product lines.
2) Sales increased 6% year-over-year to $1.87 billion for the second quarter.
3) The company expects higher mill production and continued price improvements to drive further financial gains in the third quarter.
Smurfit-Stone Container Corporation reported improved financial results in the third quarter of 2007 compared to the previous quarter:
- Adjusted net income nearly doubled from the second quarter, reaching $28 million.
- Strategic initiatives led to $18 million in quarterly benefits from cost reductions.
- Debt was reduced by $328 million through the sale of the Brewton, Alabama mill.
While earnings are expected to decrease in the fourth quarter due to seasonal factors, management expects ongoing benefits from strategic cost cutting initiatives and capital investments to drive continued margin improvements.
Vicinity Jobs’ data includes more than three million 2023 OJPs and thousands of skills. Most skills appear in less than 0.02% of job postings, so most postings rely on a small subset of commonly used terms, like teamwork.
Laura Adkins-Hackett, Economist, LMIC, and Sukriti Trehan, Data Scientist, LMIC, presented their research exploring trends in the skills listed in OJPs to develop a deeper understanding of in-demand skills. This research project uses pointwise mutual information and other methods to extract more information about common skills from the relationships between skills, occupations and regions.
[4:55 p.m.] Bryan Oates
OJPs are becoming a critical resource for policy-makers and researchers who study the labour market. LMIC continues to work with Vicinity Jobs’ data on OJPs, which can be explored in our Canadian Job Trends Dashboard. Valuable insights have been gained through our analysis of OJP data, including LMIC research lead
Suzanne Spiteri’s recent report on improving the quality and accessibility of job postings to reduce employment barriers for neurodivergent people.
Decoding job postings: Improving accessibility for neurodivergent job seekers
Improving the quality and accessibility of job postings is one way to reduce employment barriers for neurodivergent people.
South Dakota State University degree offer diploma Transcriptynfqplhm
办理美国SDSU毕业证书制作南达科他州立大学假文凭定制Q微168899991做SDSU留信网教留服认证海牙认证改SDSU成绩单GPA做SDSU假学位证假文凭高仿毕业证GRE代考如何申请南达科他州立大学South Dakota State University degree offer diploma Transcript
Falcon stands out as a top-tier P2P Invoice Discounting platform in India, bridging esteemed blue-chip companies and eager investors. Our goal is to transform the investment landscape in India by establishing a comprehensive destination for borrowers and investors with diverse profiles and needs, all while minimizing risk. What sets Falcon apart is the elimination of intermediaries such as commercial banks and depository institutions, allowing investors to enjoy higher yields.
Solution Manual For Financial Accounting, 8th Canadian Edition 2024, by Libby...Donc Test
Solution Manual For Financial Accounting, 8th Canadian Edition 2024, by Libby, Hodge, Verified Chapters 1 - 13, Complete Newest Version Solution Manual For Financial Accounting, 8th Canadian Edition by Libby, Hodge, Verified Chapters 1 - 13, Complete Newest Version Solution Manual For Financial Accounting 8th Canadian Edition Pdf Chapters Download Stuvia Solution Manual For Financial Accounting 8th Canadian Edition Ebook Download Stuvia Solution Manual For Financial Accounting 8th Canadian Edition Pdf Solution Manual For Financial Accounting 8th Canadian Edition Pdf Download Stuvia Financial Accounting 8th Canadian Edition Pdf Chapters Download Stuvia Financial Accounting 8th Canadian Edition Ebook Download Stuvia Financial Accounting 8th Canadian Edition Pdf Financial Accounting 8th Canadian Edition Pdf Download Stuvia
2. Elemental Economics - Mineral demand.pdfNeal Brewster
After this second you should be able to: Explain the main determinants of demand for any mineral product, and their relative importance; recognise and explain how demand for any product is likely to change with economic activity; recognise and explain the roles of technology and relative prices in influencing demand; be able to explain the differences between the rates of growth of demand for different products.
Economic Risk Factor Update: June 2024 [SlideShare]Commonwealth
May’s reports showed signs of continued economic growth, said Sam Millette, director, fixed income, in his latest Economic Risk Factor Update.
For more market updates, subscribe to The Independent Market Observer at https://blog.commonwealth.com/independent-market-observer.
University of North Carolina at Charlotte degree offer diploma Transcripttscdzuip
办理美国UNCC毕业证书制作北卡大学夏洛特分校假文凭定制Q微168899991做UNCC留信网教留服认证海牙认证改UNCC成绩单GPA做UNCC假学位证假文凭高仿毕业证GRE代考如何申请北卡罗莱纳大学夏洛特分校University of North Carolina at Charlotte degree offer diploma Transcript
Fabular Frames and the Four Ratio ProblemMajid Iqbal
Digital, interactive art showing the struggle of a society in providing for its present population while also saving planetary resources for future generations. Spread across several frames, the art is actually the rendering of real and speculative data. The stereographic projections change shape in response to prompts and provocations. Visitors interact with the model through speculative statements about how to increase savings across communities, regions, ecosystems and environments. Their fabulations combined with random noise, i.e. factors beyond control, have a dramatic effect on the societal transition. Things get better. Things get worse. The aim is to give visitors a new grasp and feel of the ongoing struggles in democracies around the world.
Stunning art in the small multiples format brings out the spatiotemporal nature of societal transitions, against backdrop issues such as energy, housing, waste, farmland and forest. In each frame we see hopeful and frightful interplays between spending and saving. Problems emerge when one of the two parts of the existential anaglyph rapidly shrinks like Arctic ice, as factors cross thresholds. Ecological wealth and intergenerational equity areFour at stake. Not enough spending could mean economic stress, social unrest and political conflict. Not enough saving and there will be climate breakdown and ‘bankruptcy’. So where does speculative design start and the gambling and betting end? Behind each fabular frame is a four ratio problem. Each ratio reflects the level of sacrifice and self-restraint a society is willing to accept, against promises of prosperity and freedom. Some values seem to stabilise a frame while others cause collapse. Get the ratios right and we can have it all. Get them wrong and things get more desperate.
1. Consolidated Statement of Income
2003
In Millions, Except Per Share Amounts Year Ended December 31, 2002 2001
Operating revenues:
$3,937
Electric $3,520 $3,507
648
Gas 315 342
8
Other 6 9
Total operating revenues 4,593 3,841 3,858
Operating expenses:
1,055
Fuel and purchased power 825 914
457
Gas purchased for resale 198 222
1,224
Other operations and maintenance 1,160 1,090
–
Voluntary retirement and other restructuring charges (Note 7) 92 –
(51)
Coal contract settlement (Note 7) – –
519
Depreciation and amortization 431 406
299
Taxes other than income taxes 262 261
Total operating expenses 3,503 2,968 2,893
Operating income 1,090 873 965
Other income and (deductions):
27
Miscellaneous income (Note 8) 21 35
(22)
Miscellaneous expense (Note 8) (50) (16)
Total other income and (deductions) 5 (29) 19
Interest charges and preferred dividends:
277
Interest 214 191
11
Preferred dividends of subsidiaries 11 12
Net interest charges and preferred dividends 288 225 203
Income before income taxes and cumulative effect
of change in accounting principle 807 619 781
Income taxes 301 237 305
Income before cumulative effect of change in accounting principle 506 382 476
Cumulative effect of change in accounting principle,
net of income taxes (benefit) of $12, $– and $(4) 18 – (7)
Net income $ 524 $ 382 $ 469
Earnings per common share – basic:
$ 3.14
Income before cumulative effect of change in accounting principle $ 2.61 $ 3.46
0.11
Cumulative effect of change in accounting principle, net of income taxes – (0.05)
Earnings per common share – basic $ 3.25 $ 2.61 $ 3.41
Earnings per common share – diluted:
$ 3.14
Income before cumulative effect of change in accounting principle $ 2.60 $ 3.45
0.11
Cumulative effect of change in accounting principle, net of income taxes – (0.05)
Earnings per common share – diluted $ 3.25 $ 2.60 $ 3.40
Dividends per common share $ 2.54 $ 2.54 $ 2.54
Average common shares outstanding (Note 1) 161.1 146.1 137.3
The accompanying notes are an integral part of these consolidated financial statements.
WWW.AMEREN .COM 37
2. Consolidated Balance Sheet
2003
In Millions, Except Per Share Amounts December 31, 2002
Assets:
Current assets:
$ 111
Cash and cash equivalents $ 628
326
Accounts receivable – trade (less allowance for doubtful accounts of $13 and $7, respectively) 266
221
Unbilled revenue 176
126
Miscellaneous accounts and notes receivable 44
487
Materials and supplies, at average cost 299
46
Other current assets 39
Total current assets 1,317 1,452
Property and plant, net (Note 4) 10,917 9,492
Investments and other non-current assets:
164
Investments in leveraged leases 38
212
Nuclear decommissioning trust fund 172
574
Goodwill and other intangibles, net –
320
Other assets 307
Total investments and other non-current assets 1,270 517
Regulatory assets 729 690
Total assets $14,233 $12,151
Liabilities and stockholders’ equity:
Current liabilities:
$ 498
Current maturities of long-term debt (Note 6) $ 339
161
Short-term debt (Note 5) 271
480
Accounts and wages payable 369
103
Taxes accrued 45
215
Other current liabilities 177
Total current liabilities 1,457 1,201
Long-term debt, net (Note 6) 4,070 3,433
Preferred stock of subsidiary subject to mandatory redemption (Note 10) 21 –
Deferred credits and other non-current liabilities:
1,853
Accumulated deferred income taxes, net 1,707
151
Accumulated deferred investment tax credits 149
821
Regulatory liabilities 788
413
Asset retirement obligations 174
699
Accrued pension and other postretirement benefits 476
190
Other deferred credits and liabilities 173
Total deferred credits and other non-current liabilities 4,127 3,467
Commitments and contingencies (Notes 1, 3, 14 and 15)
Preferred stock of subsidiaries not subject to mandatory redemption (Note 10) 182 193
Minority interest in consolidated subsidiaries 22 15
Stockholders’ equity:
Common stock, $.01 par value, 400.0 shares authorized –
2
shares outstanding of 162.9 and 154.1, respectively (Notes 1, 6 and 10) 2
2,552
Other paid-in capital, principally premium on common stock 2,203
1,853
Retained earnings 1,739
(44)
Accumulated other comprehensive income (loss) (93)
(9)
Other (9)
Total stockholders’ equity 4,354 3,842
Total liabilities and stockholders’ equity $14,233 $12,151
The accompanying notes are an integral part of these consolidated financial statements.
38 2003
AMEREN
3. Consolidated Statement of Cash Flows
2003
In Millions Year Ended December 31, 2002 2001
Cash flows from operating activities:
$ 524
Net income $ 382 $ 469
Adjustments to reconcile net income to net cash
provided by operating activities:
(18)
Cumulative effect of change in accounting principle – 7
519
Depreciation and amortization 431 406
33
Amortization of nuclear fuel 30 29
10
Amortization of debt issuance costs and premium/discounts 8 5
12
Deferred income taxes, net 74 28
(11)
Deferred investment tax credits, net (9) (6)
(36)
Coal contract settlement – –
(5)
Voluntary retirement and other restructuring charges 92 –
5
Other 8 (1)
Changes in assets and liabilities, excluding the effects of the acquisitions:
6
Receivables, net (26) 70
(47)
Materials and supplies (4) (68)
(7)
Accounts and wages payable (80) (71)
39
Taxes accrued 38 8
(15)
Assets, other (12) (75)
22
Liabilities, other (99) (63)
Net cash provided by operating activities 1,031 833 738
Cash flows from investing activities:
(682)
Construction expenditures (787) (1,102)
(479)
Acquisitions, net of cash acquired – –
(23)
Nuclear fuel expenditures (28) (24)
3
Other 12 22
Net cash used in investing activities (1,181) (803) (1,104)
Cash flows from financing activities:
(410)
Dividends on common stock (376) (350)
(14)
Capital issuance costs (35) –
Redemptions, repurchases, and maturities:
(46)
Nuclear fuel lease – (64)
(110)
Short-term debt (370) –
(815)
Long-term debt (247) (63)
(31)
Preferred stock (42) –
Issuances:
361
Common stock 658 33
–
Nuclear fuel lease 50 13
–
Short-term debt – 438
698
Long-term debt 893 300
Net cash provided by (used in) financing activities (367) 531 307
Net change in cash and cash equivalents (517) 561 (59)
Cash and cash equivalents at beginning of year 628 67 126
Cash and cash equivalents at end of year $ 111 $ 628 $ 67
Cash paid during the periods:
$ 286
Interest $ 221 $ 187
266
Income taxes, net 140 266
The accompanying notes are an integral part of these consolidated financial statements.
WWW.AMEREN .COM 39
4. Consolidated Statement of Common Stockholders’ Equity
2003
In Millions Year Ended December 31, 2002 2001
Common stock:
$ 2
Beginning balance $ 1 $ 1
–
Shares issued 1 –
2 2 1
Other paid-in capital:
2,203
Beginning balance 1,614 1,581
353
Shares issued (less issuance costs of $8, $20 and $ –, respectively) 637 33
–
Contracted stock purchase payment obligations (46) –
(4)
Employee stock awards (2) –
2,552 2,203 1,614
Retained earnings:
1,739
Beginning balance 1,733 1,614
524
Net income 382 469
(410)
Dividends (376) (350)
1,853 1,739 1,733
Accumulated other comprehensive income:
9
Beginning balance - derivative financial instruments 5 –
3
Change in derivative financial instruments 4 5
12 9 5
(102)
Beginning balance - minimum pension liability – –
46
Change in minimum pension liability (102) –
(56) (102) –
(44) (93) 5
Other:
(9)
Beginning balance (4) –
(5)
Restricted stock compensation awards (7) (5)
5
Compensation amortized and mark-to-market adjustments 2 1
(9) (9) (4)
Total stockholders’ equity $4,354 $3,842 $3,349
Comprehensive income, net of taxes:
$ 524
Net income $ 382 $ 469
Unrealized net gain on derivative hedging instruments,
5
net of income taxes of $2, $3 and $3, respectively 6 5
Reclassification adjustments for gains (losses) included in net income,
(2)
net of income taxes (benefit) of $(1), $(1) and $7, respectively (2) 11
Cumulative effect of accounting change, net of income taxes (benefit)
–
of $ –, $ – and $(7), respectively – (11)
Minimum pension liability adjustment, net of income taxes (benefit)
46
of $27, $(62) and $ –, respectively (102) –
Total comprehensive income, net of taxes $ 573 $ 284 $ 474
Common stock shares at beginning of period 154.1 138.0 137.2
8.8
Shares issued 16.1 0.8
Common stock shares at end of period 162.9 154.1 138.0
The accompanying notes are an integral part of these consolidated financial statements.
40 2003
AMEREN