DTE Energy reported a 25% increase in earnings for 2005 compared to 2004, driven by operational and regulatory improvements at its electric and gas utilities Detroit Edison and MichCon. It expects continued strong earnings growth in 2006 across all of its business segments. Non-utility operations performed well in 2005 and are expected to contribute further to earnings growth in 2006. The company provided guidance of $3.60 to $3.90 per share in operating earnings for 2006, a significant increase over 2005.
DTE Energy reported 2006 operating earnings of $593 million, or $3.33 per share, compared to 2005 operating earnings of $577 million, or $3.28 per share. Excluding synthetic fuels, 2006 operating earnings were $2.89 per share, above guidance. The company's electric utility had strong results due to higher rates and customers returning to service, while its gas utility saw lower earnings due to mild weather. DTE Energy reiterated 2007 operating earnings guidance, excluding synthetic fuels, of $2.60 to $2.80 per share and including synthetic fuels of $3.20 to $4.05 per share.
DTE Energy reported first quarter earnings of $149 million compared to $190 million in the first quarter of 2004. Operating earnings, which exclude non-recurring items, were $153 million compared to $152 million in the prior year. The company reconfirmed its 2005 earnings guidance range of $3.30 to $3.60 per share. Several business units saw lower earnings due to timing factors but the company expects to meet its annual targets.
Progress Energy reported 2005 ongoing earnings per share of $3.33, exceeding guidance. Fourth quarter ongoing earnings were $0.71 per share. Key highlights included resolving an IRS issue regarding synthetic fuel tax credits and providing 2006 ongoing earnings guidance of $3.15 to $3.35 per share. Both regulated utility segments benefited from higher margins though also incurred higher operating costs. Progress Ventures saw lower commercial operations margins.
Progress Energy reported third-quarter ongoing earnings of $1.44 per share, up 50% from the prior year, and GAAP earnings of $1.82 per share. Core regulated utility earnings grew due to higher retail margins from customer growth, usage, and weather, partially offset by higher operating costs. Synthetic fuel earnings increased significantly due to higher sales volumes and tax credit recognition. The company reaffirmed its 2005 ongoing earnings guidance range of $2.90 to $3.20 per share.
Progress Energy reported lower earnings in Q4 2007 and full year 2007 compared to the same periods in 2006, primarily due to divestitures. For Q4, core ongoing earnings were $0.40 per share compared to $0.59 last year, with higher O&M expenses partially offsetting factors. For full year, core ongoing earnings were $2.81 per share compared to $2.63 last year, helped by lower taxes and favorable weather partially offset by higher O&M. Progress Energy reaffirmed its 2008 ongoing earnings target of $3.05 per share, within a range of 10 cents.
DTE Energy reported a loss for the second quarter of 2006 compared to earnings in the same period in 2005. Operating earnings excluding special items were nearly break-even, with higher earnings from the electric utility offset by losses in other segments due to oil hedging costs and falling natural gas prices. Despite the quarterly loss, DTE maintained its full-year 2006 earnings guidance. Capital investment continued across all business segments to improve operations and support growth.
Progress Energy reported first quarter 2005 results, with ongoing earnings of $0.52 per share and GAAP earnings of $0.38 per share. Core ongoing earnings, which exclude synthetic fuels, were $0.53 per share, up from $0.45 per share in the prior year. Approximately 1,450 employees elected to retire under a voluntary enhanced retirement program. Progress Energy reaffirmed its 2005 ongoing earnings guidance of $2.90 to $3.20 per share.
DTE Energy reported earnings of $186 million for the first quarter of 2004, up from $155 million in the first quarter of 2003. Operating earnings, which exclude non-recurring items, were $151 million, comparable to the $178 million reported in the first quarter of 2003. Earnings were impacted by warmer weather and increased uncollectable accounts at the company's gas distribution business. The company expects to receive rate relief in 2004 that will help improve earnings performance for the year.
DTE Energy reported lower third quarter earnings compared to the previous year. Earnings were down due to a decline in operating earnings at Detroit Edison, impacted by mild weather and loss of customers to electric choice programs. While non-regulated businesses performed well, regulatory uncertainties at the utilities impacted overall results. Management expects resolutions to rate cases and improvements to electric choice programs to strengthen earnings in 2005.
Progress Energy announces its 2007 second-quarter results. It reported a GAAP loss of $0.75 per share compared to a loss of $0.19 per share for the same period last year, due to losses from exiting its merchant energy segment. However, its core ongoing earnings were $0.59 per share compared to $0.47 per share last year, due to lower interest expense and income taxes. It reaffirmed its 2007 core ongoing earnings guidance of $2.70 to $2.90 per share. Its core businesses of electric utilities continued to perform well in the second quarter.
DTE Energy reported 2004 earnings of $431 million, down from 2003 earnings of $521 million. Operating earnings for 2004 were $427 million, down from $500 million in 2003. Earnings declined due to factors such as mild weather, lower retail customer sales, and higher expenses. However, the company completed several regulatory proceedings favorably and expects earnings to improve in 2005 with resolution of outstanding rate cases and continued non-utility business growth. DTE Energy reconfirmed its 2005 earnings guidance of $3.30 to $3.60 per share.
Progress Energy announces third quarter 2007 results. Core ongoing earnings per share were $1.21 compared to $1.06 for the same period last year due to favorable weather, lower taxes, and increased wholesale sales. Non-core ongoing losses were $0.07 per share compared to earnings of $0.03 last year. The company reaffirms 2007 core ongoing earnings guidance of $2.70 to $2.90 per share.
Progress Energy reported first quarter 2006 earnings of $0.18 per share, down from $0.38 per share in the first quarter of 2005. Core ongoing earnings were $0.45 per share, lower than the $0.53 per share in the prior year due to unfavorable weather and higher costs, partially offset by increased sales. Non-core ongoing earnings increased to $0.06 per share due to prior year reversals and gains on sales. The company reaffirmed 2006 core ongoing earnings guidance of $2.45 to $2.65 per share but did not provide guidance for non-core earnings due to uncertainty around synthetic fuel tax credits. Recent developments included the successful resolution of an IRS audit and
Progress Energy reported a net loss of $0.19 per share for Q2 2006, compared to a net loss of $0.01 per share in Q2 2005. Ongoing earnings were $0.32 per share in Q2 2006, down from $0.63 per share in Q2 2005. Core ongoing earnings were $0.43 per share in Q2 2006, down from $0.53 per share in Q2 2005. Progress Energy also announced the sale of its natural gas assets for $1.2 billion and reaffirmed its 2006 ongoing earnings guidance.
Progress Energy reported first quarter 2004 ongoing earnings of $0.64 per share compared to $0.84 per share in the first quarter of 2003. GAAP earnings were $0.45 per share compared to $0.94 per share in the prior year. The decrease in ongoing and GAAP earnings was primarily due to lower wholesale sales, higher O&M costs, and common stock dilution. However, most business lines delivered results consistent with plans. Progress Energy reaffirmed its 2004 earnings guidance of $3.50 to $3.65 per share. Significant events in the quarter included renewing the Robinson Nuclear Plant license for 20 additional years and completing a power uprate at Brunswick Nuclear Unit 1.
Progress Energy announces its 2006 fourth-quarter and full-year financial results. For the fourth quarter, it reports GAAP earnings of $1.01 per share compared to $0.62 per share the previous year, driven by gains from selling natural gas assets offset by asset impairments. Ongoing earnings were $0.65 per share compared to $0.72 the previous year due to lower synthetic fuel production and mild weather. For the full year, GAAP earnings were $2.28 per share compared to $2.82 the previous year, while ongoing earnings were $2.58 per share, in line with guidance. The company provides 2007 ongoing earnings guidance of $2.70-$2.90
Progress Energy reported third-quarter 2008 earnings results and updated full-year 2008 earnings guidance. Key highlights include:
- Third-quarter GAAP earnings of $1.19 per share compared to $1.24 per share in third-quarter 2007.
- Third-quarter ongoing earnings of $1.17 per share, matching third-quarter 2007 ongoing earnings.
- Updated 2008 ongoing earnings guidance to $2.95 to $3.05 per share, the lower end of the previously announced range.
DTE Energy reported strong third quarter 2006 earnings of $188 million compared to $4 million in third quarter 2005. Operating earnings, which exclude non-recurring items, were $255 million in third quarter 2006 compared to $5 million in third quarter 2005. All of DTE Energy's business segments experienced increased operating earnings except for Gas Utility which typically has a seasonal loss in the third quarter. DTE Energy tightened its full year 2006 operating earnings guidance excluding synthetic fuels to be between $2.42 to $2.53 per share.
Progress Energy announced its 2008 second-quarter results, reporting GAAP earnings of $0.79 per share compared to a loss of $0.75 per share in the previous year. Ongoing earnings were $0.77 per share compared to $0.56 per share last year. The company reaffirmed its 2008 ongoing earnings guidance of $3.05 per share, with a range of 10 cents above and below the target. Progress Energy saw increased wholesale revenues and AFUDC equity contributions in the second quarter compared to the previous year. The company also received approval for two new nuclear reactors in Florida and submitted a license application to the Nuclear Regulatory Commission.
DTE Energy reported second quarter 2007 earnings of $385 million, up from a loss of $33 million in the second quarter of 2006. Operating earnings were $101 million for the quarter, an increase from an operating loss of $1 million in the prior year. The sale of the company's Antrim Shale gas business and increased non-utility earnings contributed to the earnings growth. DTE Energy also reported year-to-date cash flow from operations of approximately $998 million, a 12% increase from the previous year. The company reiterated its 2007 operating earnings guidance excluding synthetic fuel of $450-485 million and including synthetic fuel of $150-215 million.
Starbucks Corporation Fiscal 2005 Annual Report summarizes Starbucks' global growth and performance over the past year in 3 key areas:
1. Starbucks opened 1,672 new stores globally, growing to over 10,500 locations in 37 countries. Revenue grew 20% to a record $6.4 billion and earnings per share grew 30% to $0.61.
2. Starbucks expanded into new markets like China, introduced new products like ready-to-drink coffee in Asia, and leveraged cross-market learnings to drive innovations.
3. Starbucks remained committed to ethical sourcing, environmental sustainability, and using its scale to have a positive social impact worldwide.
The document outlines the charter of the Nominating and Corporate Governance Committee of Starbucks Corporation. It establishes that the committee is responsible for developing policies to properly constitute the board of directors and fulfill fiduciary obligations to shareholders. The charter defines the committee's composition, meeting procedures, authority, and responsibilities which include identifying and screening director candidates, appointing board committees, evaluating board performance, and reviewing corporate governance principles and board compensation.
This document contains consolidated financial statements for DTE Energy Company for the years ended December 31, 2008 and 2007. It includes statements of financial position, operations, cash flows, and supplemental sales analysis. The statements of financial position show total assets of $24.6 billion as of December 31, 2008, including property, plant and equipment of $11.4 billion, and total liabilities and equity of also $24.6 billion. The statements of operations indicate net income of $546 million for 2008 compared to $971 million for 2007. Cash flows from operating activities were $1.1 billion in 2008. Electric sales and revenues for Detroit Edison decreased year-over-year for the fourth quarter and year-to-
- Norfolk Southern Corporation controls a major freight railroad, Norfolk Southern Railway Company, which operates approximately 21,000 miles of track in 22 U.S. states.
- Coal transport is Norfolk Southern's largest commodity, accounting for 29% of revenues in 2008. General merchandise and intermodal freight also make up significant portions of revenues.
- Norfolk Southern handles a variety of goods for industries located along its rail network, as well as interchange traffic from other railroads. Rates are determined predominantly by private contracts rather than government regulation.
The document discusses Joseph Rigby's presentation on the strategic positioning of Southeast Utilities. It summarizes the company's strategic focus on power delivery, Conectiv Energy, and Pepco Energy Services. It also outlines the goals for the power delivery business, including sales growth, infrastructure investment, operational excellence, and constructive regulatory outcomes to deliver average annual earnings growth of at least 4%. Key infrastructure projects are highlighted.
Pepco Holdings, Inc. held an analyst conference on October 5-6, 2004 to discuss the company's performance. The presentation included an overview of PHI's businesses, strategy, and corporate governance practices. It noted PHI has $7.1 billion in revenues and focuses on its regulated electric and gas delivery business, which accounts for 72% of operating income. The Power Delivery segment was discussed, which includes the transmission and distribution of electricity to 1.8 million customers across several mid-Atlantic states.
The document is a notice and proxy statement for the annual meeting of stockholders of Norfolk Southern Corporation to be held on May 14, 2009. It provides information on voting procedures, the agenda items to be voted on which include election of directors and ratification of auditors, and summaries of other matters such as director and executive compensation. Stockholders are requested to vote by proxy prior to the meeting.
The document summarizes a presentation given by Joseph M. Rigby, CFO of Pepco Holdings, Inc. (PHI) at an investor conference on March 28, 2006. The presentation outlines PHI's strategy to remain a regional diversified energy delivery and competitive services company focused on operational excellence. It discusses PHI's power delivery business, Conectiv Energy, and Pepco Energy Services. The presentation also provides financial performance summaries and projections showing PHI's ability to cover dividends and capital expenditures with cash from operations.
DTE Energy reported 2006 earnings of $433 million, down from $537 million in 2005, due to reduced synthetic fuel production and asset impairments. However, operating earnings were $593 million in 2006, up from $577 million in 2005, driven by better performance at Detroit Edison and Energy Trading. Cash flow from operations increased 50% to $1.5 billion in 2006. DTE Energy expects 2007 operating earnings, excluding synthetic fuel, to be $2.60-$2.80 per share and synthetic fuel to contribute $0.60-$1.25 per share.
DTE Energy reported first quarter earnings of $149 million compared to $190 million in the first quarter of 2004. Operating earnings, which exclude non-recurring items, were $153 million compared to $152 million in the prior year. The company reconfirmed its 2005 earnings guidance range of $3.30 to $3.60 per share. Several business units saw lower earnings due to timing factors but the company expects to meet its annual targets. Moody's upgraded its outlook for DTE Energy to stable due to expected improvement in financial performance over the next few years.
DTE Energy reported lower second quarter earnings compared to the previous year, but operating earnings were higher. While the electric and gas utilities saw improved earnings, the non-utility businesses had lower earnings due to accounting deferrals and oil hedging losses. However, DTE Energy reaffirmed its full-year operating earnings guidance.
DTE Energy reported 2004 earnings of $431 million, down from 2003 earnings of $521 million. Operating earnings for 2004 were $427 million, down from $500 million in 2003. The company maintained its 2005 earnings guidance of $3.30 to $3.60 per share. Key factors impacting 2004 results included mild weather, lower utility sales from customer choice programs, and higher power plant and benefit costs. However, the company completed favorable rate cases and expects regulatory resolutions and non-utility growth to improve 2005 earnings.
DTE Energy reported third quarter earnings and revised its 2005 earnings guidance downwards due to timing-related accounting items from rising energy prices. Reported earnings were $4 million compared to $93 million in Q3 2004, while operating earnings excluding non-recurring items were $5 million compared to $97 million. Both the Detroit Edison electric utility and MichCon gas utility showed strong year-over-year improvements in operating earnings. However, earnings from power and fuel transportation were impacted by accounting deferrals from synfuel revenue and gas/power contracts that are expected to reverse in Q4 2005 and 2006. As a result, DTE lowered its 2005 operating earnings guidance to $3.10 to $3.30 per
DTE Energy reported third quarter earnings of $4 million, down significantly from $93 million in the same period last year. Operating earnings, which exclude non-recurring items, were $5 million compared to $97 million last year. Earnings were impacted by timing-related accounting items from energy trading contracts and deferred synfuel revenue. Excluding these items, operating earnings would have been higher. DTE also lowered its full-year 2005 operating earnings guidance due to mark-to-market losses but expects improvement in 2006 as some timing items reverse. Underlying business performance was strong, with improved earnings at Detroit Edison and MichCon utilities.
DTE Energy reported a loss for the second quarter of 2006 compared to a profit in the same period in 2005. Operating earnings, which exclude non-recurring items, were down slightly from the prior year. The company maintained its full-year 2006 earnings guidance despite pressure from high oil prices impacting its synfuel operations. Capital investment projects across its utility and non-utility businesses remained on track.
DTE Energy reported strong third quarter 2006 earnings of $188 million compared to $4 million in third quarter 2005. Operating earnings, which exclude non-recurring items, were $255 million in third quarter 2006 compared to $5 million in third quarter 2005. All of DTE Energy's business segments experienced increased operating earnings except for Gas Utility which typically has a seasonal loss in the third quarter. DTE Energy tightened its full year 2006 operating earnings guidance excluding synthetic fuels to be between $2.42 to $2.53 per share.
DTE Energy reported earnings of $186 million for the first quarter of 2004, up from $155 million in the first quarter of 2003. Operating earnings, which exclude non-recurring items, were $151 million, comparable to the $178 million reported in the first quarter of 2003. Earnings were impacted by warmer weather and increased uncollectable accounts at the company's gas distribution business. The company expects to receive rate relief in 2004 that will help improve earnings performance for the year.
DTE Energy reported lower third quarter earnings compared to the previous year. Earnings were $93 million compared to $176 million in 2003. Operating earnings were also down, at $69 million versus $114 million the year before. The decline was largely due to lower revenues at Detroit Edison from mild weather and customers switching to electric choice programs. However, DTE Energy expects regulatory proceedings to improve the financial outlook for its utility businesses and continued strong performance from non-regulated operations.
DTE Energy reported second quarter earnings of $35 million compared to a loss of $39 million in the second quarter of 2003. Operating earnings, which exclude non-recurring items, were $39 million in the second quarter of 2004 compared to $70 million in the same period of 2003. For the six months ended June 30, 2004, reported earnings were $225 million compared to $116 million in 2003. Operating earnings were negatively impacted by Michigan's Electric Choice program and increased pension and healthcare expenses at Detroit Edison and MichCon. DTE Energy expects higher earnings from its synfuels business and increased its 2004 earnings guidance for non-regulated businesses.
DTE Energy reported second quarter earnings of $35 million compared to a loss of $39 million in the second quarter of 2003. Operating earnings, which exclude non-recurring items, were $39 million in the second quarter of 2004 compared to $70 million in the same period of 2003. For the six months ended June 30, 2004, reported earnings were $225 million compared to $116 million in 2003. Operating earnings were negatively impacted by Michigan's Electric Choice program and increased pension and healthcare expenses at Detroit Edison and MichCon. However, non-regulated businesses performed well with increased earnings from coal and energy marketing.
DTE Energy announced its 2007 financial results. Reported earnings were $971 million or $5.70 per share, up from $433 million or $2.43 per share in 2006. This was largely driven by asset sales. Operating earnings, which exclude asset sales, were $2.82 per share, down slightly from $2.89 per share in 2006. For 2008, DTE Energy expects operating earnings between $2.70 to $3.10 per share and continues its focus on investments in its utility businesses.
DTE Energy announced its 2007 financial results. Reported earnings were $971 million or $5.70 per share, up from $433 million or $2.43 per share in 2006. This was largely driven by asset sales. Operating earnings excluding special items were $2.82 per share, down slightly from $2.89 per share in 2006. DTE Energy expects over 80% of its earnings to come from its utility businesses going forward and provided 2008 operating earnings guidance of $2.70 to $3.10 per share.
DTE Energy reported earnings for 2003 fell 18% from 2002, driven by weak results at its utility subsidiaries, Detroit Edison and MichCon. Earnings at Detroit Edison dropped 31% due to impacts of Michigan's Electric Choice program, as well as higher costs and mild weather. MichCon saw a 26% rise in operating expenses. The CEO noted regulatory issues need resolution and Electric Choice program flaws addressed for financial health of the utilities. Non-regulated operations increased earnings 7% and continued stable growth, but regulated businesses face financial pressure until regulatory issues are resolved.
DTE Energy reported earnings of $521 million for 2003, down 18% from 2002, driven by weak results at its utility subsidiaries Detroit Edison and MichCon. Detroit Edison's earnings dropped 31% to $246 million due to impacts of Michigan's electric choice program, higher costs such as pensions and healthcare, and storms. MichCon saw a 26% rise in operating costs. The CEO said they need rate relief from the MPSC and changes to the electric choice program to make it fair to customers and utilities.
Progress Energy reported 2004 ongoing earnings of $3.06 per share and GAAP earnings of $3.13 per share. For the fourth quarter, ongoing earnings were $0.62 per share and GAAP earnings were $0.80 per share. For 2005, ongoing earnings guidance was set at $2.90 to $3.20 per share. Key drivers for 2005 earnings included customer growth and usage offset by higher O&M costs and the sale of Progress Rail. Significant events in 2004 included hurricane impacts, regulatory filings, and asset sales.
Duke Energy reported higher earnings per share in the first quarter of 2005 compared to the previous year. Earnings per share were $0.91 versus $0.34 in 2004, driven by gains from the sale of assets in the Field Services business and improved performance across most business units. Interest expense was lower due to debt reduction efforts. Duke Energy will hold an earnings call to discuss the results and outlook further.
DTE Energy raised its 2008 earnings guidance due to strong expected performance across several business segments. It reported first quarter 2008 earnings of $212 million compared to $134 million in first quarter 2007. Operating earnings for first quarter 2008 were $128 million compared to $112 million in first quarter 2007, driven by higher earnings from energy trading. Several business segments experienced improved earnings compared to first quarter 2007. DTE Energy also saw higher cash flows from operations compared to first quarter 2007.
The document provides an overview and summary of PHI's strategy and performance across its various business segments. PHI aims to remain a regional diversified energy delivery and competitive services company focused on value creation and operational excellence. Key aspects include achieving constructive regulatory outcomes and 4% annual earnings growth for its power delivery utilities, optimizing assets and market opportunities for Conectiv Energy, and expanding Pepco Energy Services into additional markets. Financial performance has been positively impacted by infrastructure investments and sales growth, though earnings have been reduced in some jurisdictions due to higher standard offer service pricing.
This document provides an overview of PHI and its strategy for positioning itself for success in a dynamic industry. PHI's strategy is to remain a diversified regional energy delivery and competitive services company focused on value creation and operational excellence. For its power delivery utility operations, PHI's goals are to operate with excellence, achieve constructive regulatory outcomes, invest in infrastructure, and deliver at least 4% annual average earnings growth. PHI's service territory has a robust economy that is less susceptible to downturns and includes diverse government and private sectors.
This document provides an overview of PHI's 41st EEI Financial Conference held from November 5-8, 2006. It includes sections on PHI's financial performance for Q3 and year-to-date 2006, drivers of performance, sales and customer trends, regulated distribution summaries, upcoming regulatory activities including transmission formula rate filings and rate cases, and PHI's proposed MAPP transmission project. Key highlights are lower sales due to mild weather, lower transmission revenue, and plans to file rate cases in late 2006/early 2007.
This document provides an overview and summary of Power Holdings Inc.'s (PHI) various business segments. It discusses PHI's regulated electric and gas delivery business, which accounts for 67% of operating income. It also summarizes Conectiv Energy's competitive merchant generation and load service business, which accounts for 33% of operating income. Key highlights from rate cases and recent regulatory activities involving PHI's delivery businesses are also provided. The document contains forward-looking statements and non-GAAP financial measures.
The document provides an overview of Pepco Holdings Inc.'s (PHI) power delivery business and regulatory environment. It summarizes PHI's sales and customer growth projections, infrastructure investment strategy including the proposed Mid-Atlantic Power Pathway transmission project and Blueprint for the Future initiative. Recent distribution rate case outcomes for PHI's utilities are also summarized. The document is intended as a presentation for investors on PHI's positioned for success through its regulated electric and gas delivery business.
The document provides an overview of Pepco Holdings Inc.'s (PHI) various businesses including its regulated electric and gas delivery business, competitive energy generation business, and energy services business. It discusses PHI's infrastructure investment strategies, the status of major projects like the Mid-Atlantic Power Pathway, and the company's regulatory environment. Financial projections show expectations for continued investment and growth across PHI's businesses.
The document discusses Pepco Holdings' strategic focus on infrastructure investments and customer programs to position the company for continued success. It outlines plans to invest $1.2 billion in the Mid-Atlantic Power Pathway transmission project through 2014 and $646 million in advanced metering infrastructure and other programs through the company's Blueprint for the Future initiative between 2008-2014. Regulatory support is essential for cost recovery for these investments, which aim to enhance reliability, manage costs and protect the environment for customers.
This document provides an overview of Pepco Holdings' transmission and distribution business. It discusses plans to invest over $5 billion from 2007-2012 to upgrade aging infrastructure and improve reliability. A key project is the $1.05 billion Mid-Atlantic Power Pathway, a 230-mile 500kV transmission line from Northern Virginia to Southern New Jersey to be completed by 2013. The presentation outlines the project timeline, environmental stewardship efforts, and cost recovery approach through PJM and FERC. It also reviews the company's focus on replacing aging transmission equipment to further enhance reliability.
The document provides an overview of Pepco Holdings, Inc.'s (PHI) strategy to build shareholder value. PHI aims to increase investment in infrastructure through its Blueprint programs to modernize its electric grid. It also plans growth for its competitive energy businesses, Conectiv Energy and Pepco Energy Services. PHI expects its regulated Power Delivery business to remain the primary driver of earnings, contributing 60-70% of operating income over the planning period through infrastructure investments and favorable regulatory outcomes.
This document provides an overview of Pepco Holdings, Inc.'s power delivery business. It discusses planned infrastructure investments totaling $4.99 billion from 2008-2012 to improve reliability, support load growth, and implement new technology. A key project is the $1.05 billion Mid-Atlantic Power Pathway transmission line. The document also reviews regulatory highlights, including recent rate cases, and outlines operational and financial summaries for the company's distribution and transmission businesses.
- Pepco Holdings held its annual meeting and provided its annual report to shareholders.
- In 2002, Pepco Holdings earned $210.5 million in consolidated earnings, or $1.61 per share. Earnings were driven by strong performance from regulated utility businesses and some competitive energy businesses.
- The letter discusses the company's strategy, leadership, and financial and operational performance across its various business segments in 2002. It also encourages shareholders to vote and continue supporting the company.
- Pepco Holdings provided its first annual report after merging Pepco and Conectiv in August 2002.
- In 2002, PHI earned $210.5 million, or $1.61 per share, on $4.3 billion in revenue. Excluding merger costs, earnings were $1.74 per share.
- The letter discusses the company's regulated utility and competitive energy businesses, noting stable earnings from utilities and growth potential from competitive businesses. It encourages shareholders to vote and thanks them for their confidence and investment.
This document provides a summary of Pepco Holdings' 2004 annual report and proxy statement. Key points include:
1) Pepco Holdings reported improved financial performance in 2004 with consolidated earnings of $258.7 million, up from $113.5 million in 2003, driven by improved performance of competitive energy businesses.
2) The company made progress on reducing debt and preferred stock by $480 million in 2004 and achieved a total shareholder return of over 22% for 2003-2004.
3) The regulated power delivery business continues as the primary focus and driver of steady cash flow. Earnings from this segment improved to $233.4 million in 2004.
4) Competitive energy businesses also posted
The document provides details on Pepco Holdings' 2003 performance and future plans. It discusses challenges faced in 2003 including an energy trading loss, Mirant's bankruptcy, and Hurricane Isabel. However, actions taken in 2003 such as divesting non-core businesses and reducing risk are expected to set the stage for future earnings growth. The company remains focused on strengthening its core power delivery business and improving customer satisfaction.
This document provides a summary of Pepco Holdings' 2004 annual report and proxy statement. Key points include:
1) Pepco Holdings reported improved financial performance in 2004 with consolidated earnings of $258.7 million, up from $113.5 million in 2003, driven by improved performance of competitive energy businesses.
2) The company made progress on reducing debt and preferred stock by $480 million in 2004 as part of its balance sheet improvement goals.
3) The regulated power delivery business continues as the primary focus due to its stability and cash generation. Earnings from this segment grew to $233.4 million in 2004.
4) Competitive energy businesses also posted profits in 2004 despite challenging markets
The document is the 2005 annual report and proxy statement from PHI (Pepco Holdings Inc.). It discusses PHI's strategy of focusing on stable power delivery and growing energy businesses. In 2005, PHI achieved earnings of $371.2 million and strengthened its balance sheet by paying down over $1 billion in debt. Rising energy prices present challenges for PHI and its customers. The proxy statement announces the annual meeting to elect directors and ratify the independent auditor.
- Pepco Holdings, Inc. reported on its 2006 financial and operational performance in its annual report and proxy statement. It noted lower earnings compared to 2005 due to mild weather but continued growth in shareholder value.
- Key accomplishments in 2006 included implementing balanced rate mitigation plans, filing rate cases to cover increased delivery costs, proposing a major transmission line project, agreeing to sell remaining regulated generation assets, and achieving strong performance in wholesale energy and retail energy businesses.
- Looking ahead, the company plans to focus on growth through regulatory outcomes, infrastructure investments, environmental leadership programs, and improving wholesale energy market conditions.
The Rise of Generative AI in Finance: Reshaping the Industry with Synthetic DataChampak Jhagmag
In this presentation, we will explore the rise of generative AI in finance and its potential to reshape the industry. We will discuss how generative AI can be used to develop new products, combat fraud, and revolutionize risk management. Finally, we will address some of the ethical considerations and challenges associated with this powerful technology.
Abhay Bhutada, the Managing Director of Poonawalla Fincorp Limited, is an accomplished leader with over 15 years of experience in commercial and retail lending. A Qualified Chartered Accountant, he has been pivotal in leveraging technology to enhance financial services. Starting his career at Bank of India, he later founded TAB Capital Limited and co-founded Poonawalla Finance Private Limited, emphasizing digital lending. Under his leadership, Poonawalla Fincorp achieved a 'AAA' credit rating, integrating acquisitions and emphasizing corporate governance. Actively involved in industry forums and CSR initiatives, Abhay has been recognized with awards like "Young Entrepreneur of India 2017" and "40 under 40 Most Influential Leader for 2020-21." Personally, he values mindfulness, enjoys gardening, yoga, and sees every day as an opportunity for growth and improvement.
"Does Foreign Direct Investment Negatively Affect Preservation of Culture in the Global South? Case Studies in Thailand and Cambodia."
Do elements of globalization, such as Foreign Direct Investment (FDI), negatively affect the ability of countries in the Global South to preserve their culture? This research aims to answer this question by employing a cross-sectional comparative case study analysis utilizing methods of difference. Thailand and Cambodia are compared as they are in the same region and have a similar culture. The metric of difference between Thailand and Cambodia is their ability to preserve their culture. This ability is operationalized by their respective attitudes towards FDI; Thailand imposes stringent regulations and limitations on FDI while Cambodia does not hesitate to accept most FDI and imposes fewer limitations. The evidence from this study suggests that FDI from globally influential countries with high gross domestic products (GDPs) (e.g. China, U.S.) challenges the ability of countries with lower GDPs (e.g. Cambodia) to protect their culture. Furthermore, the ability, or lack thereof, of the receiving countries to protect their culture is amplified by the existence and implementation of restrictive FDI policies imposed by their governments.
My study abroad in Bali, Indonesia, inspired this research topic as I noticed how globalization is changing the culture of its people. I learned their language and way of life which helped me understand the beauty and importance of cultural preservation. I believe we could all benefit from learning new perspectives as they could help us ideate solutions to contemporary issues and empathize with others.
Turin Startup Ecosystem 2024 - Ricerca sulle Startup e il Sistema dell'Innov...Quotidiano Piemontese
Turin Startup Ecosystem 2024
Una ricerca de il Club degli Investitori, in collaborazione con ToTeM Torino Tech Map e con il supporto della ESCP Business School e di Growth Capital
where can I find a legit pi merchant onlineDOT TECH
Yes. This is very easy what you need is a recommendation from someone who has successfully traded pi coins before with a merchant.
Who is a pi merchant?
A pi merchant is someone who buys pi network coins and resell them to Investors looking forward to hold thousands of pi coins before the open mainnet.
I will leave the what'sapp contact of my personal pi merchant to trade with
+12349014282
Yes of course, you can easily start mining pi network coin today and sell to legit pi vendors in the United States.
Here the what'sapp contact of my personal vendor.
+12349014282
#pi network #pi coins #legit #passive income
#US
5 Tips for Creating Standard Financial ReportsEasyReports
Well-crafted financial reports serve as vital tools for decision-making and transparency within an organization. By following the undermentioned tips, you can create standardized financial reports that effectively communicate your company's financial health and performance to stakeholders.
2. Elemental Economics - Mineral demand.pdfNeal Brewster
After this second you should be able to: Explain the main determinants of demand for any mineral product, and their relative importance; recognise and explain how demand for any product is likely to change with economic activity; recognise and explain the roles of technology and relative prices in influencing demand; be able to explain the differences between the rates of growth of demand for different products.
Financial Assets: Debit vs Equity Securities.pptxWrito-Finance
financial assets represent claim for future benefit or cash. Financial assets are formed by establishing contracts between participants. These financial assets are used for collection of huge amounts of money for business purposes.
Two major Types: Debt Securities and Equity Securities.
Debt Securities are Also known as fixed-income securities or instruments. The type of assets is formed by establishing contracts between investor and issuer of the asset.
• The first type of Debit securities is BONDS. Bonds are issued by corporations and government (both local and national government).
• The second important type of Debit security is NOTES. Apart from similarities associated with notes and bonds, notes have shorter term maturity.
• The 3rd important type of Debit security is TRESURY BILLS. These securities have short-term ranging from three months, six months, and one year. Issuer of such securities are governments.
• Above discussed debit securities are mostly issued by governments and corporations. CERTIFICATE OF DEPOSITS CDs are issued by Banks and Financial Institutions. Risk factor associated with CDs gets reduced when issued by reputable institutions or Banks.
Following are the risk attached with debt securities: Credit risk, interest rate risk and currency risk
There are no fixed maturity dates in such securities, and asset’s value is determined by company’s performance. There are two major types of equity securities: common stock and preferred stock.
Common Stock: These are simple equity securities and bear no complexities which the preferred stock bears. Holders of such securities or instrument have the voting rights when it comes to select the company’s board of director or the business decisions to be made.
Preferred Stock: Preferred stocks are sometime referred to as hybrid securities, because it contains elements of both debit security and equity security. Preferred stock confers ownership rights to security holder that is why it is equity instrument
<a href="https://www.writofinance.com/equity-securities-features-types-risk/" >Equity securities </a> as a whole is used for capital funding for companies. Companies have multiple expenses to cover. Potential growth of company is required in competitive market. So, these securities are used for capital generation, and then uses it for company’s growth.
Concluding remarks
Both are employed in business. Businesses are often established through debit securities, then what is the need for equity securities. Companies have to cover multiple expenses and expansion of business. They can also use equity instruments for repayment of debits. So, there are multiple uses for securities. As an investor, you need tools for analysis. Investment decisions are made by carefully analyzing the market. For better analysis of the stock market, investors often employ financial analysis of companies.
1. Feb. 15, 2006
DTE Energy Reports 2005 Earnings Increase 25%; Expects Continued Strong Earnings
Growth in 2006
DETROIT – DTE Energy (NYSE:DTE) today reported 2005 earnings of $537 million, or
$3.05 per diluted share, compared with 2004 reported earnings of $431 million, or $2.49 per
diluted share. Earnings improved 25 percent over 2004, driven by operational and regulatory
improvements at Detroit Edison and MichCon. Also boosting earnings were higher profits in
DTE’s Power and Industrial segment.
Operating earnings for 2005 were $577 million, or $3.27 per diluted share, compared with
2004 operating earnings of $445 million, or $2.57 per diluted share. Operating earnings exclude
non-recurring items, certain timing-related items and discontinued operations. Reconciliations of
operating to reported earnings are included at the end of this news release.
“I am very pleased with the progress we made in 2005 and I expect to continue the trend of
strong long-term earnings growth in 2006,” said Anthony F. Earley Jr., DTE Energy chairman and
CEO. “Detroit Edison and MichCon achieved important regulatory milestones in 2005 and
initiated a focused effort to achieve significant cost reductions and increase customer satisfaction,
which will drive our utilities toward achieving their full earnings power. In our three non-utility
business segments, I believe we will continue to capitalize on opportunities to invest our strong
cash flow. Our focus for 2006 is to continue our growth momentum while executing our plans for
performance excellence.”
Electric and Gas Utilities Show Strong Year-Over-Year Improvement
Electric Utility: Operating earnings for Detroit Edison were $1.54 per diluted share in
2005 versus $1.03 in 2004. Driving this improved performance was ongoing cost control, the full-
year impact of rate relief, the return of customers from alternate electric suppliers and much
warmer year-over-year summer weather, with cooling degree days 73 percent higher than in 2004.
This upside was mitigated by the freeze on residential rates, which prevented the complete pass-
through of higher fuel and purchase-power costs, resulting in approximately $73 million in savings
for Detroit Edison’s customers. In addition, Detroit Edison completed many cost control and
productivity improvement projects. These projects, which included increasing the reliability and
commercial availability of coal-fired power plants and increasing the efficiency of coal delivery,
saved DTE Energy a total of $191 million in 2005. Much of these savings, $72 million, were
passed on to Detroit Edison customers through lower fuel costs.
Detroit Edison’s return on equity was 9 percent in 2005, a significant improvement over its
6 percent return in 2004, but below its authorized return of 11 percent.
Gas Utility: Primarily consisting of MichCon, this segment had 2005 operating earnings of
$0.42 per diluted share versus $0.13 in 2004. The key drivers of this improvement were the partial
year benefit of rate relief granted in April 2005, an increase in revenue from regulated gas storage
due to higher gas prices and benefits from the uncollectible expense tracking mechanism. This
2. mechanism, authorized in April 2005, allows MichCon to recover 90 percent of the uncollectible
expense over the base amount set in its rate structure. Partially offsetting these positive earnings
drivers were lower sales volume due to customer conservation and energy-efficiency
improvements. MichCon demonstrated its commitment to ease the burden of increased natural gas
costs on its customers in 2005 by reaching an agreement with the Michigan Public Service
Commission staff, the attorney general and the Residential Ratepayer Consortium to delay passing
through some of the increased natural gas costs to customers this winter. MichCon expects to fully
recover these costs in the future through its established gas cost recovery mechanism.
MichCon’s return on equity was 9 percent 2005, a significant improvement over its 3 percent
return in 2004 but below its authorized return of 11 percent.
Non-Utility Businesses Continue Growth Trajectory
– Power and Industrial Projects had 2005 operating earnings of $1.58 per diluted share,
more than 53 percent above 2004 earnings of $1.03. Synfuel production, which increased
to 21 tons in 2005 versus 15.6 tons in 2004, was a key component of the earnings growth.
Although synfuels produce significant earnings, this business is managed to produce cash.
In 2005, synfuels generated $321 million in cash, a significant increase from $168 million
in 2004. This cash is being redeployed to reduce parent company debt and to fund new
investments across DTE Energy. The other business activities in Power and Industrial
Projects contributed to operating earnings, driven by a one-year increase in revenue from
coke production due to the signing of higher priced, long-term contracts, and margin
improvements in the company’s power generation projects. During 2005 the company
increased its on-site energy project sites from 20 to 24 and its landfill gas recovery projects
from 29 to 32. These projects are expected to contribute to future earnings growth.
– Unconventional Gas Production operating earnings were $0.02 per diluted share in 2005,
down slightly from $0.03 per diluted share in 2004. During 2005, the company greatly
expanded its Texas Barnett shale position to approximately 76,000 net acres with 65
producing wells, proved reserves of 59 billion cubic feet of natural gas equivalent (Bcfe)
and probable reserves of 120 Bcfe. DTE Energy’s Barnett properties produced 0.7 net Bcfe
of natural gas in 2005, the company’s first year of operation in this basin. Expanding
operations in the Barnett region contributed to increased expenses in this segment in 2005
and are expected to lead to significantly higher production and revenue in 2006.
In the Michigan Antrim formation, the company has approximately 290,000 net acres with
2,010 producing wells, proved reserves of 338 Bcfe and probable reserves of 35 Bcfe.
DTE Energy’s Antrim properties produced 21.5 Bcfe of natural gas in 2005. In 2005
substantially all of the Antrim gas production was subject to $3 per thousand cubic feet
fixed price obligations, primarily financial swaps. Increases in the market price of natural
gas did not increase revenue from Antrim production in 2005; however, market priced
severance tax payments reduced income. These fixed price obligations cover
approximately 20 Bcfe of 2006 production, 18 Bcfe of 2007 production and 15 Bcfe of
2008 production. Lower fixed price obligations in future years are expected to create
opportunities to sell some Antrim natural gas production at higher market prices.
3. – Fuel Transportation and Marketing posted operating earnings of $0.01 per diluted share
in 2005 versus $0.41 in 2004. Positively impacting earnings were higher non-utility gas
storage margins. Offsetting this improvement were timing-related mark-to-market impacts,
which reduced earnings by $0.40 in 2005 compared to 2004. The timing-related earnings
impacts, as discussed in DTE Energy’s third quarter 2005 earnings release, resulted from
accounting differences for the gas in storage versus the forward sales of gas. The company
anticipates the financial impact of this timing difference will reverse when the gas is
withdrawn from storage in the current storage cycle in 2006 and is sold at prices
significantly higher than the cost of gas in storage. In addition, DTE Energy entered into
forward power contracts to economically hedge certain physical and capacity power
contracts. Some of these underlying contracts are not derivatives, while the related
economic hedge is, and therefore is marked to market. As a result, the transactions produce
timing-related earnings swings from period to period until the hedge portion of the contract
is settled.
Corporate and Other
Corporate and Other had an operating loss of $0.30 per diluted share in 2005, versus an
operating loss of $0.06 per diluted share in 2004. The change was primarily due to the
increased expense from the realignment of merger interest from the utilities to the holding
company and the gain from the sale of Plug Power stock in 2004.
Fourth Quarter 2005 Results
For the fourth quarter of 2005, DTE Energy reported earnings of $382 million, or $2.14 per
diluted share, up from 2004 reported earnings of $113 million, or $0.65 per diluted share.
Operating earnings for the fourth quarter 2005 were $378 million, or $2.12 per diluted share, up
from 2004 operating earnings of $151 million, or $0.86 per diluted share.
Electric Utility: Operating earnings for Detroit Edison were $0.40 per diluted share versus
$0.39 in the fourth quarter of 2004. Driving this improved performance was the impact of rate
relief, mostly offset by lower regulatory deferrals.
Gas Utility: MichCon had operating earnings of $0.26 per diluted share versus $0.15 in
the fourth quarter of 2004. The key driver of this improvement was the benefit of the MPSC rate
relief granted in April 2005. Other positive drivers were an increase in revenue from regulated gas
storage due to higher gas prices and benefits from the uncollectible expense tracking mechanism
implemented by the MPSC, offset by lower customer gas usage.
Non-Utility Operations: Operating earnings from non-utility operations increased to
$1.60 per diluted share versus $0.47 in the fourth quarter of 2004. The increase primarily resulted
from the recognition of synfuel earnings deferred from the first three quarters of 2005 in the Power
and Industrial Projects segment, as well as the partial flowback of timing-related accounting
adjustments in the Fuel Transportation and Marketing segment.
4. Corporate and Other: The Corporate and Other segment reported operating losses of
$0.14 per diluted share compared to losses of $0.15 in the fourth quarter of 2004.
2006 Earnings Expected to Increase Significantly over 2005
As previously announced, DTE Energy expects 2006 operating earnings of $3.60 to $3.90
per diluted share, a significant increase over 2005 earnings. This earnings guidance assumes no oil
price-related phase out of synfuel tax credits. A partial or full phase-out of tax credits would be
expected to adversely impact 2006 results.
“We expect continued strong performance in 2006,” said David E. Meador, DTE Energy
executive vice president and chief financial officer. “We expect Detroit Edison and MichCon to
benefit from reduced costs and increased productivity resulting from our Performance Excellence
Process. We also expect Detroit Edison to benefit from the reacquisition of customers from
alternate electric suppliers and from the expiration of rate caps on residential customers. In our
non-utility businesses, we expect to continue our steadfast focus on value creation while investing
in our full pipeline of growth opportunities.”
Conference Call and Webcast
This earnings announcement, as well as a package of supplemental financial information, is
available on the company’s website at www.dteenergy.com/investors.
DTE Energy will conduct a conference call with the investment community at 9 a.m. EST
Thursday, Feb. 16, to discuss 2005 earnings results and 2006 guidance. Investors, the news media
and the public may listen to a live internet broadcast of the meeting at
www.dteenergy.com/investors. The telephone dial-in numbers are (719) 457-2698 or (800) 500-
0311. There is no passcode. The internet broadcast will be archived on the company’s website.
In this release, DTE Energy provides 2006 operating earnings guidance. It is likely that
certain items that impact the company’s 2006 reported results will be excluded from operating
results. A reconciliation to the comparable 2006 reported earnings guidance is not provided
because it is not possible to provide a reliable forecast of specific line items such as 2007 oil
hedging costs, Performance Excellence Process restructuring charges and DTE2 implementation
charges. These items may fluctuate significantly from period to period and may have a significant
impact on reported earnings.
Use of Operating Earnings Information – DTE Energy management believes that operating
earnings provide a more meaningful representation of the company’s earnings from ongoing
operations and uses operating earnings as the primary performance measurement for external
communications with analysts and investors. Internally, DTE Energy uses operating earnings to
measure performance against budget and to report to the Board of Directors.
DTE Energy (NYSE:DTE) is a Detroit-based diversified energy company involved in the
development and management of energy-related businesses and services nationwide. Its operating
5. units include Detroit Edison, an electric utility serving 2.2 million customers in Southeastern
Michigan, MichCon, a natural gas utility serving 1.3 million customers in Michigan and other non-
utility, energy businesses focused on power and industrial projects, fuel transportation and
marketing, and unconventional gas production. Information about DTE Energy is available at
www.dteenergy.com.
The information contained herein is as of the date of this news release. DTE Energy
expressly disclaims any current intention to update any forward-looking statements contained in
this news release as a result of new information or future events or developments. Words such as
“anticipate,” “believe,” “expect,” “projected” and “goals” signify forward-looking statements.
Forward-looking statements are not guarantees of future results and conditions but rather are
subject to various assumptions, risks and uncertainties. This news release contains forward-
looking statements about DTE Energy’s financial results and estimates of future prospects, and
actual results may differ materially.
Factors that may impact forward-looking statements include, but are not limited to: the
effects of weather and other natural phenomena on operations and sales to customers, and
purchases from suppliers; economic climate and population growth or decline in the geographic
areas where we do business; environmental issues, laws and regulations, and the cost of
remediation and compliance associated therewith; nuclear regulations and operations associated
with nuclear facilities; the higher price of oil and its impact on the value of Section 29 tax credits,
and the ability to utilize and/or sell interests in facilities producing such credits; implementation of
electric and gas Customer Choice programs; impact of electric and gas utility restructuring in
Michigan, including legislative amendments; employee relations and the impact of collective
bargaining agreements; unplanned outages; access to capital markets and capital market conditions
and the results of other financing efforts which can be affected by credit agency ratings; the timing
and extent of changes in interest rates; the level of borrowings; changes in the cost and availability
of coal and other raw materials, purchased power and natural gas; effects of competition; impact of
regulation by FERC, MPSC, NRC and other applicable governmental proceedings or regulations;
contributions to earnings by non-utility subsidiaries; changes in federal, state and local tax laws
and their interpretations, including the Internal Revenue Code, regulations, rulings, court
proceedings and audits; the ability to recover costs through rate increases; the availability, cost,
coverage and terms of insurance; the cost of protecting assets against, or damage due to, terrorism;
changes in accounting standards and financial reporting regulations; changes in federal or state
laws and their interpretation with respect to regulation, energy policy and other business issues;
uncollectible accounts receivable and changes in the economic and financial viability of our
suppliers, customers and trading counterparties, and the continued ability of such parties to
perform their obligations to the Company. This news release should also be read in conjunction
with the “Forward-Looking Statements” section in each of DTE Energy’s, MichCon’s and Detroit
Edison’s 2004 Form 10-K (which sections are incorporated herein by reference), and in
conjunction with other SEC reports filed by DTE Energy, MichCon and Detroit Edison.
Cautionary Note – The Securities and Exchange Commission permits oil and gas companies, in
their filings with the SEC, to disclose only proved reserves that a company has demonstrated by
actual production or conclusive formation tests to be economically and legally producible under
existing economic and operating conditions. We use certain terms in this news release such as
6. quot;probable reservesquot; that the SEC's guidelines strictly prohibit us from including in filings with the
SEC. You are urged to consider closely the disclosure in our Forms 10-K and 10-Q, File No. 1-
11607, available from our offices or from our website at www.dteenergy.com. You can also obtain
these Forms from the SEC by calling 1-800-SEC-0330.
- 30 -
Members of the Media – For Further Information:
Lorie N. Kessler Scott Simons
(313) 235-8807 (313) 235-8808
Analysts – For Further Information:
Marc Siwak Dan Miner
(313) 235-8030 (313) 235-8030
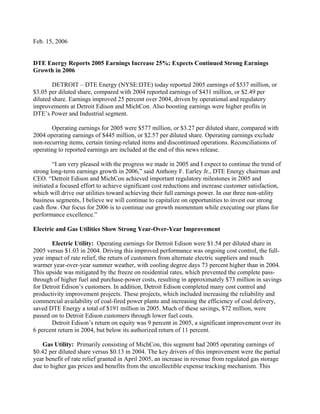
7. DTE ENERGY COMPANY
CONSOLIDATED STATEMENT OF OPERATIONS (UNAUDITED)
Twelve Months Ended
December 31
(in Millions, Except per Share Amounts) 2004
2005
$ 7,071
Operating Revenues ............................................................. $ 9,022
Operating Expenses
Fuel, purchased power and gas............................................. 2,007
3,530
Operation and maintenance .................................................. 3,355
3,792
Depreciation, depletion and amortization............................. 742
870
Taxes other than income ...................................................... 312
274
Gains on sale of assets, net (1) ............................................. (215 )
(390 )
6,201
8,076
870
Operating Income.................................................................. 946
Other (Income) and Deductions
Interest expense.................................................................... 516
519
Interest income ..................................................................... (55 )
(57 )
Other income ....................................................................... (81 )
(68 )
Other expenses ..................................................................... 67
55
447
449
Income (Loss) Before Income Taxes and Minority
423
Interest ................................................................................... 497
174
Income Tax Provision .......................................................... 202
(212 )
Minority Interest (2).............................................................. (281 )
461
Income from Continuing Operations .................................. 576
Loss from Discontinued Operations,
(30 )
net of tax............................................................................... (36 )
-
Cumulative Effect of Accounting Change, net of tax ......... (3 )
431
Net Income ............................................................................. $ 537 $
Basic Earnings per Common Share
Income from continuing operations ..................................... $ $ 2.67
3.29
Discontinued operations....................................................... (.17 )
(.20 )
Cumulative effect of accounting change .............................. -
(.02 )
Total ................................................................................... $ $ 2.50
3.07
Diluted Earnings per Common Share
Income from continuing operations ..................................... $ $ 2.66
3.27
Discontinued operations....................................................... (.17 )
(.20 )
Cumulative effect of accounting change .............................. -
(.02 )
Total ................................................................................... $ $ 2.49
3.05
Average Common Shares
Basic..................................................................................... 173
175
Diluted.................................................................................. 173
176
$ 2.06
Dividends Declared per Common Share ............................. $ 2.06
(1) Primarily represents gains on the sale of interests in synfuel projects.
(2) Primarily represents our partners’ share of synfuel project losses.
8. DTE ENERGY COMPANY
SEGMENT NET INCOME (UNAUDITED)
Three Months Ended December 31
2004
2005
Reported Operating
Reported Operating
Earnings Adjustments Earnings
(in Millions) Earnings Adjustments Earnings
$ 36 $ 1A $ 67
Electric Utility ....................................... $ 65 $ 1A $ 73
2B
3B
28 H
4C
42 (15 ) B 27
Gas Utility .............................................. (86 ) 130 B 45
1C
Non-utility Operations
Power and Industrial Projects ................ 41 - 41
141 7D 146
(3 )E
1C
Unconventional Gas Production ............ 1 - 1
1 - 1
Fuel Transportation and Marketing........ 40 - 40
141 - 141
82 - 82
283 5 288
(39 ) 14 B (25 )
Corporate and Other ............................. 126 (154 )B (28 )
121 30 151
Income from Continuing Operations 388 (10 ) 378
(8 ) 3F -
Discontinued Operations ...................... (3 ) 3F -
5I
- - -
Cumulative effect of accounting change (3 ) 3G -
$ 113 $ 38 $ 151
Net Income.............................................. $ 382 $ (4 ) $ 378
ADJUSTMENTS KEY
A) DTE2/SAP project costs ............................................ Incremental non-recurring DTE2/SAP project costs
B) Effective tax rate normalization ................................. Quarterly adjustment to normalize effective tax rate. Annual results not impacted
C) Performance Excellence Process ................................ Costs to achieve savings from Performance Excellence Process
D) 2006 oil price option................................................... Mark to market on 2006 synfuel oil hedges
E) 2007 oil price option ................................................... Mark to market on 2007 synfuel oil hedges
F) Impairment charge ...................................................... Impairment charge and operating results relating to the discontinuance of Dtech operations
G) Cumulative effect of accounting change.................... Cumulative effect of a change in accounting principle from adoption of FIN 47
H) Stranded cost adjustment............................................ Stranded costs adjustment made pursuant to November 2004 MPSC order
I) Gain on sale of ITC ...................................................... A related adjustment from the sale of International Transmission Company
9. DTE ENERGY COMPANY
SEGMENT DILUTED EARNINGS PER SHARE (UNAUDITED)
Three Months Ended December 31
2004
2005
Reported Operating
Reported Operating
Earnings Adjustments Earnings
(in Millions) Earnings Adjustments Earnings
$ 0.21 $ 0.01 A $ 0.39
Electric Utility .......................................... $ 0.36 $ 0.02 A $ 0.40
0.01 G
0.02 B
0.16 H
0.24 (0.09 )A 0.15
Gas Utility .............................................. (0.48 ) 0.73 A 0.26
0.01 B
Non-utility Operations
Power and Industrial Projects ................ 0.23 - 0.23
0.79 0.04 C 0.81
(0.02 )D
Unconventional Gas Production ............ 0.01 - 0.01
- - -
Fuel Transportation and Marketing........ 0.23 - 0.23
0.79 - 0.79
0.47 - 0.47
1.58 0.02 1.60
(0.23 ) 0.08 A (0.15 )
Corporate and Other ............................. 0.72 (0.86 )A (0.14 )
0.69 0.17 0.86
Income from Continuing Operations 2.18 (0.06 ) 2.12
(0.04 ) 0.01 E -
Discontinued Operations ....................... (0.02 ) 0.02 E -
0.03 I
- - -
Cumulative effect of accounting change (0.02 ) 0.02 F -
$ 0.65 $ 0.21 $ 0.86
Net Income.............................................. $ 2.14 $ (0.02 ) $ 2.12
ADJUSTMENTS KEY
A) Effective tax rate normalization ................................. Quarterly adjustment to normalize effective tax rate. Annual results not impacted
B) Performance Excellence Process ................................ Costs to achieve savings from Performance Excellence Process
C) 2006 oil price option................................................... Mark to market on 2006 synfuel oil hedges
D) 2007 oil price option................................................... Mark to market on 2007 synfuel oil hedges
E) Impairment charge ...................................................... Impairment charge and operating results relating to the discontinuance of Dtech operations
F) Cumulative effect of accounting change .................... Cumulative effect of a change in accounting principle from adoption of FIN 47
G) DTE2/SAP project costs ............................................ Incremental non-recurring DTE2/SAP project costs
H) Stranded cost adjustment............................................ Stranded costs adjustment made pursuant to November 2004 MPSC order
I) Gain on sale of ITC ...................................................... A related adjustment from the sale of International Transmission Company
10. DTE ENERGY COMPANY
SEGMENT NET INCOME (UNAUDITED)
Twelve Months Ended December 31
2004
2005
Reported Operating
Reported Operating
Earnings Adjustments Earnings
(in Millions) Earnings Adjustments Earnings
$ 150 $ 7A $ 178
Electric Utility ....................................... $ 277 $ 8A $ 272
21 K
(17 )B
4C
20 4A 24
Gas Utility .............................................. 37 5A 73
1C
30 D
Non-utility Operations
Power and Industrial Projects................. 179 - 179
308 (26 )E 280
(3 )F
1 C
Unconventional Gas Production............. 6 - 6
4 - 4
Fuel Transportation and Marketing ........ 118 (48 )L 70
2 - 2
303 (48 ) 255
314 (28 ) 286
(12 ) - (12 )
Corporate and Other ............................. (52 ) (2 )B (54 )
461 (16 ) 445
Income from Continuing Operations 576 1 577
(30 ) 7G -
Discontinued Operations ...................... (36 ) (2 )G -
5H
3H
18 I
35 I
- - -
Cumulative effect of accounting change (3 ) 3J -
$ 431 $ 14 $ 445
Net Income .............................................. $ 537 $ 40 $ 577
ADJUSTMENTS KEY
A) DTE2/SAP project costs ............................................ Incremental non-recurring DTE2/SAP project costs
B) Gain on sale of assets ................................................. Gain from land sale
C) Performance Excellence Process ................................ Costs to achieve savings from Performance Excellence Process
D) April 2005 MPSC gas orders...................................... Impact of disallowances of 2002 gas costs and certain computer systems and equipment costs
E) 2006 oil price option ................................................... Mark to market on 2006 synfuel oil hedges
F) 2007 oil price option ................................................... Mark to market on 2007 synfuel oil hedges
G) Gain on sale of Southern Missouri............................. Gain from the sale of Southern Missouri Gas Company
H) Gain on sale of ITC .................................................... A related adjustment from the sale of International Transmission Company
I) Impairment charge ...................................................... Impairment charge and operating results relating to the discontinuance of Dtech operations
J) Cumulative effect of accounting change ..................... Cumulative effect of a change in accounting principle from adoption of FIN 47
K) Stranded cost adjustment............................................ Stranded costs adjustment made pursuant to November 2004 MPSC order
L) Adjustment for contract termination / modification... Terminated a long-term gas exchange agreement and modified a related transportation
agreement with a pipeline company
11. DTE ENERGY COMPANY
SEGMENT DILUTED EARNINGS PER SHARE (UNAUDITED)
Twelve Months Ended December 31
2004
2005
Reported Operating
Reported Operating
Earnings Adjustments Earnings
(in Millions) Earnings Adjustments Earnings
$ 0.87 $ 0.04 A $ 1.03
Electric Utility ....................................... $ 1.57 $ 0.04 A $ 1.54
0.12 K
(0.09 )B
0.02 C
0.11 0.02 A 0.13
Gas Utility .............................................. 0.21 0.03 A 0.42
0.01 C
0.17 D
Non-utility Operations
Power and Industrial Projects ................ 1.03 - 1.03
1.75 (0.15 )E 1.58
(0.02 )F
Unconventional Gas Production ............ 0.03 - 0.03
0.02 - 0.02
Fuel Transportation and Marketing........ 0.68 (0.27 )L 0.41
0.01 - 0.01
1.74 (0.27 ) 1.47
1.78 (0.17 ) 1.61
(0.06 ) - (0.06 )
Corporate and Other............................. (0.29 ) (0.01 )B (0.30 )
2.66 (0.09 ) 2.57
Income from Continuing Operations 3.27 - 3.27
(0.17 ) 0.04 G -
Discontinued Operations ...................... (0.20 ) (0.01 )G -
0.03 H
0.01 H
0.10 I
0.20 I
- - -
Cumulative effect of accounting change (0.02 ) 0.02 J -
$ 2.49 $ 0.08 $ 2.57
Net Income ............................................. $ 3.05 $ 0.22 $ 3.27
ADJUSTMENTS KEY
A) DTE2/SAP project costs ............................................ Incremental non-recurring DTE2/SAP project costs
B) Gain on sale of assets ................................................. Gain from land sale
C) Performance Excellence Process ................................ Costs to achieve savings from Performance Excellence Process
D) April 2005 MPSC gas orders...................................... Impact of disallowances of 2002 gas costs and certain computer systems and equipment costs
E) 2006 oil price option ................................................... Mark to market on 2006 synfuel oil hedges
F) 2007 oil price option ................................................... Mark to market on 2007 synfuel oil hedges
G) Gain on sale of Southern Missouri............................. Gain from the sale of Southern Missouri Gas Company
H) Gain on sale of ITC .................................................... A related adjustment from the sale of International Transmission Company
I) Impairment charge ...................................................... Impairment charge and operating results relating to the discontinuance of Dtech operations
J) Cumulative effect of accounting change ..................... Cumulative effect of a change in accounting principle from adoption of FIN 47
K) Stranded cost adjustment............................................ Stranded costs adjustment made pursuant to November 2004 MPSC order
L) Adjustment for contract termination / modification... Terminated a long-term gas exchange agreement and modified a related transportation
agreement with a pipeline company