Download as PDF, PPTX


![Map
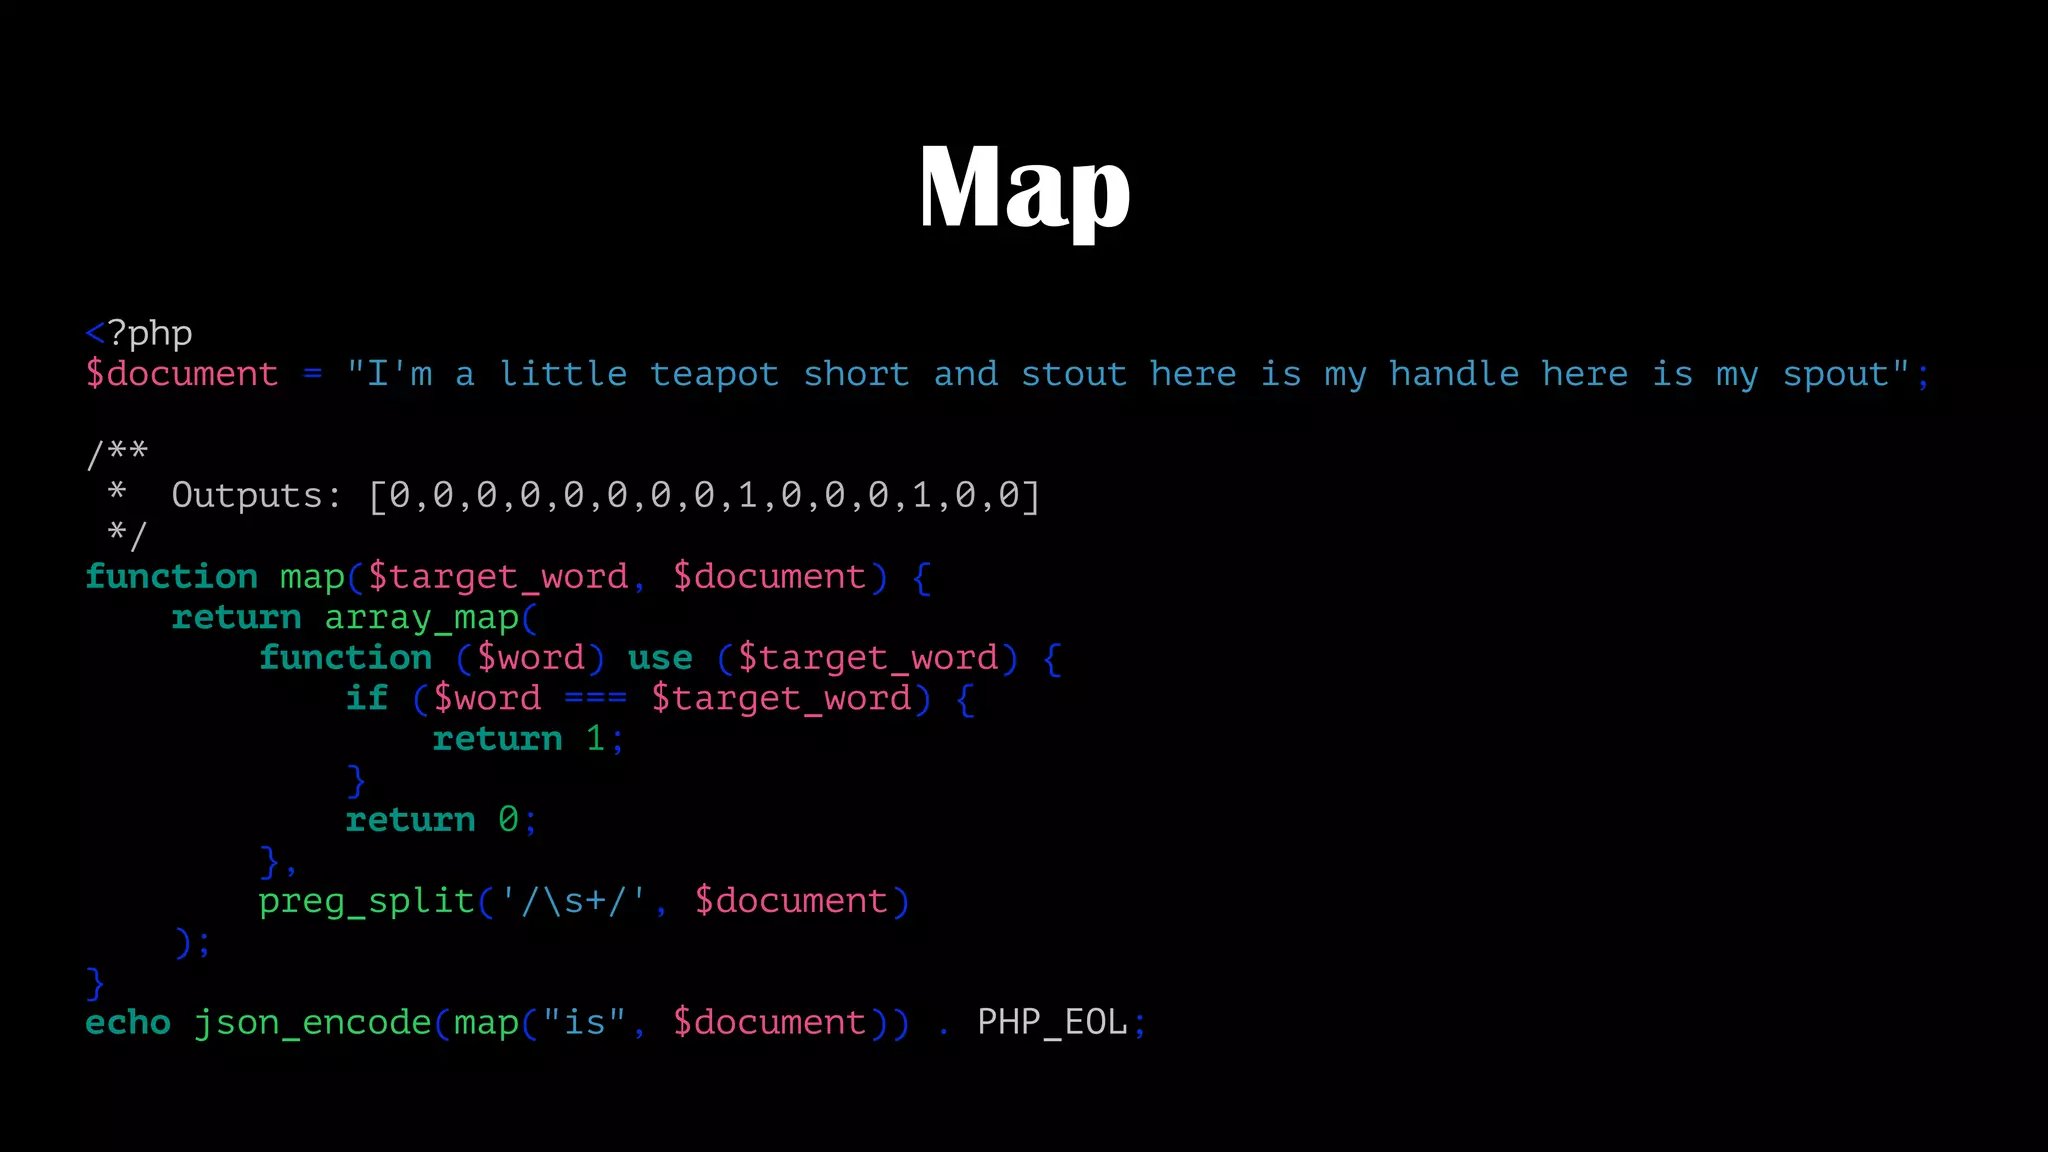
<?php
$document = "I'm a little teapot short and stout here is my handle here is my spout";
/**
* Outputs: [0,0,0,0,0,0,0,0,1,0,0,0,1,0,0]
*/
function map($target_word, $document) {
return array_map(
function ($word) use ($target_word) {
if ($word === $target_word) {
return 1;
}
return 0;
},
preg_split('/s+/', $document)
);
}
echo json_encode(map("is", $document)) . PHP_EOL;](https://image.slidesharecdn.com/metrics-150412193217-conversion-gate01/75/Drinking-from-the-Firehose-Real-time-Metrics-24-2048.jpg)
![Reduce
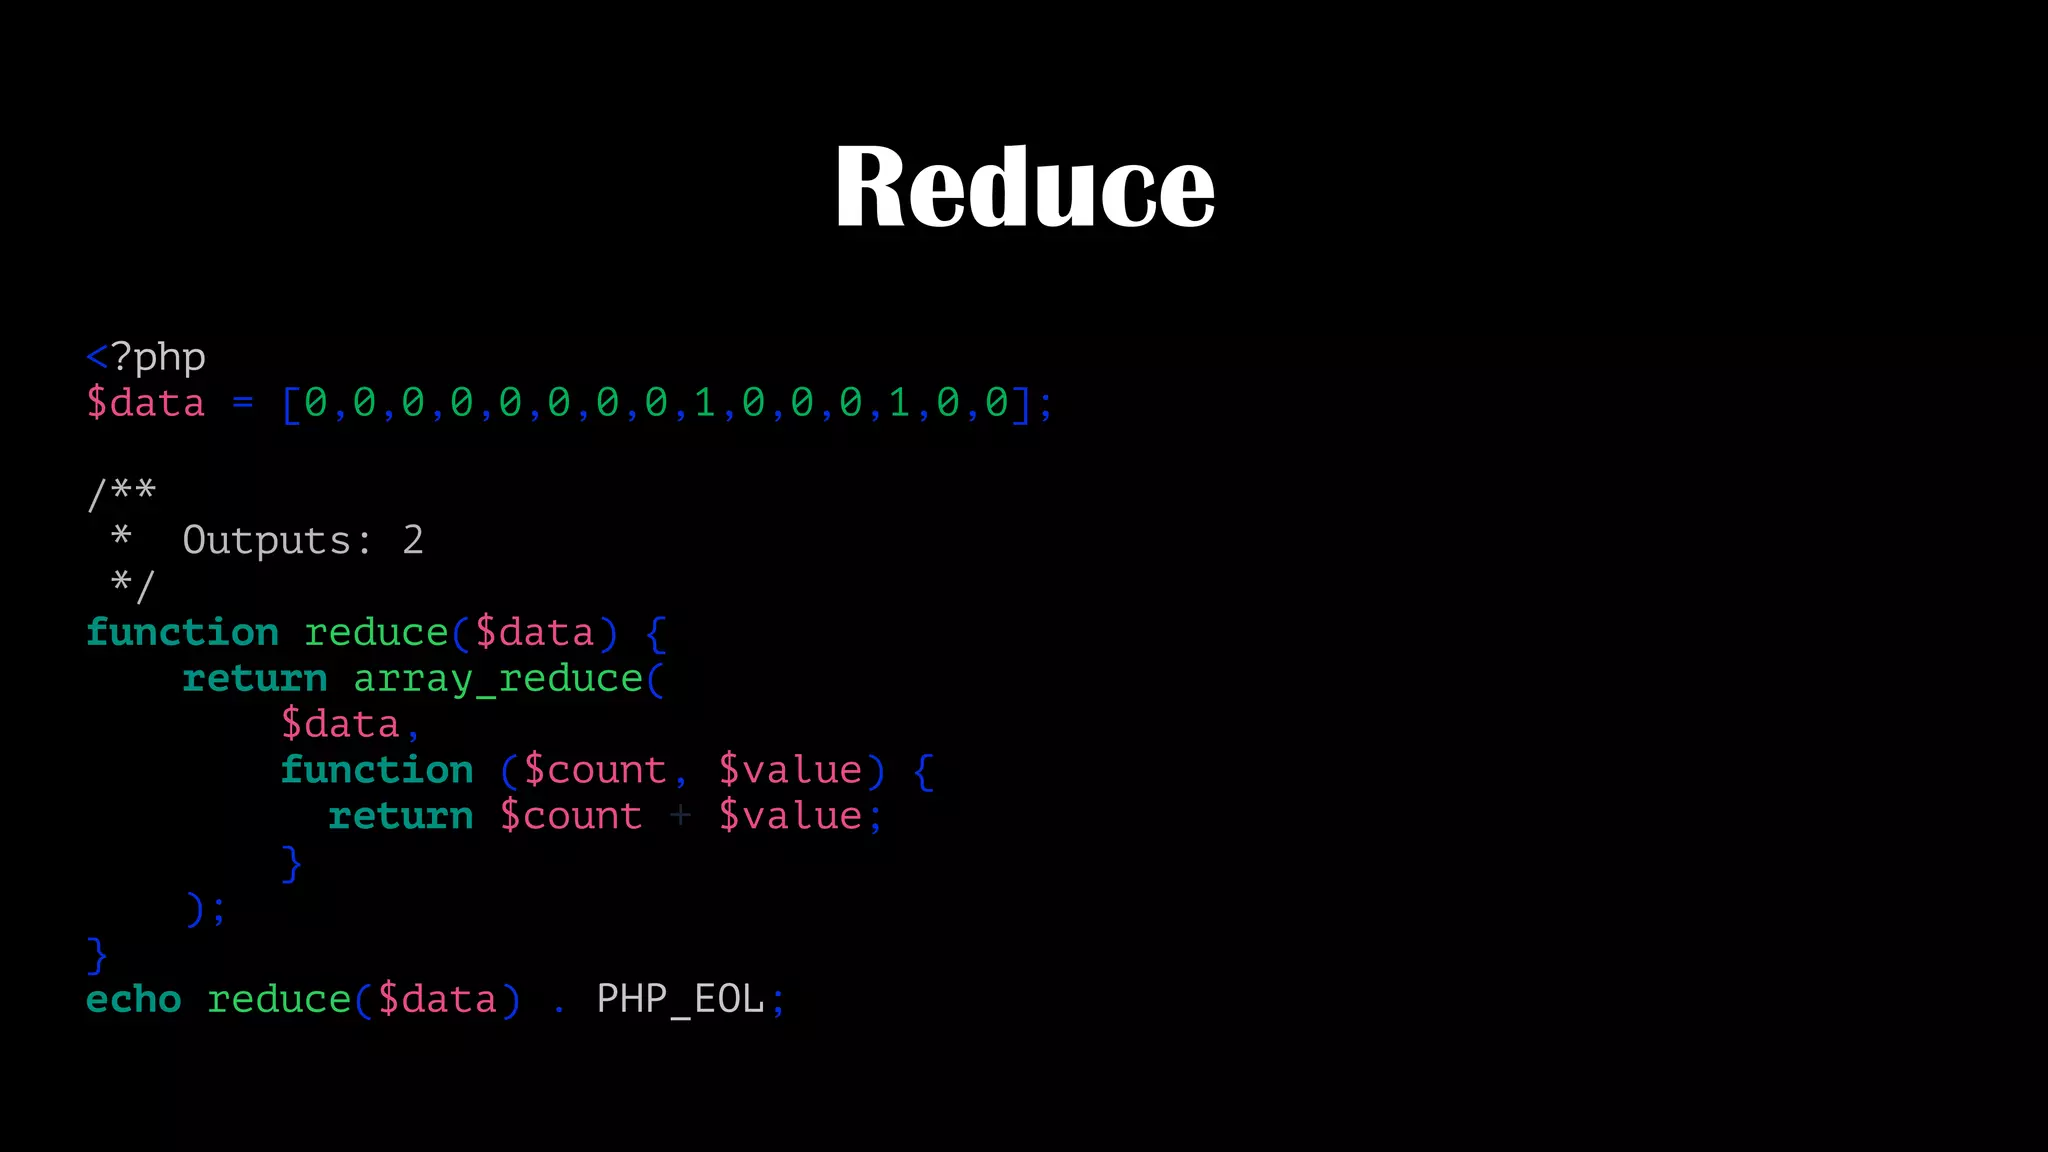
<?php
$data = [0,0,0,0,0,0,0,0,1,0,0,0,1,0,0];
/**
* Outputs: 2
*/
function reduce($data) {
return array_reduce(
$data,
function ($count, $value) {
return $count + $value;
}
);
}
echo reduce($data) . PHP_EOL;](https://image.slidesharecdn.com/metrics-150412193217-conversion-gate01/75/Drinking-from-the-Firehose-Real-time-Metrics-25-2048.jpg)


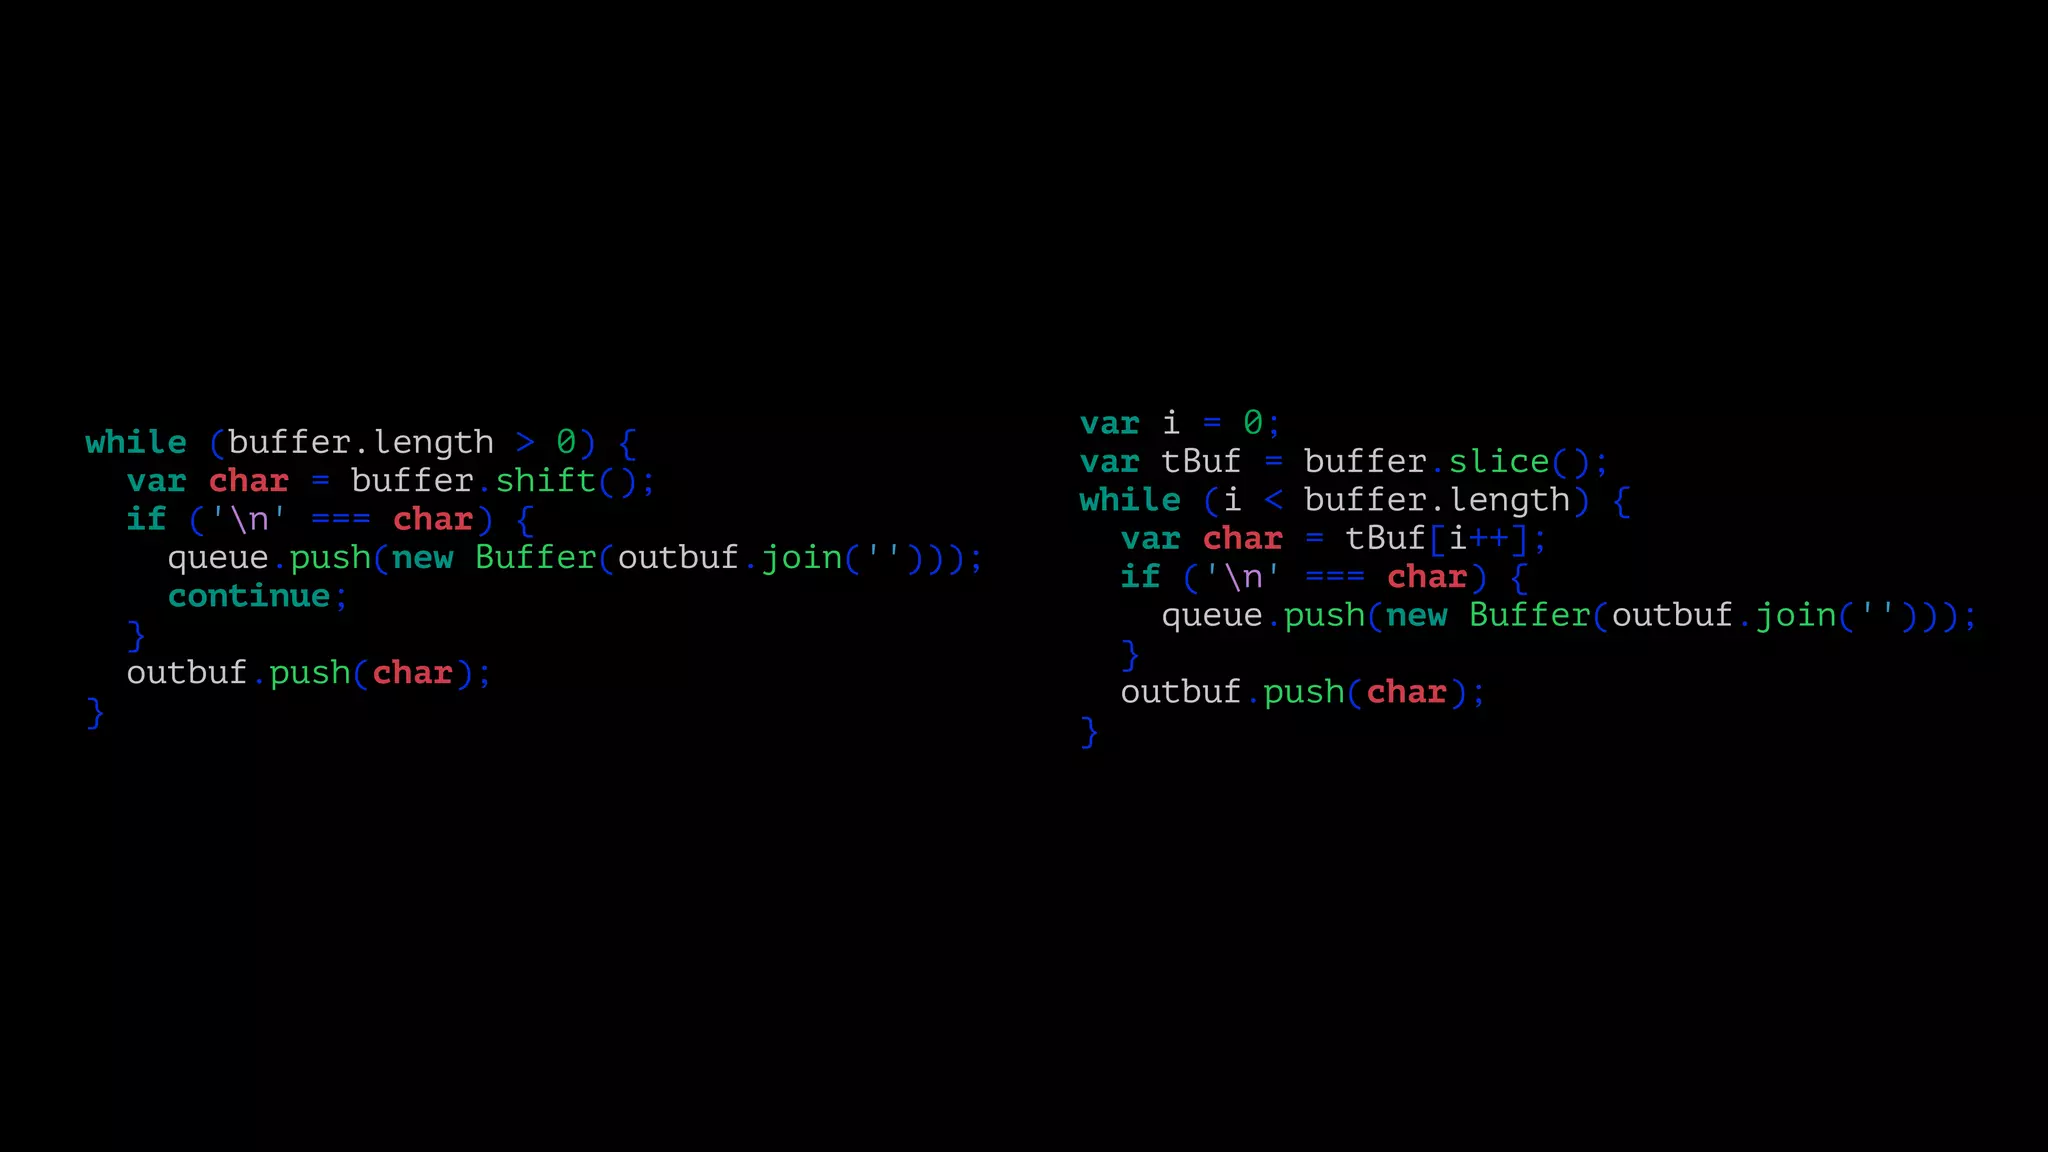
![while (buffer.length > 0) {
var char = buffer.shift();
if ('n' === char) {
queue.push(new Buffer(outbuf.join('')));
continue;
}
outbuf.push(char);
}
var i = 0;
var tBuf = buffer.slice();
while (i < buffer.length) {
var char = tBuf[i++];
if ('n' === char) {
queue.push(new Buffer(outbuf.join('')));
}
outbuf.push(char);
}](https://image.slidesharecdn.com/metrics-150412193217-conversion-gate01/75/Drinking-from-the-Firehose-Real-time-Metrics-46-2048.jpg)


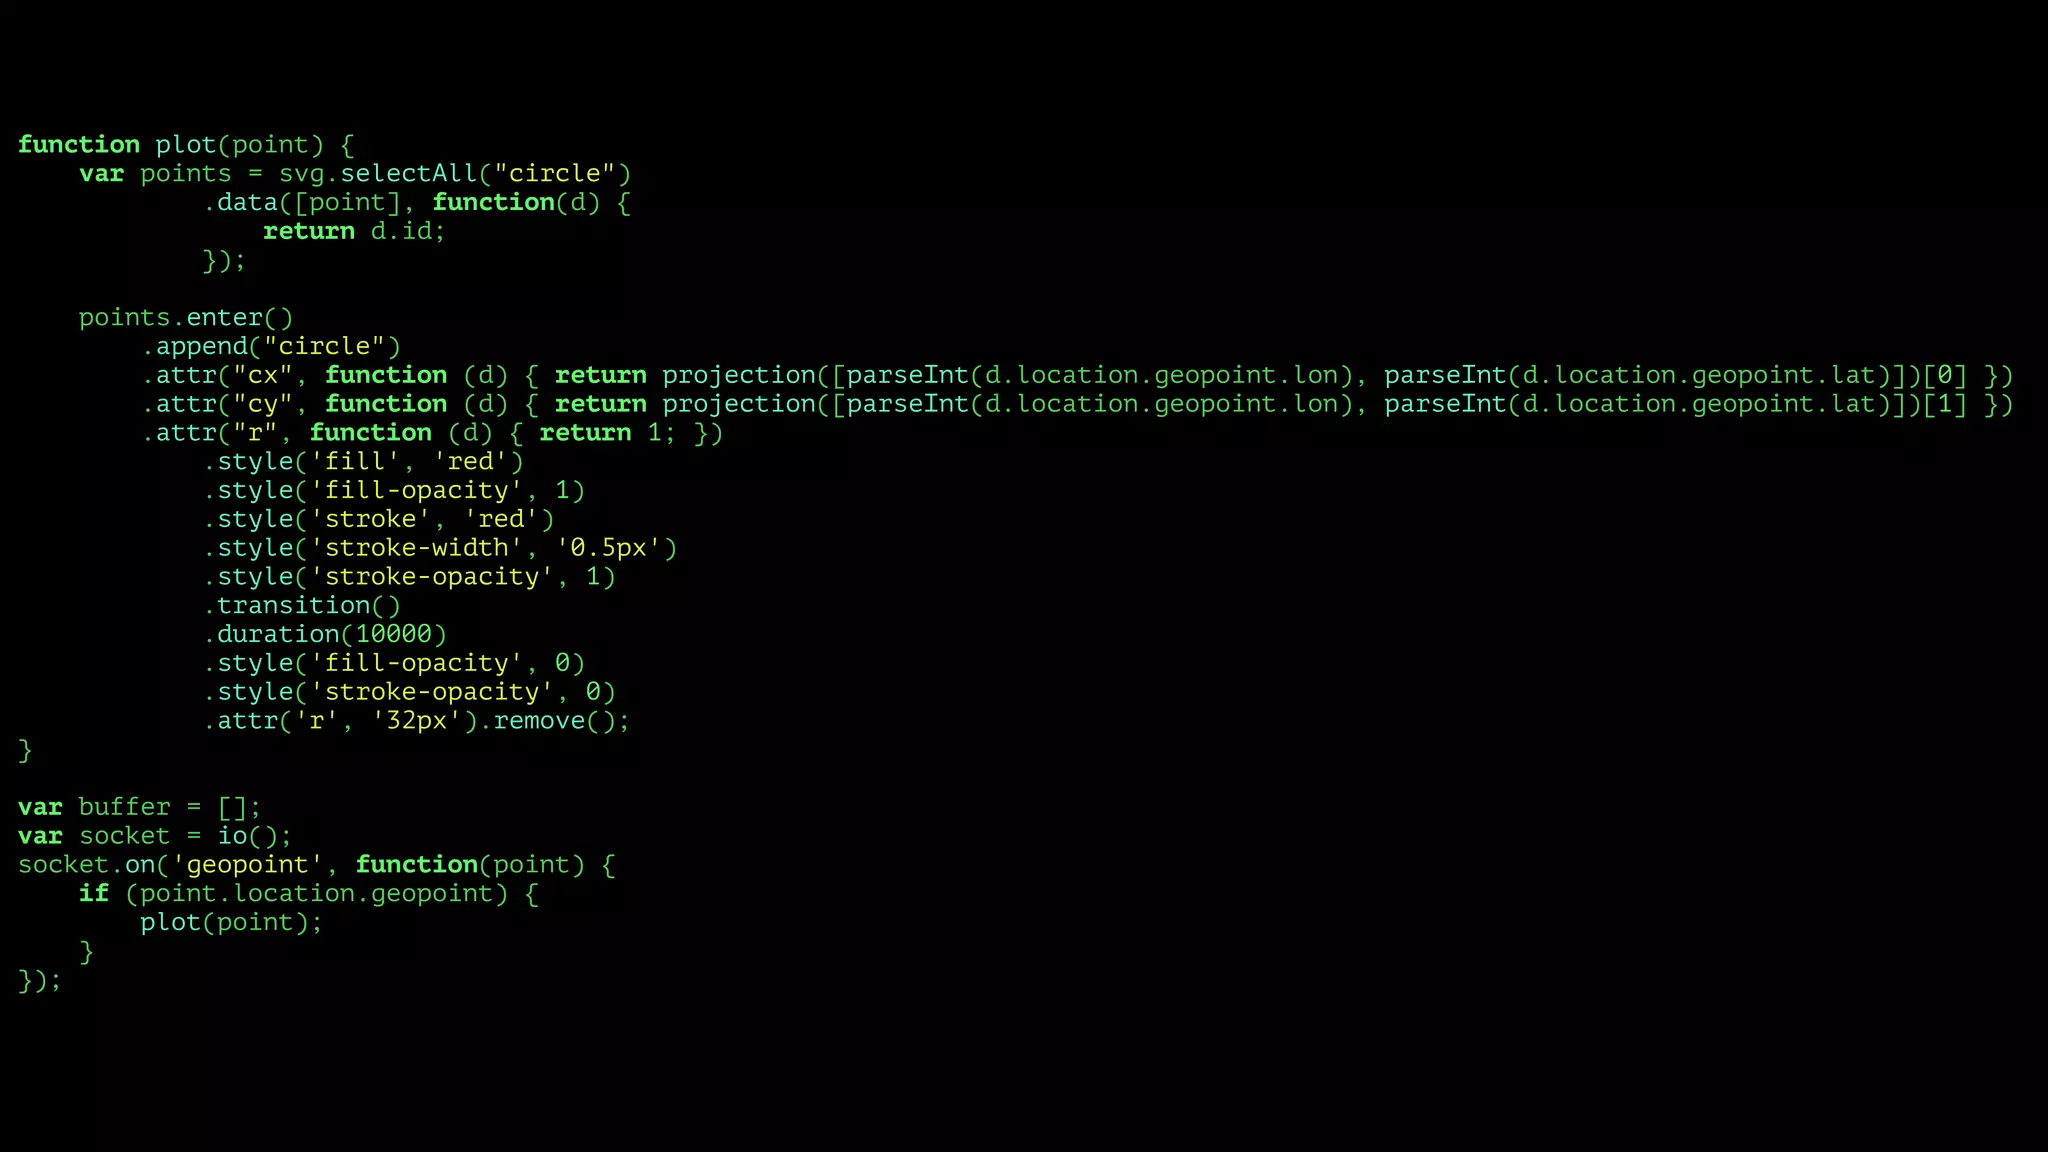
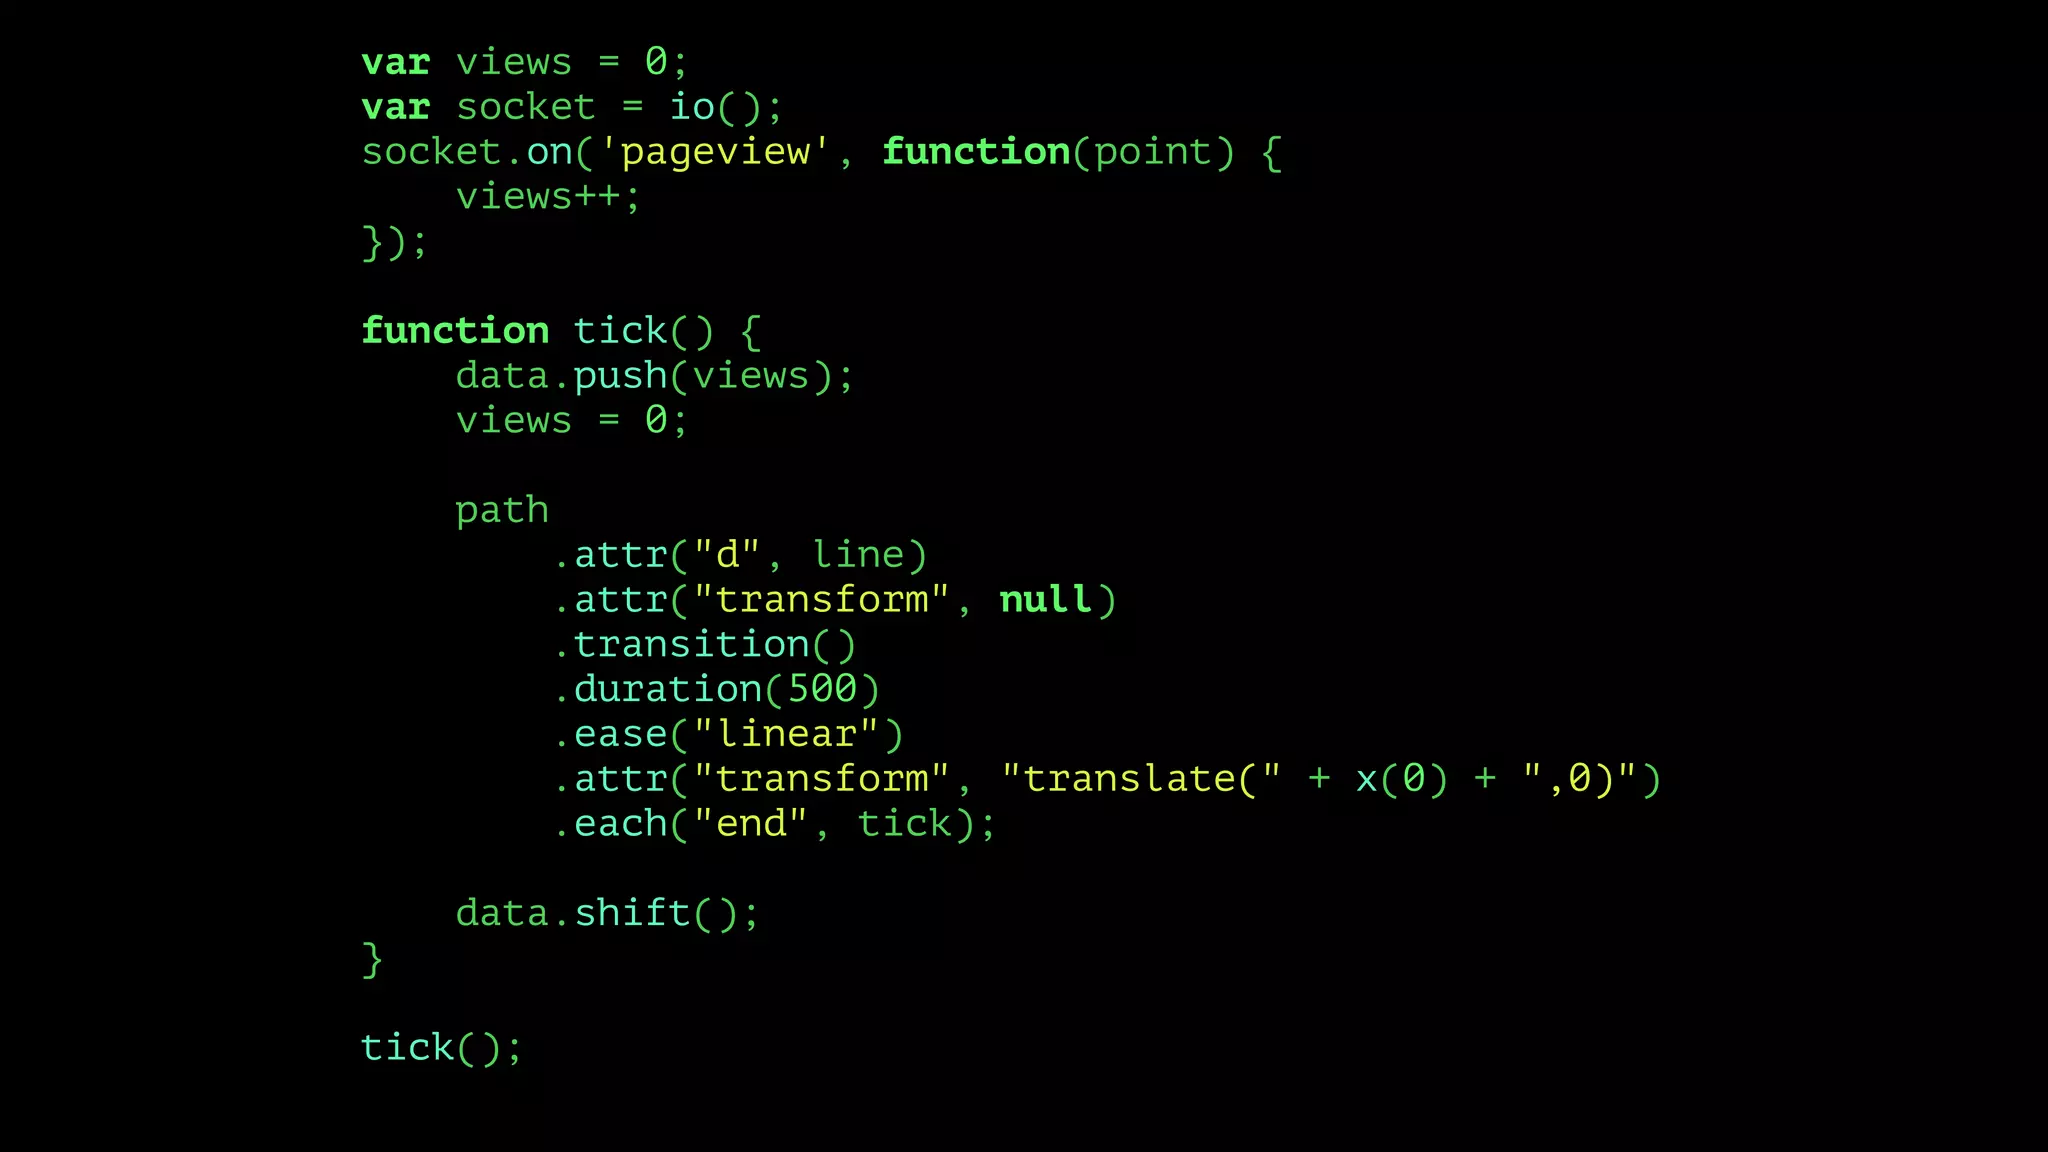
![function plot(point) {
var points = svg.selectAll("circle")
.data([point], function(d) {
return d.id;
});
points.enter()
.append("circle")
.attr("cx", function (d) { return projection([parseInt(d.location.geopoint.lon), parseInt(d.location.geopoint.lat)])[0] })
.attr("cy", function (d) { return projection([parseInt(d.location.geopoint.lon), parseInt(d.location.geopoint.lat)])[1] })
.attr("r", function (d) { return 1; })
.style('fill', 'red')
.style('fill-opacity', 1)
.style('stroke', 'red')
.style('stroke-width', '0.5px')
.style('stroke-opacity', 1)
.transition()
.duration(10000)
.style('fill-opacity', 0)
.style('stroke-opacity', 0)
.attr('r', '32px').remove();
}
var buffer = [];
var socket = io();
socket.on('geopoint', function(point) {
if (point.location.geopoint) {
plot(point);
}
});](https://image.slidesharecdn.com/metrics-150412193217-conversion-gate01/75/Drinking-from-the-Firehose-Real-time-Metrics-72-2048.jpg)
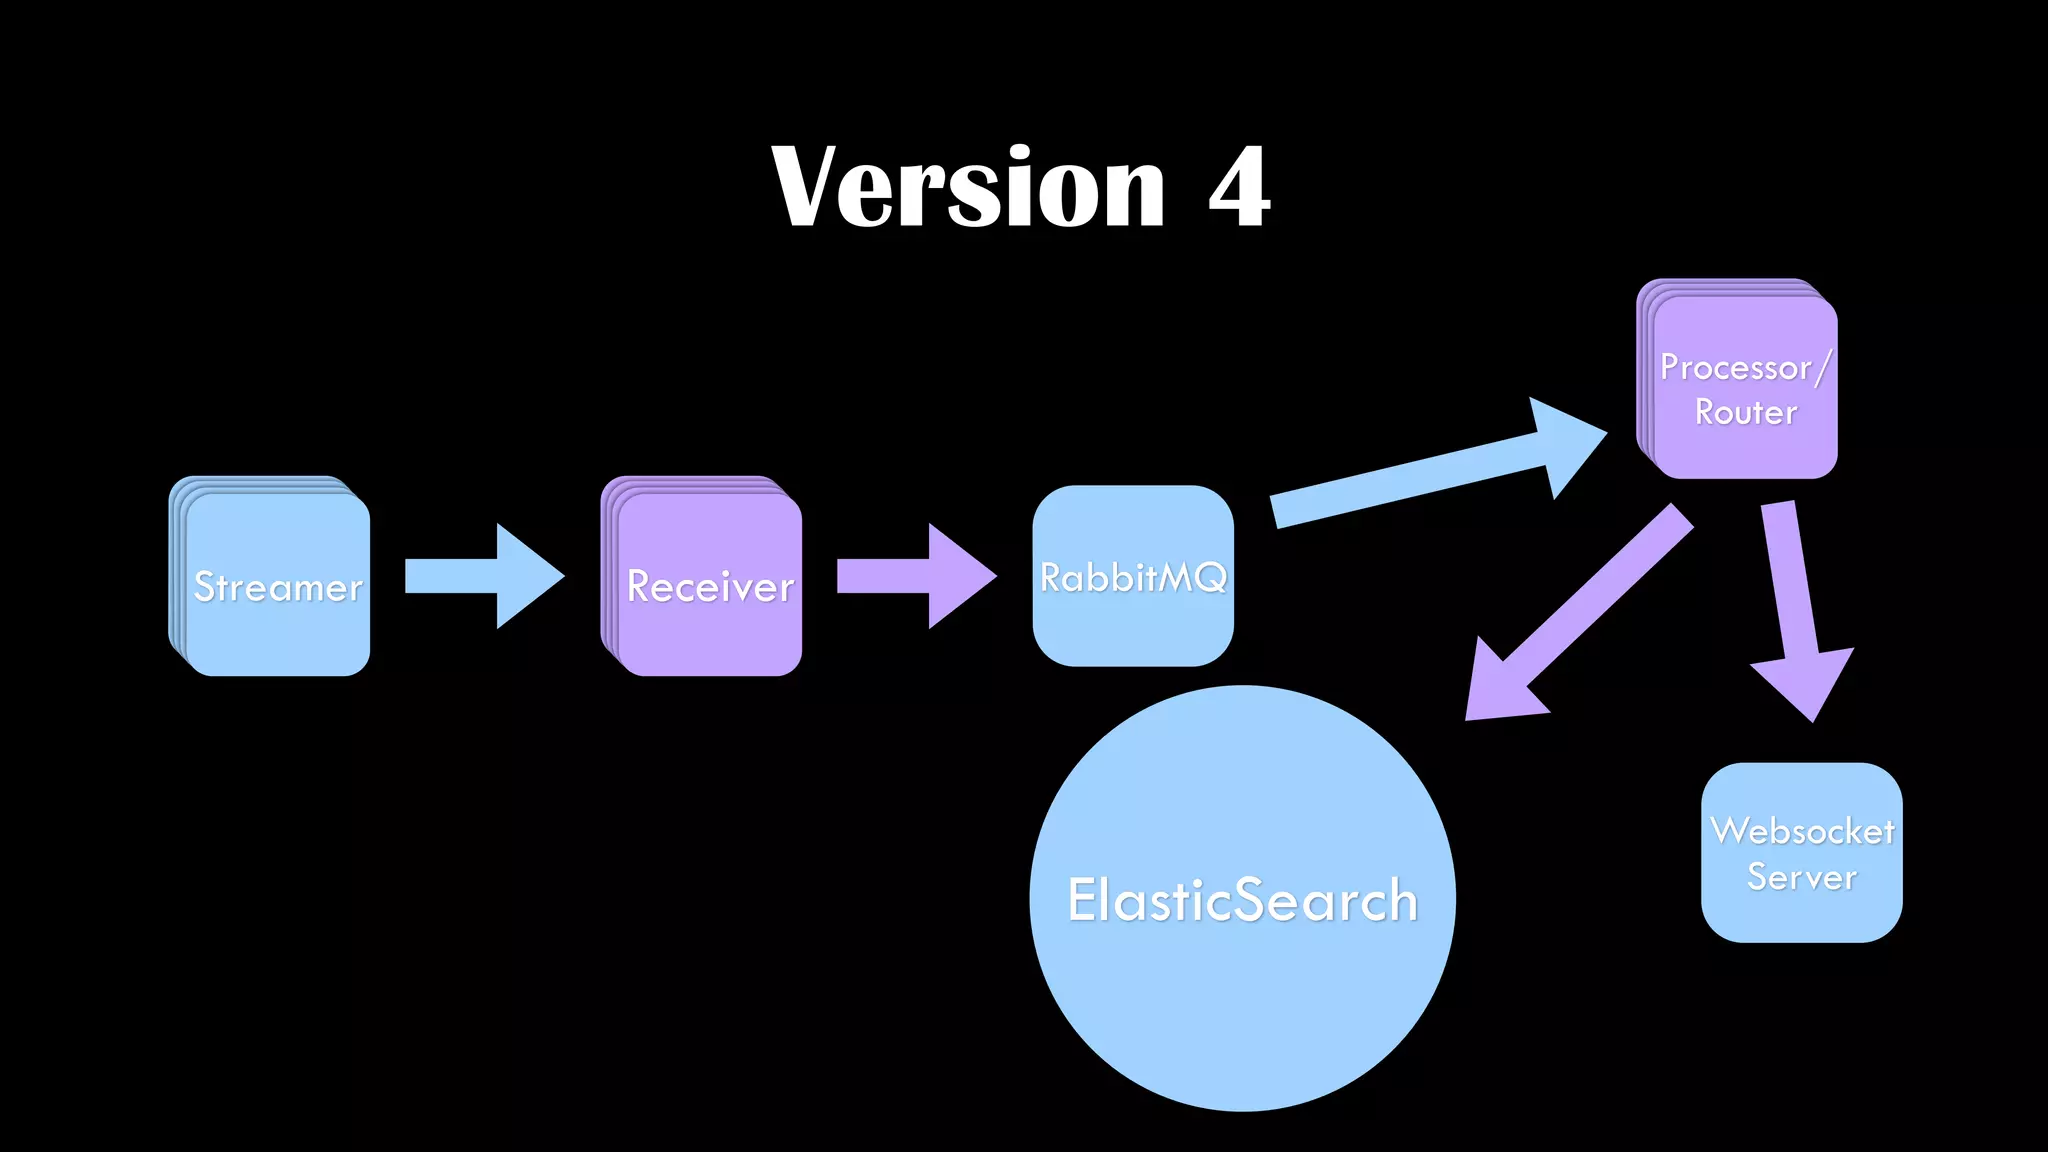
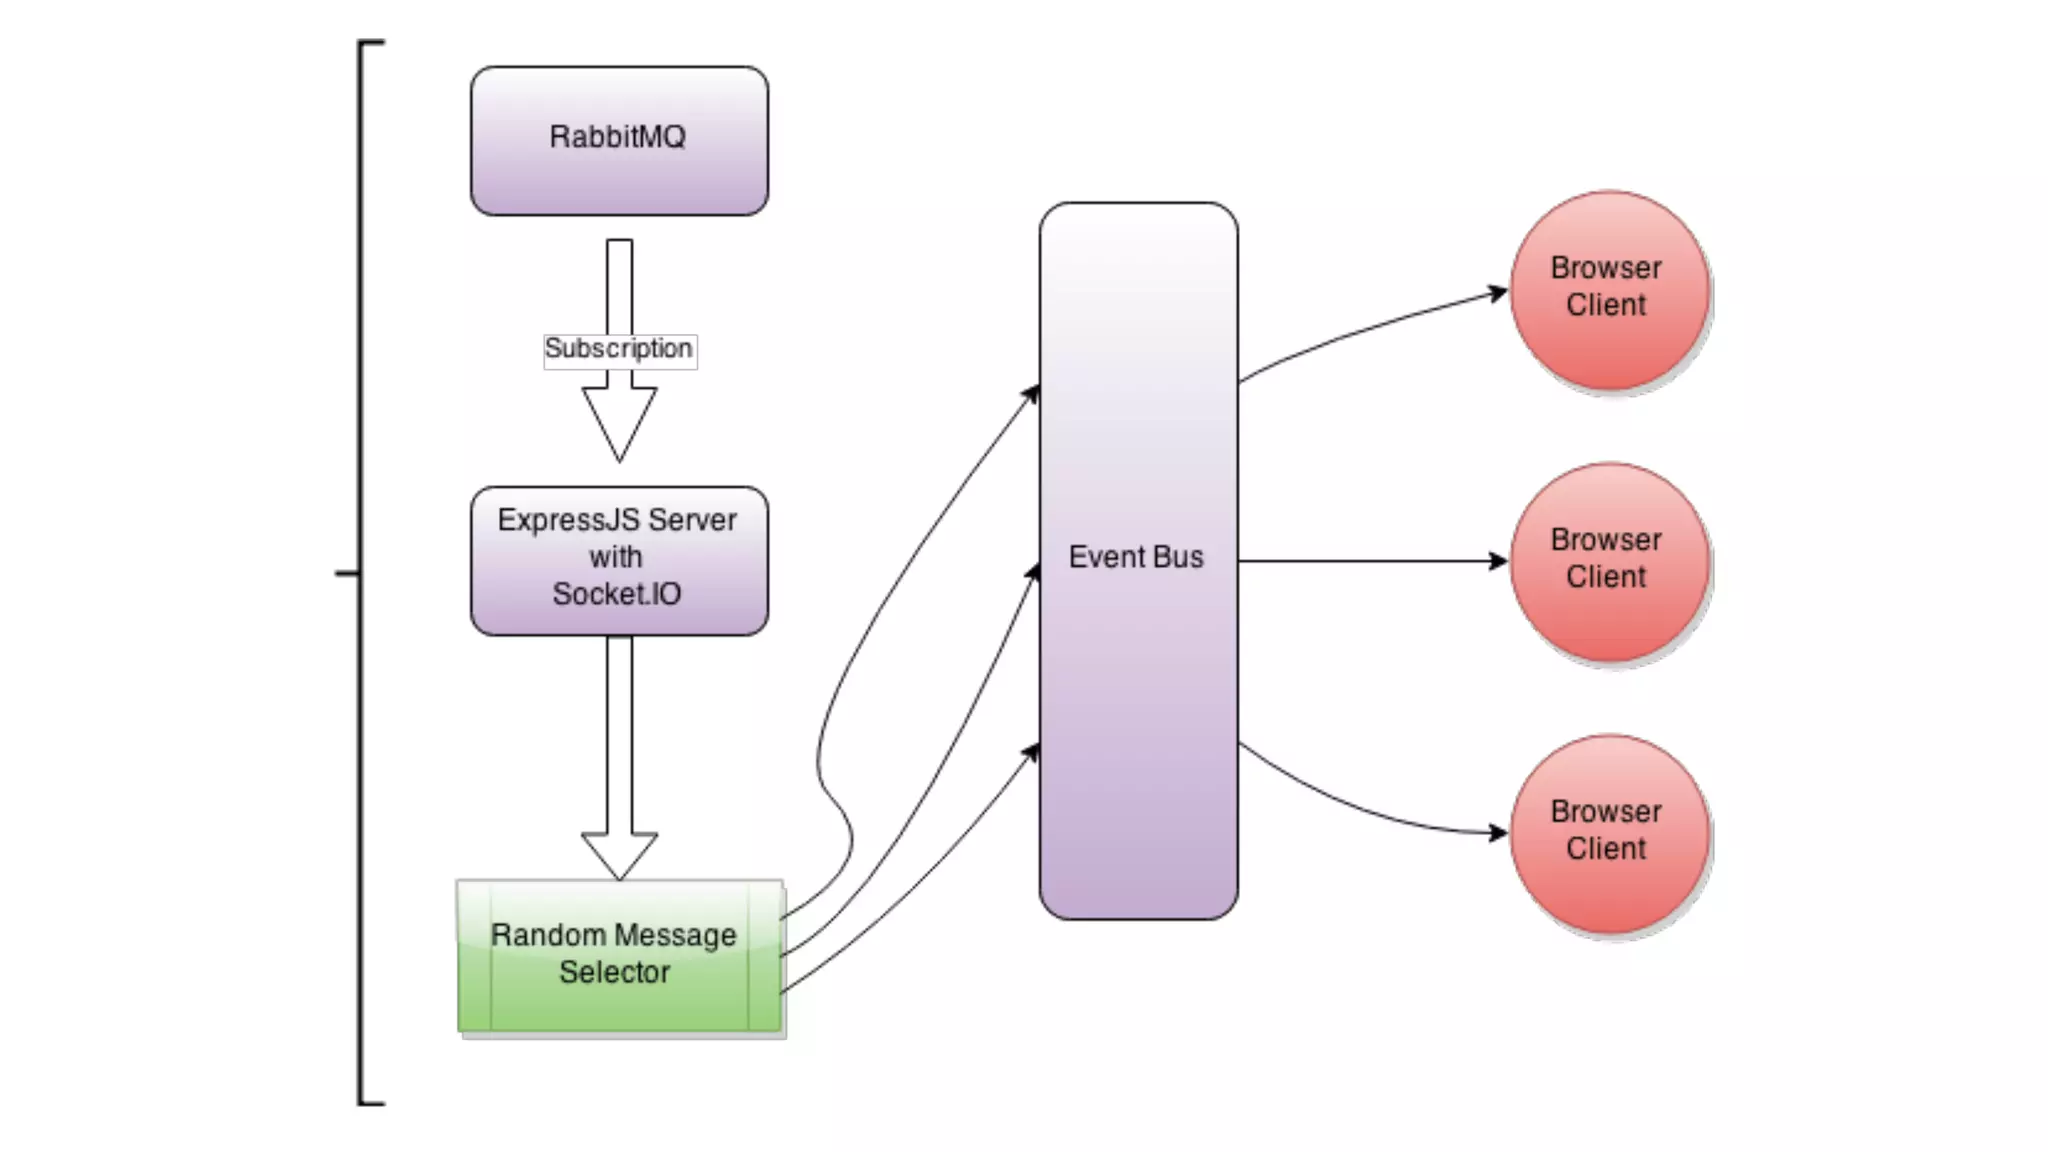
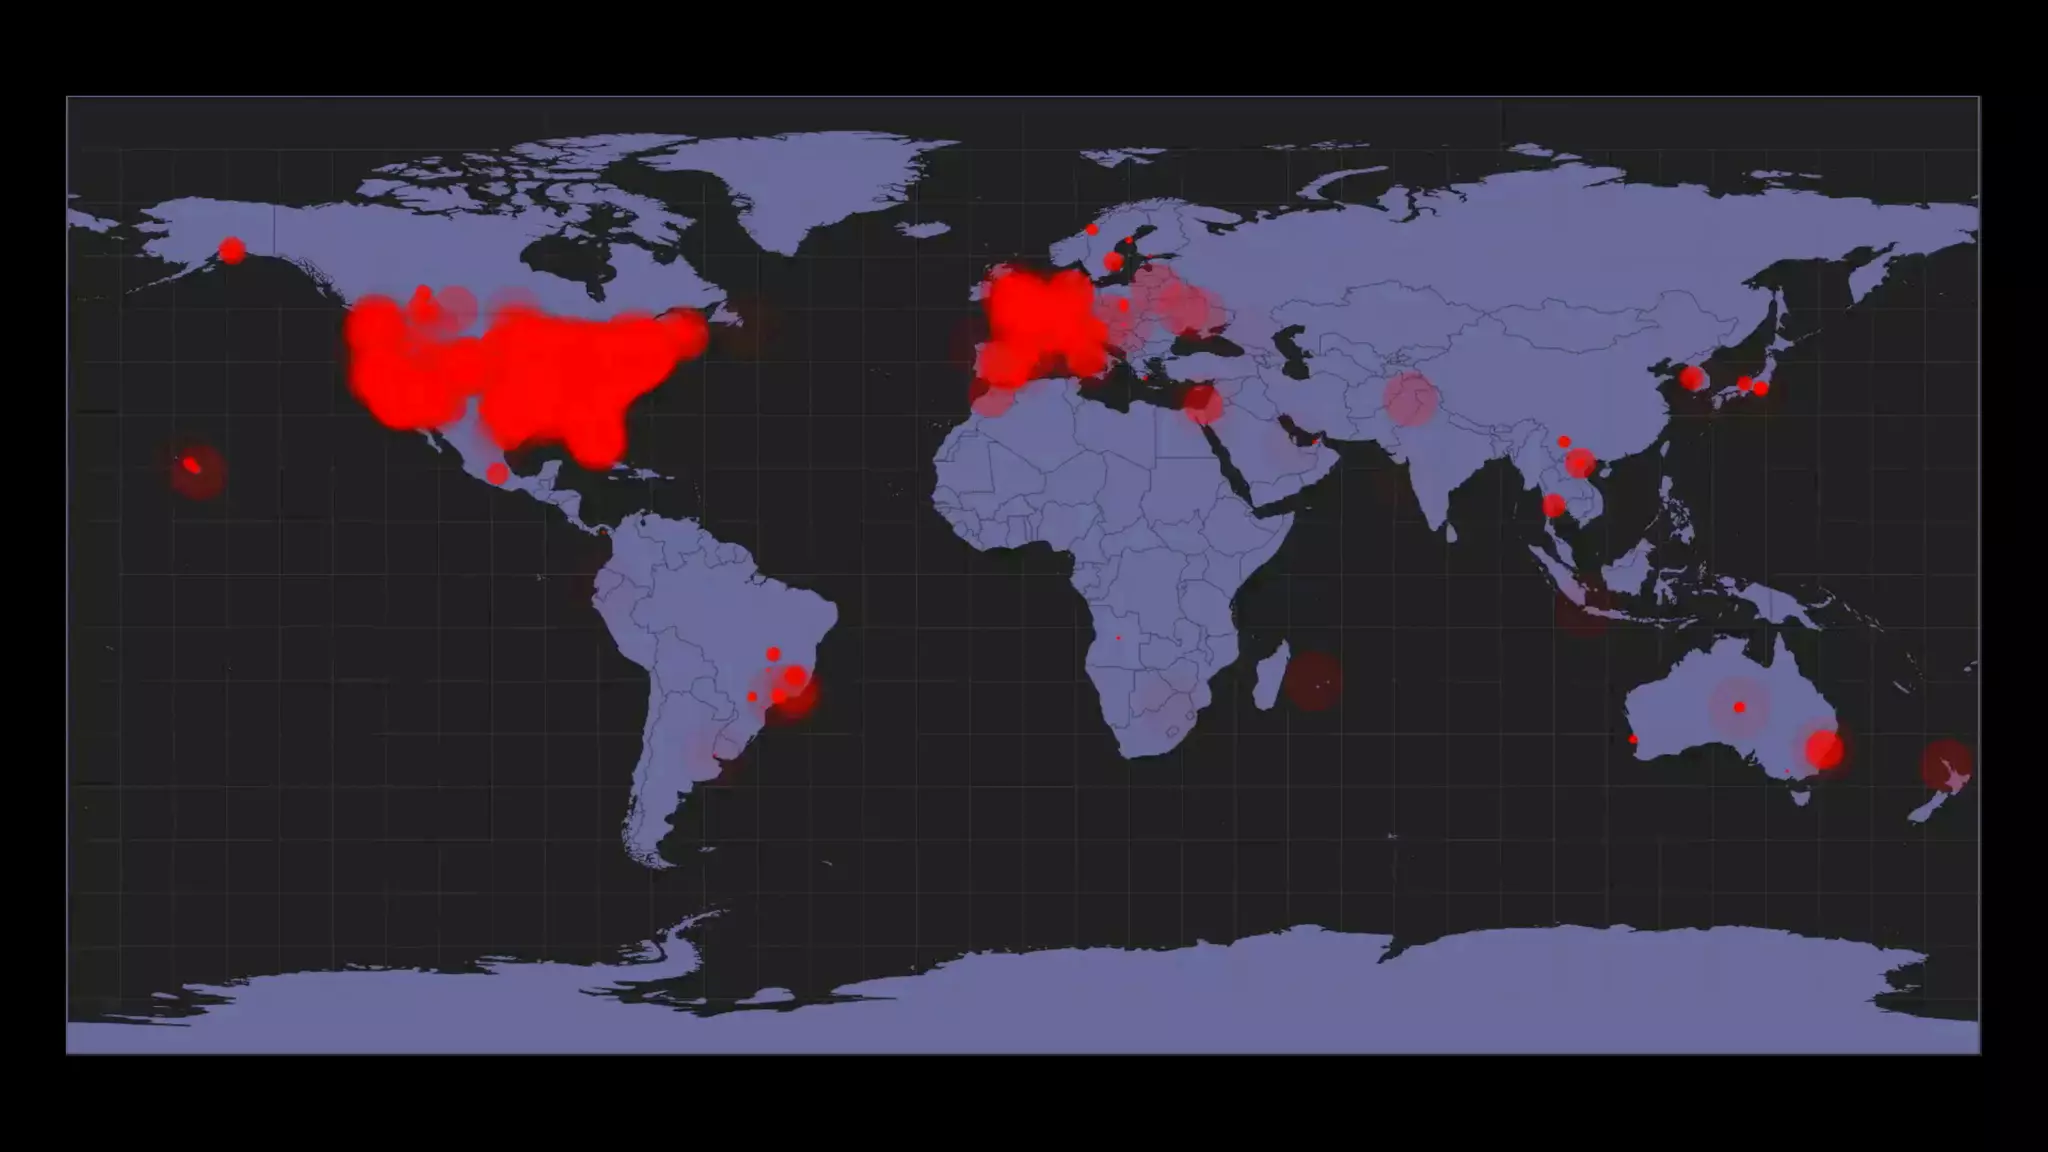
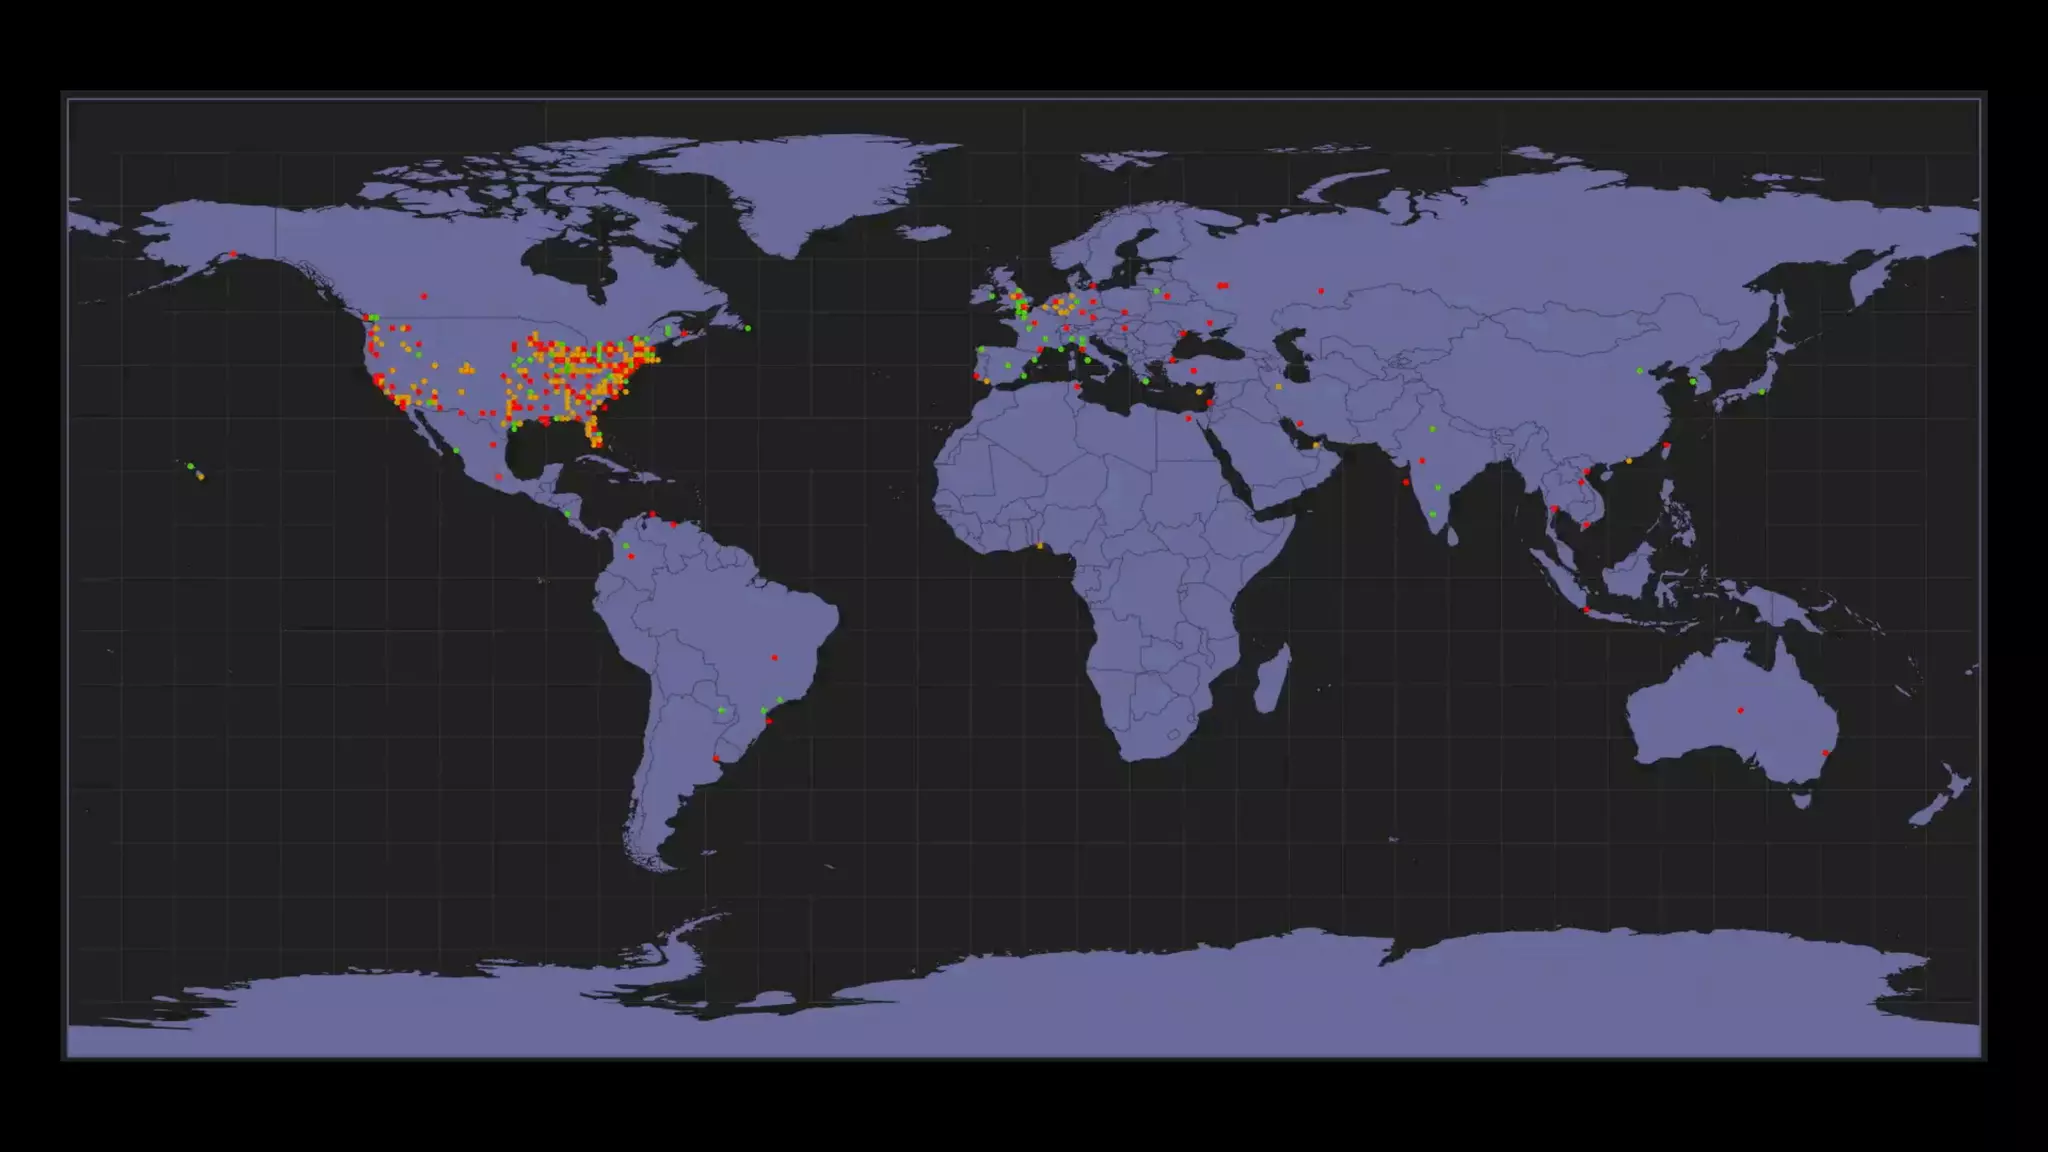

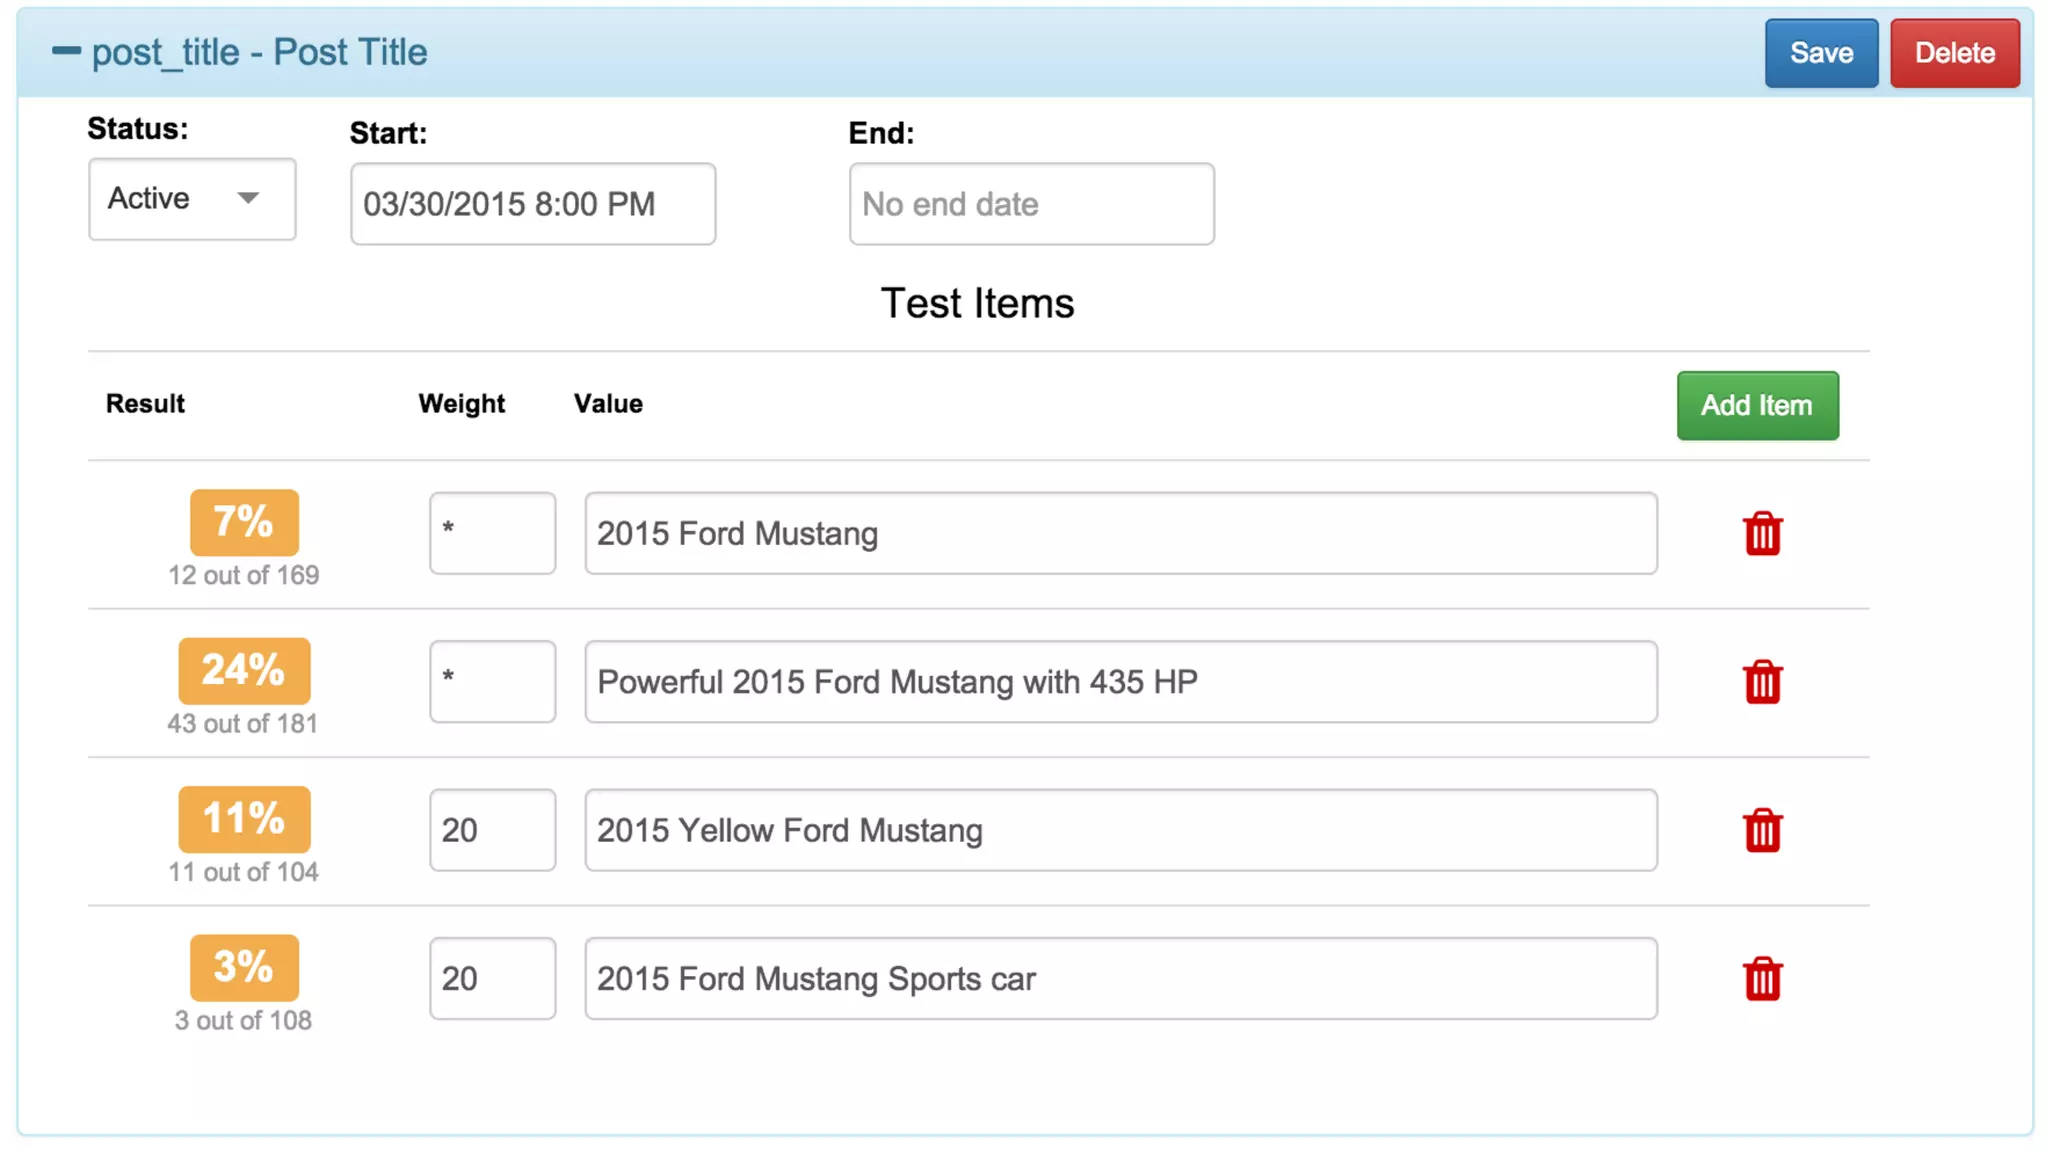
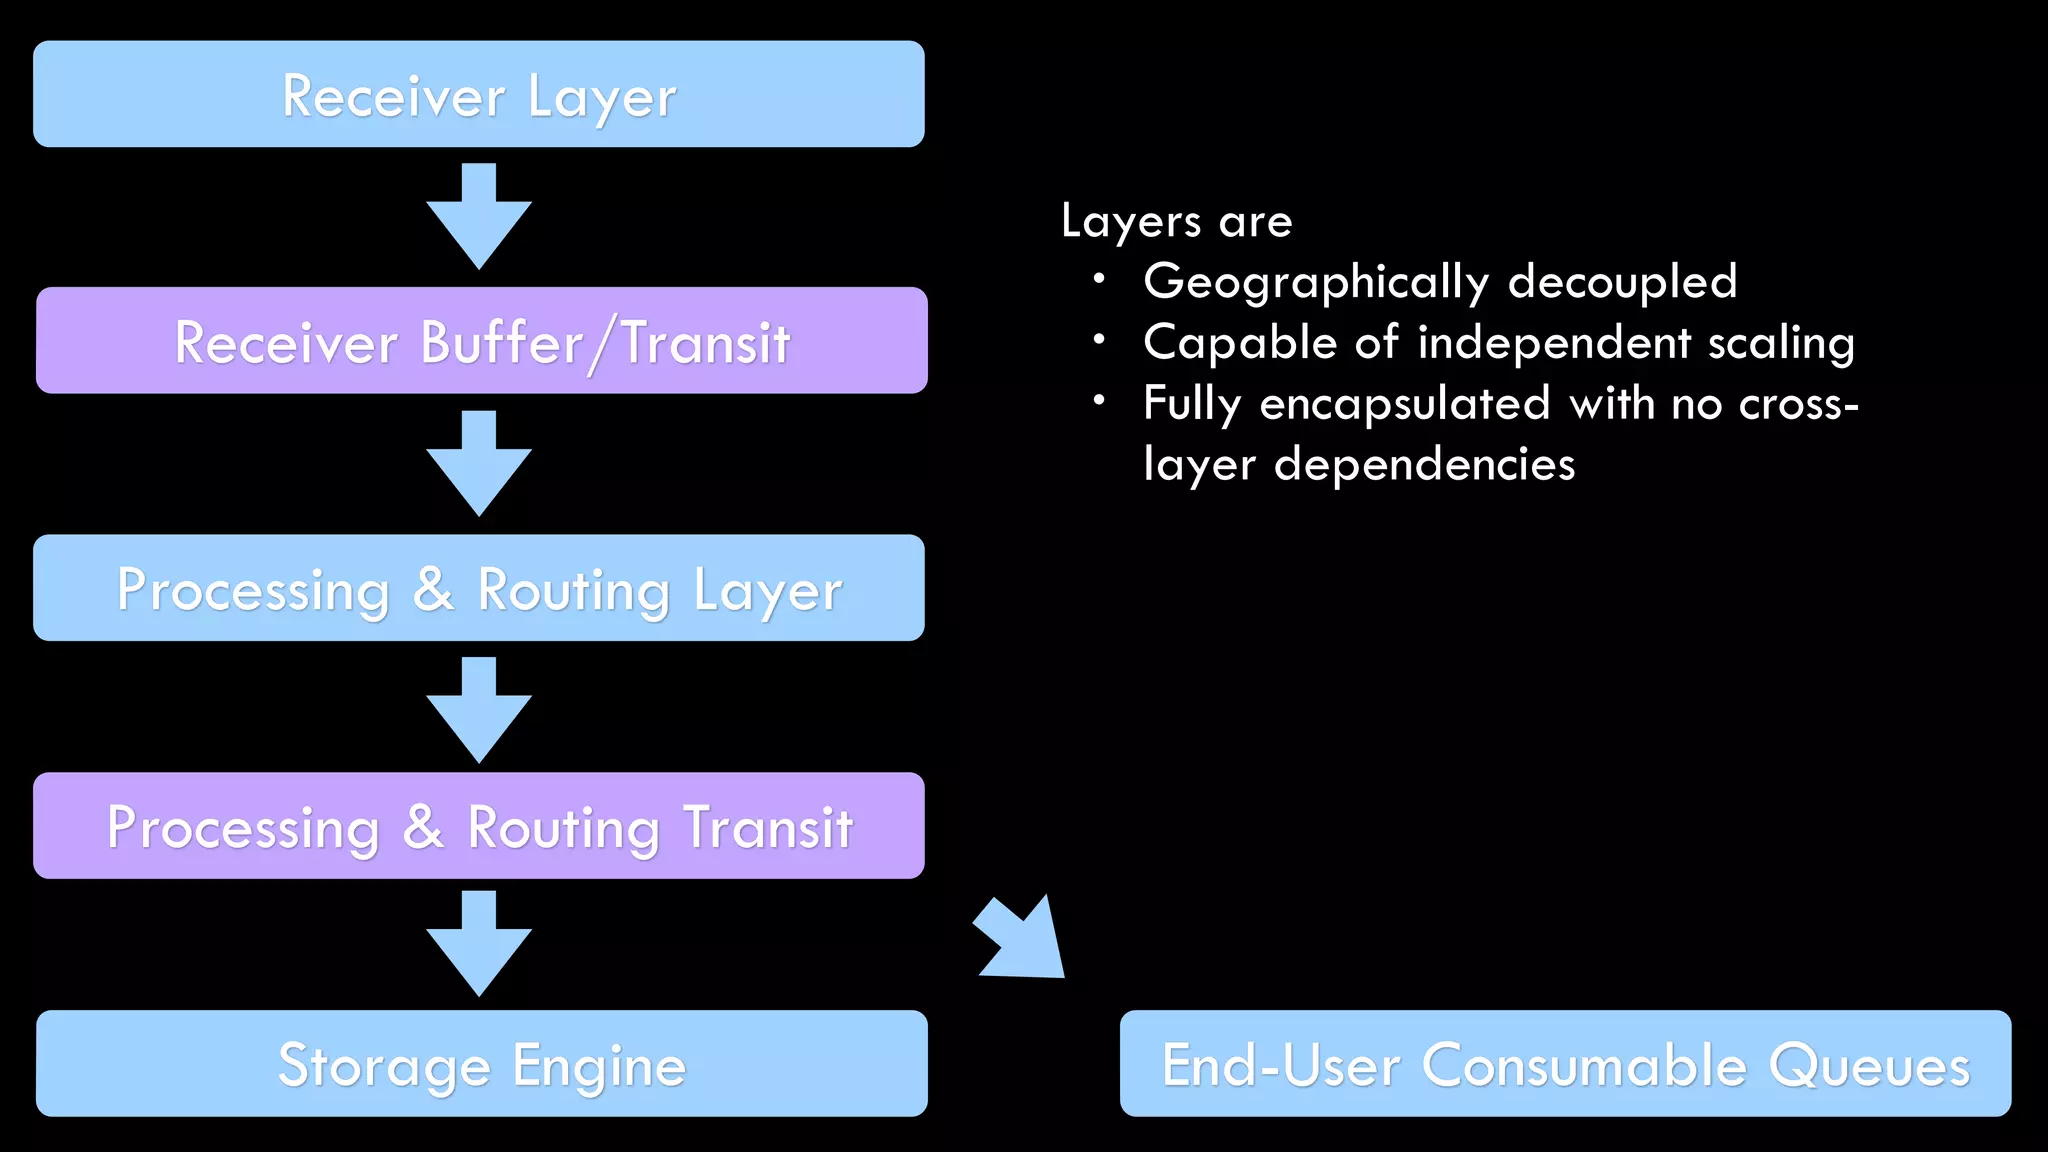

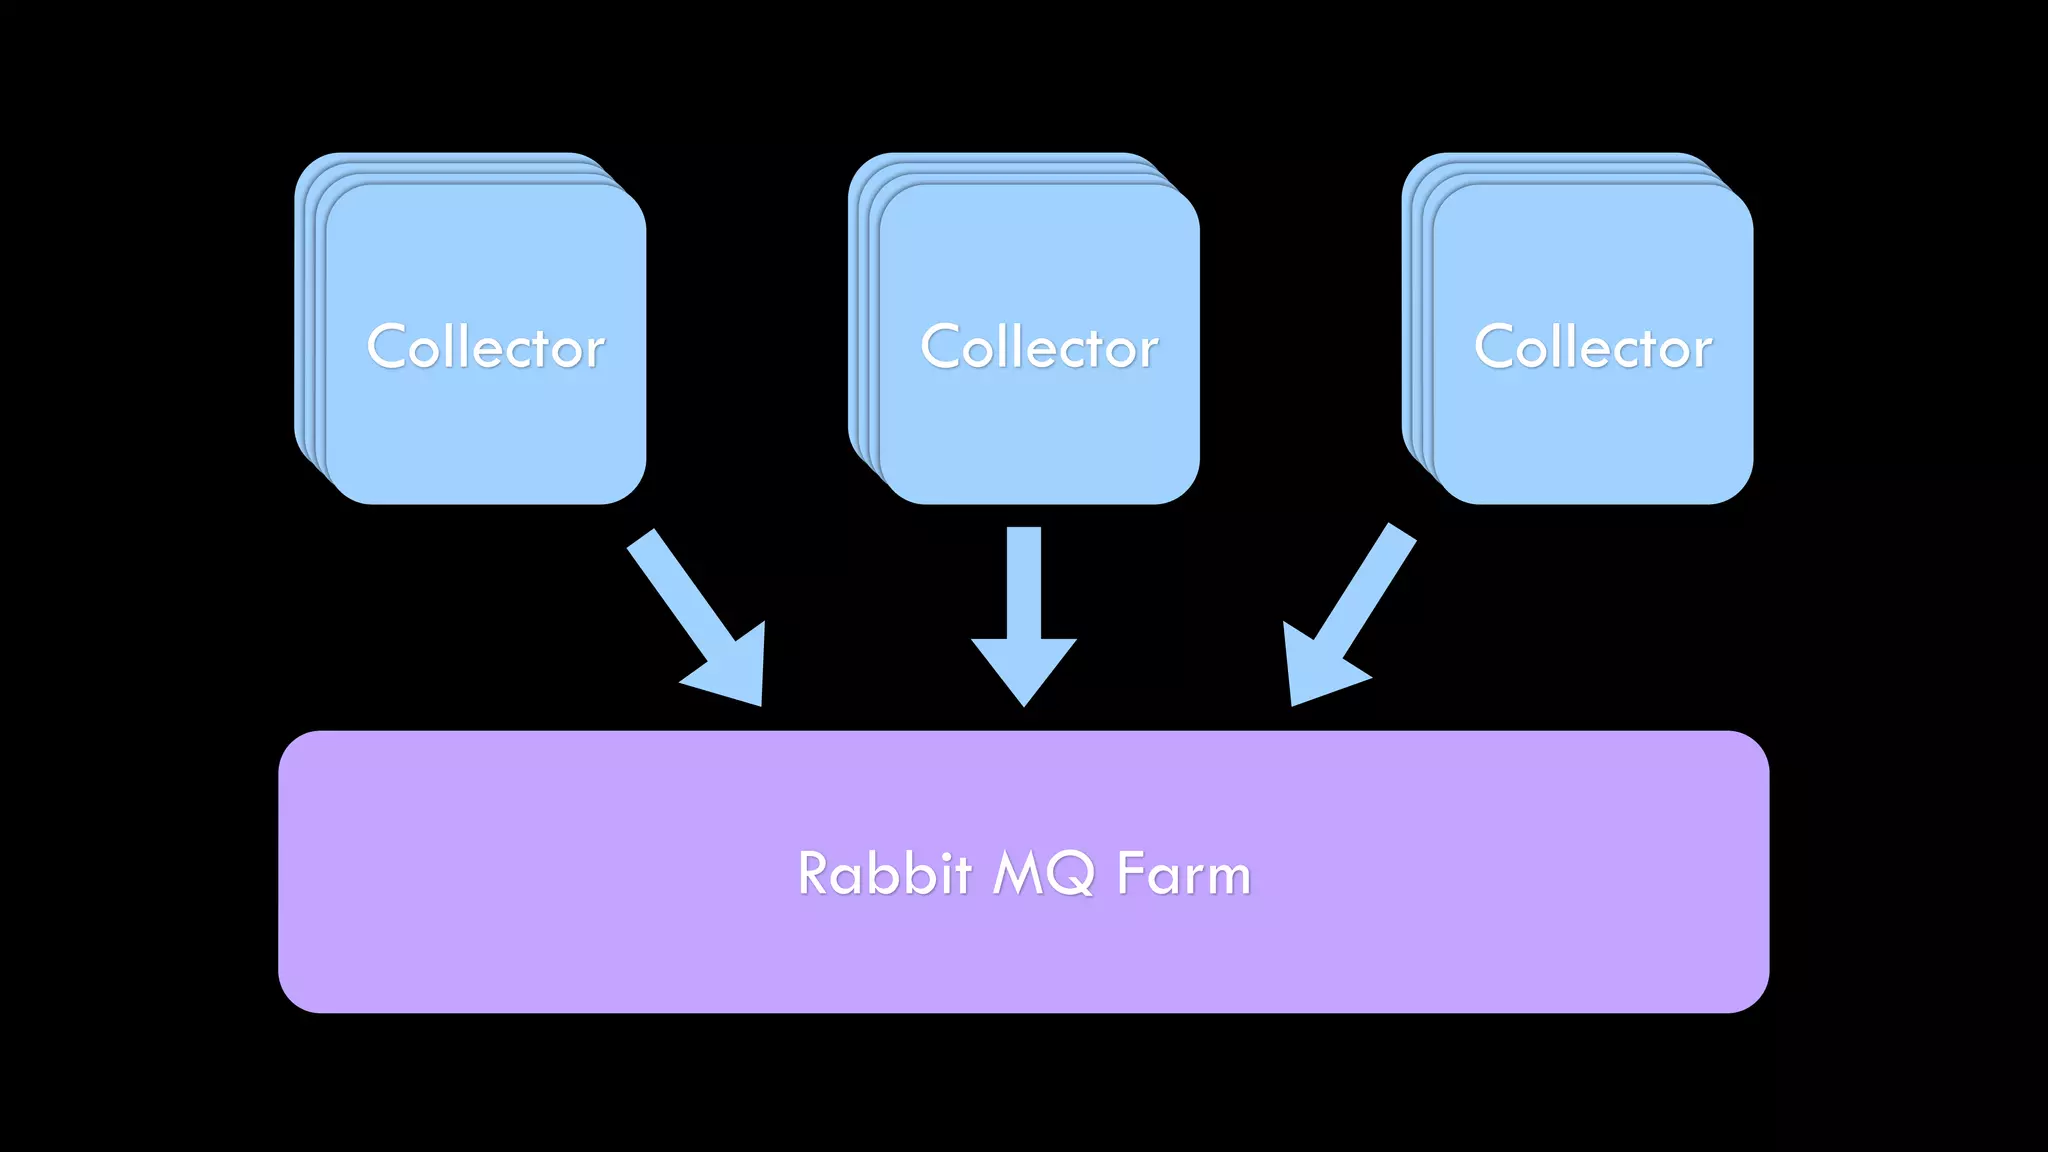
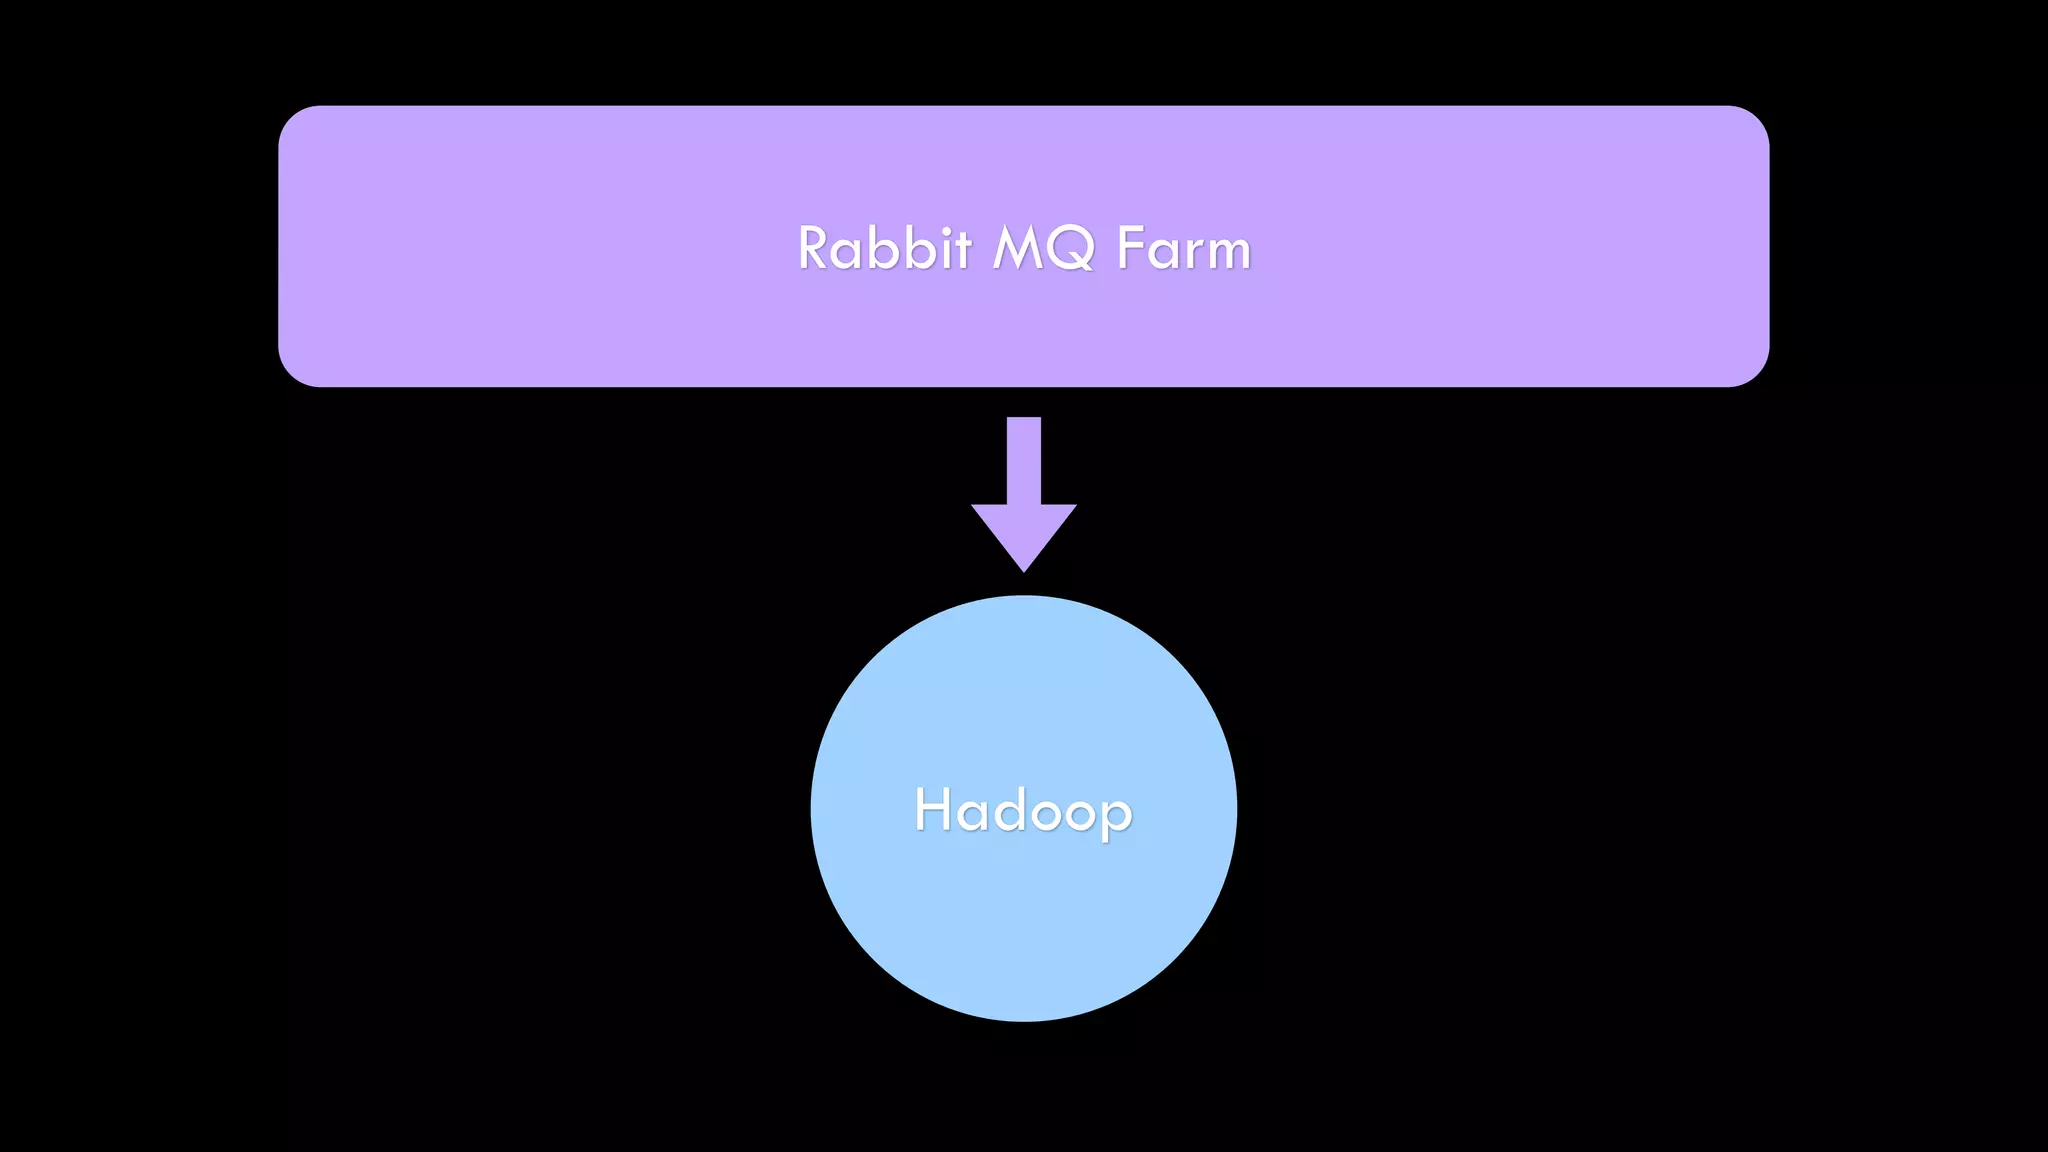
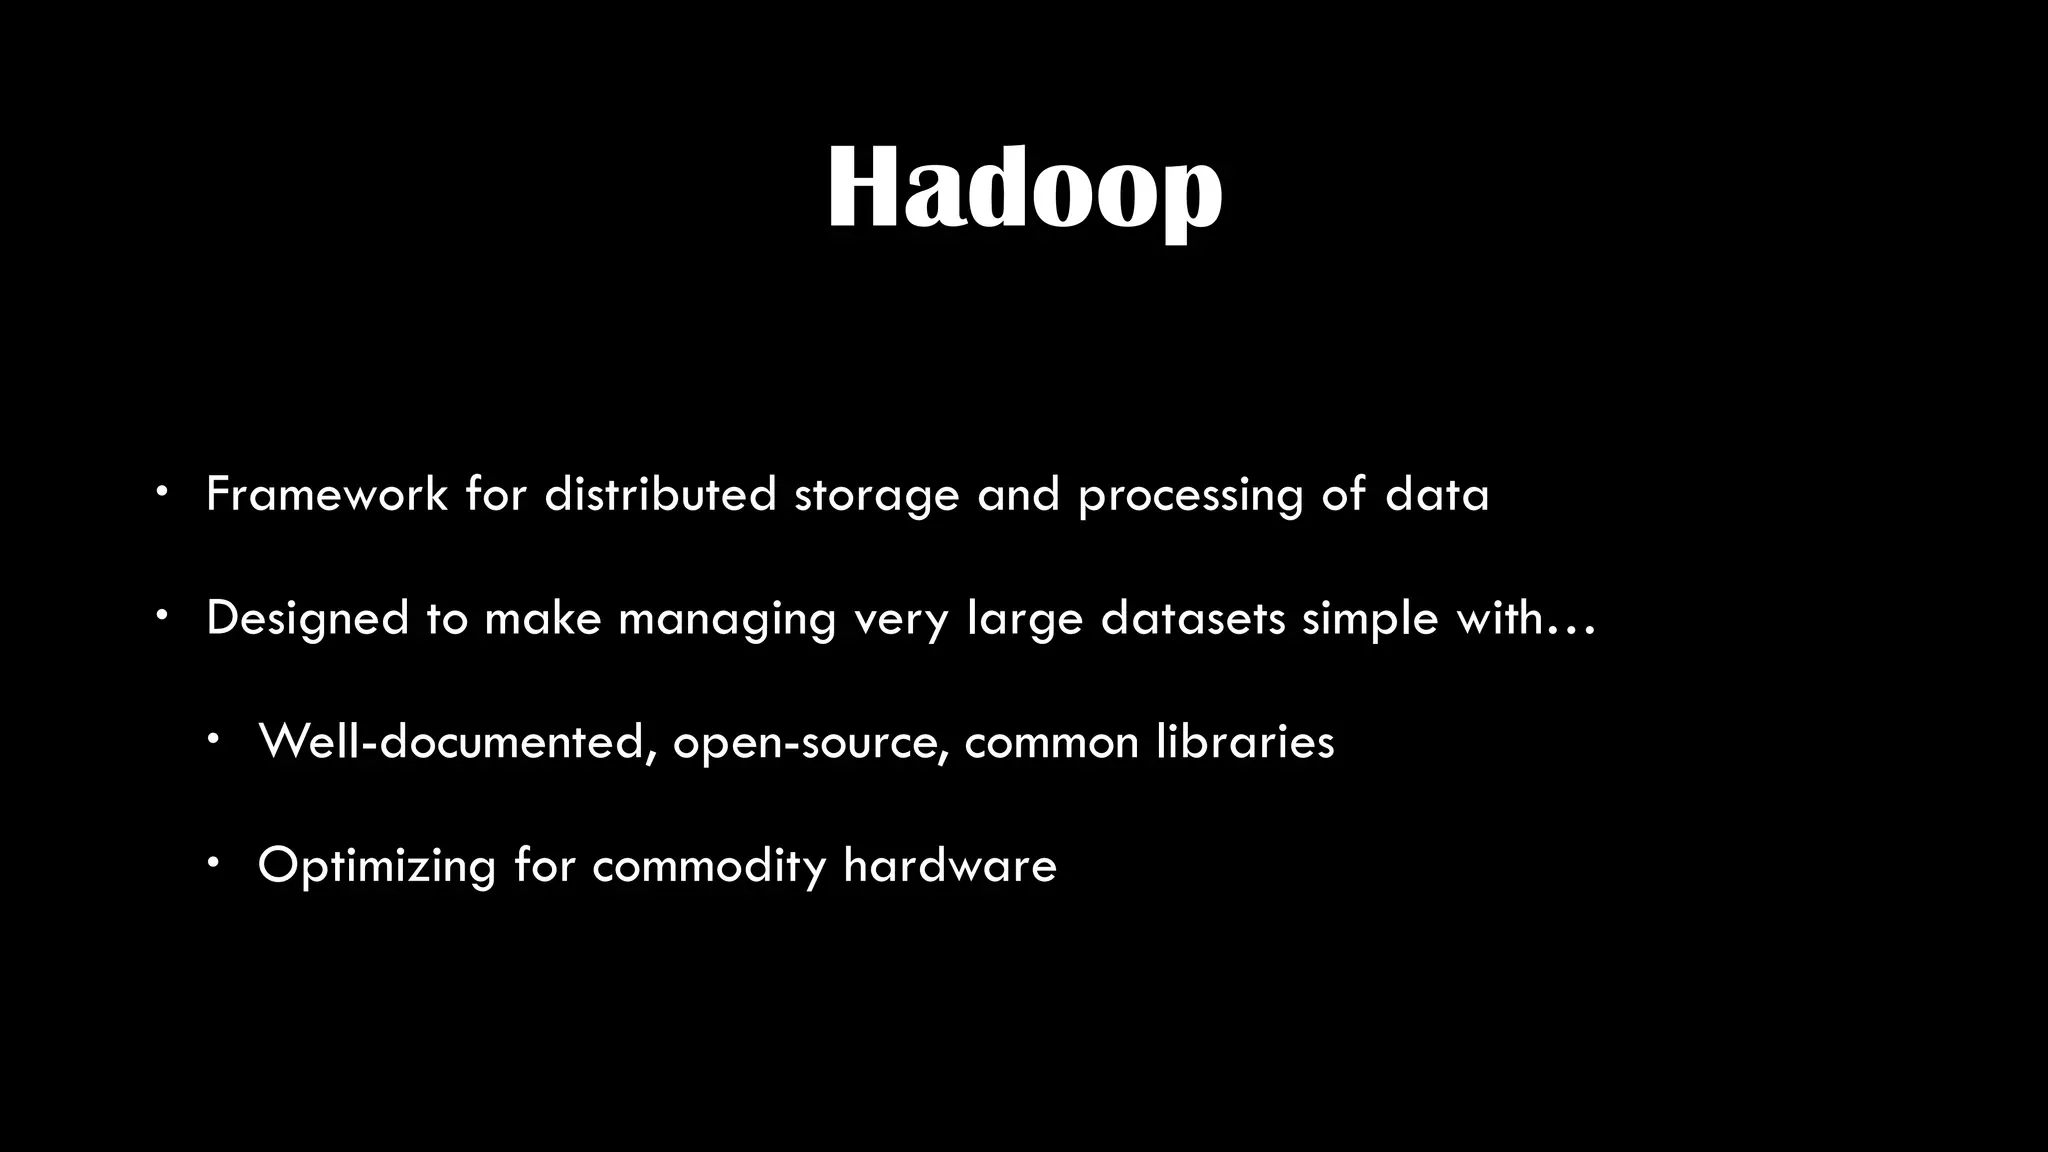
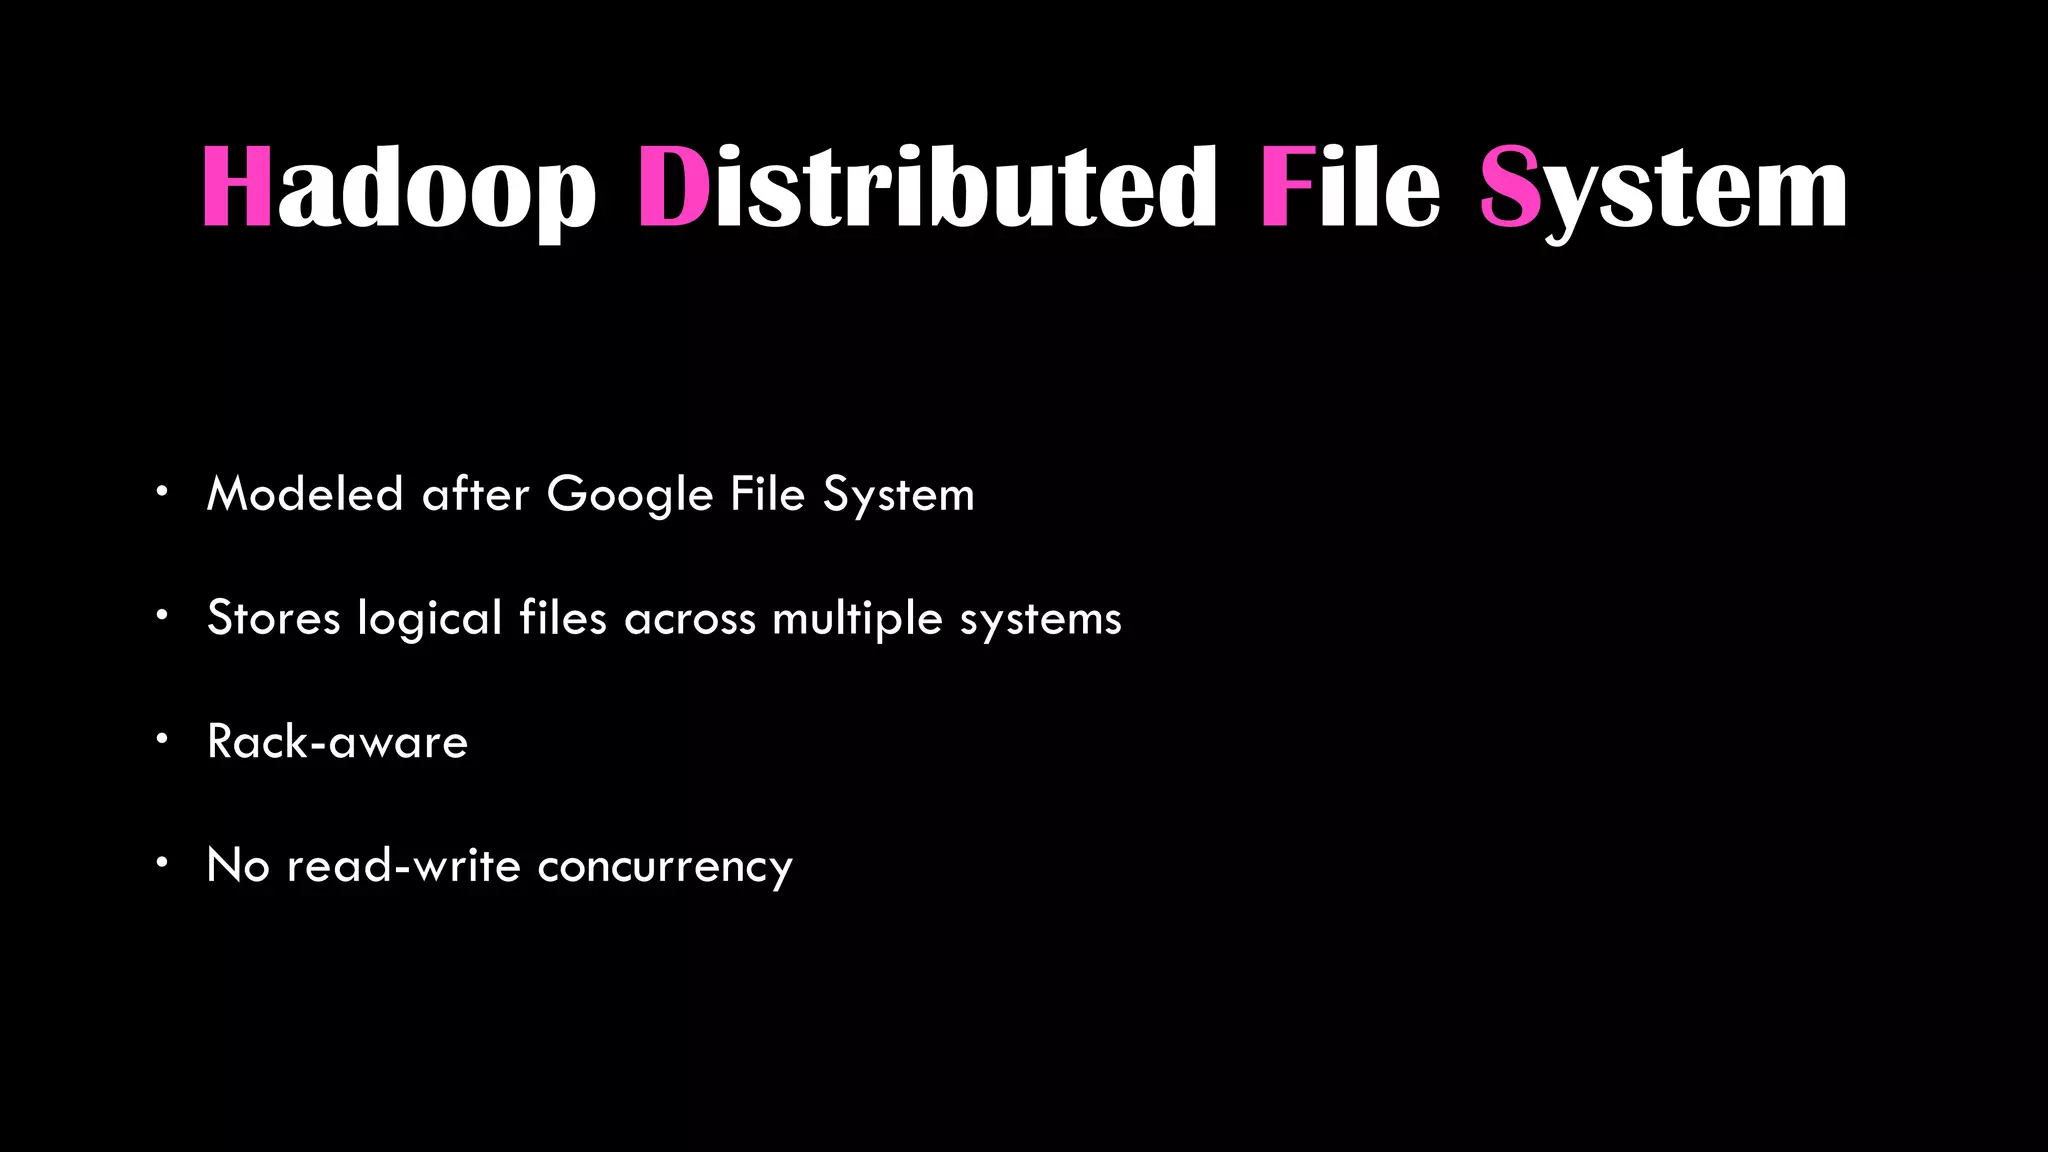
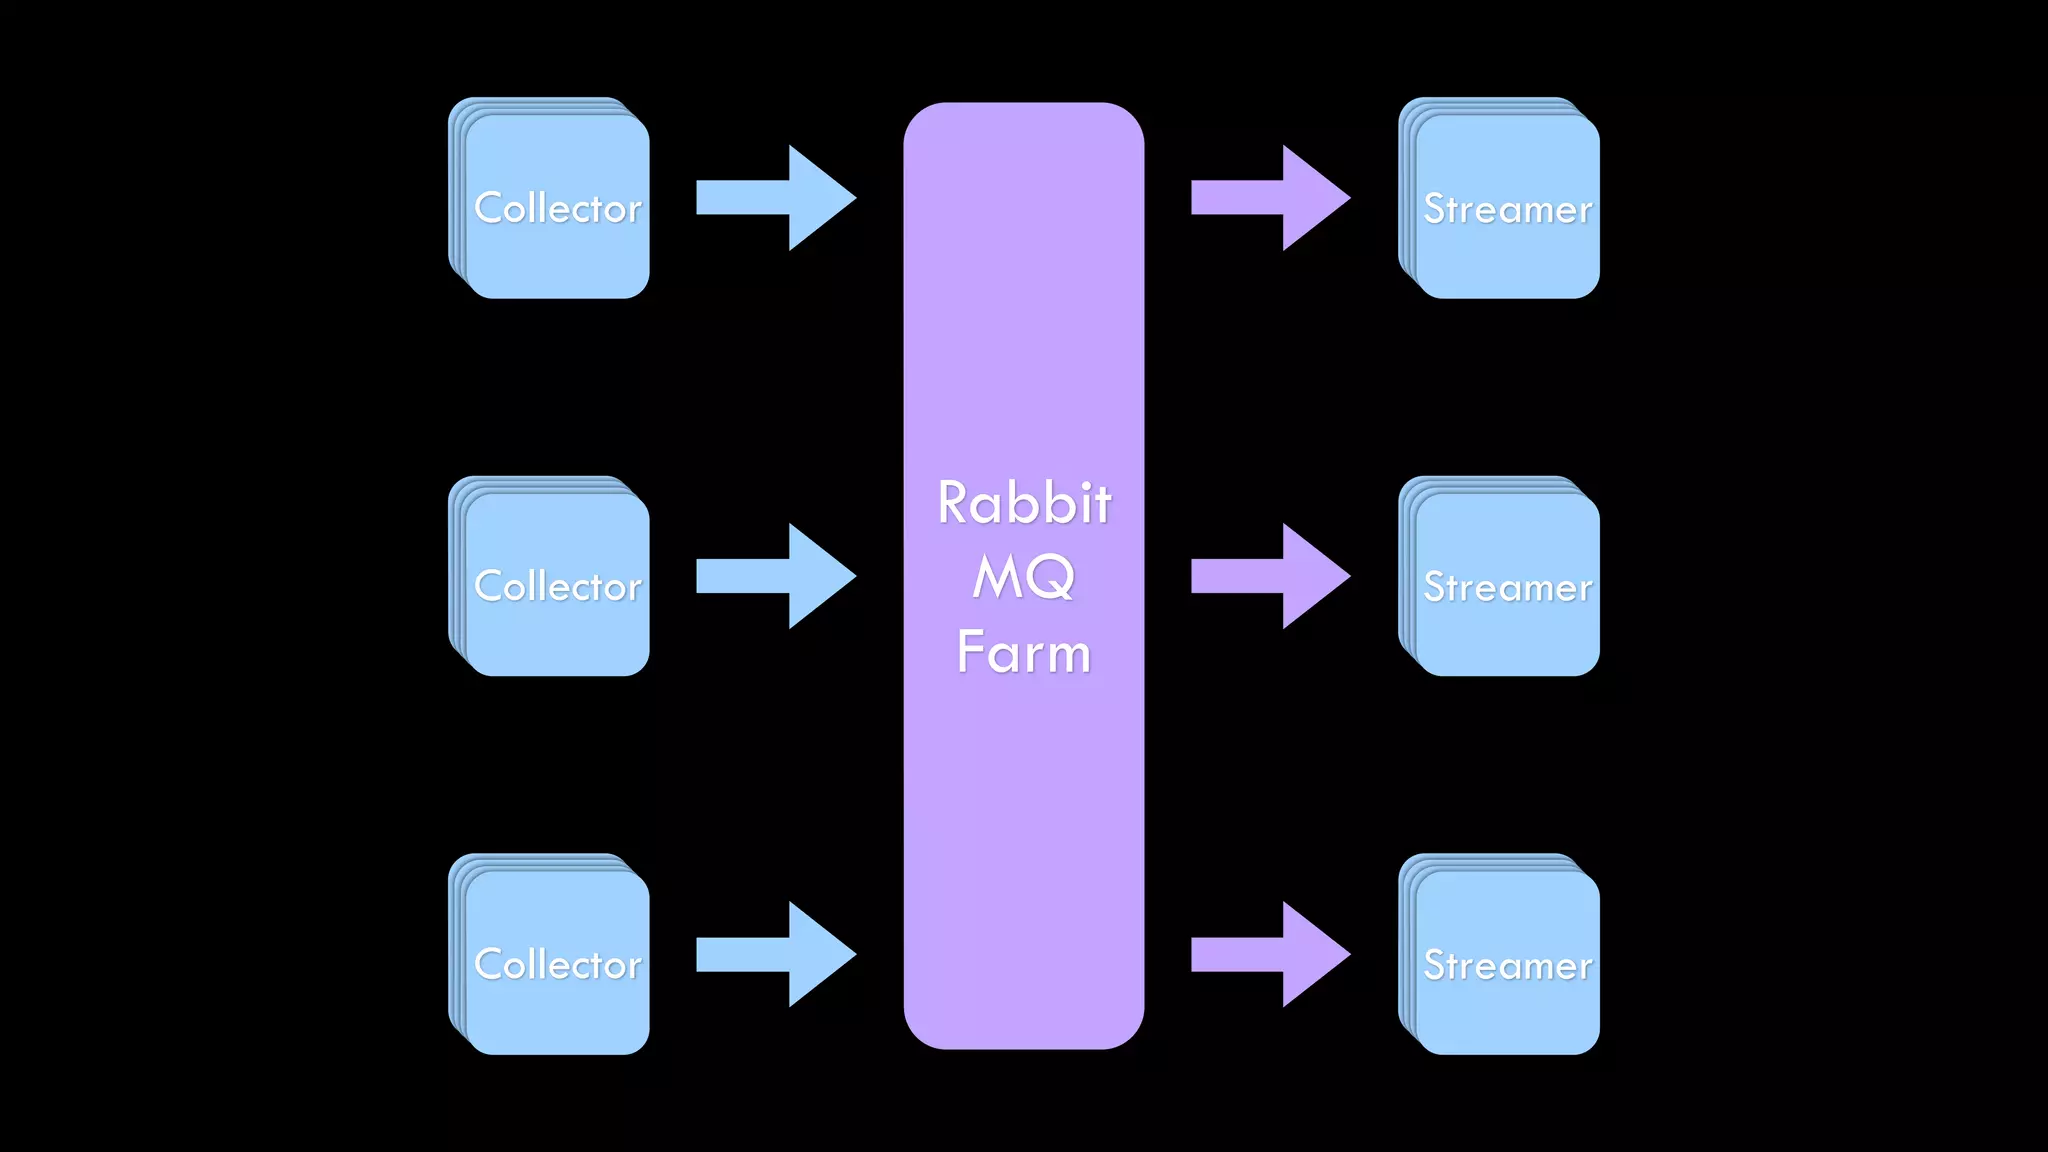
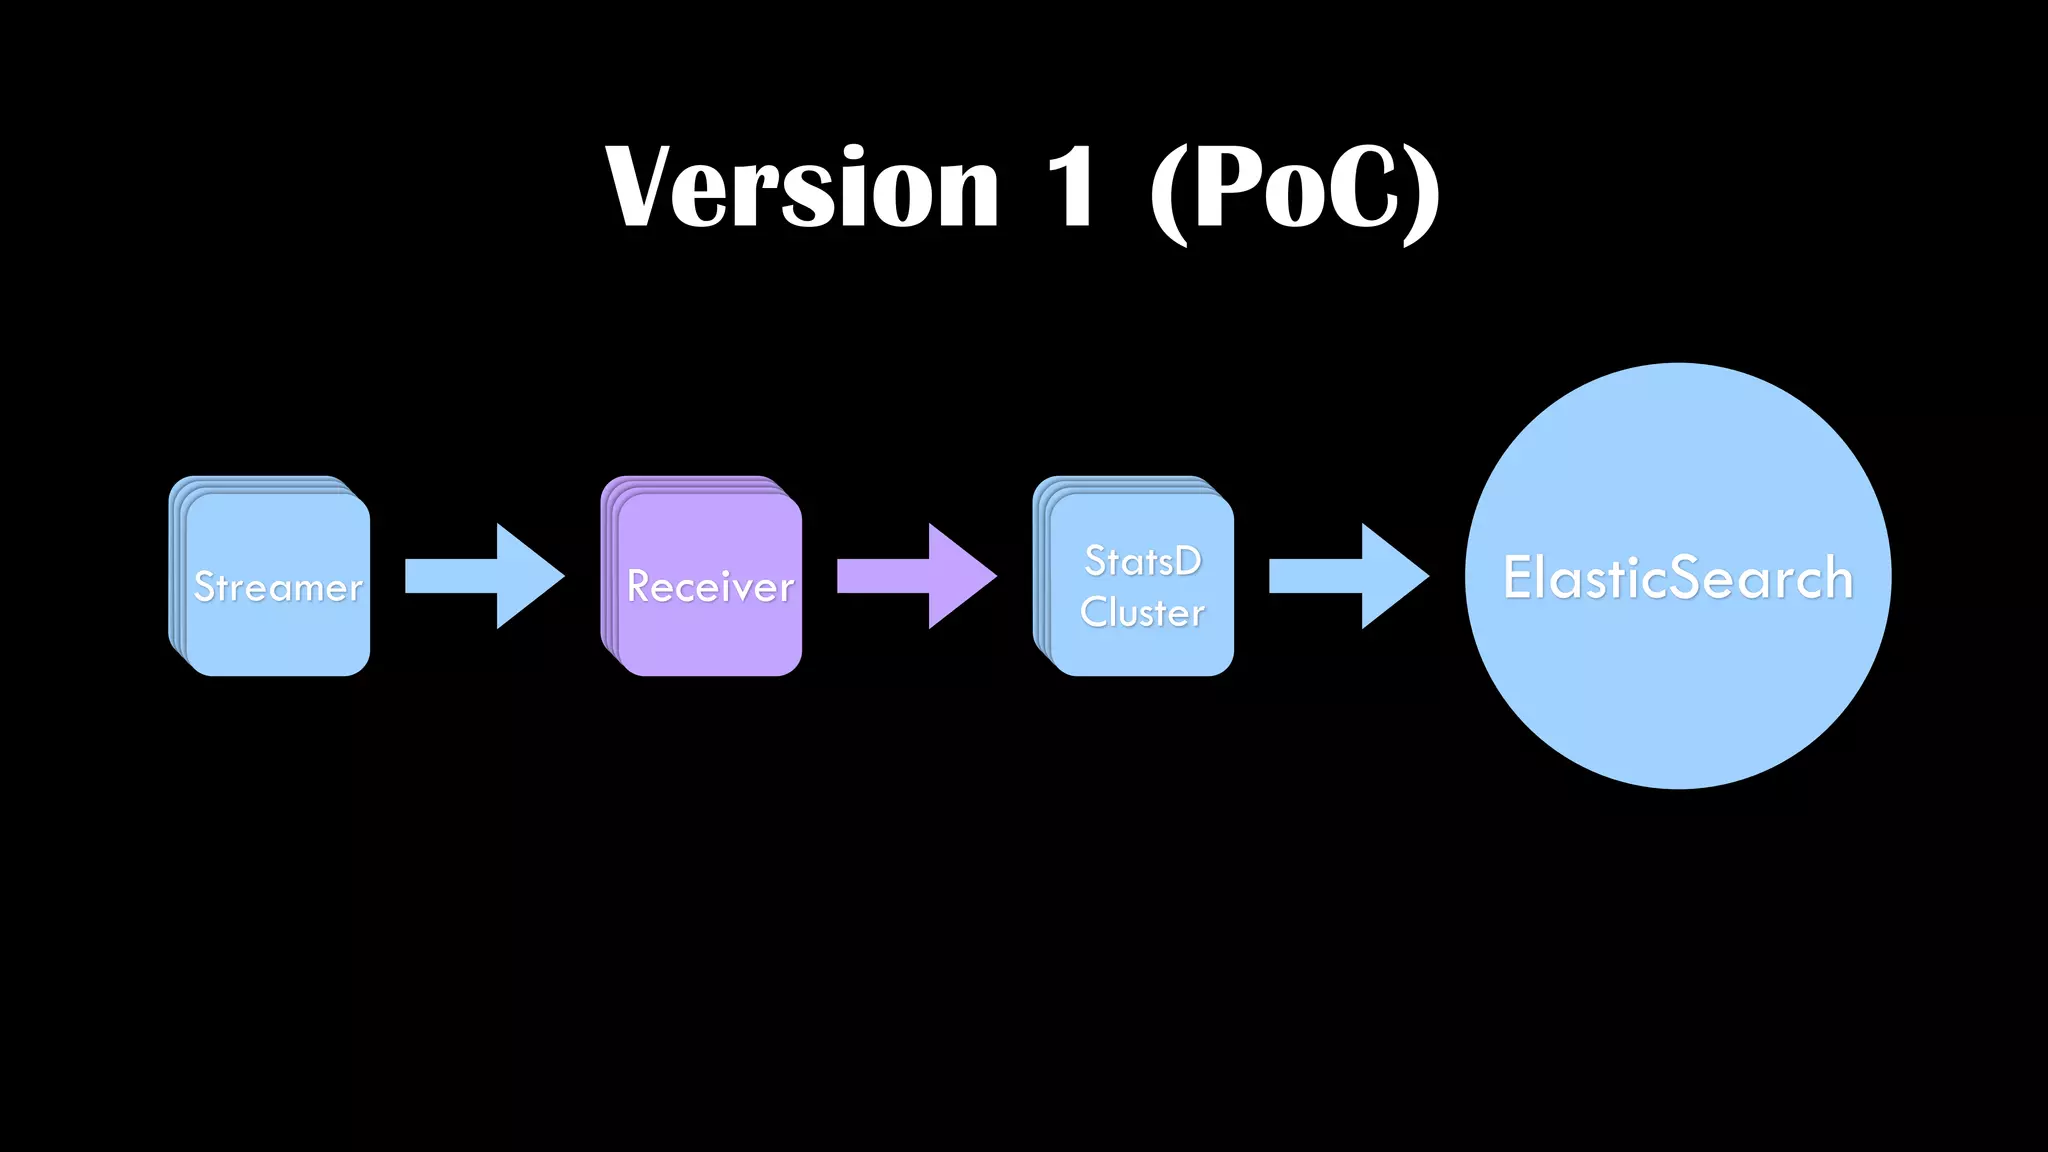
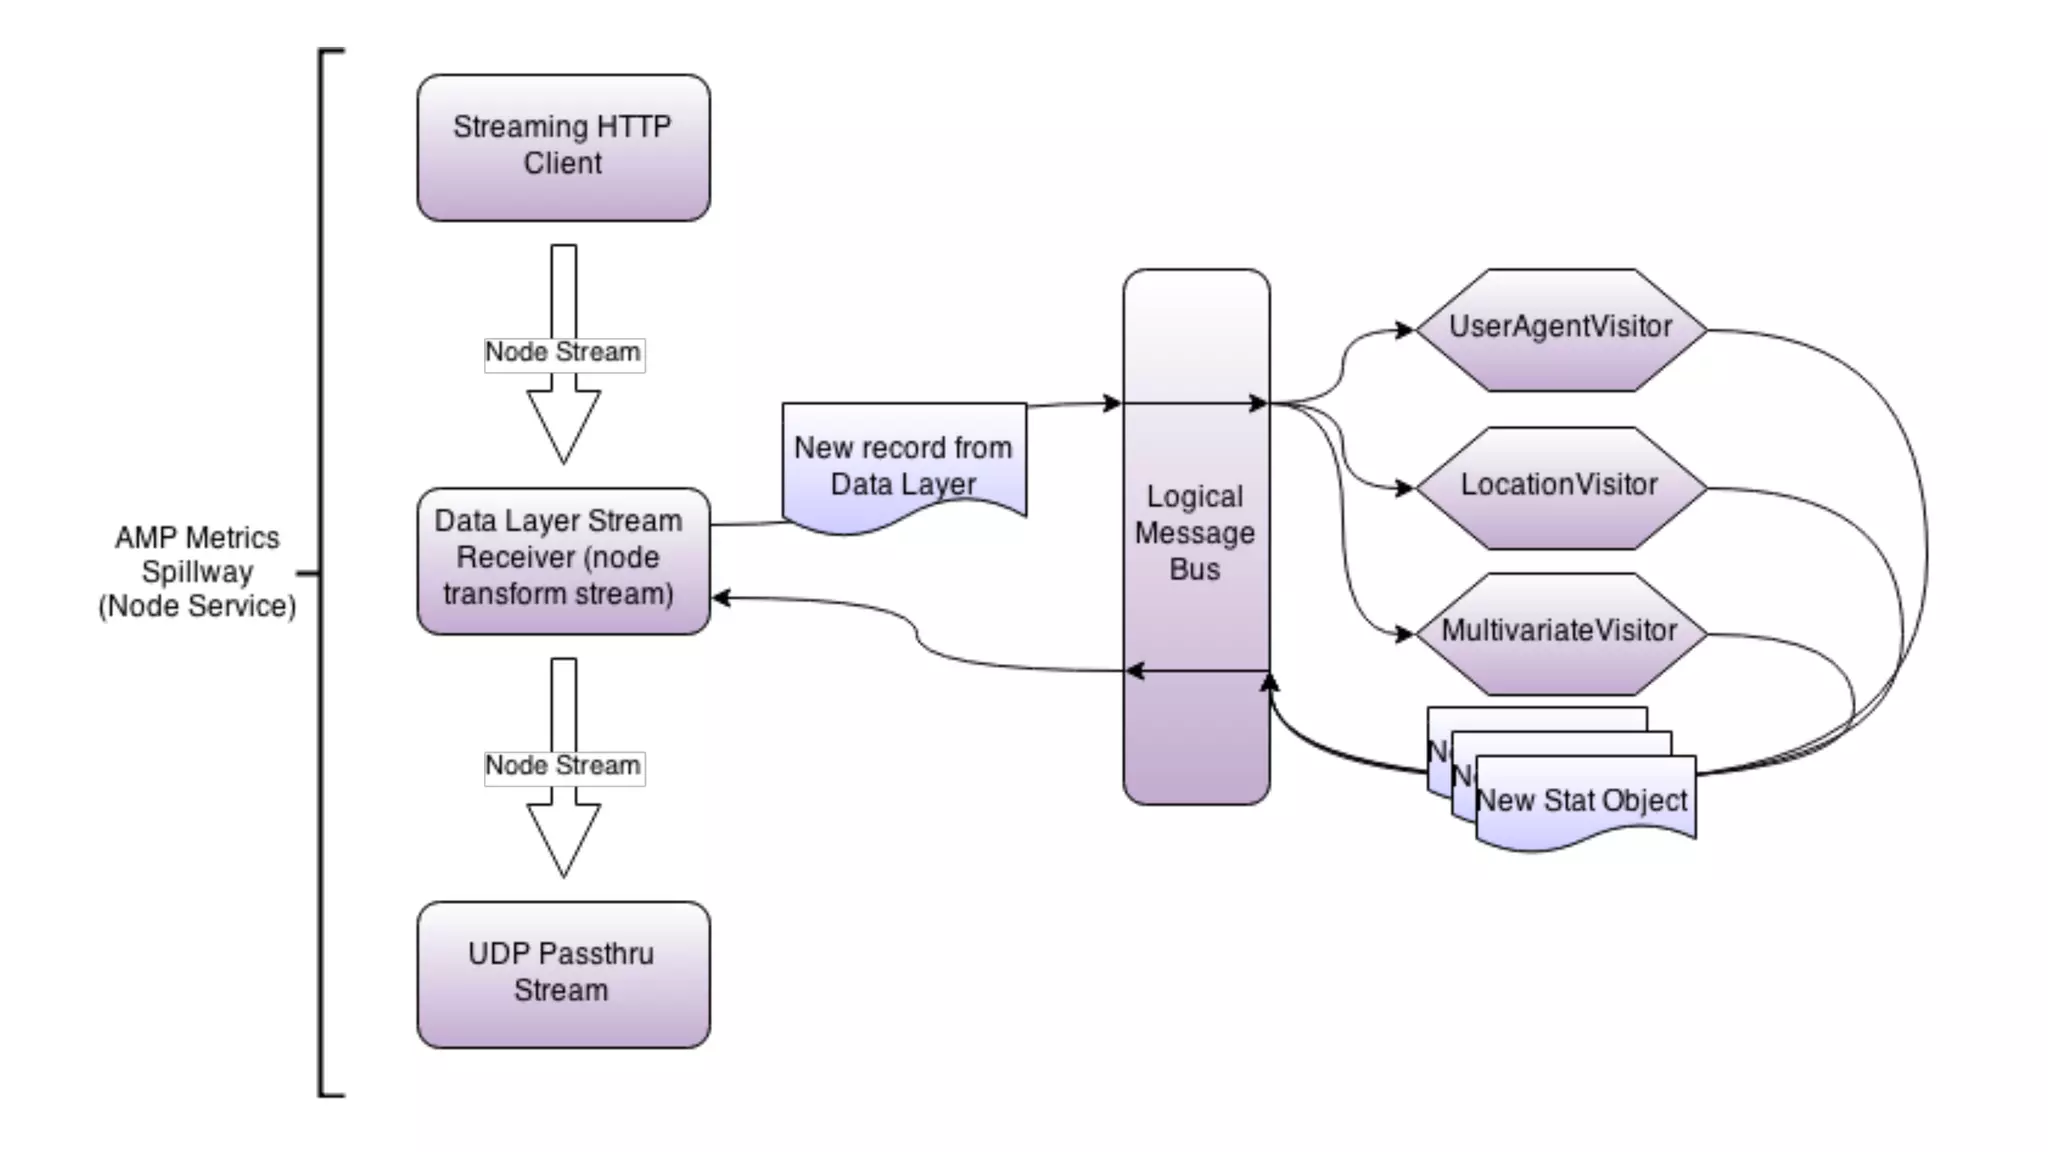
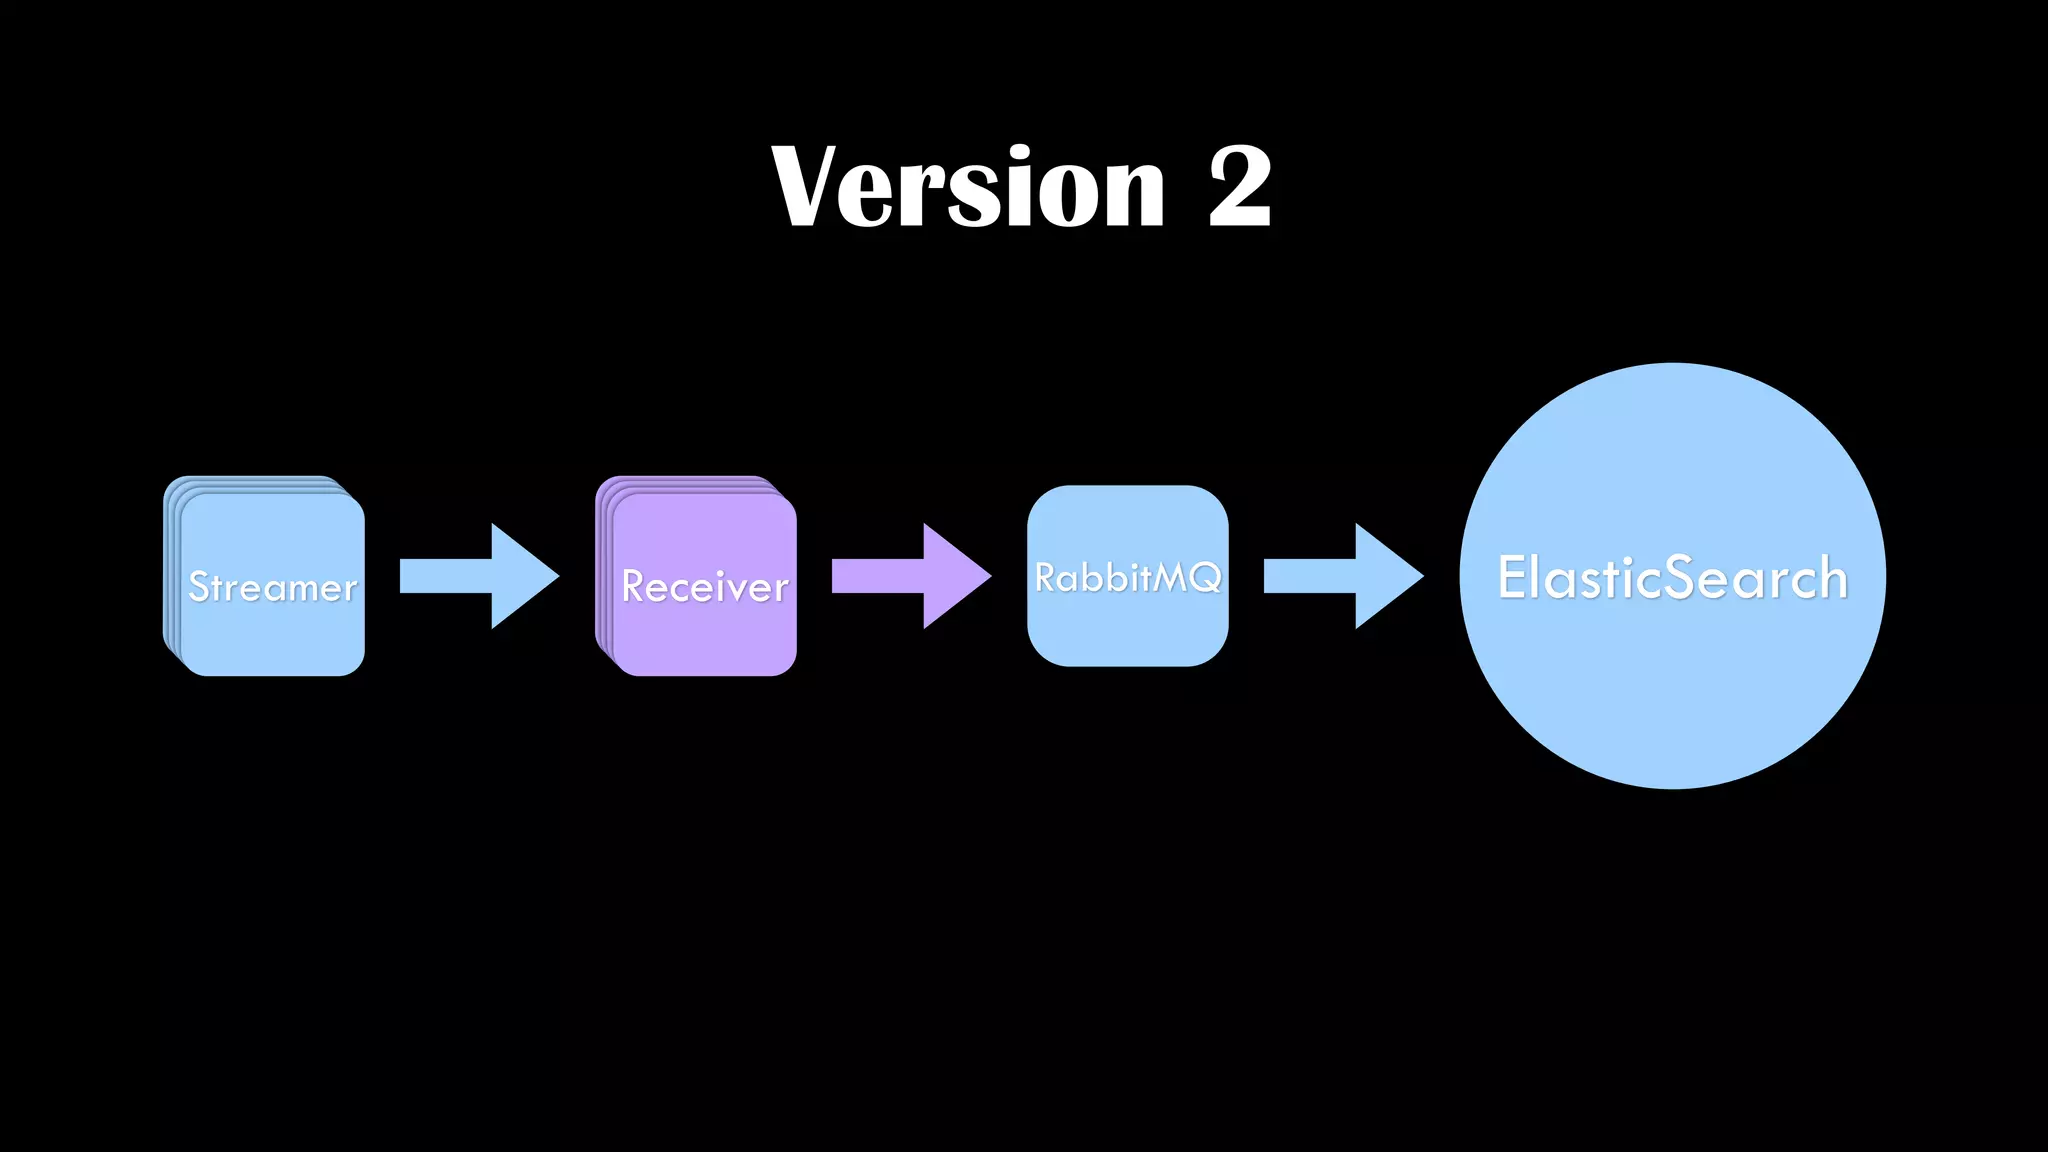
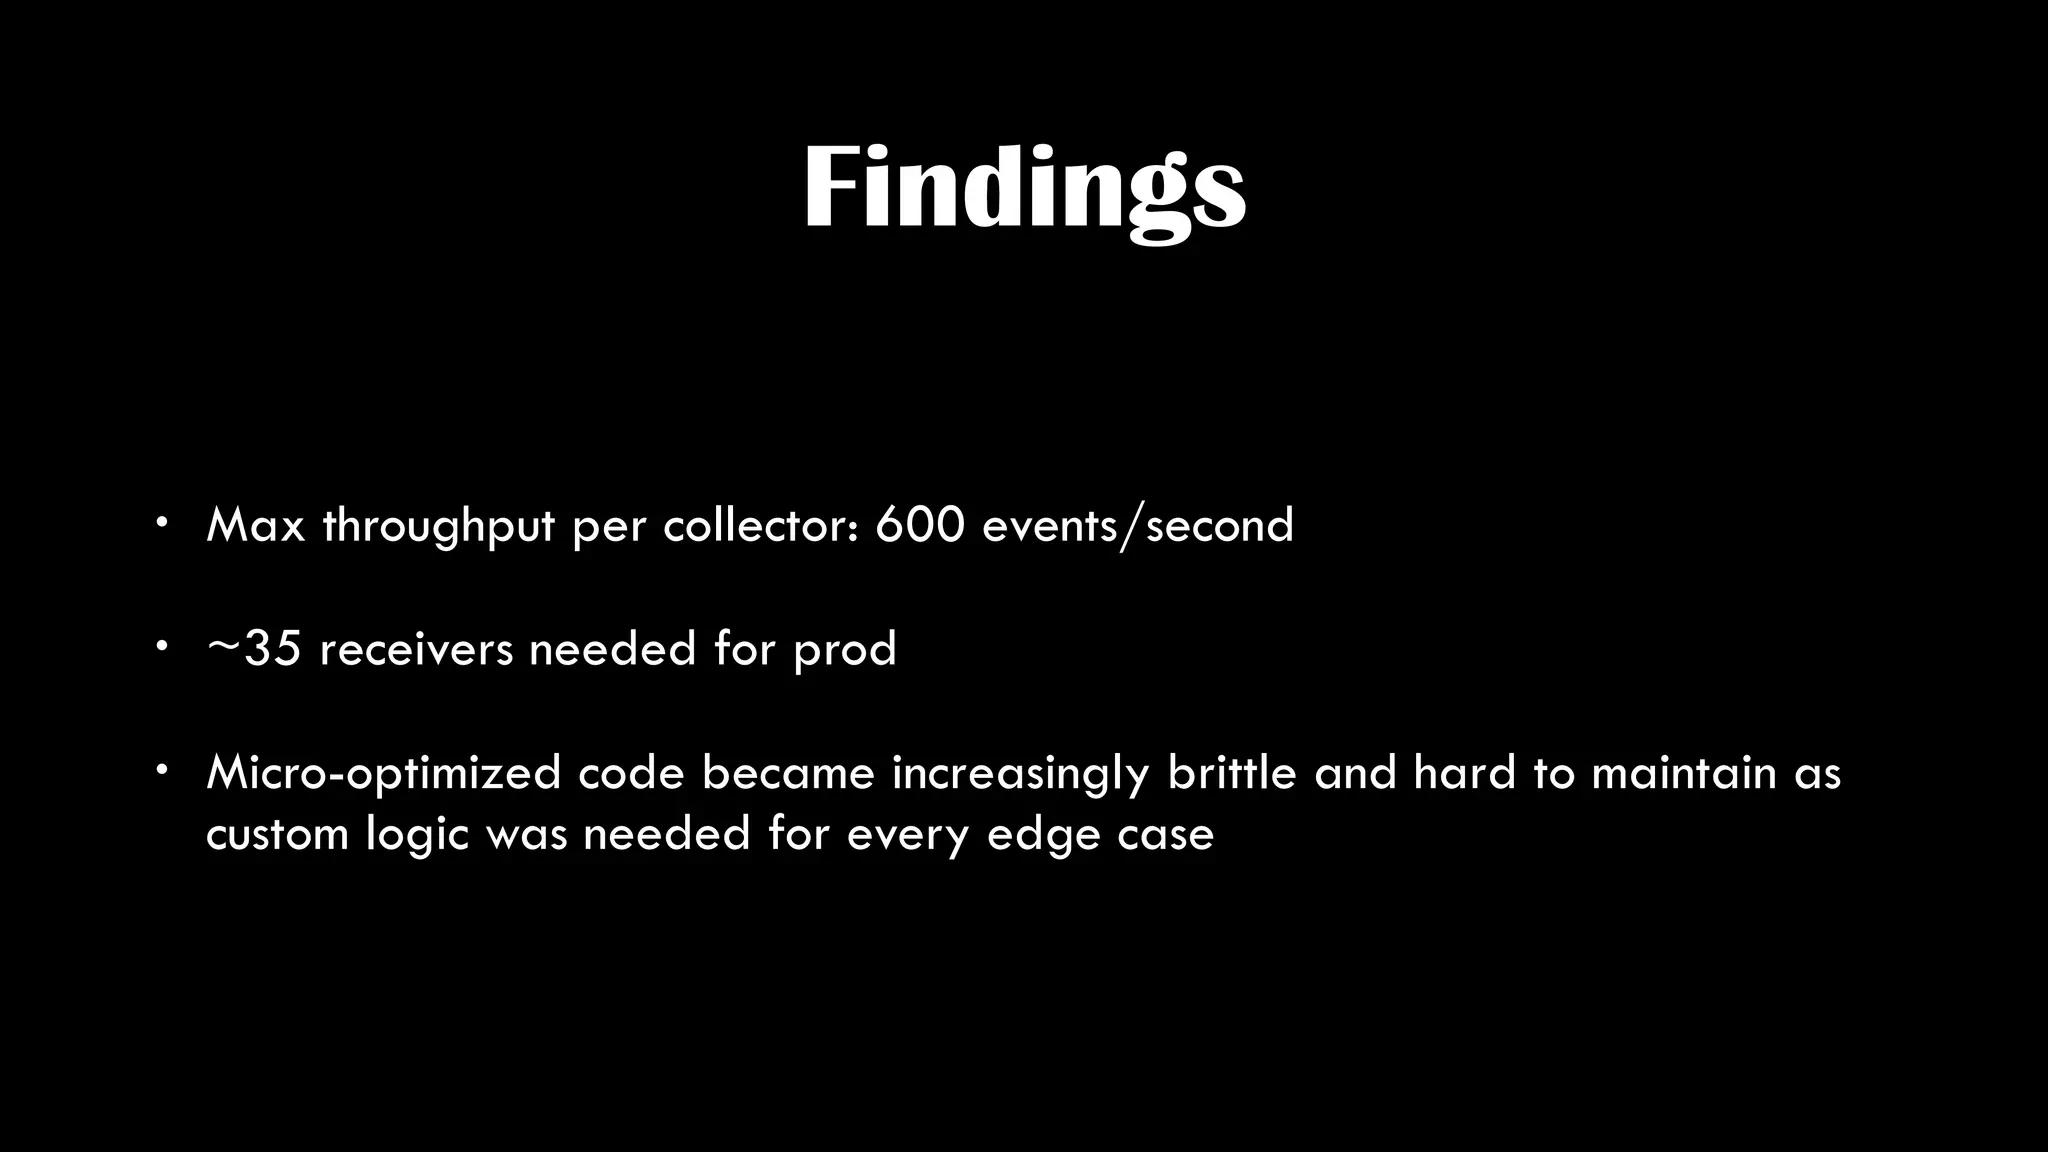
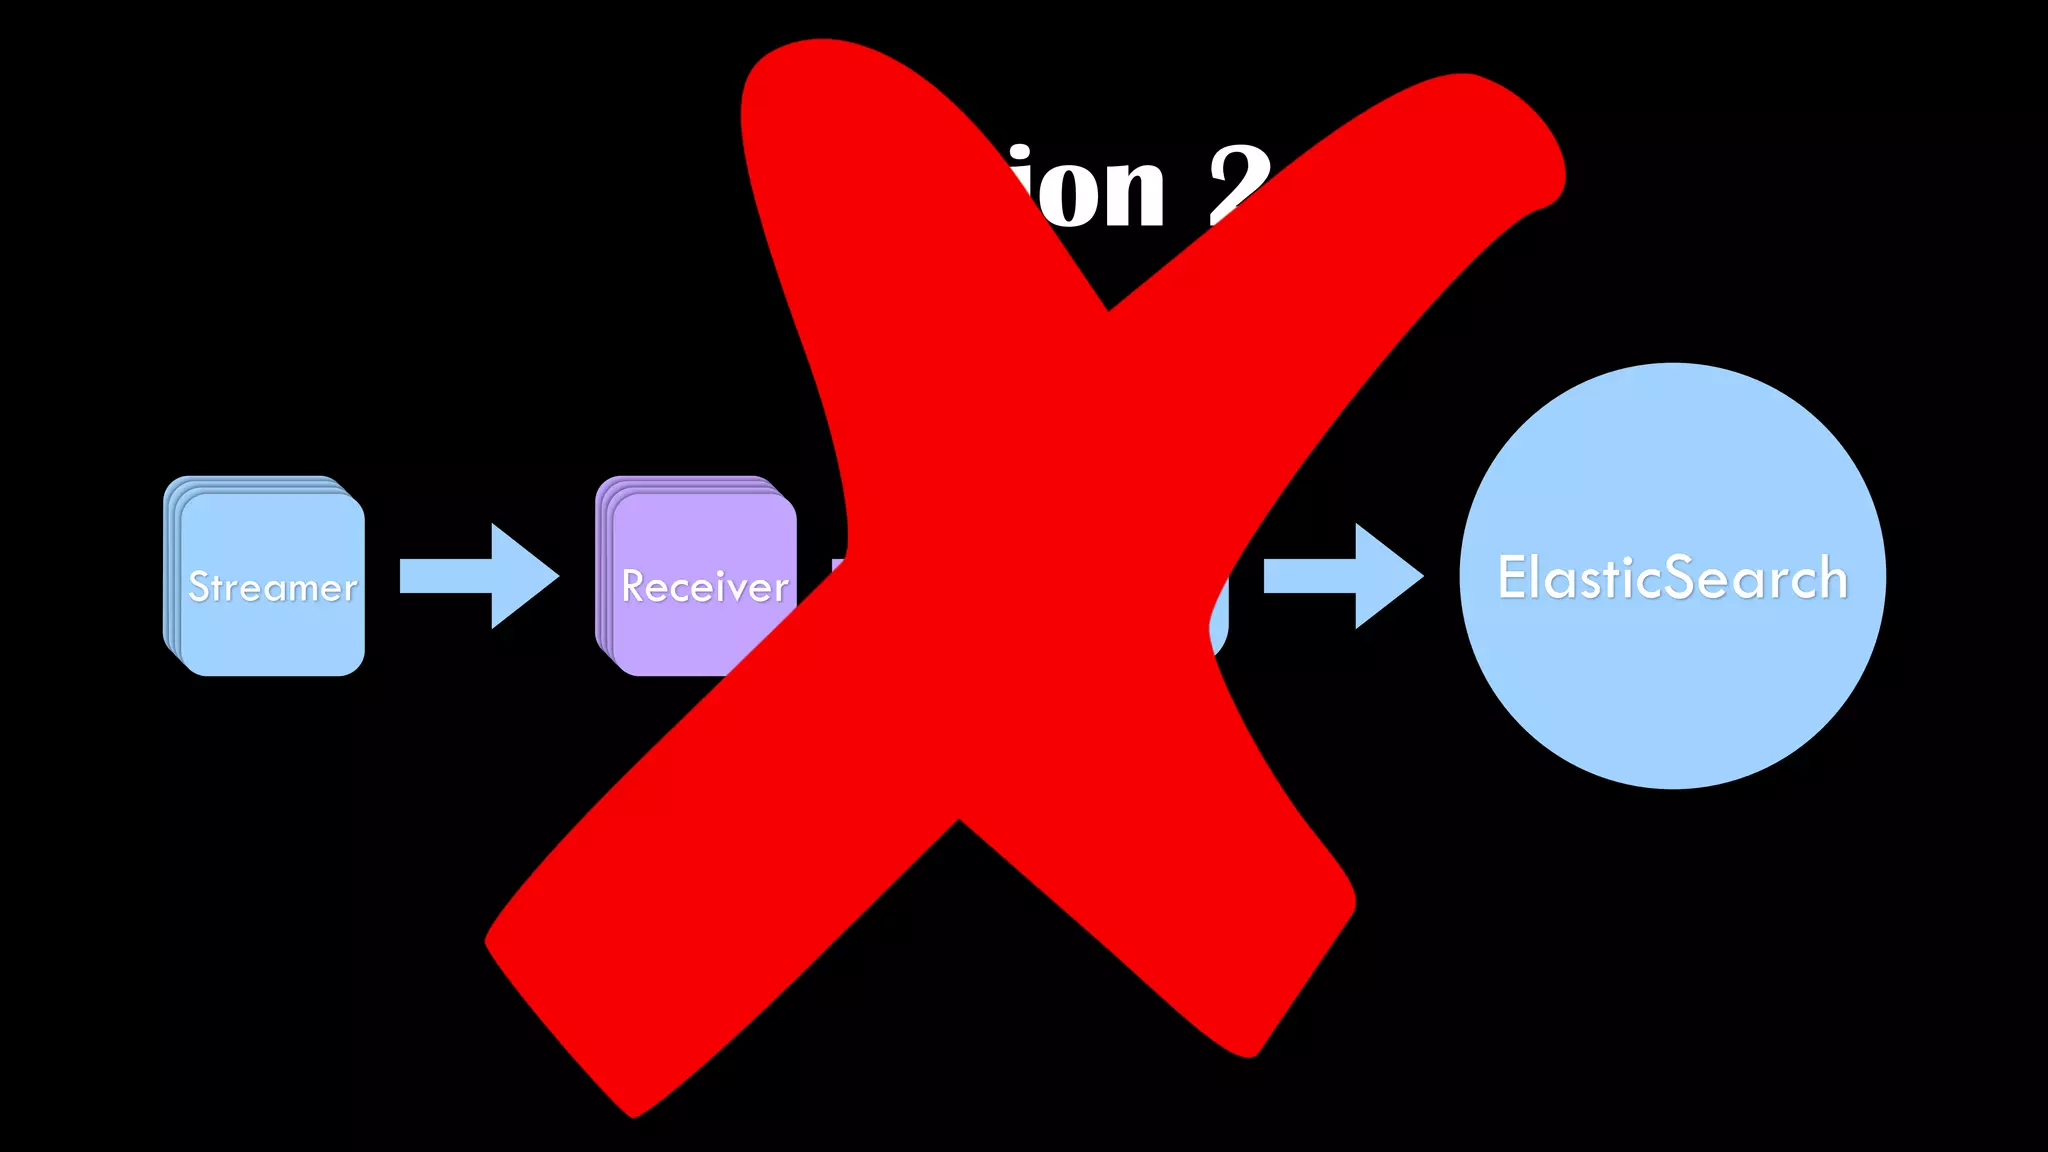
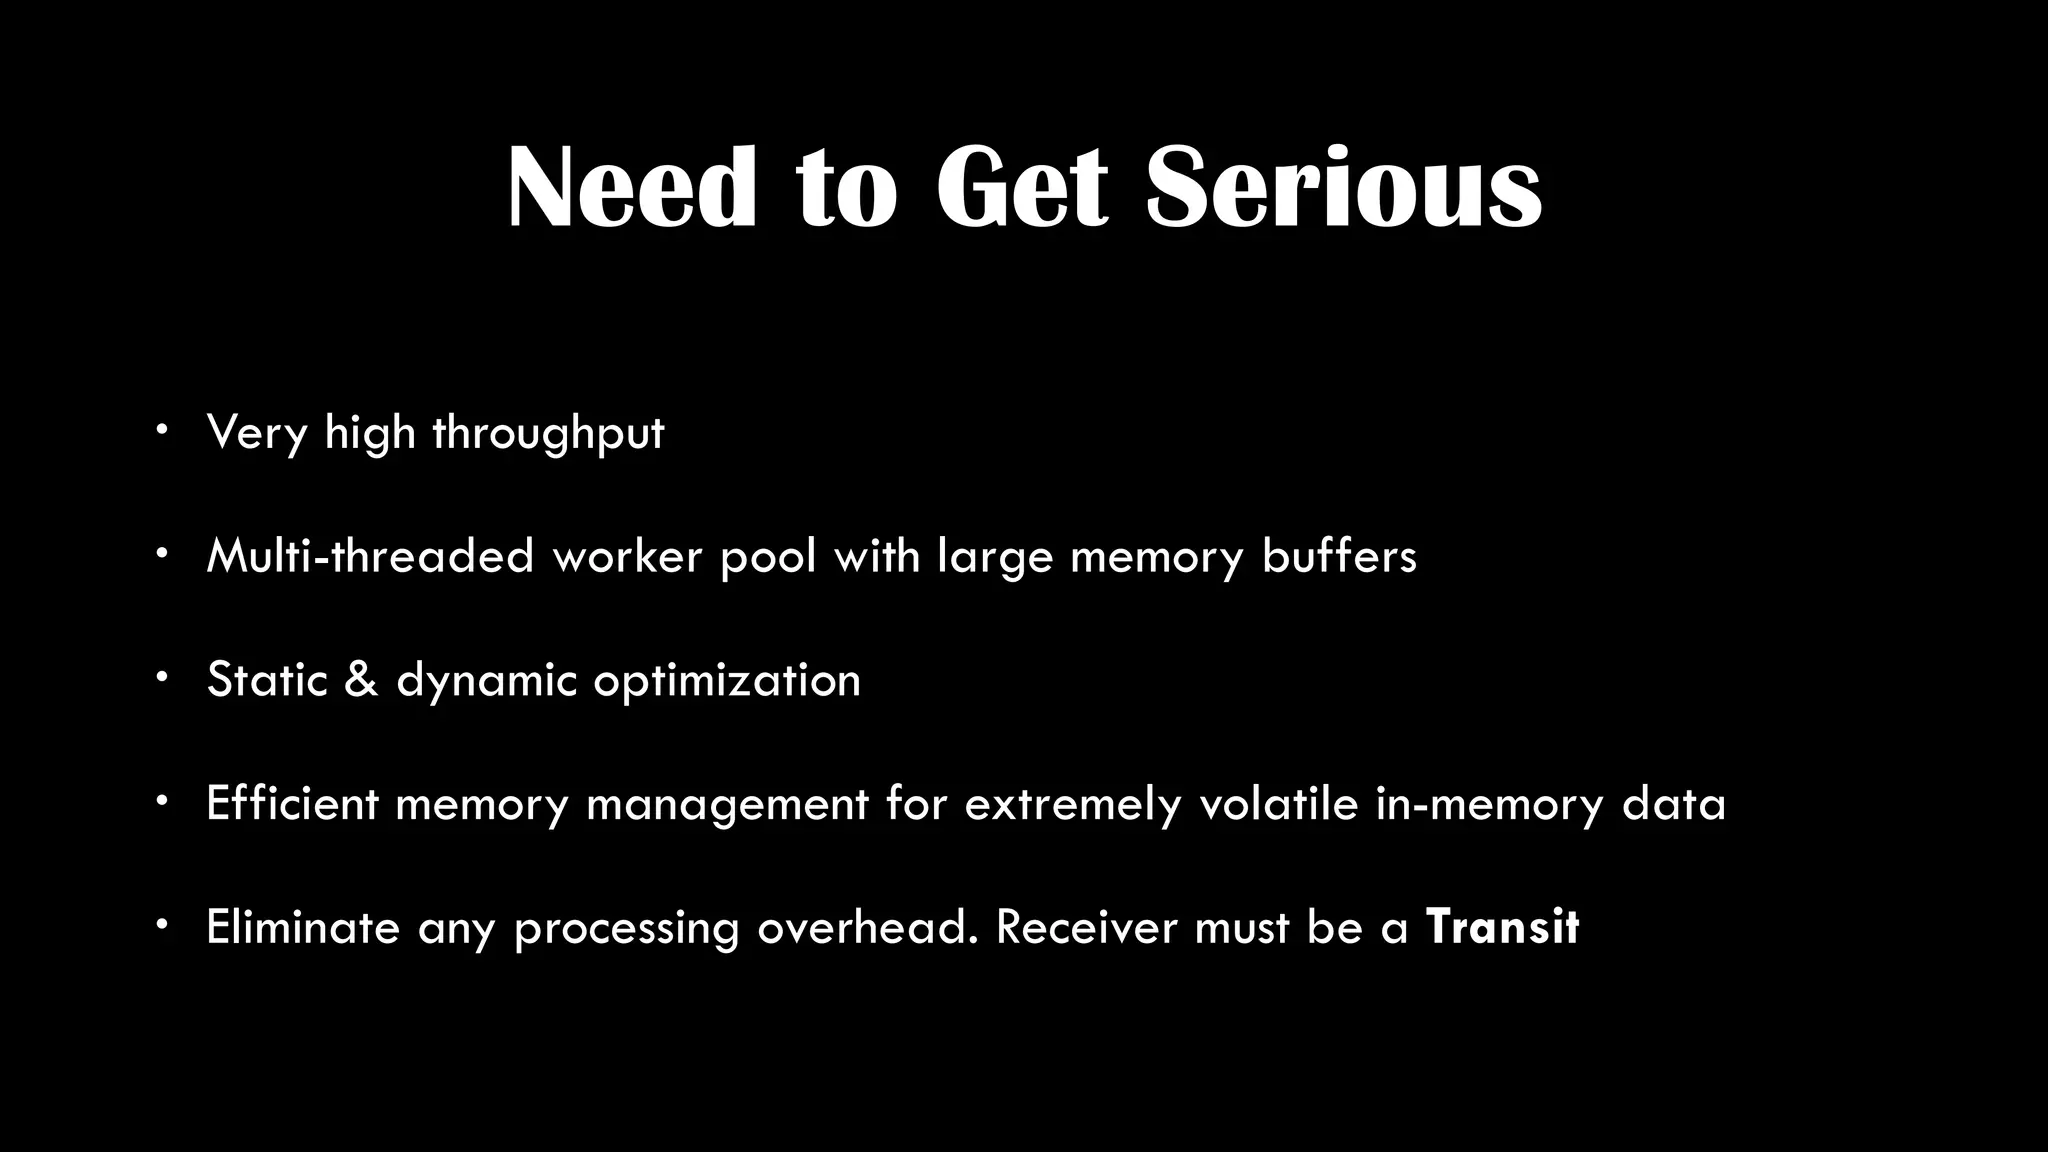
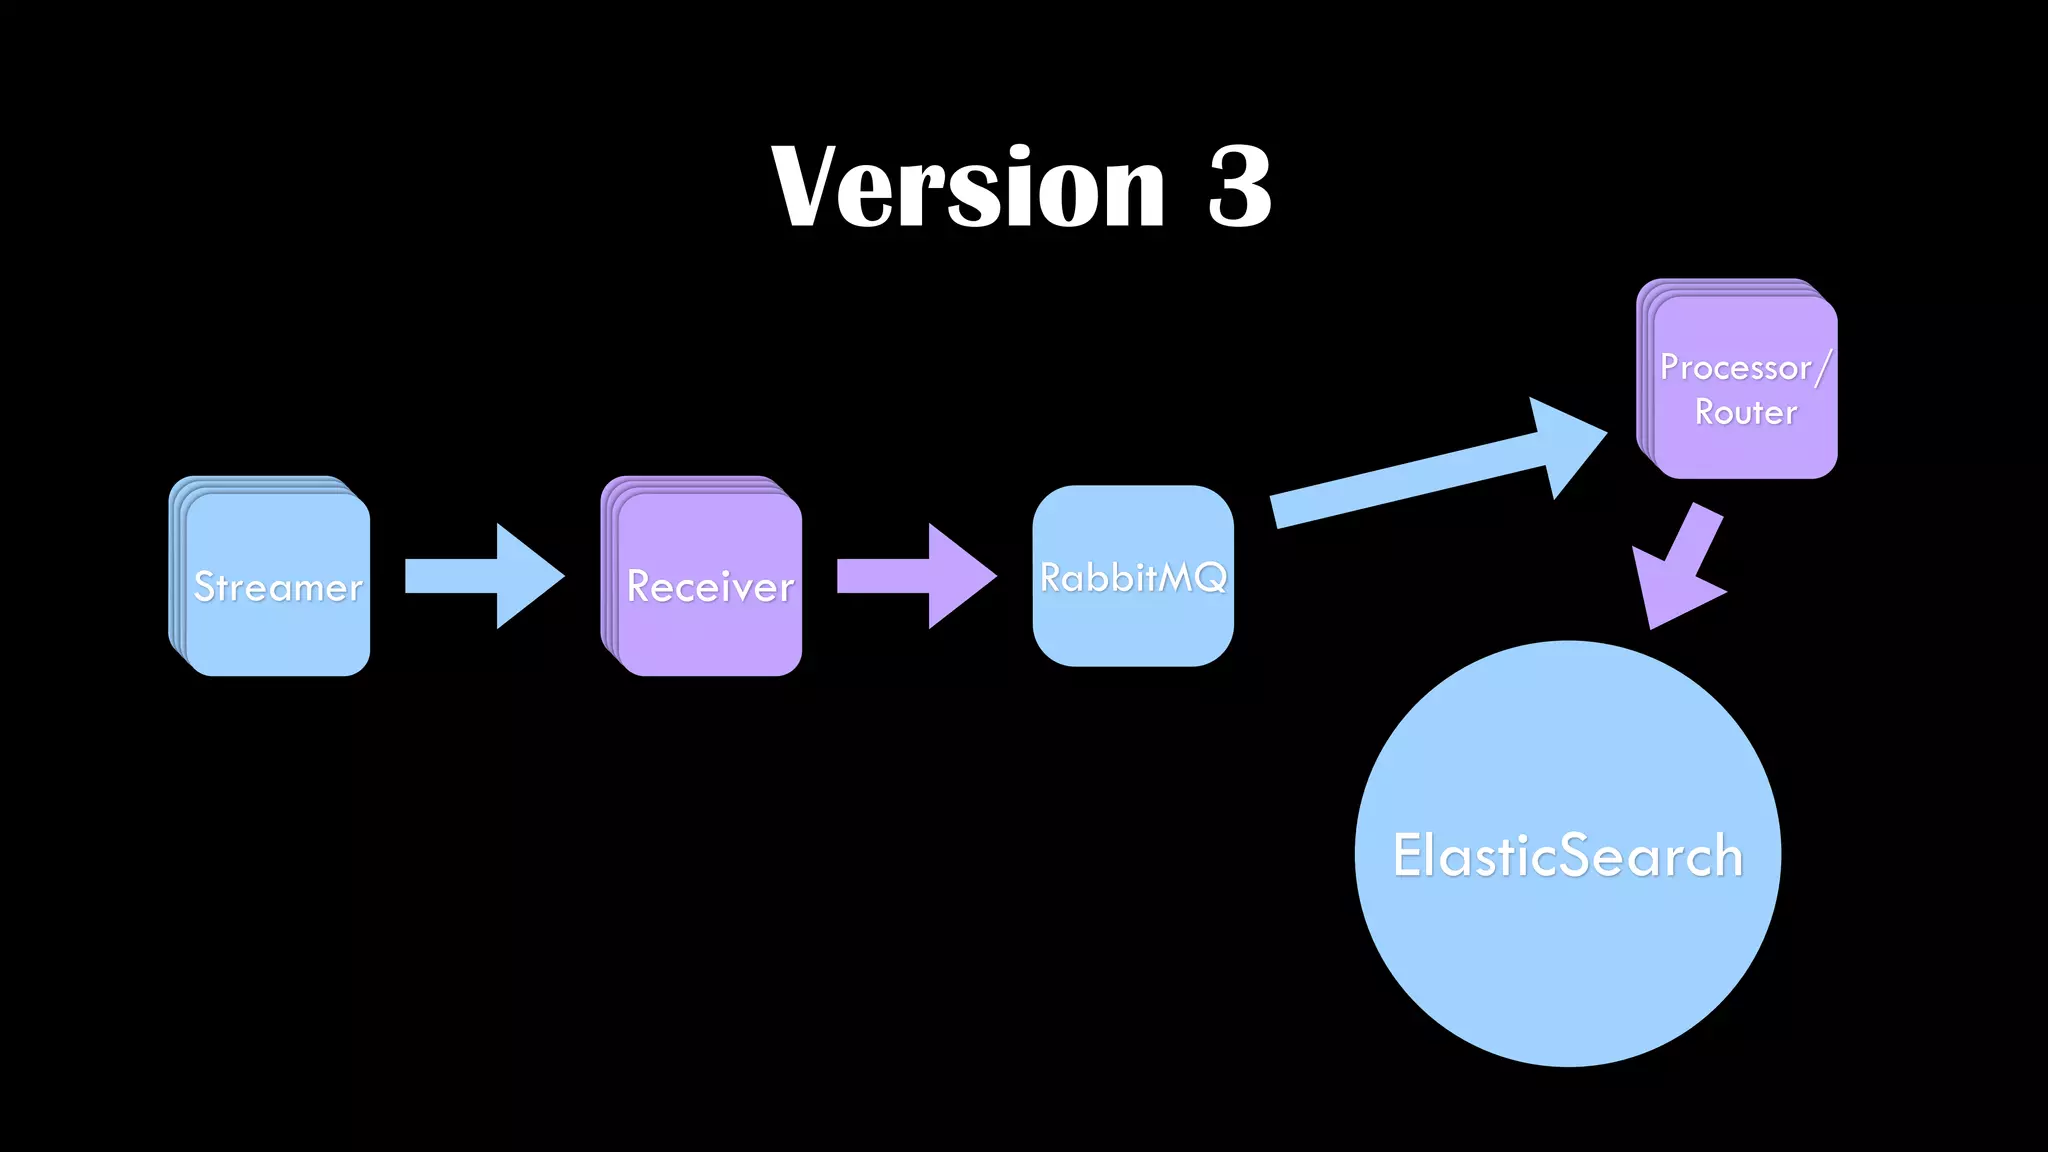
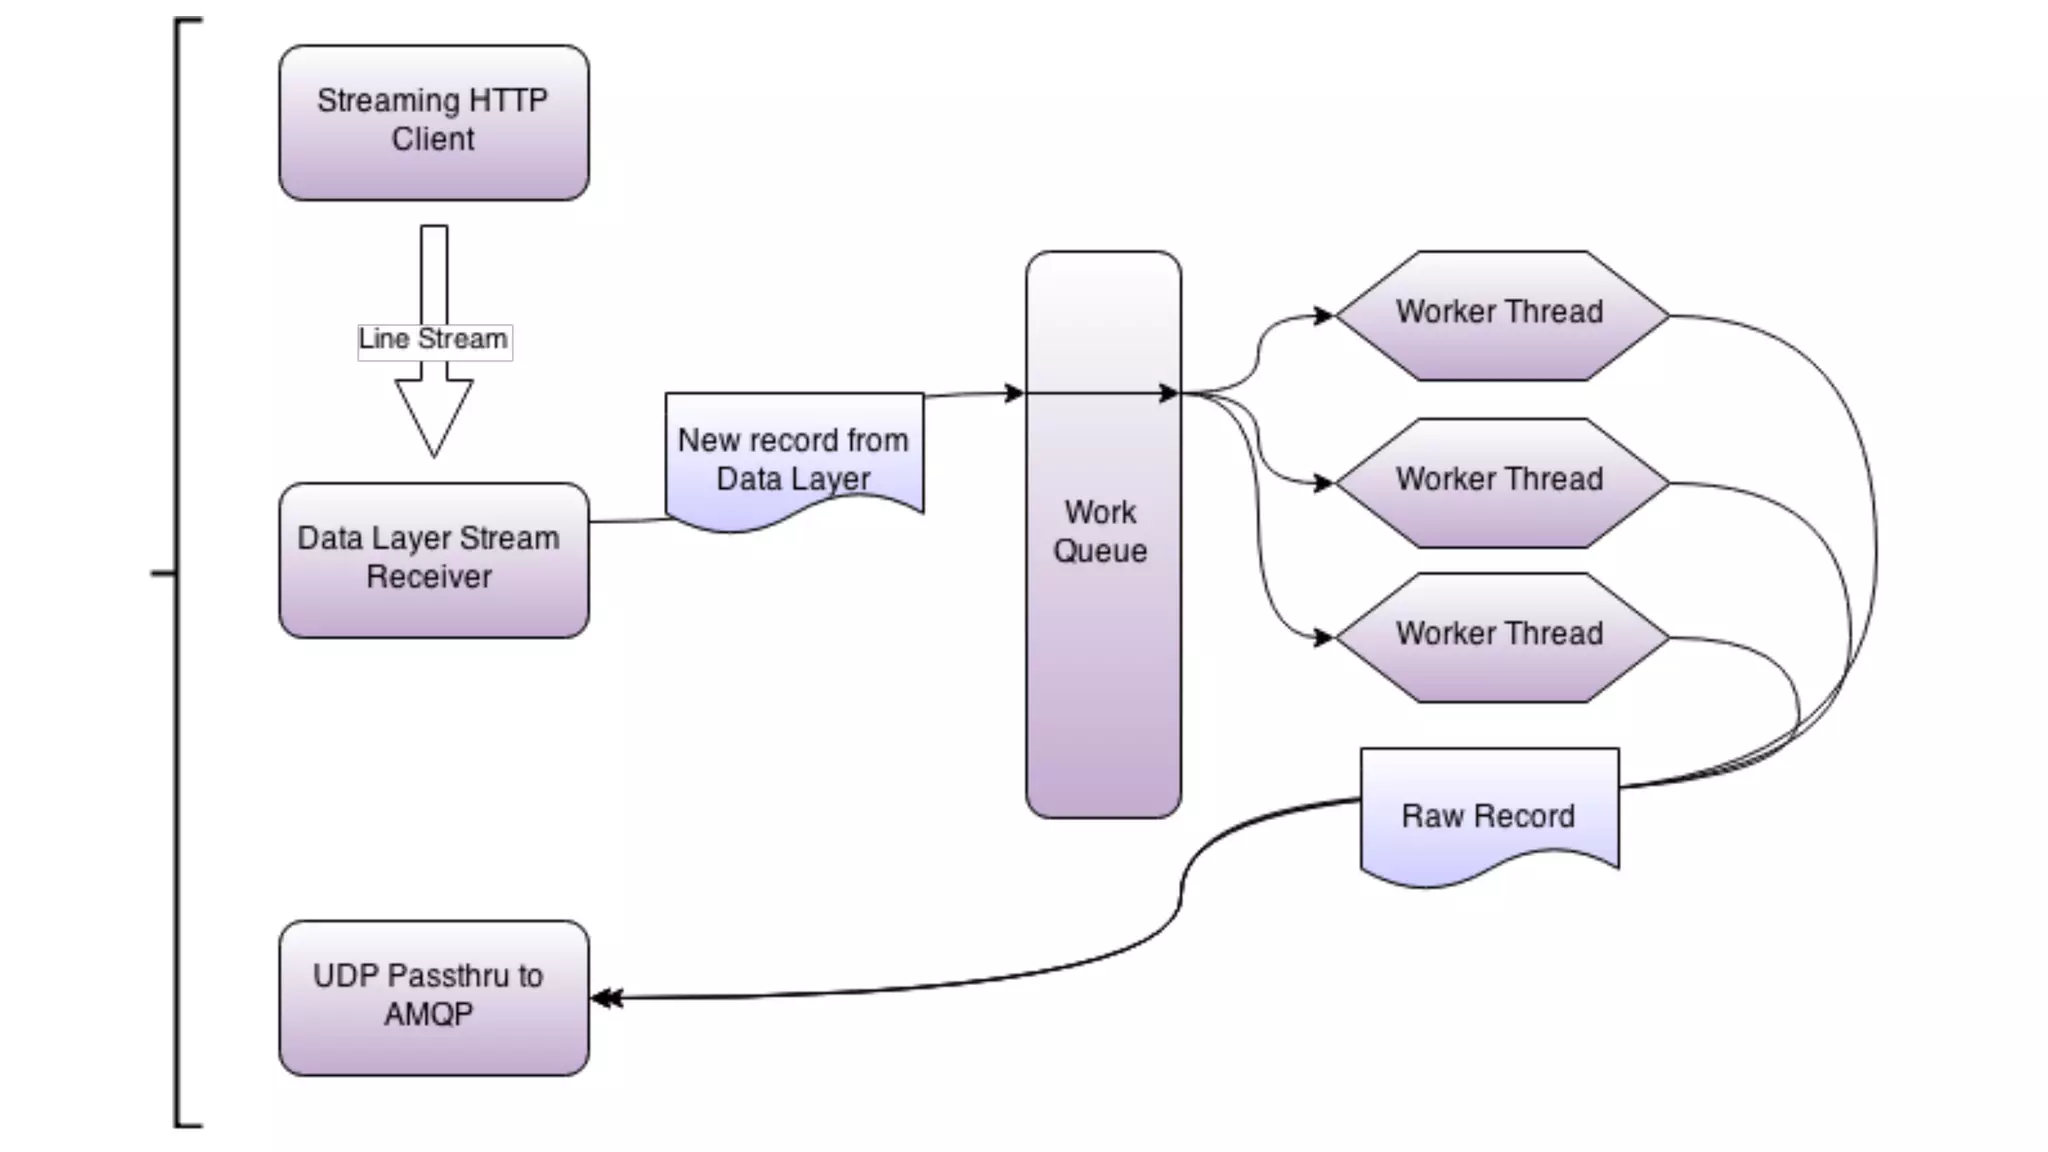
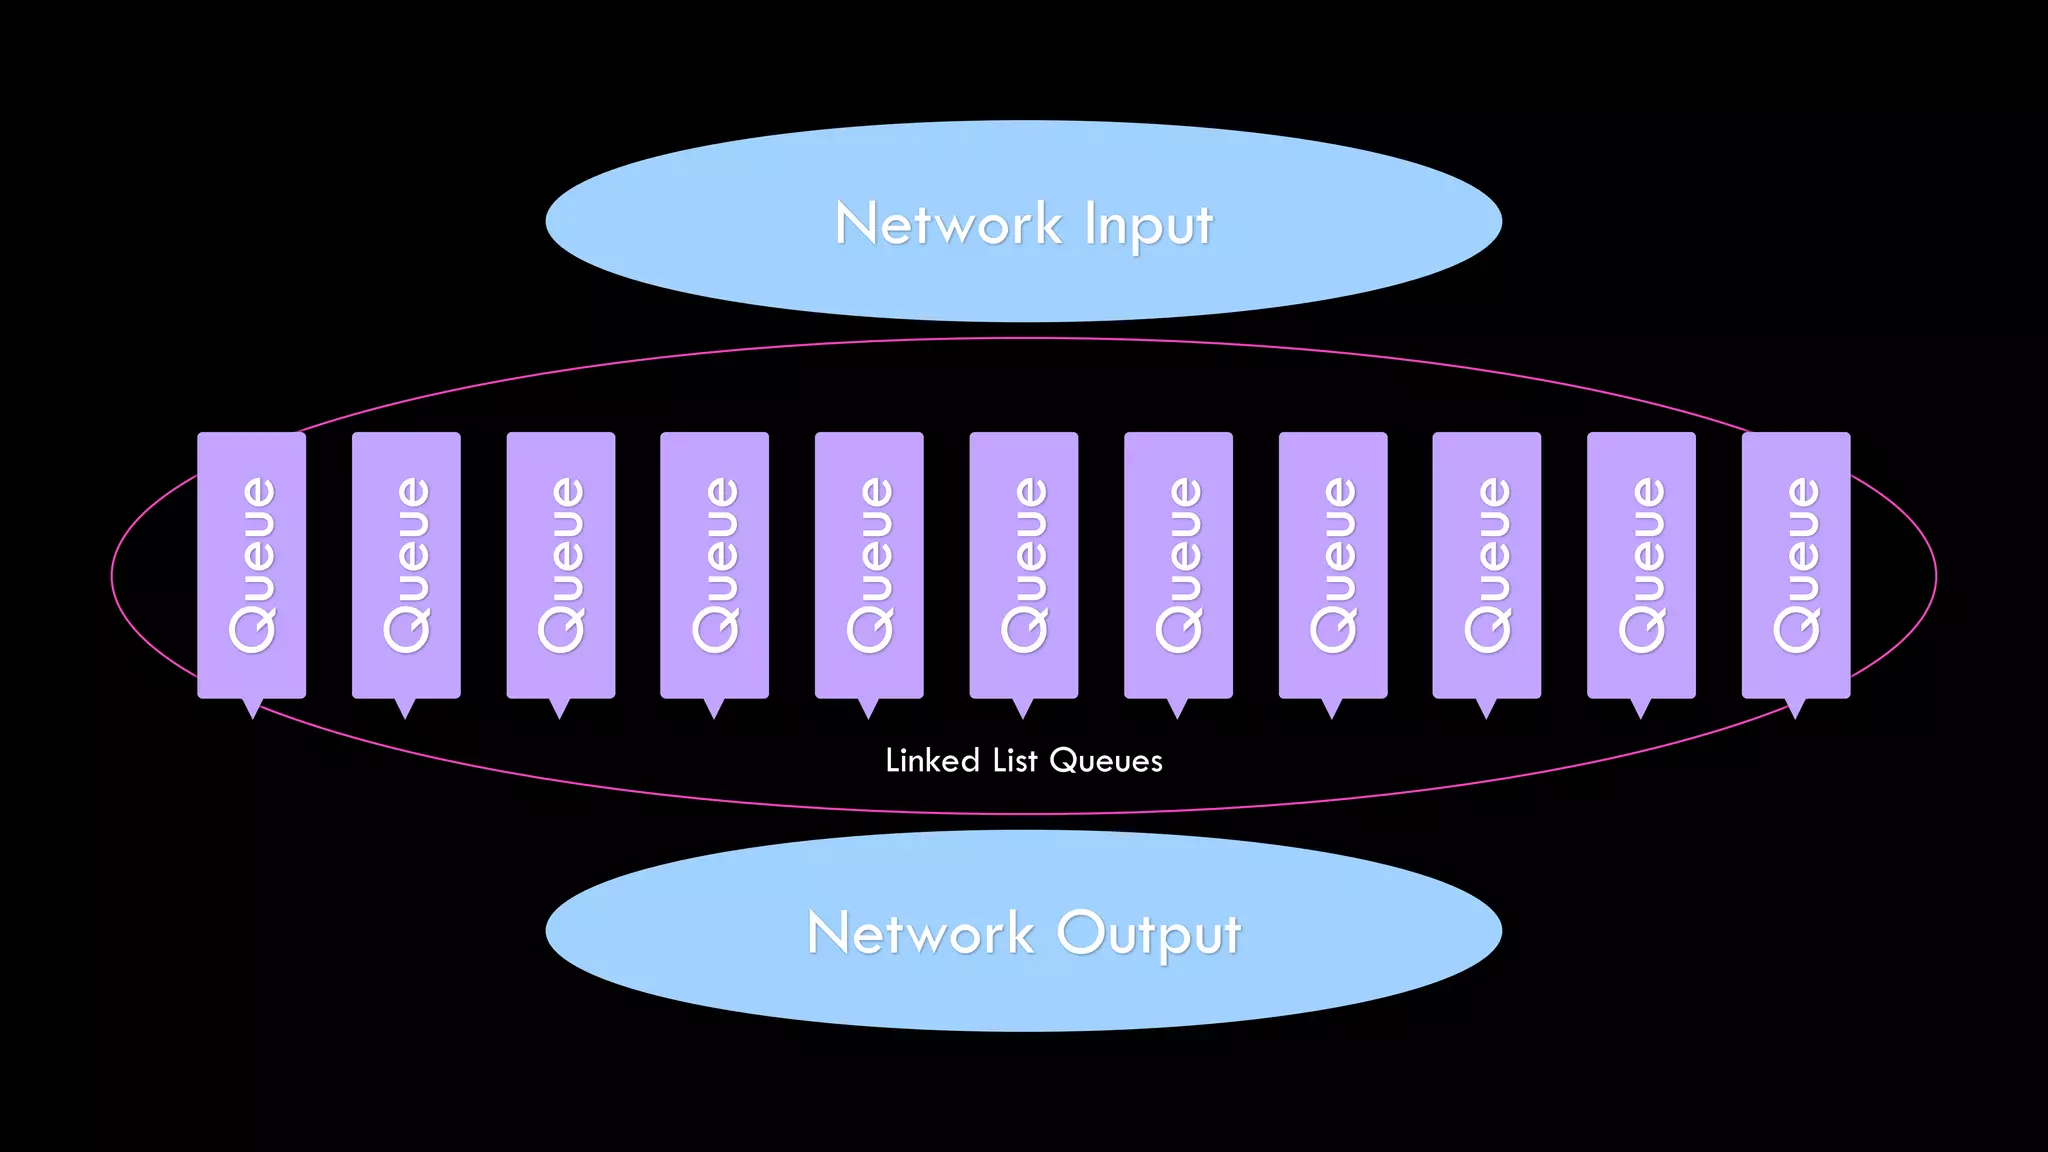
The document discusses the development of real-time data metrics and content performance testing, focusing on methods like multivariate testing and state monitoring to optimize user engagement. It explores the management of large datasets using technologies such as Hadoop and RabbitMQ, highlighting the challenges and solutions in data processing and visualization. Additionally, it outlines findings from various pipeline versions regarding throughput and performance improvements in handling real-time data streams.


![Coded Agents – with UiPath SDK + LangGraph [Virtual Hands-on Workshop]](https://cdn.slidesharecdn.com/ss_thumbnails/codedagentsdeck-251215155422-5497c599-thumbnail.jpg?width=640&height=640&fit=bounds)


