Drawing organization Charts in VIVO
•
1 like•1,568 views
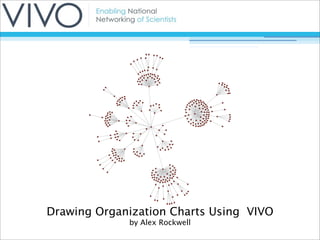
This document discusses using VIVO to automatically generate organizational charts from linked data. It describes how the program was designed to create charts for institutions using over 100 graphs created for the University of Florida. The initial charts uncovered data problems and generated interest. The program has evolved and can now find all sub-organizations of UF and will be extended to show relationships between people and their affiliations. An interactive demo is available online.
Report
Share
Report
Share
Download to read offline

Recommended
Internship Report At Wheels India Ltd
The document is a project report submitted by Pushkar Chaturvedi for his Master's degree that studies the growth prospects of the Indian auto component industry and the position of Wheels India Ltd within it. It includes an acknowledgement, declaration, abstract, table of contents, and initial chapters introducing the auto component industry in India and providing a company profile of Wheels India Ltd.
Segmentation targeting and positioning of hero moto corp
Hero MotoCorp is the largest motorcycle manufacturer in India. It targets multiple segments through a wide range of affordable bikes. Its positioning strategies include campaigns focused on mileage, emotional connections to India, and celebrity endorsements. Yamaha targets youth in tier 1 and 2 cities through high-performance sports bikes. It positions itself as a manufacturer of stylish and technologically advanced bikes through campaigns highlighting speed and extended services. Bajaj targets aspiring young men through affordable motorcycles that convey messages of masculinity, technology, and fuel efficiency.
Project Report-Final
This document is a project report that evaluates the effectiveness of training and development programs conducted by the FICCI Ladies' Organisation (FLO). The report contains an introduction that outlines the importance of training and development in improving employee performance. It then lists the objectives of the study, which are to evaluate the effectiveness of FLO's training programs and determine if they help improve participants' job skills and approaches. The methodology, results and conclusions of the study are then presented across various chapters with citations and annexures.
Wipro
Wipro is an Indian multinational IT consulting and system integration services company headquartered in Bangalore, India. It provides IT and consulting services to large enterprises around the world. Some key points:
- Founded in 1945 and headquartered in Bangalore, Wipro has over 140,000 employees serving 900+ clients in over 60 countries.
- It operates various business units including IT services, consumer care & lighting, infrastructure engineering, and a joint venture with GE Healthcare.
- Wipro has received numerous awards and recognition for its services, sustainability practices, and being among the top employers globally.
- It aims to become a top 10 global IT company and employer through innovation and quality
Knowledge Management in Ashok Leyland
Ashok Leyland is an Indian automobile manufacturing company and the second largest commercial vehicle manufacturer in India. It sells about 60,000 vehicles and 7,000 engines annually through its six manufacturing plants. Ashok Leyland is committed to quality assurance and received ISO 9001 certification in 1993 and ISO 14001 certification in 2001 for its manufacturing plants. These certifications help Ashok Leyland continually monitor and improve its operations, comply with environmental regulations, and increase customer satisfaction, making it the second largest commercial vehicle manufacturer in India.
Indus motor company – introduction
Indus Motor Company is a joint venture between Toyota Motor Corporation, Toyota Tsusho Corporation, and the House of Habib to produce and sell Toyota vehicles in Pakistan. The company's vision is to be the most respected and successful automotive company in Pakistan by delighting customers with a wide range of high-quality Toyota products. Indus Motor Company produces vehicles including the Toyota Corolla, Fortuner, Vigo Champ, and Hilux pickup truck.
PROJECT - TRAINING AND DEVELOPMENT
This document is a project report submitted by MD Mujaffar to Madurai Kamaraj University for a Master's degree in Business Administration. The report examines training and development practices at Bilt Graphic Paper Projects Limited. It includes an introduction on human resource management and training concepts, an acknowledgements section, and outlines of future chapters on the company profile, conceptual framework, data analysis, conclusions, and bibliography. The overall aim is to analyze Bilt Graphic's training programs and evaluate their effectiveness in developing employee skills and performance.
A questionnaire for training and development 3
This document contains a questionnaire for employees about an organization's training and development programs. The questionnaire asks employees their name, age, department, and contact information. It then asks a series of multiple choice questions about topics like whether training is considered part of the organization's strategy, preferred training methods, the effectiveness of induction training, how often training is conducted, and whether training helps improve various outcomes like employee motivation, productivity, and employee relations. The purpose is to gather employee feedback on the organization's current training programs.
WSO2 Internship Report
This report contains the training details and project details that I have done in the internship at WSO2
Project report on recruitment and selection at cmpdi
This document provides information about a project report on recruitment and selection at Central Mine Planning and Design Institute (CMPDI) in India. It includes a declaration, certificate of completion, acknowledgements, executive summary, and table of contents. The project report evaluates CMPDI's manpower planning process and recruitment and selection procedures. It contains the student's research findings, conclusions, and recommendations after studying CMPDI's practices from May to June 2014.
analysis of effective of training program
The document presents a report on the effectiveness of a training program conducted by Rekha Choudhary. It includes an executive summary, introduction, company information, research methodology, data analysis and interpretation, findings, and conclusion. A survey was conducted to analyze employee opinions on various aspects of the training program such as objectives, trainers, learning achievement, relevance, and methodology. The data was interpreted using tables and charts to identify areas of strength and improvement for future training programs.
Experience at WSO2 as an Intern
This document is a training report submitted by M.K.P.R. Jayawardhana detailing their internship at WSO2 Lanka (pvt) Ltd from February 28, 2011 to September 23, 2011. The report includes an introduction to WSO2 as the training establishment, an overview of their technical training experiences working on projects related to security and implementing SAML to XACML, and a conclusion reflecting on the overall training.
It provides background on WSO2's vision, business model, organizational structure, and products. The technical training section describes building a sample client, developing an entitlement handler, and implementing SAML single sign-on for authentication and authorization using XACML. Non-
Customer Satisfaction of Toyota
Toyota entered the Indian market in 1997 through a joint venture with Kirloskar Group. Toyota Kirloskar Motor Pvt Ltd (TKMPL) manufactures and sells Toyota vehicles in India. TKMPL aims to play a major role in developing the automotive industry and creating jobs. It has two manufacturing plants in Karnataka with a combined annual capacity of 150,000 vehicles. TKMPL plans to increase production capacity for its Etios series by 75% by early 2013. Its vision is to be the most respected and successful automotive company through delighting customers with a wide range of products.
Toyota motor corporation
1. The group presented on the strategic management of Toyota Motor Corporation. They analyzed Toyota's strategic purpose, external factors, Porter's 5 forces, threshold and distinctive capabilities, and value chain.
2. The presentation identified Toyota's vision, mission, goals, and objectives as its strategic purpose. An analysis of PESTLE factors and Porter's 5 forces model examined the external environment and industry competition.
3. Toyota's threshold capabilities include talent management and an efficient distribution system. Its distinctive capabilities are its trusted brand, relationship with suppliers, and ability to produce affordable automobiles with different features.
4. The value chain analysis showed how Toyota's primary and support activities work together to create value for customers throughout inbound logistics
Force motors Report presentation
1) The study analyzed consumer perceptions of Force Motors' Gurkha vehicle. It conducted surveys of 30 consumers and analyzed the data using SPSS and Excel.
2) It found that customers over 35 buying for business purposes were most interested. Hard top 4WD models were the most popular.
3) The study suggested targeting business customers over 35, focusing on the most popular black and red colors, and addressing issues around BS IV emissions standards.
Project on automobile sector in india
Analysis of automobile sector in india special reference on tata motors maruti suzuki and mahindra and mahindra
Projec report on training and development project from reliance money
The document provides an overview of training and development at Reliance Money. It discusses traditional and modern approaches to training, defining training as a learning process to enhance employee performance. The scope of the study is on training practices and modules at Reliance Money to judge knowledge enhancement and feedback effectiveness. The objectives are to examine the impact of training on skill development, changes in behavior and output.
Final internship report chanda
The document provides an internship report on the analysis of the recruitment process at Lafarge Surma Cement Ltd. It includes an acknowledgement section thanking various mentors and supervisors. It also includes an executive summary outlining the importance of HR to an organization's success and analyzing LSC's recruitment process. The report then discusses LSC's history, vision, products, management team and HR team to provide context around the organization and recruitment practices.
Summer Internship Report - Marico Kaya Enterprises Ltd
Internship in Marico Kaya Enterprises Ltd during my MBA in Marketing Communications. Project : Retail Marketing, Visual Merchandising and Online Affiliation of Kaya Skin Clinics.
Training report_orginal
The document provides details about Loadstar (Pvt) Ltd, including:
- Loadstar manufactures solid and pneumatic tires, wheels, and tracks under the Solideal brand.
- The maintenance division has an organizational structure with managers overseeing various technical areas.
- Loadstar's vision is to be a premier manufacturer of mobility systems, and their mission is to manufacture quality tires through empowered teams.
- The company utilizes various management approaches like 5S, lean manufacturing, and human resource functions such as recruitment, training, and welfare. Safety and continuous improvement are also priorities.
Industrial Training Experience
This presentation was prepared to present on behalf of judges of IESL to achieve IESL Industrial Training Award 2020.
Here I included a summary of activities and project experience which performed during the training period.
Honda Company Analysis Report
The document contains a detailed analysis of Company Honda. It explains the products, marketing strategy, demand forecasting, SWOT analysis and growth and future prospectus of the company.
Jeena organiations study at keralakaumathi
This document provides an organizational study of Kerala Kaumudi (P) Ltd, a leading Malayalam newspaper in Kerala, India. It was established in 1911 and has expanded to have multiple editions across Kerala and in Bangalore. The study outlines the company's introduction, scope, objectives, limitations, industry profile, company profile, vision, products, organizational structure, departmental analysis, and SWOT analysis. Key findings include the need for improved marketing strategies, research capabilities, and modernization of departments. Suggestions include implementing total quality management, new subscription plans, improving internal communication, and ensuring marketing has sufficient resources. The conclusion discusses the changing media landscape and Kerala Kaumudi's continued innovation to engage readers.
TVS PPT Amudha
The document provides an organizational study of TVS Sundram Iyengar & Sons Private Limited. It includes an introduction to the TVS Group and the purpose of the study. It then describes various departments within the company like human resources, finance, sales, production, IT, and administration. Each department section outlines the functions and processes. The document also discusses industry trends, company overview, vision, milestones and awards. In summary, it provides an in-depth look at the organizational structure and operations of TVS Sundram Iyengar & Sons Private Limited.
A project report on consumer satisfaction level of bajaj bike project report
This document provides an executive summary and introduction to a study about customer satisfaction with Bajaj PLATINA bikes in Ilkal town. The summary includes:
1) An overview of the objectives, scope, methodology and findings of the customer satisfaction study, which was conducted through a survey of 100 customers.
2) Background information on Bajaj Auto, the largest manufacturer of 2 and 3-wheelers in India, and its dominant shares of various vehicle segments.
3) Details about the industrial profile of 2-wheeler manufacturers in India and characteristics of the market.
TVS Automobiles
TVS Motor Company is the 4th largest two-wheeler manufacturer in India with over 40,000 employees and 15 million customers. It was founded in 1911 by Trichur Vengaram Sundaram Iyengar and manufactures motorcycles, bikes, scooters, mopeds and autorickshaws. The company's mission is to be a highly profitable and leading manufacturer of high-value, environmentally friendly personal transportation products for Asian markets. Its vision is to be responsive to customer requirements with a focus on profitability and total customer satisfaction.
Internship report (e commerce industries in bangladesh and their services a s...
This Internship Report titled “E-Commerce Industries in Bangladesh and Their Services: A Study on Shohoj Limited.” has been submitted, to BRAC Business School, for partial
fulfillment of the requirements for the degree of Bachelor of Business Administration.
Alamw15 VIVO
VIVO is an open-source semantic web application and information model that enables discovery of research across disciplines at institutions. It harvests data from verified sources to create detailed profiles of faculty and researchers. The structured linked data in VIVO allows for relationships and connections between researchers, publications, grants, and more to be visualized. Libraries can play important roles in implementing and supporting VIVO through activities like outreach, training, ontology development, and technical support.
Etech slideshare
This document discusses online platforms and applications for ICT development. It defines online platforms as technologies that serve as a base for other applications, processes, or technologies. Examples of online platforms mentioned include presentation tools, cloud computing, social media, web page creators, file management systems, and mapping tools. Specific applications are provided within each category, such as Prezi, Google Drive, Twitter, Wix, and Google Maps.
More Related Content
What's hot
WSO2 Internship Report
This report contains the training details and project details that I have done in the internship at WSO2
Project report on recruitment and selection at cmpdi
This document provides information about a project report on recruitment and selection at Central Mine Planning and Design Institute (CMPDI) in India. It includes a declaration, certificate of completion, acknowledgements, executive summary, and table of contents. The project report evaluates CMPDI's manpower planning process and recruitment and selection procedures. It contains the student's research findings, conclusions, and recommendations after studying CMPDI's practices from May to June 2014.
analysis of effective of training program
The document presents a report on the effectiveness of a training program conducted by Rekha Choudhary. It includes an executive summary, introduction, company information, research methodology, data analysis and interpretation, findings, and conclusion. A survey was conducted to analyze employee opinions on various aspects of the training program such as objectives, trainers, learning achievement, relevance, and methodology. The data was interpreted using tables and charts to identify areas of strength and improvement for future training programs.
Experience at WSO2 as an Intern
This document is a training report submitted by M.K.P.R. Jayawardhana detailing their internship at WSO2 Lanka (pvt) Ltd from February 28, 2011 to September 23, 2011. The report includes an introduction to WSO2 as the training establishment, an overview of their technical training experiences working on projects related to security and implementing SAML to XACML, and a conclusion reflecting on the overall training.
It provides background on WSO2's vision, business model, organizational structure, and products. The technical training section describes building a sample client, developing an entitlement handler, and implementing SAML single sign-on for authentication and authorization using XACML. Non-
Customer Satisfaction of Toyota
Toyota entered the Indian market in 1997 through a joint venture with Kirloskar Group. Toyota Kirloskar Motor Pvt Ltd (TKMPL) manufactures and sells Toyota vehicles in India. TKMPL aims to play a major role in developing the automotive industry and creating jobs. It has two manufacturing plants in Karnataka with a combined annual capacity of 150,000 vehicles. TKMPL plans to increase production capacity for its Etios series by 75% by early 2013. Its vision is to be the most respected and successful automotive company through delighting customers with a wide range of products.
Toyota motor corporation
1. The group presented on the strategic management of Toyota Motor Corporation. They analyzed Toyota's strategic purpose, external factors, Porter's 5 forces, threshold and distinctive capabilities, and value chain.
2. The presentation identified Toyota's vision, mission, goals, and objectives as its strategic purpose. An analysis of PESTLE factors and Porter's 5 forces model examined the external environment and industry competition.
3. Toyota's threshold capabilities include talent management and an efficient distribution system. Its distinctive capabilities are its trusted brand, relationship with suppliers, and ability to produce affordable automobiles with different features.
4. The value chain analysis showed how Toyota's primary and support activities work together to create value for customers throughout inbound logistics
Force motors Report presentation
1) The study analyzed consumer perceptions of Force Motors' Gurkha vehicle. It conducted surveys of 30 consumers and analyzed the data using SPSS and Excel.
2) It found that customers over 35 buying for business purposes were most interested. Hard top 4WD models were the most popular.
3) The study suggested targeting business customers over 35, focusing on the most popular black and red colors, and addressing issues around BS IV emissions standards.
Project on automobile sector in india
Analysis of automobile sector in india special reference on tata motors maruti suzuki and mahindra and mahindra
Projec report on training and development project from reliance money
The document provides an overview of training and development at Reliance Money. It discusses traditional and modern approaches to training, defining training as a learning process to enhance employee performance. The scope of the study is on training practices and modules at Reliance Money to judge knowledge enhancement and feedback effectiveness. The objectives are to examine the impact of training on skill development, changes in behavior and output.
Final internship report chanda
The document provides an internship report on the analysis of the recruitment process at Lafarge Surma Cement Ltd. It includes an acknowledgement section thanking various mentors and supervisors. It also includes an executive summary outlining the importance of HR to an organization's success and analyzing LSC's recruitment process. The report then discusses LSC's history, vision, products, management team and HR team to provide context around the organization and recruitment practices.
Summer Internship Report - Marico Kaya Enterprises Ltd
Internship in Marico Kaya Enterprises Ltd during my MBA in Marketing Communications. Project : Retail Marketing, Visual Merchandising and Online Affiliation of Kaya Skin Clinics.
Training report_orginal
The document provides details about Loadstar (Pvt) Ltd, including:
- Loadstar manufactures solid and pneumatic tires, wheels, and tracks under the Solideal brand.
- The maintenance division has an organizational structure with managers overseeing various technical areas.
- Loadstar's vision is to be a premier manufacturer of mobility systems, and their mission is to manufacture quality tires through empowered teams.
- The company utilizes various management approaches like 5S, lean manufacturing, and human resource functions such as recruitment, training, and welfare. Safety and continuous improvement are also priorities.
Industrial Training Experience
This presentation was prepared to present on behalf of judges of IESL to achieve IESL Industrial Training Award 2020.
Here I included a summary of activities and project experience which performed during the training period.
Honda Company Analysis Report
The document contains a detailed analysis of Company Honda. It explains the products, marketing strategy, demand forecasting, SWOT analysis and growth and future prospectus of the company.
Jeena organiations study at keralakaumathi
This document provides an organizational study of Kerala Kaumudi (P) Ltd, a leading Malayalam newspaper in Kerala, India. It was established in 1911 and has expanded to have multiple editions across Kerala and in Bangalore. The study outlines the company's introduction, scope, objectives, limitations, industry profile, company profile, vision, products, organizational structure, departmental analysis, and SWOT analysis. Key findings include the need for improved marketing strategies, research capabilities, and modernization of departments. Suggestions include implementing total quality management, new subscription plans, improving internal communication, and ensuring marketing has sufficient resources. The conclusion discusses the changing media landscape and Kerala Kaumudi's continued innovation to engage readers.
TVS PPT Amudha
The document provides an organizational study of TVS Sundram Iyengar & Sons Private Limited. It includes an introduction to the TVS Group and the purpose of the study. It then describes various departments within the company like human resources, finance, sales, production, IT, and administration. Each department section outlines the functions and processes. The document also discusses industry trends, company overview, vision, milestones and awards. In summary, it provides an in-depth look at the organizational structure and operations of TVS Sundram Iyengar & Sons Private Limited.
A project report on consumer satisfaction level of bajaj bike project report
This document provides an executive summary and introduction to a study about customer satisfaction with Bajaj PLATINA bikes in Ilkal town. The summary includes:
1) An overview of the objectives, scope, methodology and findings of the customer satisfaction study, which was conducted through a survey of 100 customers.
2) Background information on Bajaj Auto, the largest manufacturer of 2 and 3-wheelers in India, and its dominant shares of various vehicle segments.
3) Details about the industrial profile of 2-wheeler manufacturers in India and characteristics of the market.
TVS Automobiles
TVS Motor Company is the 4th largest two-wheeler manufacturer in India with over 40,000 employees and 15 million customers. It was founded in 1911 by Trichur Vengaram Sundaram Iyengar and manufactures motorcycles, bikes, scooters, mopeds and autorickshaws. The company's mission is to be a highly profitable and leading manufacturer of high-value, environmentally friendly personal transportation products for Asian markets. Its vision is to be responsive to customer requirements with a focus on profitability and total customer satisfaction.
Internship report (e commerce industries in bangladesh and their services a s...
This Internship Report titled “E-Commerce Industries in Bangladesh and Their Services: A Study on Shohoj Limited.” has been submitted, to BRAC Business School, for partial
fulfillment of the requirements for the degree of Bachelor of Business Administration.
What's hot (20)
Project report on recruitment and selection at cmpdi
Project report on recruitment and selection at cmpdi
Projec report on training and development project from reliance money
Projec report on training and development project from reliance money
Summer Internship Report - Marico Kaya Enterprises Ltd
Summer Internship Report - Marico Kaya Enterprises Ltd
A project report on consumer satisfaction level of bajaj bike project report
A project report on consumer satisfaction level of bajaj bike project report
Internship report (e commerce industries in bangladesh and their services a s...
Internship report (e commerce industries in bangladesh and their services a s...
Similar to Drawing organization Charts in VIVO
Alamw15 VIVO
VIVO is an open-source semantic web application and information model that enables discovery of research across disciplines at institutions. It harvests data from verified sources to create detailed profiles of faculty and researchers. The structured linked data in VIVO allows for relationships and connections between researchers, publications, grants, and more to be visualized. Libraries can play important roles in implementing and supporting VIVO through activities like outreach, training, ontology development, and technical support.
Etech slideshare
This document discusses online platforms and applications for ICT development. It defines online platforms as technologies that serve as a base for other applications, processes, or technologies. Examples of online platforms mentioned include presentation tools, cloud computing, social media, web page creators, file management systems, and mapping tools. Specific applications are provided within each category, such as Prezi, Google Drive, Twitter, Wix, and Google Maps.
Social Media for HR masterclass to Philips India HR Team
The document discusses social media for HR purposes. It defines social media and describes various social media channels like blogs, videos, photos, social networks and more. It explores how social media is changing how content is created and shared, shifting from authority to user generated content. It also provides examples of how companies can use social media for recruiting, onboarding, employee engagement, learning and development, and more.
OACUHO2014 Technological Tools with Diverse Application
This presentation will focus on exposing participants to less known technological applications. The presenter will share several applications and the ways in which they have used them in the past or can be used for day-to-day tasks as well as larger residence life processes. With a little creativity the following tools can be applied to professional productivity, staff management, community building, assessment and larger system wide practices.
This was a presentation at OACUHO conference 2014.
Virtual organisations
A virtual organization is a temporary network of independent organizations that use technology to coordinate work to achieve a common goal. It has no physical presence and relies on electronic communication. Key features include small partners, extensive IT use, shared ownership, flexibility, and geographically dispersed members. Successful virtual organizations require clear communication, performance standards, coordination between members, and support mechanisms for remote work.
Strategy for Social Intranet Success
Responsive web design, navigation, and what's happening on the internet all play into the battle behind what to do. In this session we look at what really makes sense to reflect company culture. We look at many examples of Intranets shared on the web including public notes from Norman Nielsen Intranets report.
Know your business. Know your business requirements. Know your users. And then introduce a new social fabric that up-levels your workforce inside and outside the firewall, cross device, cross platform. This session will focus on the strategy behind moving your entire organization from an informed user base into a daily-engaged, active community. Lines of communication can go top down, bottom up, and it all happens wherever, whenever
Etech ict presentation
This document discusses online platforms and applications for ICT development. It defines online platforms as technologies grouped to be used as a base for other applications, processes, or technologies. Examples of online platforms mentioned include presentation/visualization tools like Prezi, cloud computing services like Google Drive, social media sites like Twitter and Facebook, web page creators like Wix, file management apps like ZamZar, and mapping services like Google Maps.
Social hr for ril
Social media is transforming how companies engage with employees and candidates. It allows constant connection through platforms like LinkedIn, Facebook and Twitter. Companies are using social media for recruiting, onboarding, learning and development, and internal engagement. This allows sharing of knowledge, recognition of top performers, and creating a sense of community. HR must help organizations embrace these new tools and ways of working to engage talent in the digital age.
Etech ppt
This document discusses online platforms and applications that can be used for information and communication technology (ICT) development. It provides examples of different types of online platforms, including presentation tools, cloud computing services, social media sites, web page creators, file management applications, and mapping services. Some highlighted examples include Prezi, Google Drive, Twitter, Facebook, Wix, Google Maps, and others. The document aims to outline various online tools and platforms that can help create good online content and aid in ICT development.
Etech pres 2
This document discusses online platforms and applications for ICT development. It defines online platforms as technologies grouped to be used as a base for other applications, processes, or technologies. Examples of online platforms include presentation/visualization tools like Prezi, SlideShare, and MindMeister; cloud computing services like Google Drive and Dropbox; social media sites like Twitter, Facebook, Tumblr, and LinkedIn; web page creation tools like Wix and Weebly; file management applications like Zamzar and Word2PDF; and mapping services like Google Maps.
Online platform for ict development 4
The document discusses various online platforms and applications that can be used for ICT development. It defines online platforms as technologies that serve as a base for building other applications, processes, or technologies. Some examples of online platforms mentioned include presentation tools, cloud computing services, social media sites, web page creators, file management systems, and mapping services. Specific applications discussed under each category include Prezi, Zoho, SlideShare, and MindMeister for presentations; Google Drive and Dropbox for cloud computing; Twitter, Facebook, Tumblr, and LinkedIn for social media; Wix and Weebly for web page creation; Zamzar and Word2PDF for file management; and Google Maps for mapping.
Research Week 2014: Conference Planning: Processes, Funding, Resources
The document provides information about planning conferences and events, including funding and resources. It discusses SSHRC Connection Grants that provide $7,000-$25,000 for events and up to $50,000 for outreach activities. Applicants must have 50% matching funds and can get assistance from departments and faculties. Communications, Public Affairs and Marketing (CPAM) at Laurier offers various services to promote events through media outreach and publications.
Athabasca University e-Lab Launch November 2, 2012
Launch Presentation from the Athabasca University e-Lab. Learn more about the e-Lab at http://elab.athabascau.ca
Online platform for ict development
This document discusses various online platforms for developing ICT content. It defines online platforms as technologies that serve as a base for building other applications and processes. The document provides examples of different types of online platforms, including presentation tools, cloud computing services, social media sites, web page creators, file management applications, and mapping services. Specific platforms discussed include Prezi, Zoho, SlideShare, MindMeister, Google Drive, Dropbox, Twitter, Facebook, Tumblr, LinkedIn, Wix, Weebly, Zamzar, Word2PDF, and Google Maps.
Online Platforms for ICT Content Development
This presentation is all about the nature and purpose of online platforms and application, what is online platform, examples of online platform.
Etech activity
Online platforms can be used to create and develop ICT content. Some examples of online platforms include presentation tools like Prezi, cloud computing services like Google Drive, social media sites like Facebook and Twitter, webpage builders like Wix and Weebly, and file management tools like Dropbox. Online platforms provide bases to develop other applications and technologies and help users communicate information clearly.
Startupfest 2016: NOAH ILIINSKY (Amazon Web Services) - How to
How To design effective visualizations (and other communications) -
This talk discusses the broad design considerations necessary for effective visualizations (as well as other types of communication). Attendees will learn what’s required for a visualization to be successful, gain insight for critically evaluating visualizations they encounter, and come away with new ways to think about the visualization design process.
Social Media Tools for Scientists and Building an Online Profile
Social Media Tools for Scientists and Building an Online ProfileUS Environmental Protection Agency (EPA), Center for Computational Toxicology and Exposure
Despite the availability of many platforms for scientists to connect and share with their peers in the scientific community the majority do not make use of these tools, despite their promise and potential impact and influence on our careers. We are already being indexed and exposed on the internet via our publications, presentations and data and new “AltMetric scores” are being assigned to scientific publications as measures of popularity and, supposedly, of impact. We now have even more ways to contribute to science, to annotate and curate data, to “publish” in new ways, and many of these activities are as part of a growing crowdsourcing network. This presentation provides an overview of the various types of networking and collaborative sites available to scientists and ways to expose your scientific activities online. It will discuss the new world of AltMetrics that is in an explosive growth curve and will help you understand how to influence and leverage some of these new measures. Participating online, whether it be simply for career advancement or for wider exposure of your research, there are now a series of web applications that can provide a great opportunity to develop a scientific profile within the community.Online platform for ict development 2]
This document discusses various online platforms and applications for ICT development. It defines an online platform as technologies grouped to be used as a base for developing other applications, processes, or technologies. Examples of platforms discussed include presentation/visualization tools like Prezi, SlideShare, and MindMeister; cloud computing services like Google Drive and Dropbox; social media sites like Twitter, Facebook, Tumblr, and LinkedIn; web page creators like Wix and Weebly; file management tools like Zamzar and Word2PDF; and mapping services like Google Maps.
Driving Employee Engagement Through A Social Intranet - Federal Communicators...
Driving Employee Engagement Through A Social Intranet - Federal Communicators...Federal Communicators Network
Slides from Kelly Osborn at the U.S. government's National Archives, from an event January 16, 2014, Driving Employee Engagement Through A Social Intranet.Similar to Drawing organization Charts in VIVO (20)
Social Media for HR masterclass to Philips India HR Team
Social Media for HR masterclass to Philips India HR Team
OACUHO2014 Technological Tools with Diverse Application
OACUHO2014 Technological Tools with Diverse Application
Research Week 2014: Conference Planning: Processes, Funding, Resources
Research Week 2014: Conference Planning: Processes, Funding, Resources
Athabasca University e-Lab Launch November 2, 2012
Athabasca University e-Lab Launch November 2, 2012
Startupfest 2016: NOAH ILIINSKY (Amazon Web Services) - How to
Startupfest 2016: NOAH ILIINSKY (Amazon Web Services) - How to
Social Media Tools for Scientists and Building an Online Profile
Social Media Tools for Scientists and Building an Online Profile
Driving Employee Engagement Through A Social Intranet - Federal Communicators...
Driving Employee Engagement Through A Social Intranet - Federal Communicators...
Recently uploaded
GNSS spoofing via SDR (Criptored Talks 2024)
In the realm of cybersecurity, offensive security practices act as a critical shield. By simulating real-world attacks in a controlled environment, these techniques expose vulnerabilities before malicious actors can exploit them. This proactive approach allows manufacturers to identify and fix weaknesses, significantly enhancing system security.
This presentation delves into the development of a system designed to mimic Galileo's Open Service signal using software-defined radio (SDR) technology. We'll begin with a foundational overview of both Global Navigation Satellite Systems (GNSS) and the intricacies of digital signal processing.
The presentation culminates in a live demonstration. We'll showcase the manipulation of Galileo's Open Service pilot signal, simulating an attack on various software and hardware systems. This practical demonstration serves to highlight the potential consequences of unaddressed vulnerabilities, emphasizing the importance of offensive security practices in safeguarding critical infrastructure.
Mutation Testing for Task-Oriented Chatbots
Conversational agents, or chatbots, are increasingly used to access all sorts of services using natural language. While open-domain chatbots - like ChatGPT - can converse on any topic, task-oriented chatbots - the focus of this paper - are designed for specific tasks, like booking a flight, obtaining customer support, or setting an appointment. Like any other software, task-oriented chatbots need to be properly tested, usually by defining and executing test scenarios (i.e., sequences of user-chatbot interactions). However, there is currently a lack of methods to quantify the completeness and strength of such test scenarios, which can lead to low-quality tests, and hence to buggy chatbots.
To fill this gap, we propose adapting mutation testing (MuT) for task-oriented chatbots. To this end, we introduce a set of mutation operators that emulate faults in chatbot designs, an architecture that enables MuT on chatbots built using heterogeneous technologies, and a practical realisation as an Eclipse plugin. Moreover, we evaluate the applicability, effectiveness and efficiency of our approach on open-source chatbots, with promising results.
Northern Engraving | Nameplate Manufacturing Process - 2024
Manufacturing custom quality metal nameplates and badges involves several standard operations. Processes include sheet prep, lithography, screening, coating, punch press and inspection. All decoration is completed in the flat sheet with adhesive and tooling operations following. The possibilities for creating unique durable nameplates are endless. How will you create your brand identity? We can help!
Main news related to the CCS TSI 2023 (2023/1695)
An English 🇬🇧 translation of a presentation to the speech I gave about the main changes brought by CCS TSI 2023 at the biggest Czech conference on Communications and signalling systems on Railways, which was held in Clarion Hotel Olomouc from 7th to 9th November 2023 (konferenceszt.cz). Attended by around 500 participants and 200 on-line followers.
The original Czech 🇨🇿 version of the presentation can be found here: https://www.slideshare.net/slideshow/hlavni-novinky-souvisejici-s-ccs-tsi-2023-2023-1695/269688092 .
The videorecording (in Czech) from the presentation is available here: https://youtu.be/WzjJWm4IyPk?si=SImb06tuXGb30BEH .
JavaLand 2024: Application Development Green Masterplan
My presentation slides I used at JavaLand 2024
Dandelion Hashtable: beyond billion requests per second on a commodity server
This slide deck presents DLHT, a concurrent in-memory hashtable. Despite efforts to optimize hashtables, that go as far as sacrificing core functionality, state-of-the-art designs still incur multiple memory accesses per request and block request processing in three cases. First, most hashtables block while waiting for data to be retrieved from memory. Second, open-addressing designs, which represent the current state-of-the-art, either cannot free index slots on deletes or must block all requests to do so. Third, index resizes block every request until all objects are copied to the new index. Defying folklore wisdom, DLHT forgoes open-addressing and adopts a fully-featured and memory-aware closed-addressing design based on bounded cache-line-chaining. This design offers lock-free index operations and deletes that free slots instantly, (2) completes most requests with a single memory access, (3) utilizes software prefetching to hide memory latencies, and (4) employs a novel non-blocking and parallel resizing. In a commodity server and a memory-resident workload, DLHT surpasses 1.6B requests per second and provides 3.5x (12x) the throughput of the state-of-the-art closed-addressing (open-addressing) resizable hashtable on Gets (Deletes).
Choosing The Best AWS Service For Your Website + API.pptx
Have you ever been confused by the myriad of choices offered by AWS for hosting a website or an API?
Lambda, Elastic Beanstalk, Lightsail, Amplify, S3 (and more!) can each host websites + APIs. But which one should we choose?
Which one is cheapest? Which one is fastest? Which one will scale to meet our needs?
Join me in this session as we dive into each AWS hosting service to determine which one is best for your scenario and explain why!
HCL Notes and Domino License Cost Reduction in the World of DLAU
Webinar Recording: https://www.panagenda.com/webinars/hcl-notes-and-domino-license-cost-reduction-in-the-world-of-dlau/
The introduction of DLAU and the CCB & CCX licensing model caused quite a stir in the HCL community. As a Notes and Domino customer, you may have faced challenges with unexpected user counts and license costs. You probably have questions on how this new licensing approach works and how to benefit from it. Most importantly, you likely have budget constraints and want to save money where possible. Don’t worry, we can help with all of this!
We’ll show you how to fix common misconfigurations that cause higher-than-expected user counts, and how to identify accounts which you can deactivate to save money. There are also frequent patterns that can cause unnecessary cost, like using a person document instead of a mail-in for shared mailboxes. We’ll provide examples and solutions for those as well. And naturally we’ll explain the new licensing model.
Join HCL Ambassador Marc Thomas in this webinar with a special guest appearance from Franz Walder. It will give you the tools and know-how to stay on top of what is going on with Domino licensing. You will be able lower your cost through an optimized configuration and keep it low going forward.
These topics will be covered
- Reducing license cost by finding and fixing misconfigurations and superfluous accounts
- How do CCB and CCX licenses really work?
- Understanding the DLAU tool and how to best utilize it
- Tips for common problem areas, like team mailboxes, functional/test users, etc
- Practical examples and best practices to implement right away
“How Axelera AI Uses Digital Compute-in-memory to Deliver Fast and Energy-eff...
“How Axelera AI Uses Digital Compute-in-memory to Deliver Fast and Energy-eff...Edge AI and Vision Alliance
For the full video of this presentation, please visit: https://www.edge-ai-vision.com/2024/06/how-axelera-ai-uses-digital-compute-in-memory-to-deliver-fast-and-energy-efficient-computer-vision-a-presentation-from-axelera-ai/
Bram Verhoef, Head of Machine Learning at Axelera AI, presents the “How Axelera AI Uses Digital Compute-in-memory to Deliver Fast and Energy-efficient Computer Vision” tutorial at the May 2024 Embedded Vision Summit.
As artificial intelligence inference transitions from cloud environments to edge locations, computer vision applications achieve heightened responsiveness, reliability and privacy. This migration, however, introduces the challenge of operating within the stringent confines of resource constraints typical at the edge, including small form factors, low energy budgets and diminished memory and computational capacities. Axelera AI addresses these challenges through an innovative approach of performing digital computations within memory itself. This technique facilitates the realization of high-performance, energy-efficient and cost-effective computer vision capabilities at the thin and thick edge, extending the frontier of what is achievable with current technologies.
In this presentation, Verhoef unveils his company’s pioneering chip technology and demonstrates its capacity to deliver exceptional frames-per-second performance across a range of standard computer vision networks typical of applications in security, surveillance and the industrial sector. This shows that advanced computer vision can be accessible and efficient, even at the very edge of our technological ecosystem.Driving Business Innovation: Latest Generative AI Advancements & Success Story
Are you ready to revolutionize how you handle data? Join us for a webinar where we’ll bring you up to speed with the latest advancements in Generative AI technology and discover how leveraging FME with tools from giants like Google Gemini, Amazon, and Microsoft OpenAI can supercharge your workflow efficiency.
During the hour, we’ll take you through:
Guest Speaker Segment with Hannah Barrington: Dive into the world of dynamic real estate marketing with Hannah, the Marketing Manager at Workspace Group. Hear firsthand how their team generates engaging descriptions for thousands of office units by integrating diverse data sources—from PDF floorplans to web pages—using FME transformers, like OpenAIVisionConnector and AnthropicVisionConnector. This use case will show you how GenAI can streamline content creation for marketing across the board.
Ollama Use Case: Learn how Scenario Specialist Dmitri Bagh has utilized Ollama within FME to input data, create custom models, and enhance security protocols. This segment will include demos to illustrate the full capabilities of FME in AI-driven processes.
Custom AI Models: Discover how to leverage FME to build personalized AI models using your data. Whether it’s populating a model with local data for added security or integrating public AI tools, find out how FME facilitates a versatile and secure approach to AI.
We’ll wrap up with a live Q&A session where you can engage with our experts on your specific use cases, and learn more about optimizing your data workflows with AI.
This webinar is ideal for professionals seeking to harness the power of AI within their data management systems while ensuring high levels of customization and security. Whether you're a novice or an expert, gain actionable insights and strategies to elevate your data processes. Join us to see how FME and AI can revolutionize how you work with data!
“Temporal Event Neural Networks: A More Efficient Alternative to the Transfor...
“Temporal Event Neural Networks: A More Efficient Alternative to the Transfor...Edge AI and Vision Alliance
For the full video of this presentation, please visit: https://www.edge-ai-vision.com/2024/06/temporal-event-neural-networks-a-more-efficient-alternative-to-the-transformer-a-presentation-from-brainchip/
Chris Jones, Director of Product Management at BrainChip , presents the “Temporal Event Neural Networks: A More Efficient Alternative to the Transformer” tutorial at the May 2024 Embedded Vision Summit.
The expansion of AI services necessitates enhanced computational capabilities on edge devices. Temporal Event Neural Networks (TENNs), developed by BrainChip, represent a novel and highly efficient state-space network. TENNs demonstrate exceptional proficiency in handling multi-dimensional streaming data, facilitating advancements in object detection, action recognition, speech enhancement and language model/sequence generation. Through the utilization of polynomial-based continuous convolutions, TENNs streamline models, expedite training processes and significantly diminish memory requirements, achieving notable reductions of up to 50x in parameters and 5,000x in energy consumption compared to prevailing methodologies like transformers.
Integration with BrainChip’s Akida neuromorphic hardware IP further enhances TENNs’ capabilities, enabling the realization of highly capable, portable and passively cooled edge devices. This presentation delves into the technical innovations underlying TENNs, presents real-world benchmarks, and elucidates how this cutting-edge approach is positioned to revolutionize edge AI across diverse applications.Leveraging the Graph for Clinical Trials and Standards
Katja Glaß
OpenStudyBuilder Community Manager - Katja Glaß Consulting
Marius Conjeaud
Principal Consultant - Neo4j
Fueling AI with Great Data with Airbyte Webinar
This talk will focus on how to collect data from a variety of sources, leveraging this data for RAG and other GenAI use cases, and finally charting your course to productionalization.
HCL Notes und Domino Lizenzkostenreduzierung in der Welt von DLAU
Webinar Recording: https://www.panagenda.com/webinars/hcl-notes-und-domino-lizenzkostenreduzierung-in-der-welt-von-dlau/
DLAU und die Lizenzen nach dem CCB- und CCX-Modell sind für viele in der HCL-Community seit letztem Jahr ein heißes Thema. Als Notes- oder Domino-Kunde haben Sie vielleicht mit unerwartet hohen Benutzerzahlen und Lizenzgebühren zu kämpfen. Sie fragen sich vielleicht, wie diese neue Art der Lizenzierung funktioniert und welchen Nutzen sie Ihnen bringt. Vor allem wollen Sie sicherlich Ihr Budget einhalten und Kosten sparen, wo immer möglich. Das verstehen wir und wir möchten Ihnen dabei helfen!
Wir erklären Ihnen, wie Sie häufige Konfigurationsprobleme lösen können, die dazu führen können, dass mehr Benutzer gezählt werden als nötig, und wie Sie überflüssige oder ungenutzte Konten identifizieren und entfernen können, um Geld zu sparen. Es gibt auch einige Ansätze, die zu unnötigen Ausgaben führen können, z. B. wenn ein Personendokument anstelle eines Mail-Ins für geteilte Mailboxen verwendet wird. Wir zeigen Ihnen solche Fälle und deren Lösungen. Und natürlich erklären wir Ihnen das neue Lizenzmodell.
Nehmen Sie an diesem Webinar teil, bei dem HCL-Ambassador Marc Thomas und Gastredner Franz Walder Ihnen diese neue Welt näherbringen. Es vermittelt Ihnen die Tools und das Know-how, um den Überblick zu bewahren. Sie werden in der Lage sein, Ihre Kosten durch eine optimierte Domino-Konfiguration zu reduzieren und auch in Zukunft gering zu halten.
Diese Themen werden behandelt
- Reduzierung der Lizenzkosten durch Auffinden und Beheben von Fehlkonfigurationen und überflüssigen Konten
- Wie funktionieren CCB- und CCX-Lizenzen wirklich?
- Verstehen des DLAU-Tools und wie man es am besten nutzt
- Tipps für häufige Problembereiche, wie z. B. Team-Postfächer, Funktions-/Testbenutzer usw.
- Praxisbeispiele und Best Practices zum sofortigen Umsetzen
Energy Efficient Video Encoding for Cloud and Edge Computing Instances
Energy Efficient Video Encoding for Cloud and Edge Computing Instances
"Frontline Battles with DDoS: Best practices and Lessons Learned", Igor Ivaniuk
At this talk we will discuss DDoS protection tools and best practices, discuss network architectures and what AWS has to offer. Also, we will look into one of the largest DDoS attacks on Ukrainian infrastructure that happened in February 2022. We'll see, what techniques helped to keep the web resources available for Ukrainians and how AWS improved DDoS protection for all customers based on Ukraine experience
What is an RPA CoE? Session 1 – CoE Vision
In the first session, we will review the organization's vision and how this has an impact on the COE Structure.
Topics covered:
• The role of a steering committee
• How do the organization’s priorities determine CoE Structure?
Speaker:
Chris Bolin, Senior Intelligent Automation Architect Anika Systems
"Choosing proper type of scaling", Olena Syrota
Imagine an IoT processing system that is already quite mature and production-ready and for which client coverage is growing and scaling and performance aspects are life and death questions. The system has Redis, MongoDB, and stream processing based on ksqldb. In this talk, firstly, we will analyze scaling approaches and then select the proper ones for our system.
Recently uploaded (20)
Nordic Marketo Engage User Group_June 13_ 2024.pptx
Nordic Marketo Engage User Group_June 13_ 2024.pptx
Northern Engraving | Nameplate Manufacturing Process - 2024
Northern Engraving | Nameplate Manufacturing Process - 2024
JavaLand 2024: Application Development Green Masterplan
JavaLand 2024: Application Development Green Masterplan
Dandelion Hashtable: beyond billion requests per second on a commodity server
Dandelion Hashtable: beyond billion requests per second on a commodity server
Choosing The Best AWS Service For Your Website + API.pptx
Choosing The Best AWS Service For Your Website + API.pptx
HCL Notes and Domino License Cost Reduction in the World of DLAU
HCL Notes and Domino License Cost Reduction in the World of DLAU
“How Axelera AI Uses Digital Compute-in-memory to Deliver Fast and Energy-eff...
“How Axelera AI Uses Digital Compute-in-memory to Deliver Fast and Energy-eff...
Driving Business Innovation: Latest Generative AI Advancements & Success Story
Driving Business Innovation: Latest Generative AI Advancements & Success Story
“Temporal Event Neural Networks: A More Efficient Alternative to the Transfor...
“Temporal Event Neural Networks: A More Efficient Alternative to the Transfor...
Leveraging the Graph for Clinical Trials and Standards
Leveraging the Graph for Clinical Trials and Standards
HCL Notes und Domino Lizenzkostenreduzierung in der Welt von DLAU
HCL Notes und Domino Lizenzkostenreduzierung in der Welt von DLAU
Energy Efficient Video Encoding for Cloud and Edge Computing Instances
Energy Efficient Video Encoding for Cloud and Edge Computing Instances
"Frontline Battles with DDoS: Best practices and Lessons Learned", Igor Ivaniuk
"Frontline Battles with DDoS: Best practices and Lessons Learned", Igor Ivaniuk
9 CEO's who hit $100m ARR Share Their Top Growth Tactics Nathan Latka, Founde...
9 CEO's who hit $100m ARR Share Their Top Growth Tactics Nathan Latka, Founde...
Drawing organization Charts in VIVO
- 1. Drawing Organization Charts Using VIVO by Alex Rockwell
- 2. Introduction • Purpose • Program Design • Use Cases • Extending to People
- 3. Purpose • One of the goals of VIVO is to show which organizations faculty, staff, and students belong to. • UF's academic structure is highly complex and does not correspond to its financial structure. • UF does not have a facility to create organizational charts. Most organization charts are created by hand.
- 4. Original Uses • Demonstrate how to work with VIVO's linked data • Create org charts automatically for each institution • Create poster sized drawings for marketing purposes
- 6. Art vs Science • More than 60% of my time on the project has been spent drawing graphs. • Over 100 graphs have been created. • Drawing graphs with 500+ nodes and including labels is extremely difficult.
- 7. First Graph • Extends several feet in both directions • This first result was so bad I nearly scrapped the whole project...
- 8. Evolution
- 9. Evolution
- 10. Evolution
- 11. Evolution
- 12. Immediate Impact • The original picture generated substantial interest in the program. • Showed that writing interesting 3rd party applications on the VIVO platform is possible. • Many problems including missing, misplaced, and duplicated data have been uncovered by the crawler.
- 13. Finding all UF organizations • Over 100 external organizations were added to VIVO during CV entry of the showcase departments. • SPARQL cannot do recursive queries, so we did not have a tool to automatically find all sub-organizations of UF. • Extended the ontology locally with a rootOrganization data property to mark organizations as children of UF.
- 14. Finding Data Problems • Looking at graphs generated by the program has uncovered many problems in our data, including missing, misplaced, and duplicated records. • We can understand the organizational structure much faster by looking at the graph rather than manually following the links from one organization to another.
- 15. Extending to People • Plan to show the relationship between people and their affiliations with departments, centers and institutes. • Need to import data to show the heads of departments. • Finding the right representation will be challenging because UF's VVIO will include close to 30,000 people by the end of the grant.
- 16. Interactive Graph Demo • Demo available at http://qa.vivo.ufl.edu/ infovis/demo.html • Created with JavaScript InfoVis Toolkit (http://thejit.org)
- 17. Contact Information • Alex Rockwell (alexhr@ufl.edu) • Source code available at github.com/arockwell/vivo_org_chart