AMPI's Mexico 2013 Presentation
•Download as PPTX, PDF•
3 likes•1,764 views


Recommended
Recommended
More Related Content
Similar to AMPI's Mexico 2013 Presentation
Similar to AMPI's Mexico 2013 Presentation (20)
More from Houston Association of REALTORS®
More from Houston Association of REALTORS® (20)
Recently uploaded
Recently uploaded (20)
AMPI's Mexico 2013 Presentation
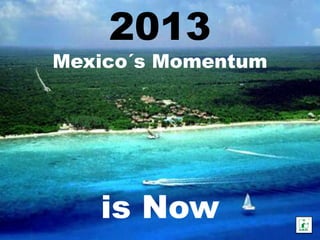
- 1. 2013 Mexico´s Momentum is Now
- 2. Organization for Economic Co-operation & Development Comisión Económica para América Latina All 4 Share a common vision: Mexico is living a great moment to do all the required reforms to become an economic power.
- 3. Reality Vs. a Mistaken Perception Fuente SOFTEC The world has become Wealthier during the last century
- 4. Total U.S. Market: Estimated at $928.2 Billion Estimated International Sales $82.5 Billion Fuente realtor.org
- 5. Now the most important factor influencing the purchase is location followed by price. Location Fuente realtor.org
- 6. Percent of U.S. Transactions by Non-Resident Foreigners Fuente realtor.org They are more likely to decide to purchase on Easter, Summer & Christmas holidays
- 7. 27% of Realtors® during last 12 months reported having worked with international clients Fuente realtor.org
- 9. The 3 world economies that will grow the most for 2013 1st place China 2nd place India 3rd place México
- 10. Lic. Enrique Peña Nieto Mexico s President
- 11. Mexican Government Goals 2012-2018 1. Strengthen security and safety 2. Equal Opportunities for all 3. Raise the Quality of Education 4. World Responsibility Fuente COPARMEX.org 5. Mexican prosperity
- 12. Mexico 75 Cities +100,000pop 10 Cities +1`000,000pop Fuente INEGI,
- 13. Mexican Population Forecast Fuente INEGI, SOFTEC y CONAPO • Mexico Had 112 million people in 2010 • Median age is 26 • Population will stop growing by 2040
- 14. Hispanic Market +28.5 million Mexicans live in USA
- 15. Mexican Household Formation Fuente INEGI, SOFTEC y CONAPO Mexico will be in its peak household formation rate between 2012 - 2015
- 16. Mexican Population Pyramid Fuente SOFTEC In 2030 Mexico will have the largest workforce This is the Mexican Demographic Bonus
- 17. Mexican Household Growth by Type Fuente SOFTEC México s Households will grow from 28.6 million in 2010 to 39.2million in 2030
- 18. Mexican Real Estate Composition Segment Market % Avg. Price Conformation 1 Low Income 22.50% $25,000.00 $5,625.00 2 Affordable 35.50% $35,000.00 $12,425.00 3 Middle Class 19.00% $75,000.00 $14,250.00 4 Residential 15.00% $175,000.00 $26,250.00 5 Luxury 8.00% $625,000.00 $50,000.00 Median House 100.00% US$CY $108,550.00 Fuente INEGI y AMPI.org
- 19. What have we done in the past? Area Bedrooms Bathrooms Fuente SOFTEC Now, it is not enough. Client knowledge, uniqueness and surrounding information is key in the decision process.
- 20. What do we know about prospective buyers? Fuente SOFTEC Niche specialization is key more than ever
- 21. Real Estate Inventory in Mexico Properties 50 million Housing 35 million Commercial 15 million Fuente INEGI
- 22. Required Real Estate Investment Inversión inmobiliaria Soft ec® 2010-2015 2010-2015 46 Fuente SOFTEC $160,000)mill.) $140,000)mill.) $120,000)mill.) $100,000)mill.) $80,000)mill.) Oficinas) $60,000)mill.) Comercio) Vivienda) $40,000)mill.) $20,000)mill.) $0)mill.) Investment Inversión) Loan Opportunity Oportunidad)Crédito) Oficinas) $7,750)mill.) $3,875)mill.) Comercio) $37,500)mill.) $22,500)mill.) Vivienda) $102,100)mill.) $61,260)mill.)
- 23. México • Houses inventory 35`000,000 • Existing occupied Homes 29`000,000 • Current Housing Deficit 8,920,000 • Annual # House transactions 1,300,000 • Household Formation Rate 600,000 • Required New Houses 730,000 • New houses production 500,000 • Required Remodeled Houses 400,000 Fuente INEGI
- 24. Increasing Units Under Construction in Mexico Fuente SOFTEC
- 25. 10 Real Estate State Laws promoted by AMPI Fuente AMPI.org 2013 Status 10 States with Real Estate Legislation Lobbing States for Real Estate license AMPI ® La UNIÓN que da PRESTIGIO
- 26. 10yr. Average Family Mobility 14% Vacant homes for this purpose in Mexico Fuente SOFTEC
- 27. 95% will be Urban Population Growth. The 2nd home Markets will nurtured by the National and International Markets
- 28. Mexico´s urban growth, Measured in percentages Morelia 65% Tijuana 220% Hermosillo 90% Irapuato 65% Cancun 210% Villahermosa 90% Culiacan 65% Tuxtla Gutz 145% San L Potosi 85% Torreon 60% Juarez 135% Toluca 85% Reynosa 60% Puebla 80% Tampico 55% Chihuahua 110% Matamoros 75% Guadalajara 55% Aguascaliente 105% Leon 70% Acapulco 55% Queretaro 105% Merida 70% Durango 50% Oaxaca 95% Saltillo 65% Coatzacoalcos 45% Celaya 95% Veracruz 65% Metropolitana 40% Mexicali 95% Mazatlan 65% Dist. Federal 40% Cuernavaca 95% Monterey 65% Xalapa 25% Fuente SOFTEC, INEGI Y CONAPO
- 29. Mexico s urban growth, Measured in percentages Fuente SOFTEC, INEGI Y CONAPO A Real Estate Opportunity
- 30. The 15 Fastest growing cities percent wise in México for 2030 . . Mexicali Tijuana 135% . Ciudad Juarez 220% 135% Hermosillo . 90% . Chihuahua 110% San Luís Potosí 85% . Querétaro 105% . Cancun . . . Toluca 85% 210% Aguascalientes 105% . . Celaya 95% . . Cuernavaca 95% Tuxtla Gutierrez Oaxaca 95% 145% Fuente SOFTEC, INEGI Y CONAPO
- 31. The next 15 faster growing cities percent wise in México for 2030 . . . Torreón 60% . . Saltillo 65% Monterey 65% . . .. . Matamoros 75% . . Reynosa 60% Mérida 80% . Culiacán 65% . . Tampico 55% . Mazatlán 65% . .. . . .. Puebla 80% . . . . . León 70% Veracruz 65% Irapuato 65% . . . Morelia 65% Guadalajara 55% Fuente SOFTEC, INEGI Y CONAPO
- 32. Fast growing cities percent wise in México for 2030 . . Nuevo Laredo 55% Los Cabos 25% . . . . . . . . Xalapa 25% . . . Coatzacoalcos 55% . . . . . La Paz . . Villahermosa 55% . . . 50% . .. Durango 50% Tepic 55% . . .. . Puerto Vallarta 25% . ... . . . . . . . Metropolitana Edo. Mex. 40% . Colima Chetumal 50% . . . 25% Distrito Federal 40% . Ixtapa 25% Acapulco 55% Huatulco 25% Fuente SOFTEC, INEGI Y CONAPO
- 33. Mexico s urban growth, Measured in family houses Fuente SOFTEC, INEGI Y CONAPO The average Mexican family is conformed by 4.3 members
- 34. 1. Ciudad de Middle and High México 2. Monterrey Income Level 3. Guadalajara Cities of Mexico 4. Tijuana 5. León 6. Mexicali 7. Chihuahua 8. Saltillo 9. Aguascalientes 10. Cancún 11. Querétaro 12. Toluca 13. Juárez 14. Puebla 15. Torreón 16. Tampico 17. Cuernavaca Fuente SOFTEC, INEGI Y CONAPO
- 35. In México Annual Rental housing deficit is 500,000 homes representing a huge opportunity niche.
- 36. “The secret of business is to know something nobody else does” Aristotle Onassis
- 37. The Numbers that Drive the North American Real Estate Markets
- 38. Number of sold Houses 447,010 Canada 4,940,000 United States 1,300,000 México Fuente CREA.org, Realtor.org, AMPI.org e INEGI
- 39. The Real Estate Markets of North America Canada USA México Total of house sales 2012 Total of house sales 2012 Total of house sales 2012 447,010 4´940,000 1,300,000 Both sides of transactions Both sides of transactions Both sides of transactions 894,020 9´880,000 2,600,000 Number of CREA® Members Total Number of Realtors Total of Real Estate Agents 101,606 1´070,000 330,000 Average Number of Closed Average Number of Closed Average Number of Closed Transactions Transactions Transactions 8.80 Fuente CREA.org, Realtor.org, AMPI.org e INEGI 9.23 7.88
- 40. Median House Prices Fuente CREA.org, Realtor.org, AMPI.org e INEGI México United States Canada uscy$108,550dls. uscy$173,000dls uscy$340,000dls
- 41. AVG Median Average Country Sold Price Income dls Canada 8.8 $340,000dls $149,600.00 USA 9.23 $173,000dls $79,839.00 Mexico 7.88 $108,550dls $42,768.00 Fuente CREA.org, Realtor.org, AMPI.org e INEGI
- 42. Months of Supply Canada 3.9months United States 9.4months México urban Mkt. 5.3months México 2 Home Mkt. nd Fuente CREA.org, Realtor.org, AMPI.org e INEGI
- 43. GDPGrowth 2013 Forecast 3.5% Canada 2.0% United States 4.0% México Fuente CREA.org, Realtor.org, AMPI.org e INEGI
- 44. Inflation 1.6% Canada 1.6% United States 3.0% México Fuente CREA.org, Realtor.org, AMPI.org e INEGI
- 45. Regional Positive Growth Expectations Fuente CREA.org, Realtor.org, AMPI.org e INEGI 3.5% GDP - 1.6% Inflation = + 1.9 Growth for Canada 2.0% GDP - 1.6% Inflation = + 0.4 Growth for United States 4.0% GDP - 3.0% Inflation = + 1.0 Growth for México
- 46. Unemployment 7.6% Canada 9.6% United States 5.1% México Fuente CREA.org, Realtor.org, AMPI.org e INEGI
- 47. Annual Jobs Generation Canada requires 250,000 jobs United States requires 2 400,000 jobs Plus 1 200,000 lost jobs México Fuente CREA.org, Realtor.org, AMPI.org e INEGI requires 1 000,000 jobs Green Technology a key strategic engine
- 48. Fuente CREA.org, Realtor.org, AMPI.org e INEGI Appreciation rate 4% Canada 4% United States 4-7% Mexico
- 49. A Consolidated Cities Mexico City Metropolitan Area, Guadalajara, Monterrey, Acapulco, Tijuana, Querétaro y Veracruz. • Housing supply is low and demand is high. • Stable price growth. 4% Constant positive equity. • Urban recycling, growth is a little bit complicated • Average New house M2 value $700dls. • Average New Apartment M2 value $2000dls. • Average Used house M2 value $600dls. • Average used Apartment M2 value $1500dls. Fuente AMPI.org Metroscubicos, e INEGI
- 50. B Promising Cities Tlajomulco de Zuñiga, Toluca, Los Cabos, La Paz, Aguascalientes, Cancun, Riviera Maya, Leon y Culiacan. • Good investment for long term purposes (10yrs). • Stable price growth. 4-5% Constant positive equity. • Construction of new developments, • Average Urban House M2 value $500dls. • Average Urban Apartment M2 value $850dls. • Average Resort House & Apartment vary dramatically Fuente AMPI.org Metroscubicos, e INEGI
- 51. C Ideal Cities to Invest La Paz, Hermosillo, Ciudad Juarez, Angelopolis, Morelia, San Luis Potosi, Metepec, Villahermosa • Cities will to grow significantly in mid term (5 yrs.) • Stable price growth. 6-7% Constant positive equity. • Implementing Urban and master planning • Average New house M2 value $530dls. • Average New Apartment M2 value $700dls. * La Paz & Metepec Real Estate portfolio cost more. Fuente AMPI.org Metros cúbicos, e INEGI
- 52. Mortgage Interest Rate Comparison Cost of money is all time low 5.20% Canada 5.05% United States 8.50% México Fuente CREA.org, Realtor.org, AMPI.org e INEGI
- 53. Mortgaged Houses 60% Canada 67% United States 11% Mexico Fuente CREA.org, Realtor.org, AMPI.org e INEGI
- 54. Mortgage Evolution in the USA Compared to México Fuente SOFTEC, Realtor.org, AMPI.org e INEGI Only 11% of the Mexican Houses have a mortgage
- 55. Mexican Mortgage Growing Demand Fuente CREA.org, Realtor.org, AMPI.org e INEGI
- 56. Paid Mortgages in México Fuente SOFTEC, AMPI.org e INEGI 3 million people paid off their mortgages and they are ready to move on
- 57. Mexico´s International reserves $163 billion dollars after lending 80 billion to the European Union Fuente BANXICO
- 58. Affordability
- 59. Mexican Middle Class Evolution Fuente SOFTEC, y GEA 53.5 % of the Mexican families are Middle class & annual earnings from us$15,000dlls to us$50,000dlls
- 60. Income acquisition power growth GDP GDP Fuente SOFTEC, y GEA Income growth in Mexico exceeded all forecasts
- 61. GDP/Capita Launch Fuente SOFTEC, y GEA In 2030 Mexican Families Income acquisition power will grow to US$23,000 average
- 62. México s Income Growth 22.0% High Income 53.5% Middle Income 24.5% Low Income Fuente SOFTEC, y AMAI
- 63. Prosperity for Mexico 2012-18 Conditions to become an Emerging Economic Power 1. Raise the standard of the Mexican human resources due to the demographic bonus taking the most advantages of this privileged condition to generate opportunities. 2. Value added proposition due to the healthy economy, territorial advantages through strategic infrastructure developments of private and public investments. 3. Create the right atmosphere that business demands where the macroeconomic stability is starting point. Increasing productivity helps the workers to earn more money without generating inflation, raising companies competitiveness with programs stimulate productivity. Fuente COPARMEX
- 64. Value added proposition of Real Estate Specialization
- 65. AMPI IS key in ALAAI & CILA The Union of Real Estate Associations of Latin America
- 66. Mexican International Leadership in Every way
- 67. Current Housing Deficit in Latin America Paraguay 43% Dominican Rep 41% Panama 39% Colombia 37% Mexico 34% Brazil 33% Argentina 32% Venezuela 29% Uruguay 26% Chile 23% Costa Rica 18% Mexico is 8,920,000 Short
- 68. Expected Population Growth in Cities at the America´s for 2030 1. Sao Paulo 10,300,000 2. Mexico City 8,500,000 3. Rio de Janeiro 6,100,000 4. Tijuana 4,500,000 5. Bogotá 3,800,000 6. Monterrey 2,600,000 7. Guadalajara 2,350,000 Fuente SOFTEC A Real Estate Opportunity
- 69. For each dollar invested in private construction The Mexican government invests another dollar in public infrastructure Fuente SOFTEC,
- 70. Urban and Master Planning Revolution Tlajomulco de Zuñiga Del Valle Mexico City Non recyclable blocks Regular, Reusable Blocks 40% Infrastructure 15% Infrastructure 50% is the Plot Value 20-25% is the Plot Value Fuente AMPI.org
- 71. 2013 construction of the bullet train between Queretaro and Mexico City French, Japanese and Mexican joint venture from 2013-2023
- 72. Bullet Train Conecting 26 Cities
- 73. Tourism in Mexico Latin-America Central America Argentina, Uruguay & Paraguay Brazil Chile, Bolivia & Peru Colombia & Ecuador Venezuela Dominican Republic Bahamas Netherlands Antilles Caribbean Mexico has 34% Market Share Fuente RCI
- 74. 50% of International flights of Latin America happen to be in Mexico Mexico's 7 strong connectivity airports • Mexico City # 1 • Cancun # 2 • Guadalajara • Monterrey • Tijuana • Los Cabos • Puerto Vallarta
- 75. Getting a list of all the direct flights to your city will determine where your prospect investors are coming from and going to buy Real Estate
- 76. Mexican Tourism 22,200,000 International Visitors 66,100,000 National Visitors 325,000 Hotel rooms Fuente SOFTEC y FONATUR
- 77. Tourism in major Domestic Coastal destinations Foreign Cancún & Ribiera maya Fuente RCI Cozumel Huatulco Acapulco Ixtapa Zihuatanejo Manzanillo & B Navidad Puerto Vallarta Mazatlán Los Cabos La Paz Loreto Guaymas / San Carlos Rocky Point Rosarito/Ensenada
- 78. Market Share Tourist Ocean Side Markets Acapulco 28.4% Cancún 31.2% Cozumel 02.4% Huatulco 02.4% Ixtapa 04.3% Los Cabos 06.7% Manzanillo 03.3% Mazatlán 09.9% Puerto Vallarta 11.3% Fuente RCI
- 79. Market Share Mexican Tourist Composition Hotel 32.0% Studio 17.9% 1 Bedroom 32.6% 2 Bedroom 14.9% 3 Bedroom 02.4% Fuente RCI
- 80. Hotel Industry Fuente SOFTEC, y FONATUR English, French, Spanish, American, Indian and Mexican hotel chains have expansion plans
- 81. Mexican Tourist Real Estate Portfolio: • Native American cultures • Luxury & Boutique • Natural wonders • Colonial towns • New concepts • Biodiversity • All inclusive
- 82. New products will be Hybrids Fuente SOFTEC
- 83. Fuente SOFTEC y FONATUR Second homes market is booming. FONATUR is building the largest project ever in Playa Espíritu, Sinaloa. Even larger than the Riviera Maya
- 84. 28% Air France increase of French tourist to México Announced that they will continue during 2012 Increasing Routes to Mexican destinations Fuente Periódico Reforma
- 85. Canadian entrepreneurs are the most important investment group in the USA . In México they represent 3.4% of the foreign direct investments and actively invest in second homes. Mazatlán, Manzanillo Puerto Vallarta, Mérida Barra de Navidad, Oaxaca San Miguel Allende, La Paz Campeche y Los Cabos Fuente AMPI.org y FONATUR
- 86. Mexico is important to baby boomers estate and assets portfolio, because inheritance tax in our country is 0% compare to 60% in the United states
- 87. What is the most likely to happen in Mexico Fuente SOFTEC
- 88. Forbes magazine reveals That US & Canadians are moving to México for; 1. Economic opportunities 2. Weather 3. To Meet people 4. Quality of life 5. Lifestyle. Now illegal immigration to the United States is mainly from Central Americans.
- 89. México offers the opportunity to start your own business with less competition, continue working regardless your age or work rhythm. The cost of living and medical expenses are cheaper. Fuente SOFTEC
- 90. U.S. Citizens Reside in Every single State of México Fuente SOFTEC
- 91. In México 2 million of US Citizen reside permanently & over 2 million US & Canadians live for periods that range between 2-6 months in winter time. They are taking advantage of our cultural heritage, people opportunities, weather, lifestyle and our land. Fuente INEGI
- 92. Social Networking between 48 to 62% of your leads come from our sphere of influence Are you using a CRM? And Facebook? Fuente AMPI.org
- 93. Importance of high visibility and contacts was reported by Realtors® Fuente EALTOR.ORG 55% of clients were referred to them through friends, previous clients, international and domestic referrals. 20% percent of clients are obtained through website/online listings. Client recommendation is key
- 94. 43% of the Real Estate Markets in Mexico are tourist and second home related. 30% of the Real Estate professionals are from all over the world. The relationships and networking with their clientele and Real Estate professionals have generated and launched important international investments throughout México
- 95. Mexico's second home markets
- 96. 80% of Transnational Corporate Offices of Latin-America are located in Mexico 70% México City 16% Monterrey 06% Guadalajara 08% Tijuana, Querétaro, Puebla, León, San Luís Potosí, Ciudad Juárez, Hermosillo, Toluca, Mérida & Aguascalientes Información elaborada por Colliers International.
- 97. Market Share Office Space Mexico city 10 corporate office areas there is a total inventory of 6.5 million m² composed by A+, A & B types. Información elaborada por Colliers International.
- 98. Información elaborada por Colliers International. Market share Office Segmentation
- 99. Market Share Available Office Space Información elaborada por Colliers International.
- 100. Market Share Office Demand During the last 4 years the office market has grown dramatically. And its expected to continue. 2008-2012 Información elaborada por Colliers International.
- 101. Office Market Lease Pricing Información elaborada por Colliers International.
- 102. The Financial corridor of Reforma in Mexico city. 2000 million dollar are being invested in 13 new skyscrapers Adding 1,000,000 square meters to this specific market. Mixt use projects combine office, housing, hotel and commercial. This is equivalent to the total amount of office space in entire Colombia.
- 103. Reforma´s new corporate profile started its evolution in 2004, Just Reforma office by itself will have more office space than Colombia, Panama and Costa Rica.
- 104. Some of the New Corporate Offices in Reforma Avenue 1. Reforma Capital 2. New York Life Insurance 3. BBVA World Corporate HQ 4. The 412 Tower 5. MAPFRE Corporate Offices 6. Reforma Tower 7. Reforma 509 8. Diana Tower 9. Santander Corporate HQ 10. Puerta Reforma
- 105. A recent study done by Colliers International reveals a consistent long term expansion plans of investments of the largest developers and investment funds on emerging countries, developing corporate offices, commercial developments, industrial parks, tourist projects, and residential projects of all different scopes. Información elaborada por Colliers International.
- 106. • Currently the highest demand for commercial sites due to the economy is in México and Colombia • In México there 593 commercial developments in operation during 2013, 53 additional commercial complexes were built. • In metropolitan cities 35 of these projects the anchors stores include Wallmart, Chedraui, Soriana, Cinepolis and Home depot. Información elaborada por Colliers International.
- 107. • in Brazil new shopping centers are in process of construction and International luxury brands are opening up mainly in cities where international soccer world cup 2014 will be held. • Chile is the has the most steady and dynamic real estate investments of South America Información elaborada por Colliers International.
- 108. Peru received in 2011 $260,000,000dlls and in 2012 received Us$326,000,000dlls in commercial investments. With an inventory of 55 shopping centers and 11 in process of construction. Due to their excellent economic performance Investments are coming steady mainly from Chile. Panama has 83 shopping centers in construction process but prices has only increased in 3% due to the moderate demand. Información elaborada por Colliers International.
- 109. In Colombia, Costa Rica, Peru, Chile, Panama, and Mexico there is a steady growth due to the demographic bonus and healthy economic government policies and management generating a dynamic engine behind the growth in Latin America. Guadalajara, Mexico New Office Building Información elaborada por Colliers International.
- 110. Market Share Mexico Commercial Real Estate • Shops in shopping centers 21300 • Shopping Center Area 19,100,000m2 • Office Buildings 740 • Commercial office space 7,100,000m2 • Industrial parks 330 • Covered warehouse capacity 80,000,000 Información elaborada por Colliers International.
- 111. 13 NEW Car Plants more coming soon Celaya, Gto. Irapuato, Gto. México State México State Silao, Guanajuato Puebla, Pue San Luis Potosi Aguascalientes Mexico State Cuernavaca, Mor. Puebla, Pue Tlaxcala Mexico City. DF
- 112. Market Share Industrial Properties México Información elaborada por Colliers International. •Demand is very high •44% are class A •56% are class B •29% are located in Mexico City and metropolitan area •1600 properties larger than 2000m2 add up to 18,694,956m², only 95 properties available
- 113. Market Share Mexico Industrial Warehouse 251,000 m² were closed in purchase & lease transactions during the 2nd quarter of 2012. 17% “Class A” warehouses $3.20dls/m² to USD $8.30dls/m² 83% “Class B” warehouses $2.20dls/m² to USD $6.47dls/m² * The monthly price difference is mainly due to location. 3.6% is available in the market Información elaborada por Colliers International.
- 114. Commercial Market Información elaborada por Colliers International • Strong expansion in all kinds of commercial centers. • Brand new concepts have being developed. • Investors are remodeling historical buildings and recycling their use.
- 115. Información elaborada por Colliers Internation 2012 Niche Commercial Segments Growth Market +16.3% Specialty stores + 9.0% Auto service stores + 6.5% Department stores
- 116. 226,000m² shopping centers capacity distributes as follows: 52% Mexico Metropolitan area 29% Central region 07% Northwest region 06% Southeastern region 06% North region Información elaborada por Colliers International
- 117. Market Share Commercial Activity 37% 25% 14% 09% 08% 07% Información elaborada por Colliers International
- 118. 44 New Commercial centers in construction with 890,622,000 m² lease capacity. 52% Metropolitan 20% Central region 20% Southeast 06% Northwest 02% North *Only 4 of these are expansion projects Información elaborada por Colliers International
- 119. Market Share Retail conditions • Demand for retail space at fashion malls is higher. • Recovery signs for more than 25 months • Confidence index reflects growth in retail sales. • Power centers and fashion malls are the trend Información elaborada por Colliers International
- 120. Price trend of Retail Recycled historical places such as downtown Mexico city In the street of Madero. Converted in to a pedestrian corridor has developed a price increase in this kind of locations. Investors have made it a national trend. Información elaborada por Colliers International
- 121. Dragon Mart: Puerto Morelos, Q. Roo. Designed to promote Chinese products and Services to the America's markets. The first was built in Dubai. • Corporate • Commercial • Cultural • Distribution center of 1.2 Km² long Información elaborada por Colliers International.
- 122. We forecast that China will invest: Baja California Sur, Sinaloa, Guerrero Veracruz y Tamaulipas
- 123. Let's break mental barriers and let's work together
- 124. Market to Market NAR & AMPI Program Networking and closing transactions with those Real Estate Professionals where there is a flow of buyers that are coming and going to invest in to specific markets
- 125. Market to Market Program Case scenario A Fact Business proposal Mexican National Houston Association Prospect Buyers of Realtors signs a from Monterrey, Mexico collaboration agreement are coming to Houston with the Monterrey to invest in Real Estate AMPI chapter Increase your market share and the number of transactions
- 126. Market to Market Program Case scenario B Business proposal Fact The AMPI Chapter of Successful Real Estate Professionals entrepreneurs of Cozumel signs a from Houston, Texas collaboration agreement are coming to Cozumel with the Houston to invest in Real Estate Association of Realtors Take advantage you have a partner in México and diversify your income
- 127. Recommended path 1.Sign the agreement of collaboration between 2 markets that share interests. 2.Endorse the agreement to commit to work in conjunction. 3.Course: How to do business in México or the United States. 4.TRC & CIPS Certifications An agreement that generates 5.Research business benefits among Real Estate relationships between both Professionals to develop markets. professionals skills and 6.Develop channels that business among themselves. motivate collaboration among real estate professionals
- 128. Market to Market Mexico´s Markets 1. Aguascalientes Program 2. Angelopolis Cholula 3. Chihuahua Texas Markets 4. Ciudad de México • Abilene 5. Coatzacoalcos • Amarillo 6. Cozumel • Austin 7. Culiacan • Brownsville 8. Guadalajara • South Padre 9. Irapuato • Corpus Christi 10.Matamoros • Greater El Paso 11.Metro Edo. México • Houston 12.Monclova • Lubbock 13.Monterrey • Greater Fort Worth 14.Morelia • Greater McAllen 15.Nuevo Laredo • MetroTex Dallas Regional 16.Reynosa • San Antonio 17.Tampico • San Marcos 18.Villahermosa
- 129. Trade Mission to Playa del Carmen May 2013 A great networking opportunity for Texas Realtors to meet AMPI Real Estate Professionals to generate and strengthen your international business opportunities.
- 130. International Director Course in office Mercy Management Dueñas Sept 6-9 2013, Dallas, Texas Vicepresident Real Estate Texas Congress Taught by a Lic. Velia networking, Courses during 4days, prestigious Firm Amparo How to do business in USA, with14 offices & Recruiting, Retention, Management, 67 years of Rivas Ornelas Marketing & property tour expertise Market to Market Program
- 131. Sales and Marketing are the driving forces that move the world
- 132. “ Business is like riding a bicycle. Either you keep moving or you fall down.” Frank Lloyd Wright
- 133. If you haven't visited Mexico lately it´s because you been watching too much TV
- 134. We are
- 135. The Mexican Association of Real Estate Professionals La Asociación Mexicana de Profesionales Inmobiliarios
- 136. The Network that provides PRESTIGE ®