Download to read offline
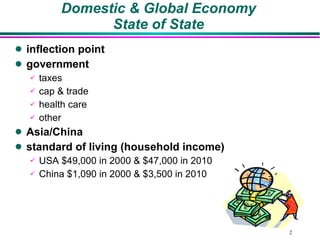
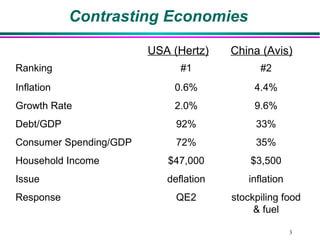
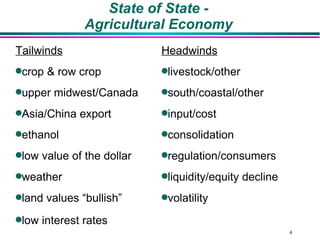
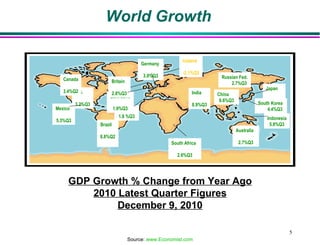
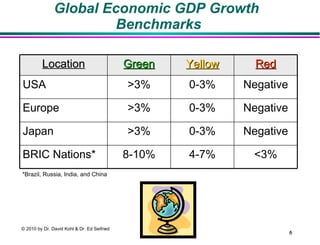
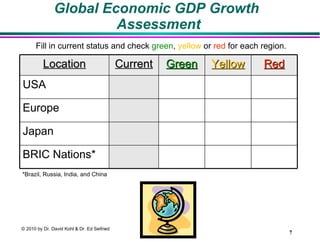
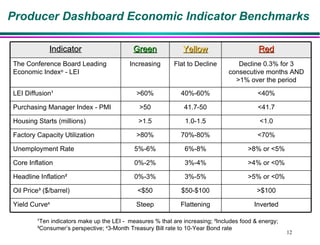

The document provides an overview of Dr. David M. Kohl's professional background and areas of expertise including weekly columns on agricultural topics. It then summarizes the current state of various domestic and global economies, including household incomes and growth rates in the US and China. Several agricultural economic indicators for different regions of the world are also assessed based on benchmarks for growth rates.


