Download to read offline


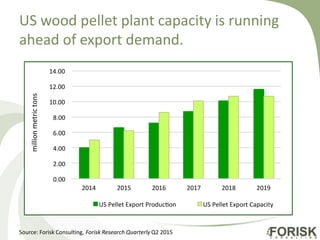
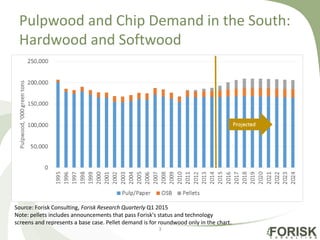
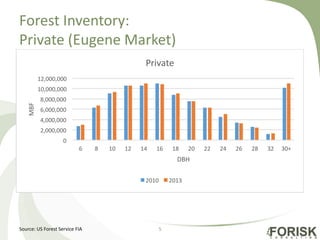
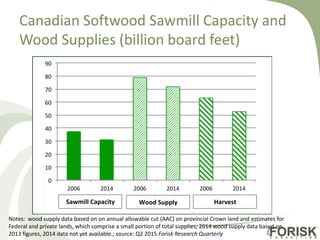

This document discusses several topics related to wood demand, timber supplies, and wood markets in the United States and Canada, including: 1) US wood pellet plant capacity is exceeding export demand. 2) Demand for pulpwood and chips is discussed for the Southern US by hardwood and softwood categories. 3) Forest inventory statistics are shown for private lands in the Eugene, Oregon market. 4) Canadian softwood sawmill capacity and wood supply statistics are shown from 2006-2014.


