Download to read offline


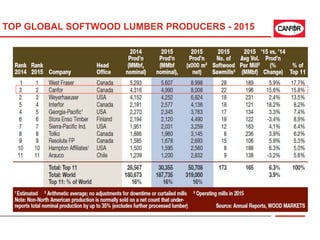
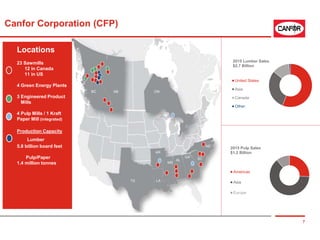
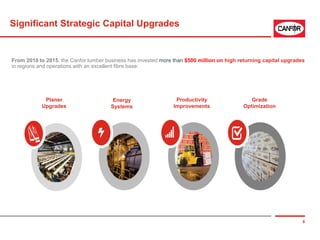

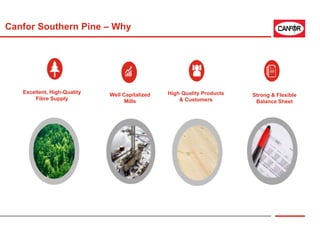
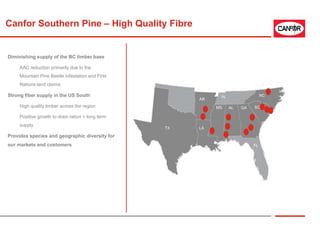
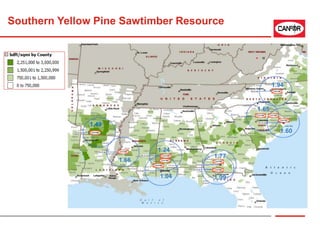
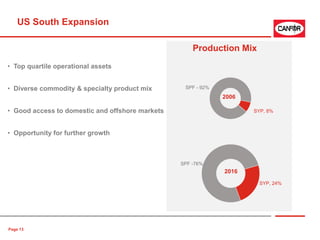
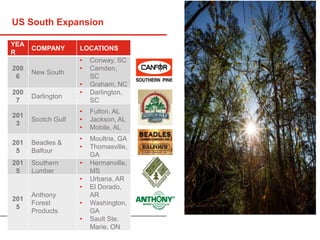
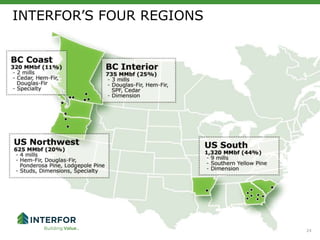
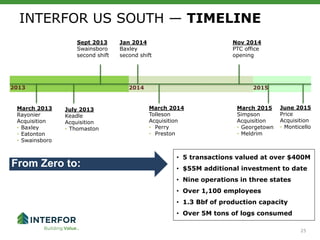
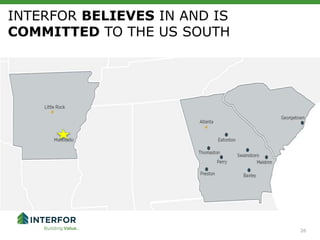
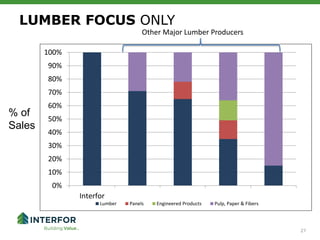
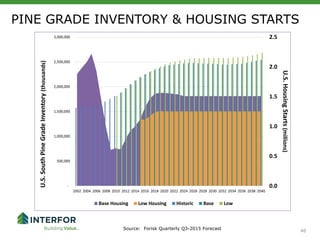
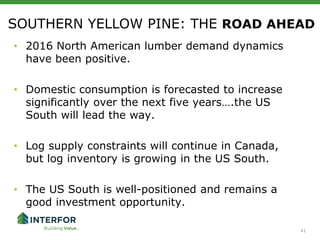

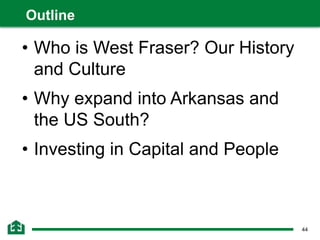


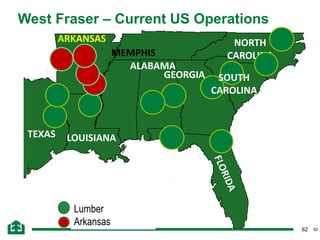
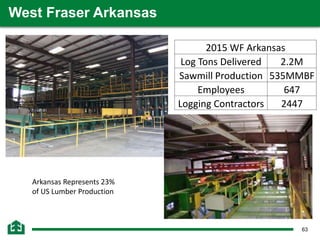
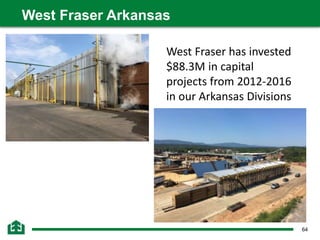
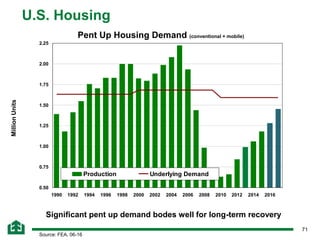
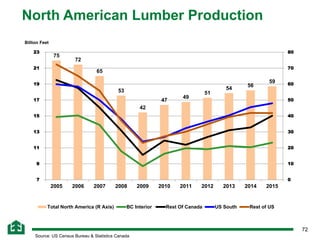
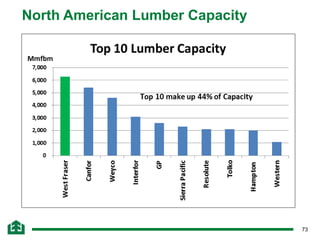
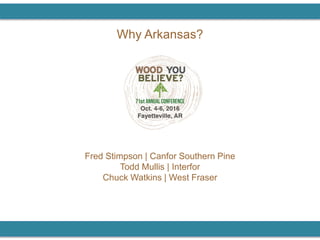


- The document summarizes a presentation given to the Arkansas Forestry Association about opportunities in the Arkansas timber industry. It includes summaries from Canfor Corporation, Interfor, and West Fraser about their operations in the southern United States and plans for future expansion and investment. All three companies see the sustainable fiber supply and growing lumber demand in the southern US as opportunities for growth.


![[En] pdf](https://cdn.slidesharecdn.com/ss_thumbnails/enpdf-140722010119-phpapp02-thumbnail.jpg?width=640&height=640&fit=bounds)


