Downloaded 11 times


![Energy per visit in kWh (E):
E = [Data Transfer per Visit (new visitors) in GB x 0.81
kWh/GB x 0.75] + [Data Transfer per Visit (returning
visitors) in GB x 0.81 kWh/GB x 0.25 x 0.02]
Emissions per visit in grams CO2e (C):
C = E x 442 g/kWh (or alternative/region-specific carbon
factor)
https://sustainablewebdesign.org/calculating-digital-emissions/](https://image.slidesharecdn.com/1508morgenboosterdontclickthis-230428100418-2e53b393/75/Don-t-click-this-Morgenbooster-49-2048.jpg)


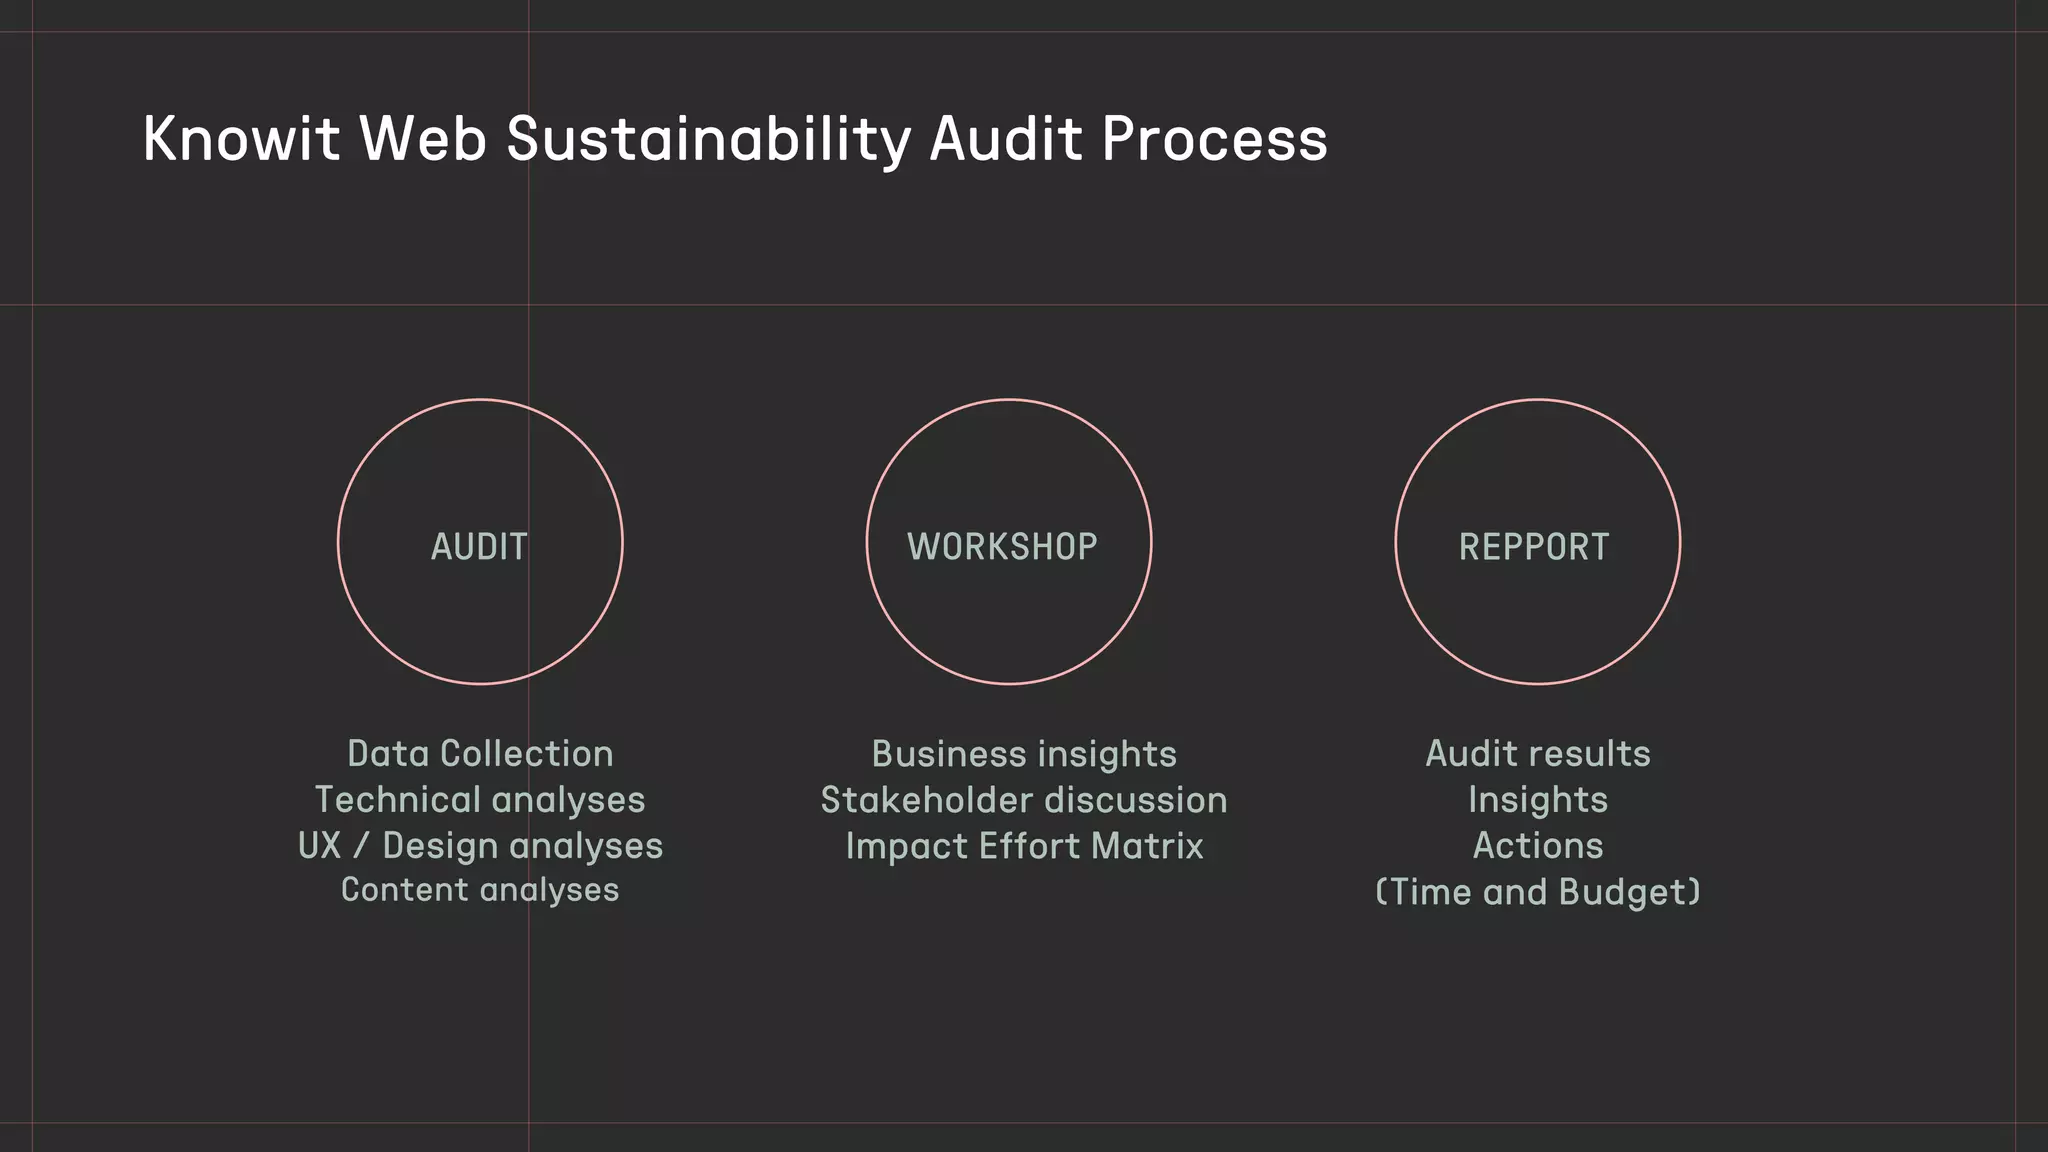


The document discusses the environmental impact of web development and digital practices, highlighting the need for sustainability in technology. It presents a framework for improving design, UX, and development while minimizing carbon footprints and promoting renewable resources. The authors propose various strategies to enhance efficiency and reduce energy consumption in digital solutions.
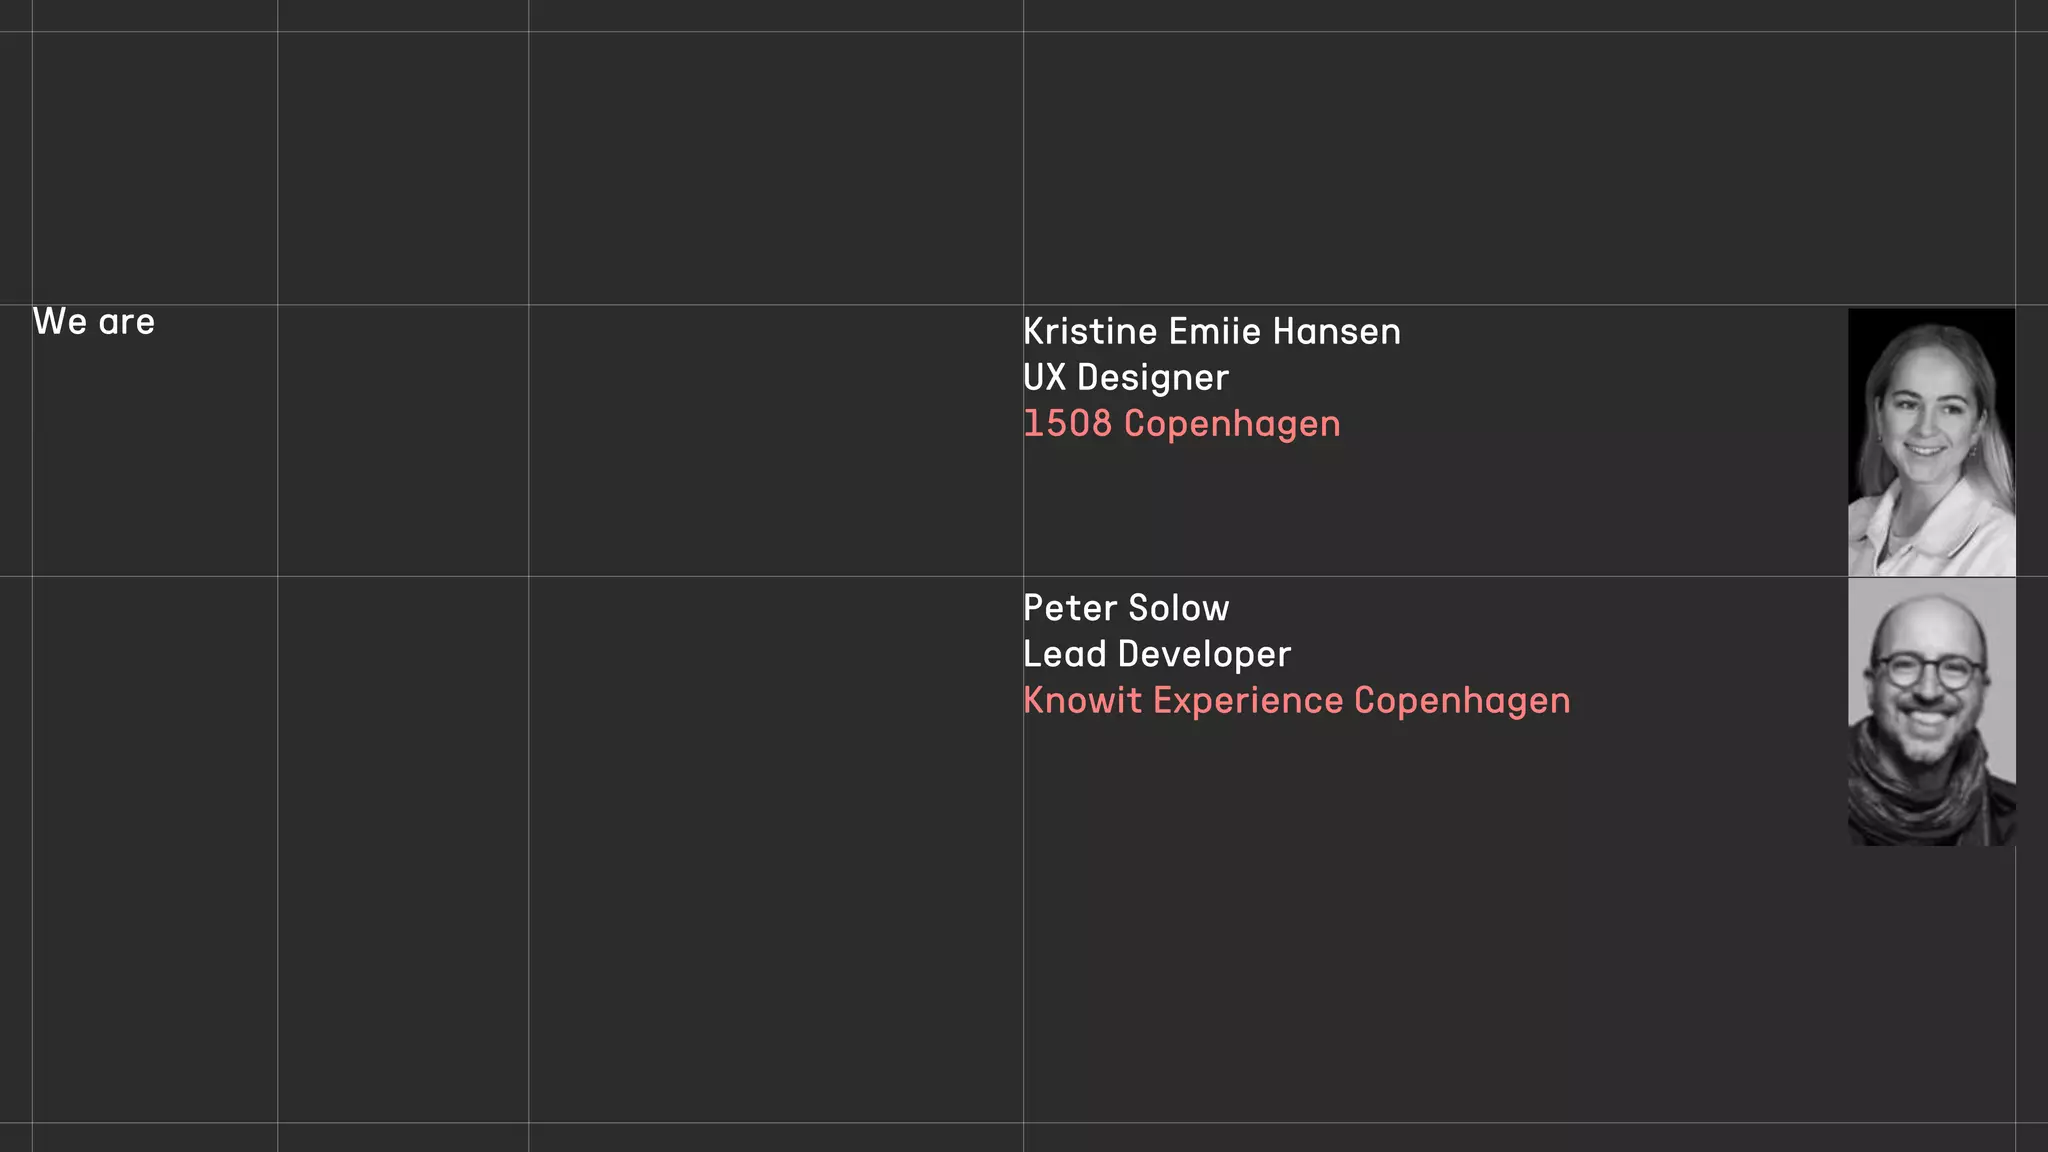
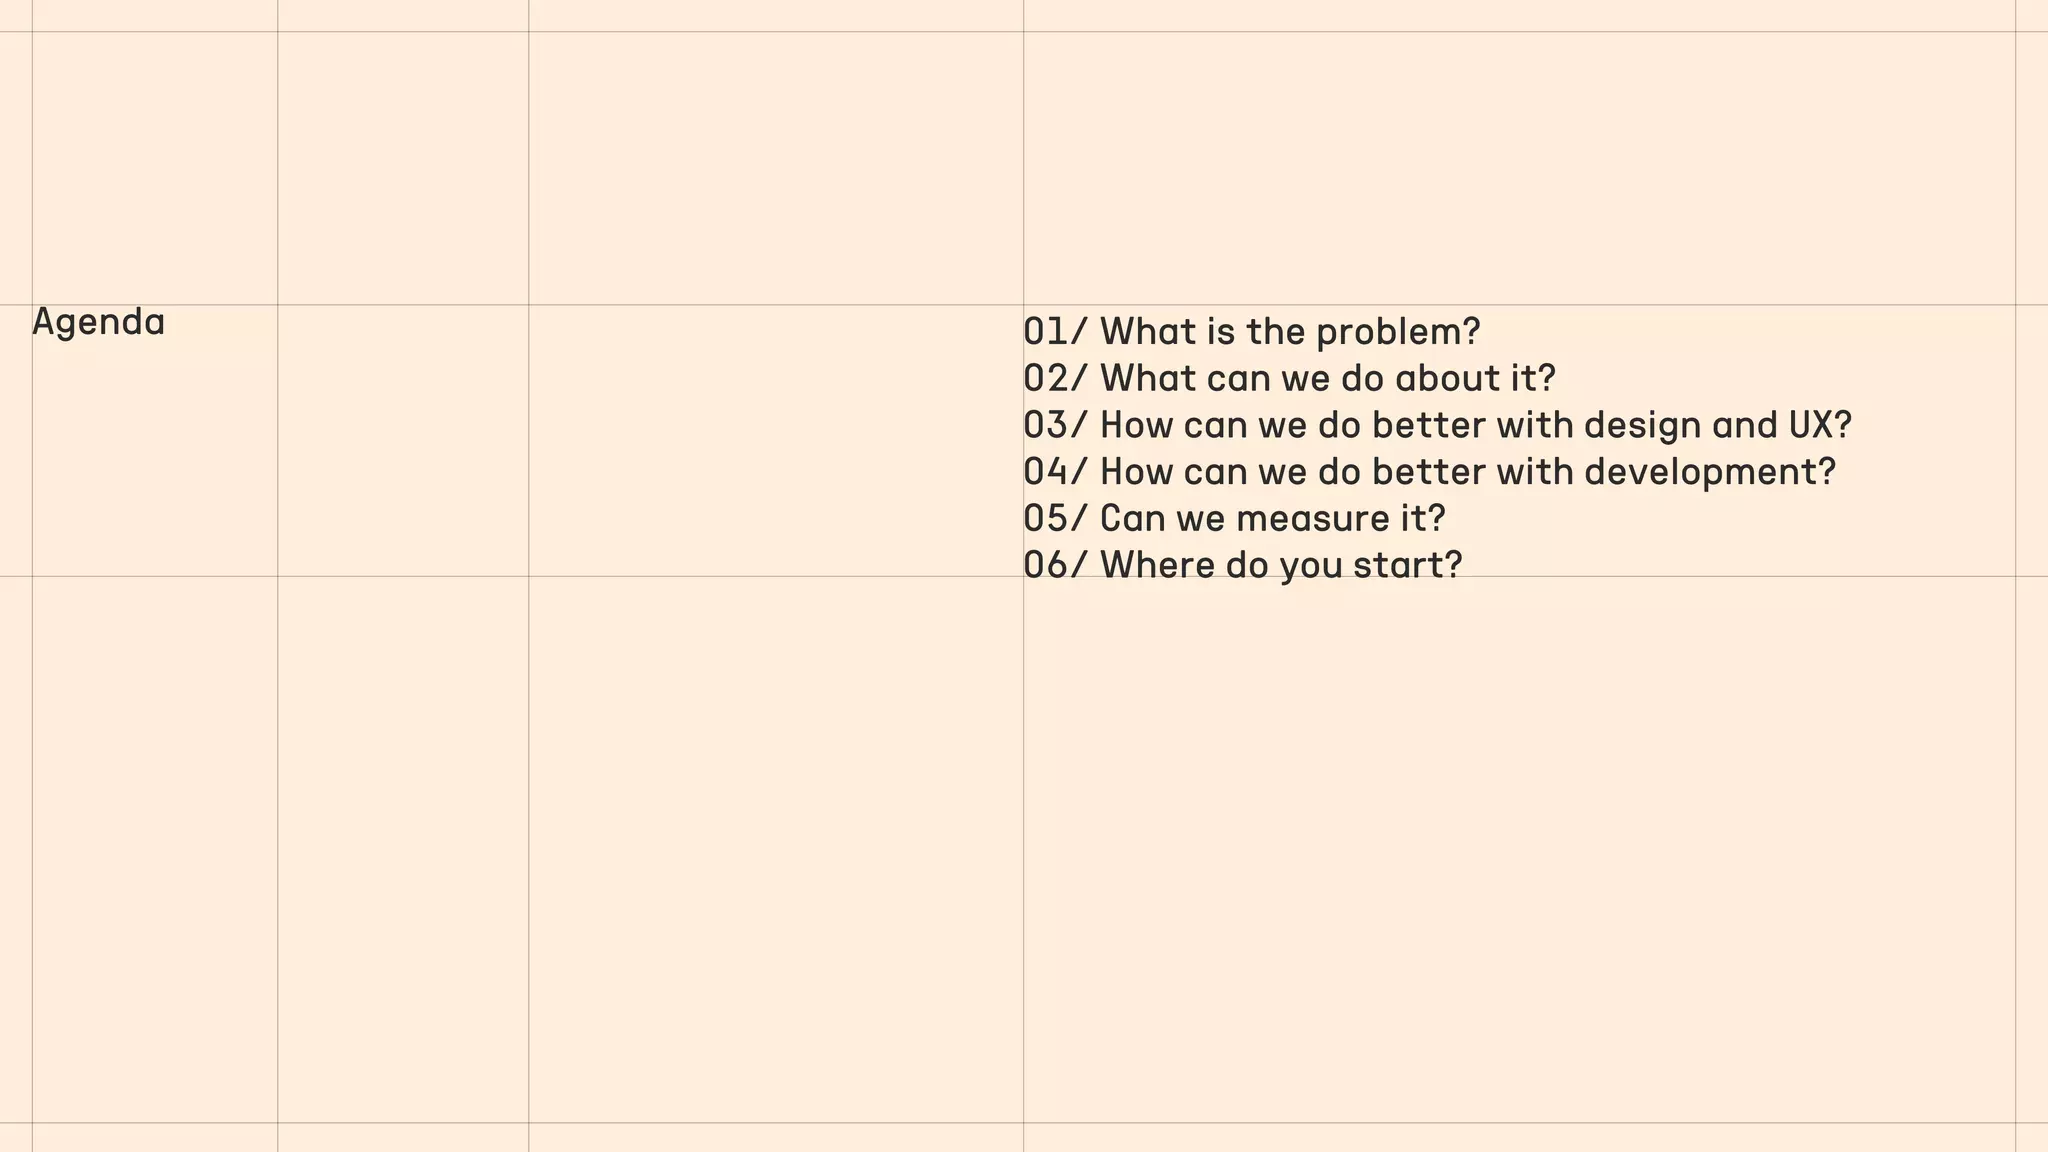
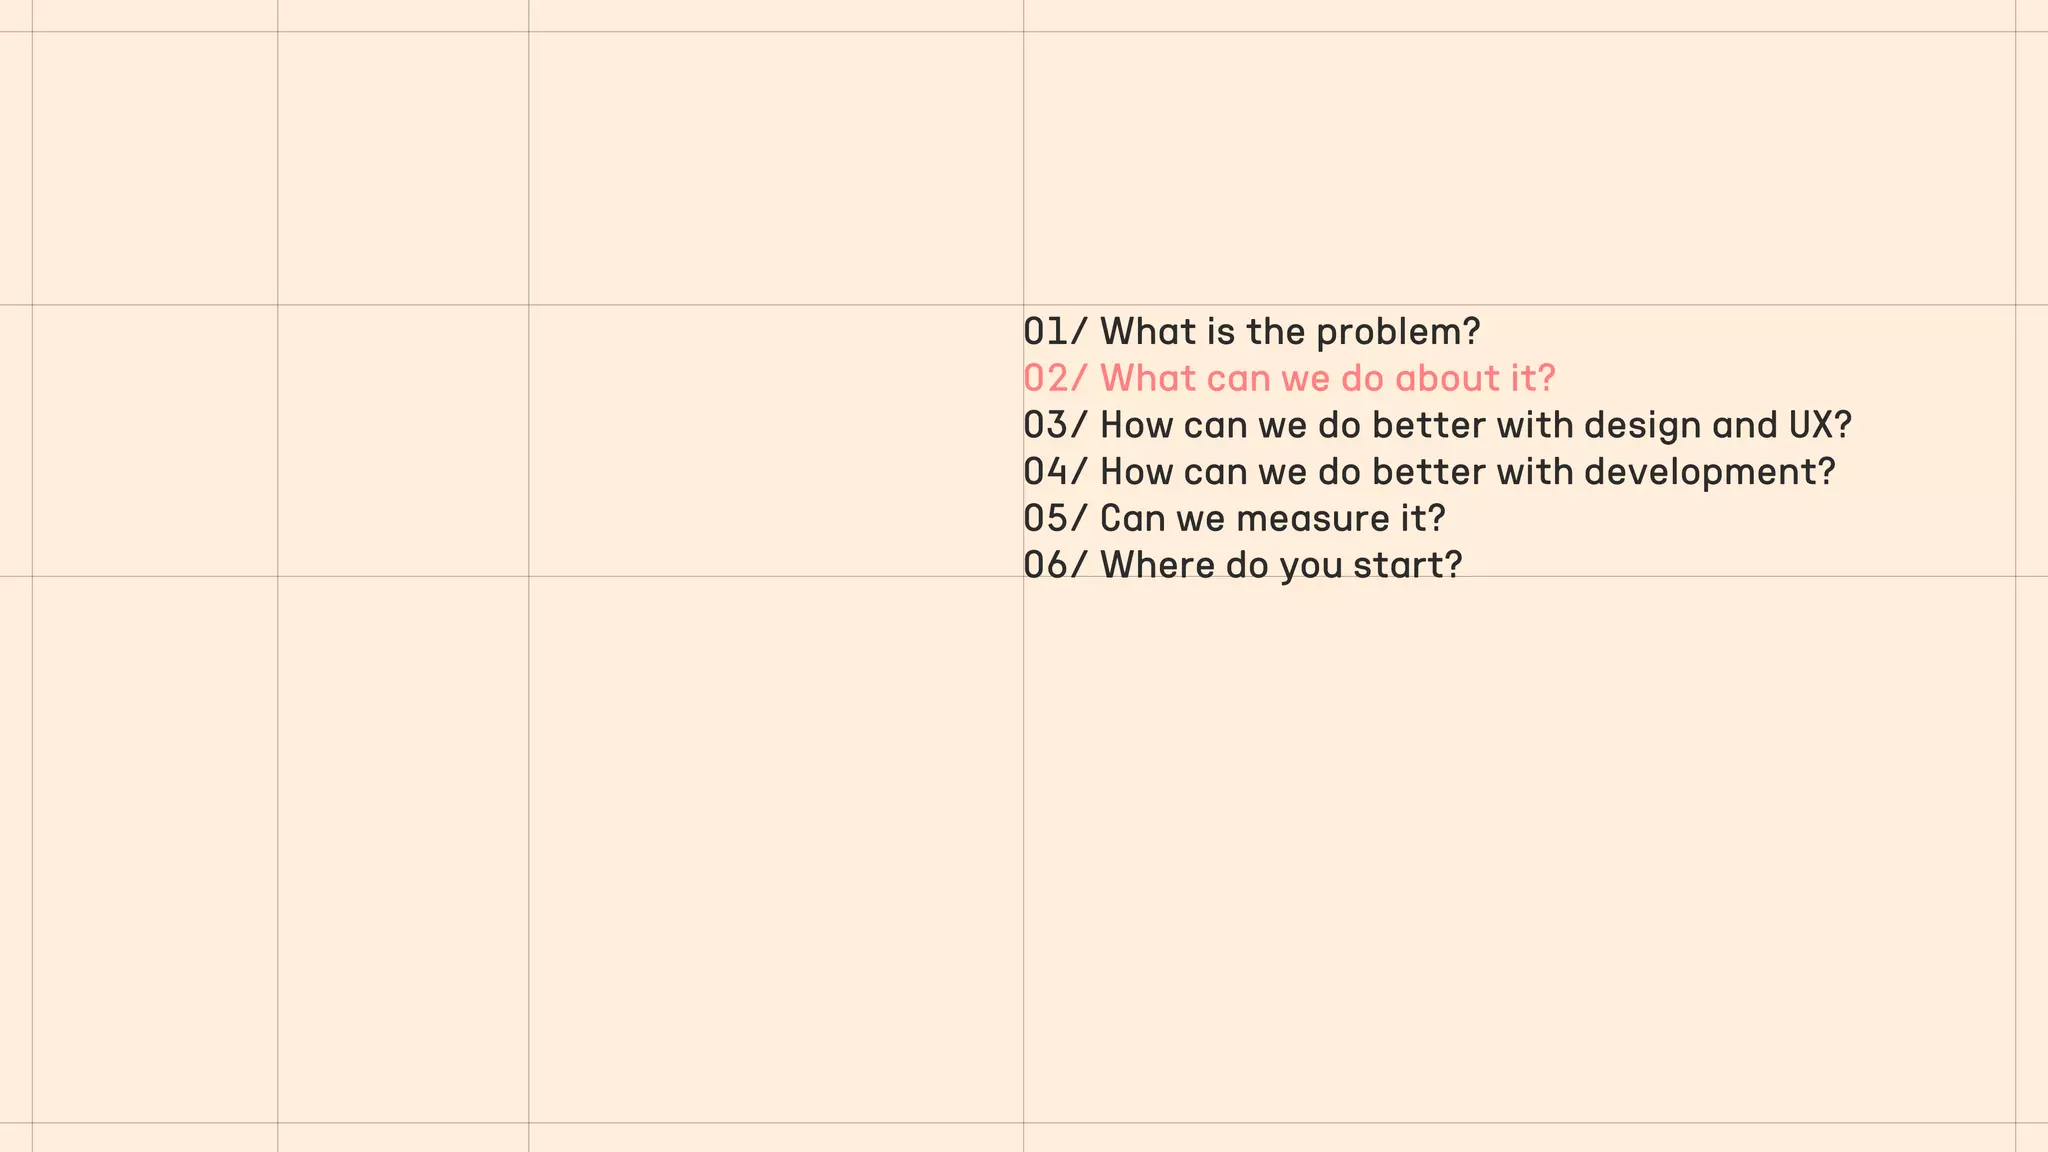
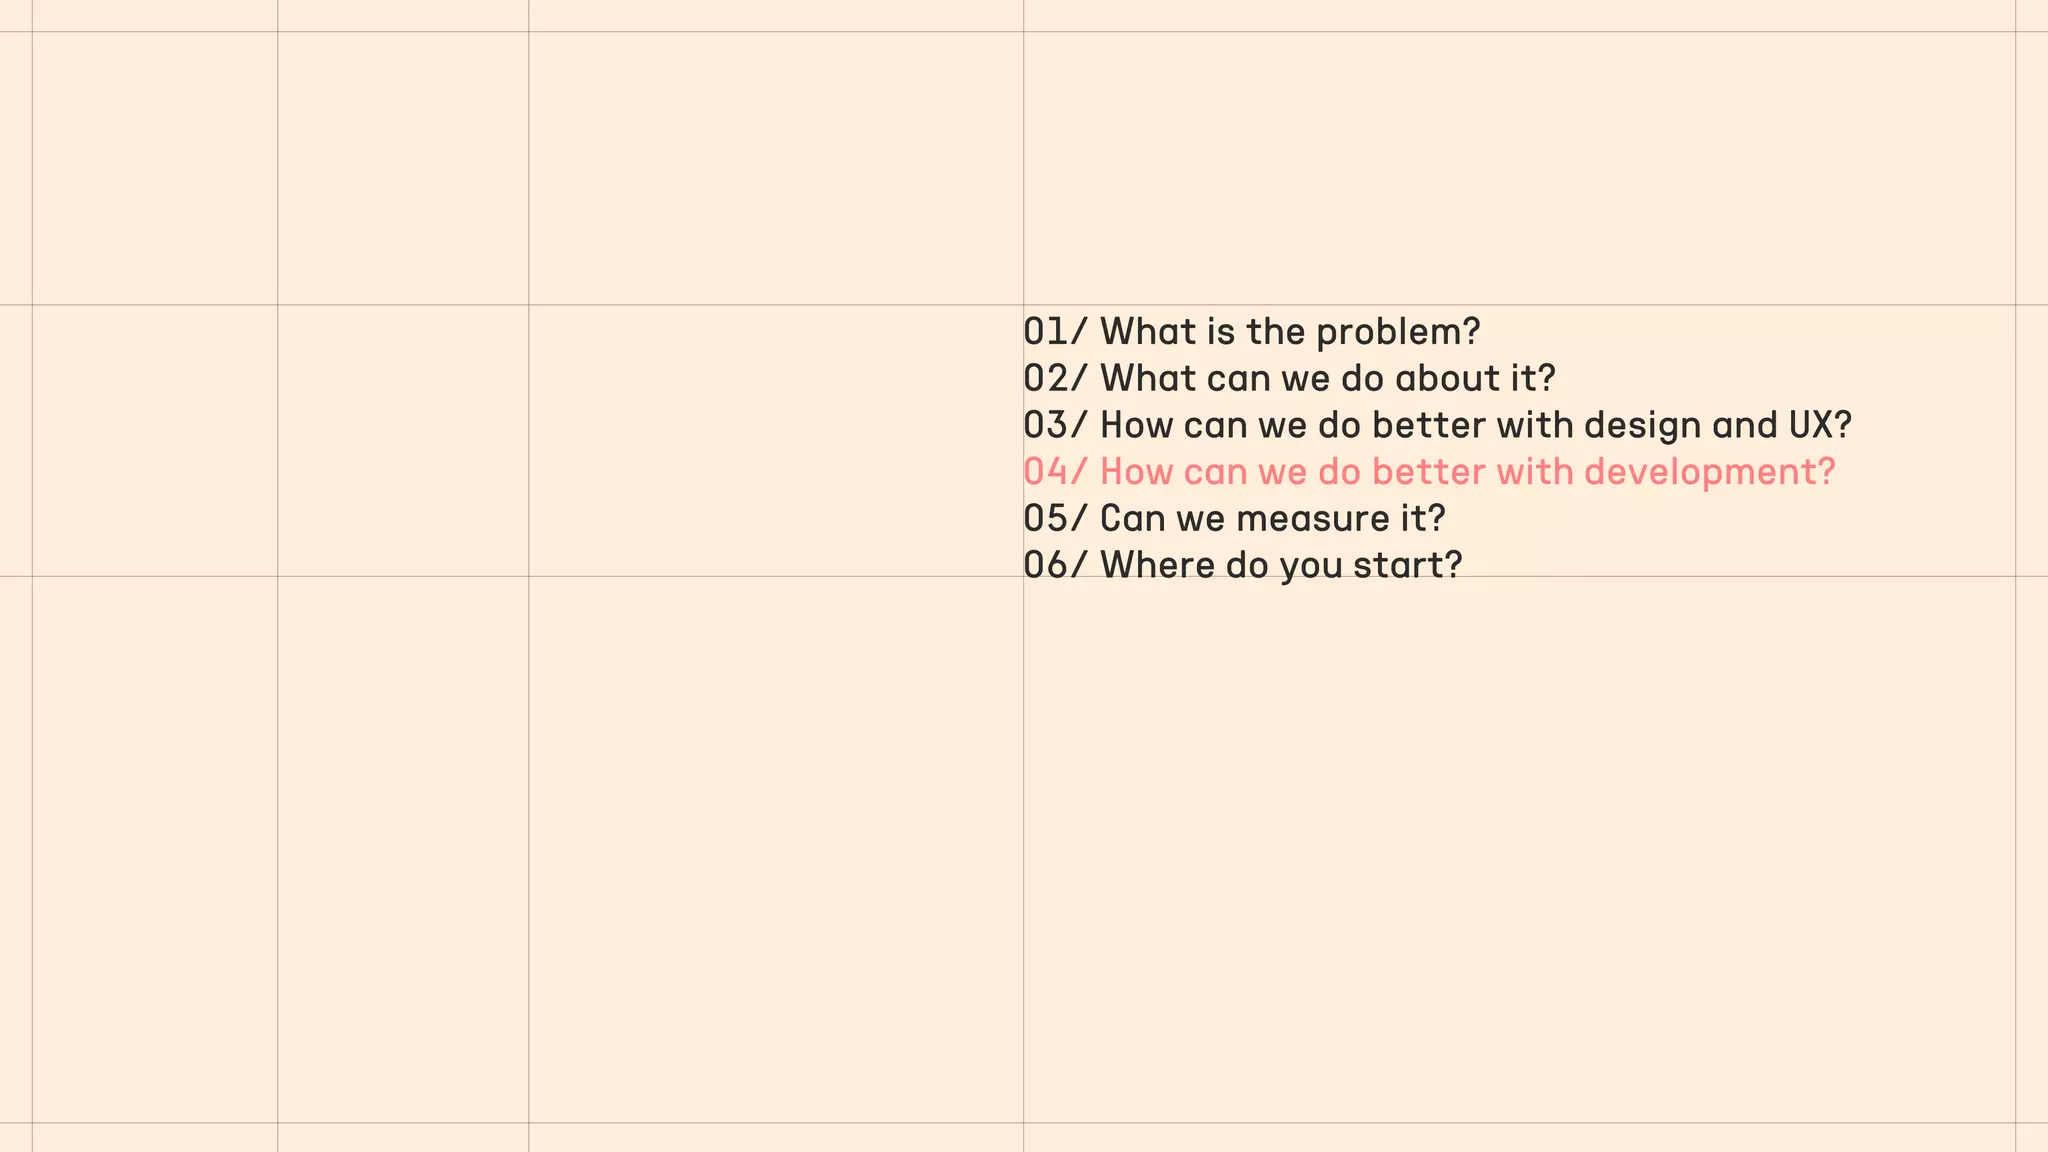
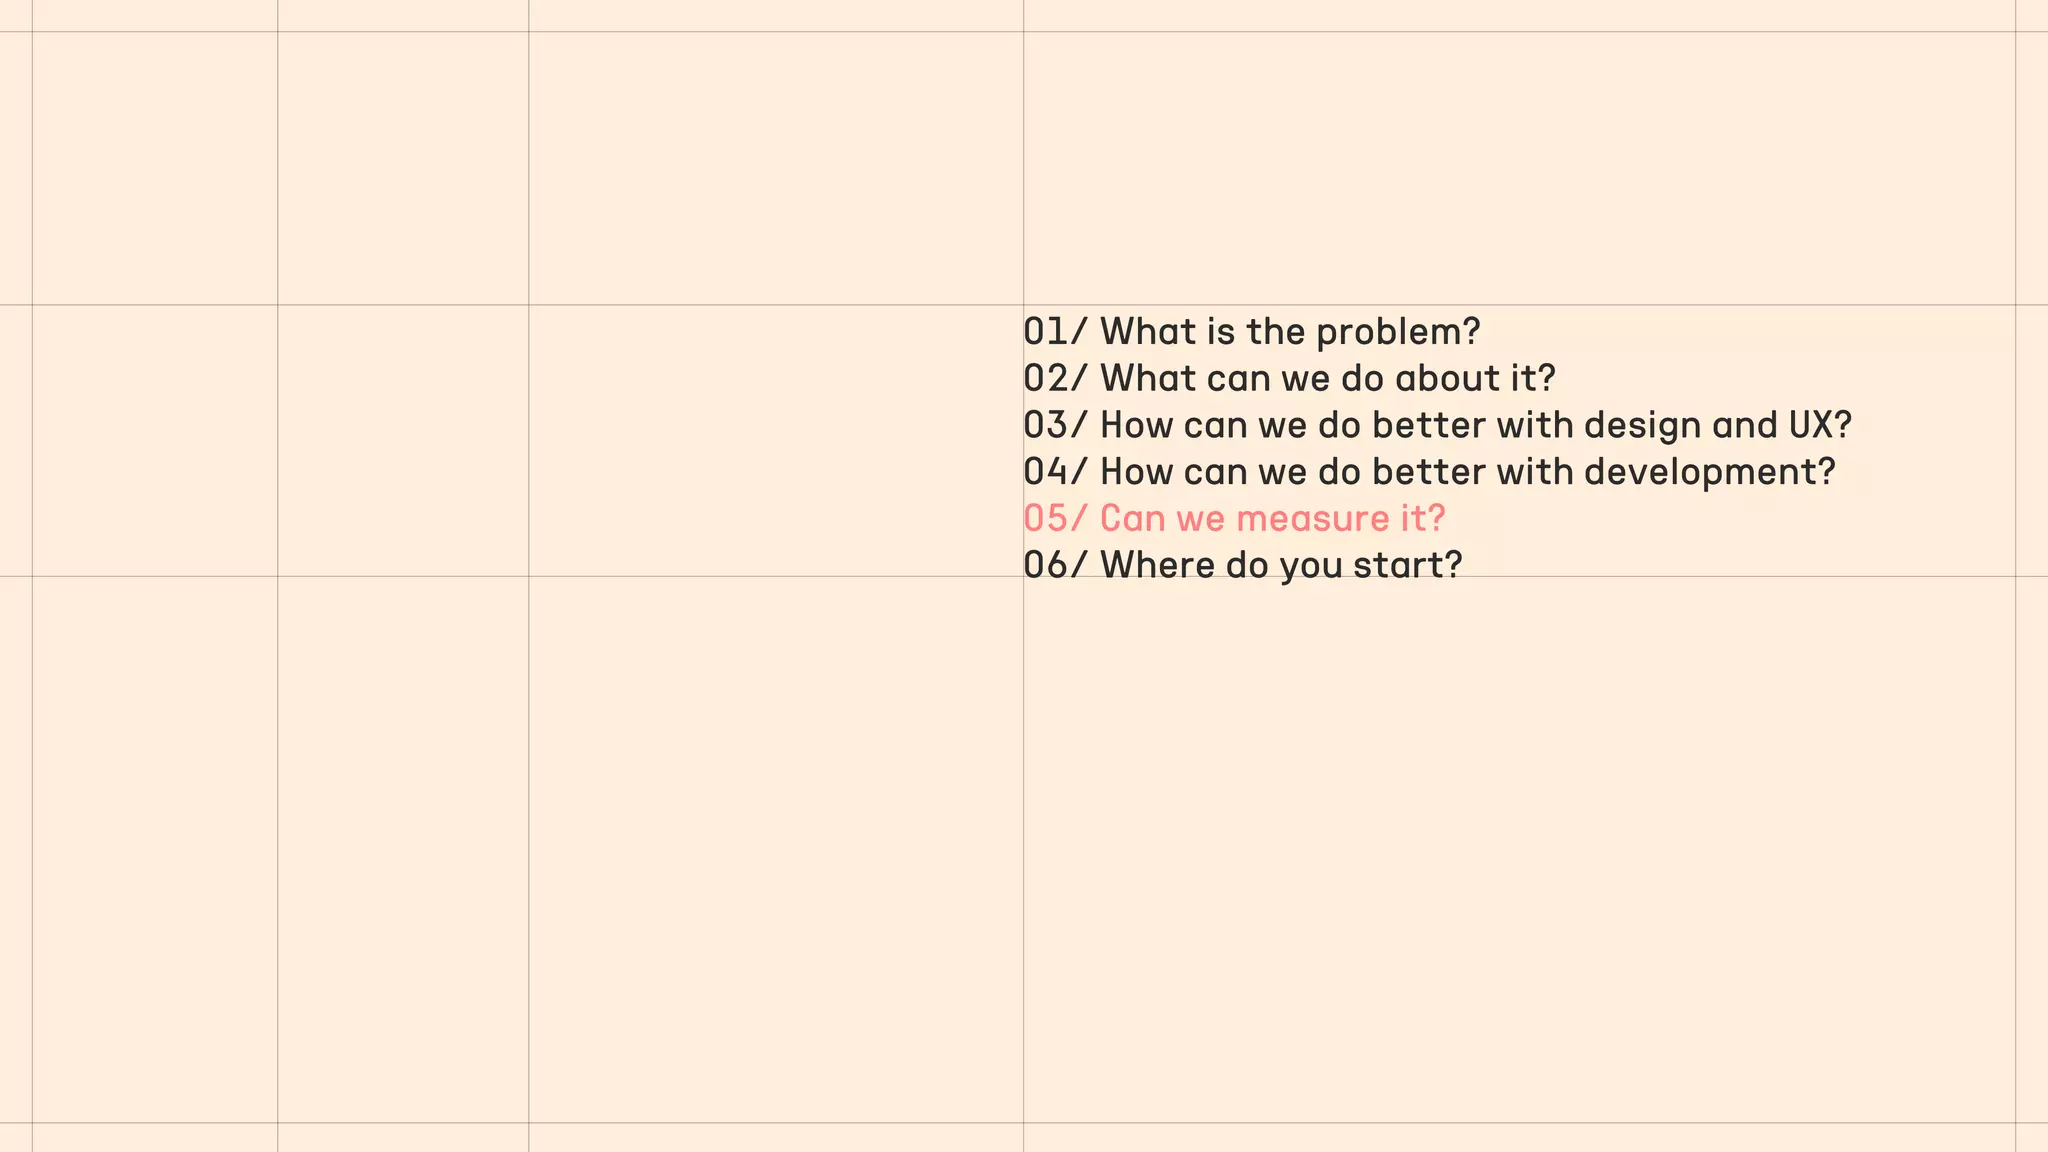
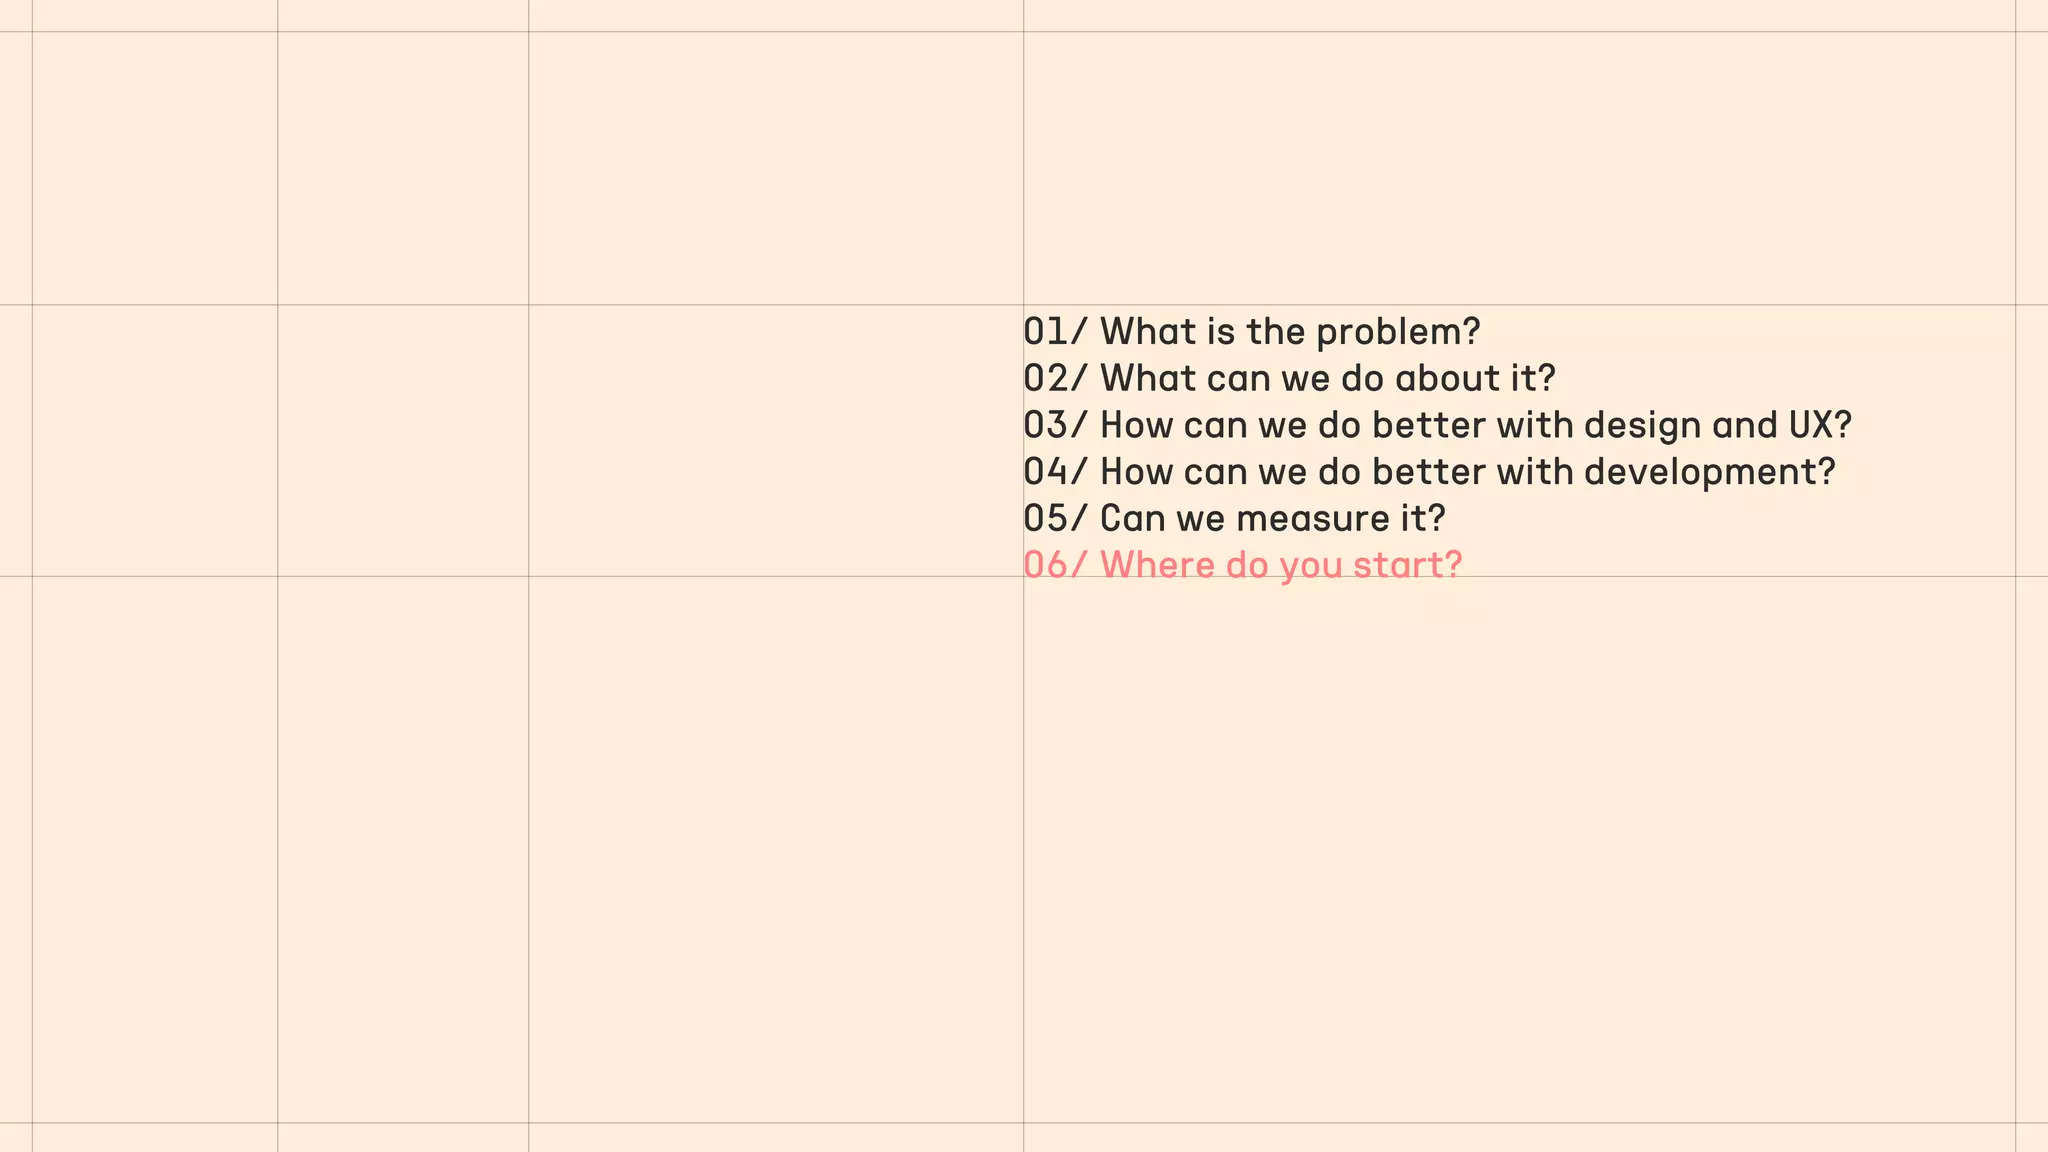
Introduction by presenters Kristine Emiie Hansen and Peter Solow; overview of the presentation agenda.
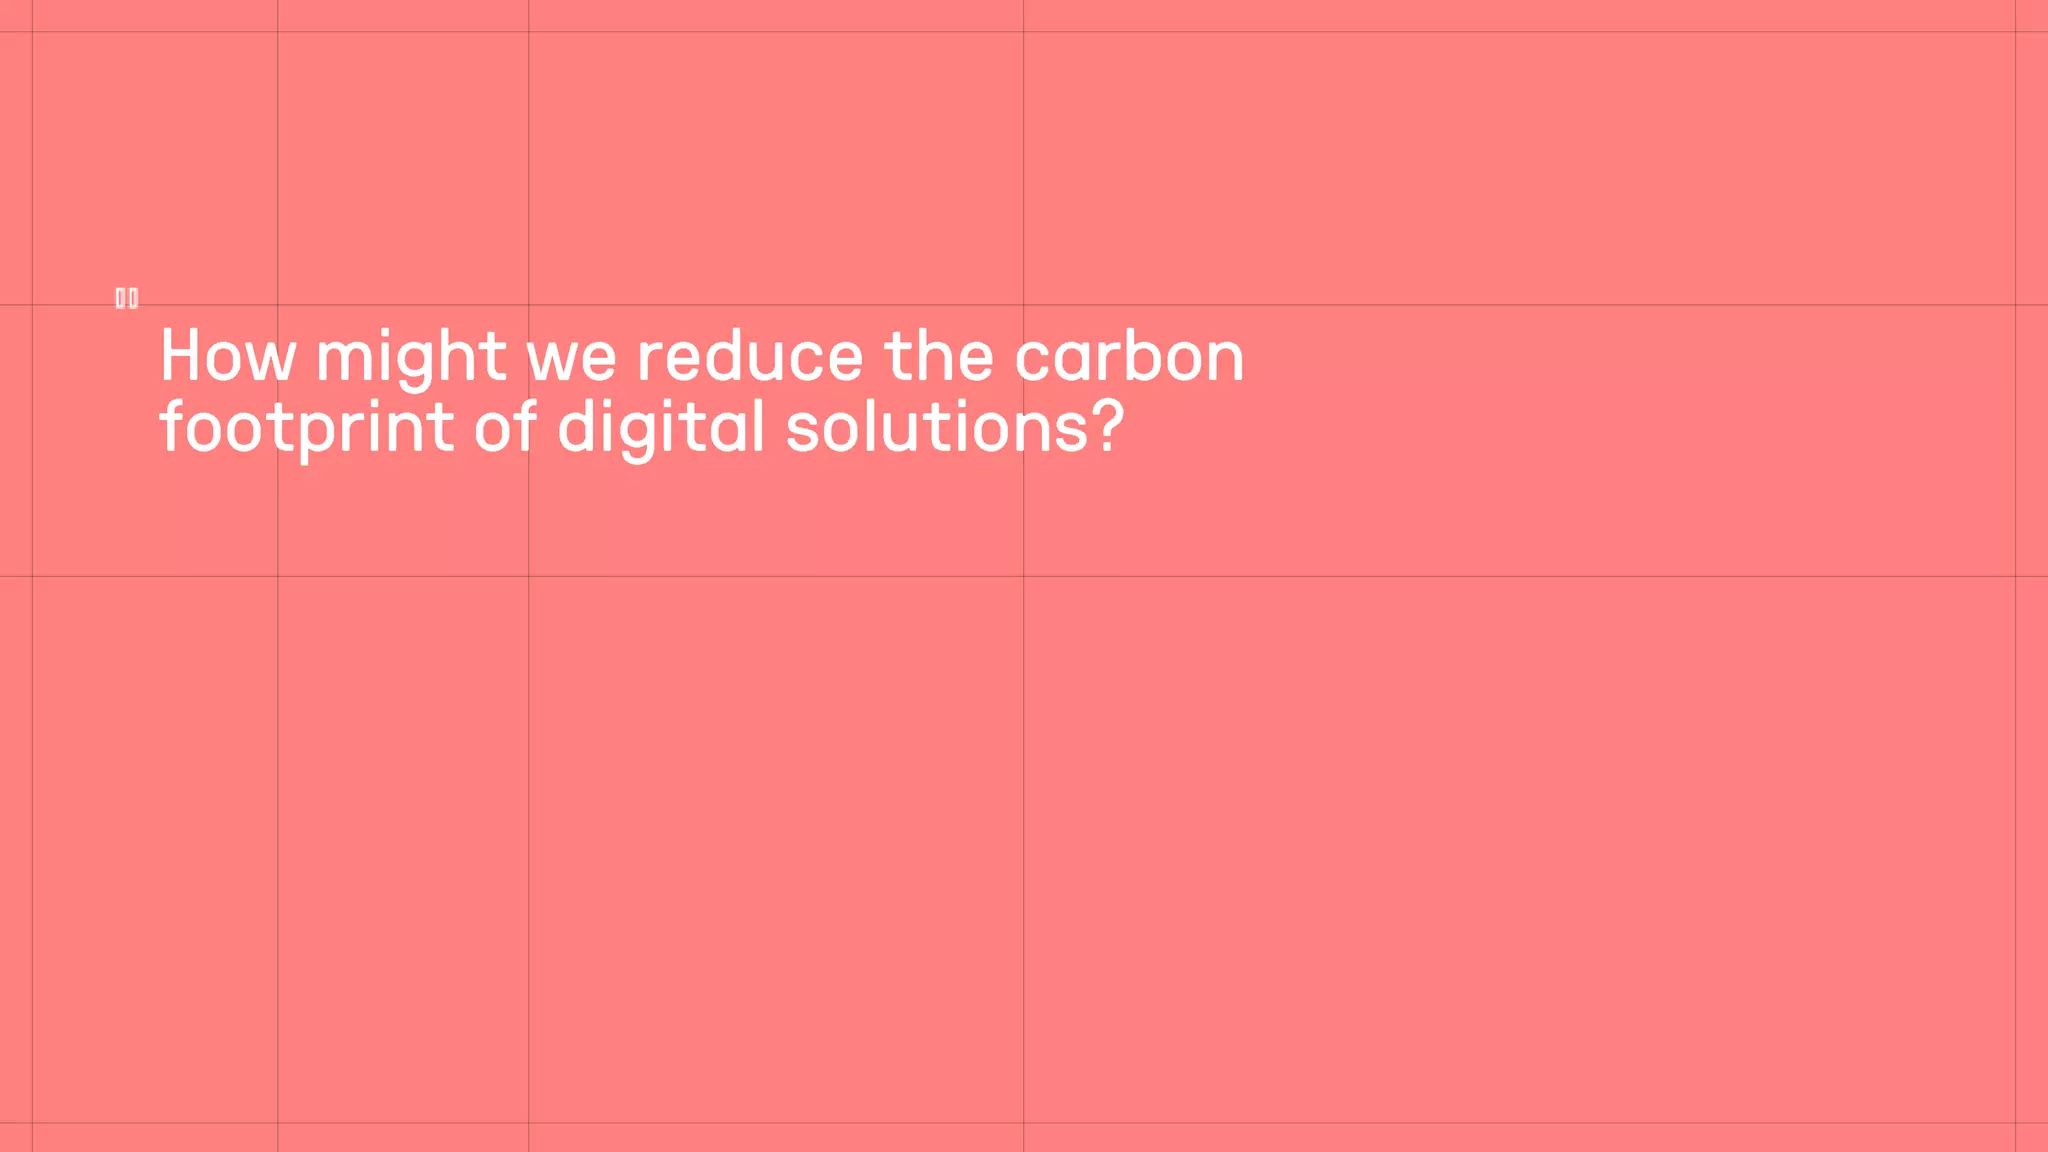
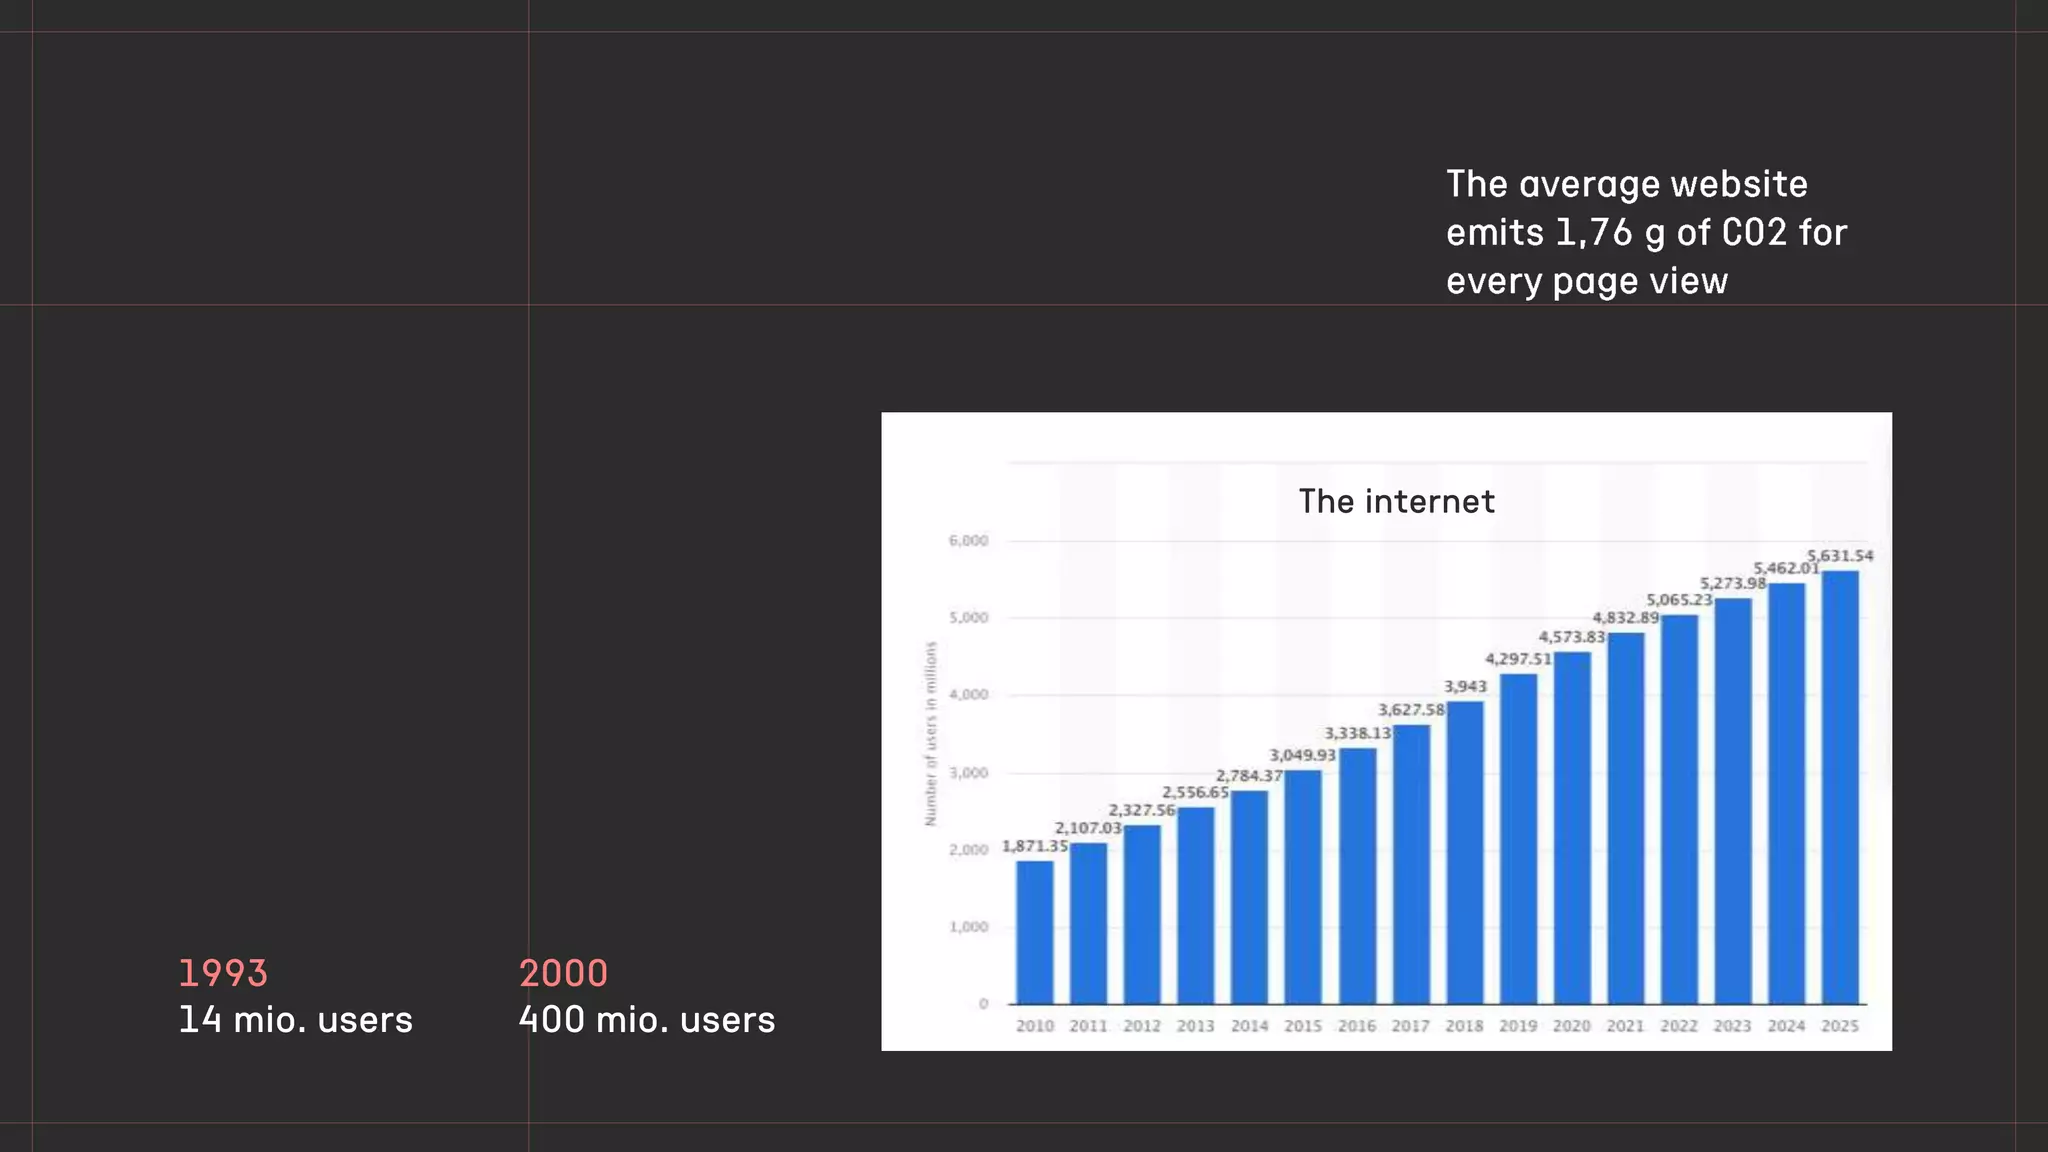
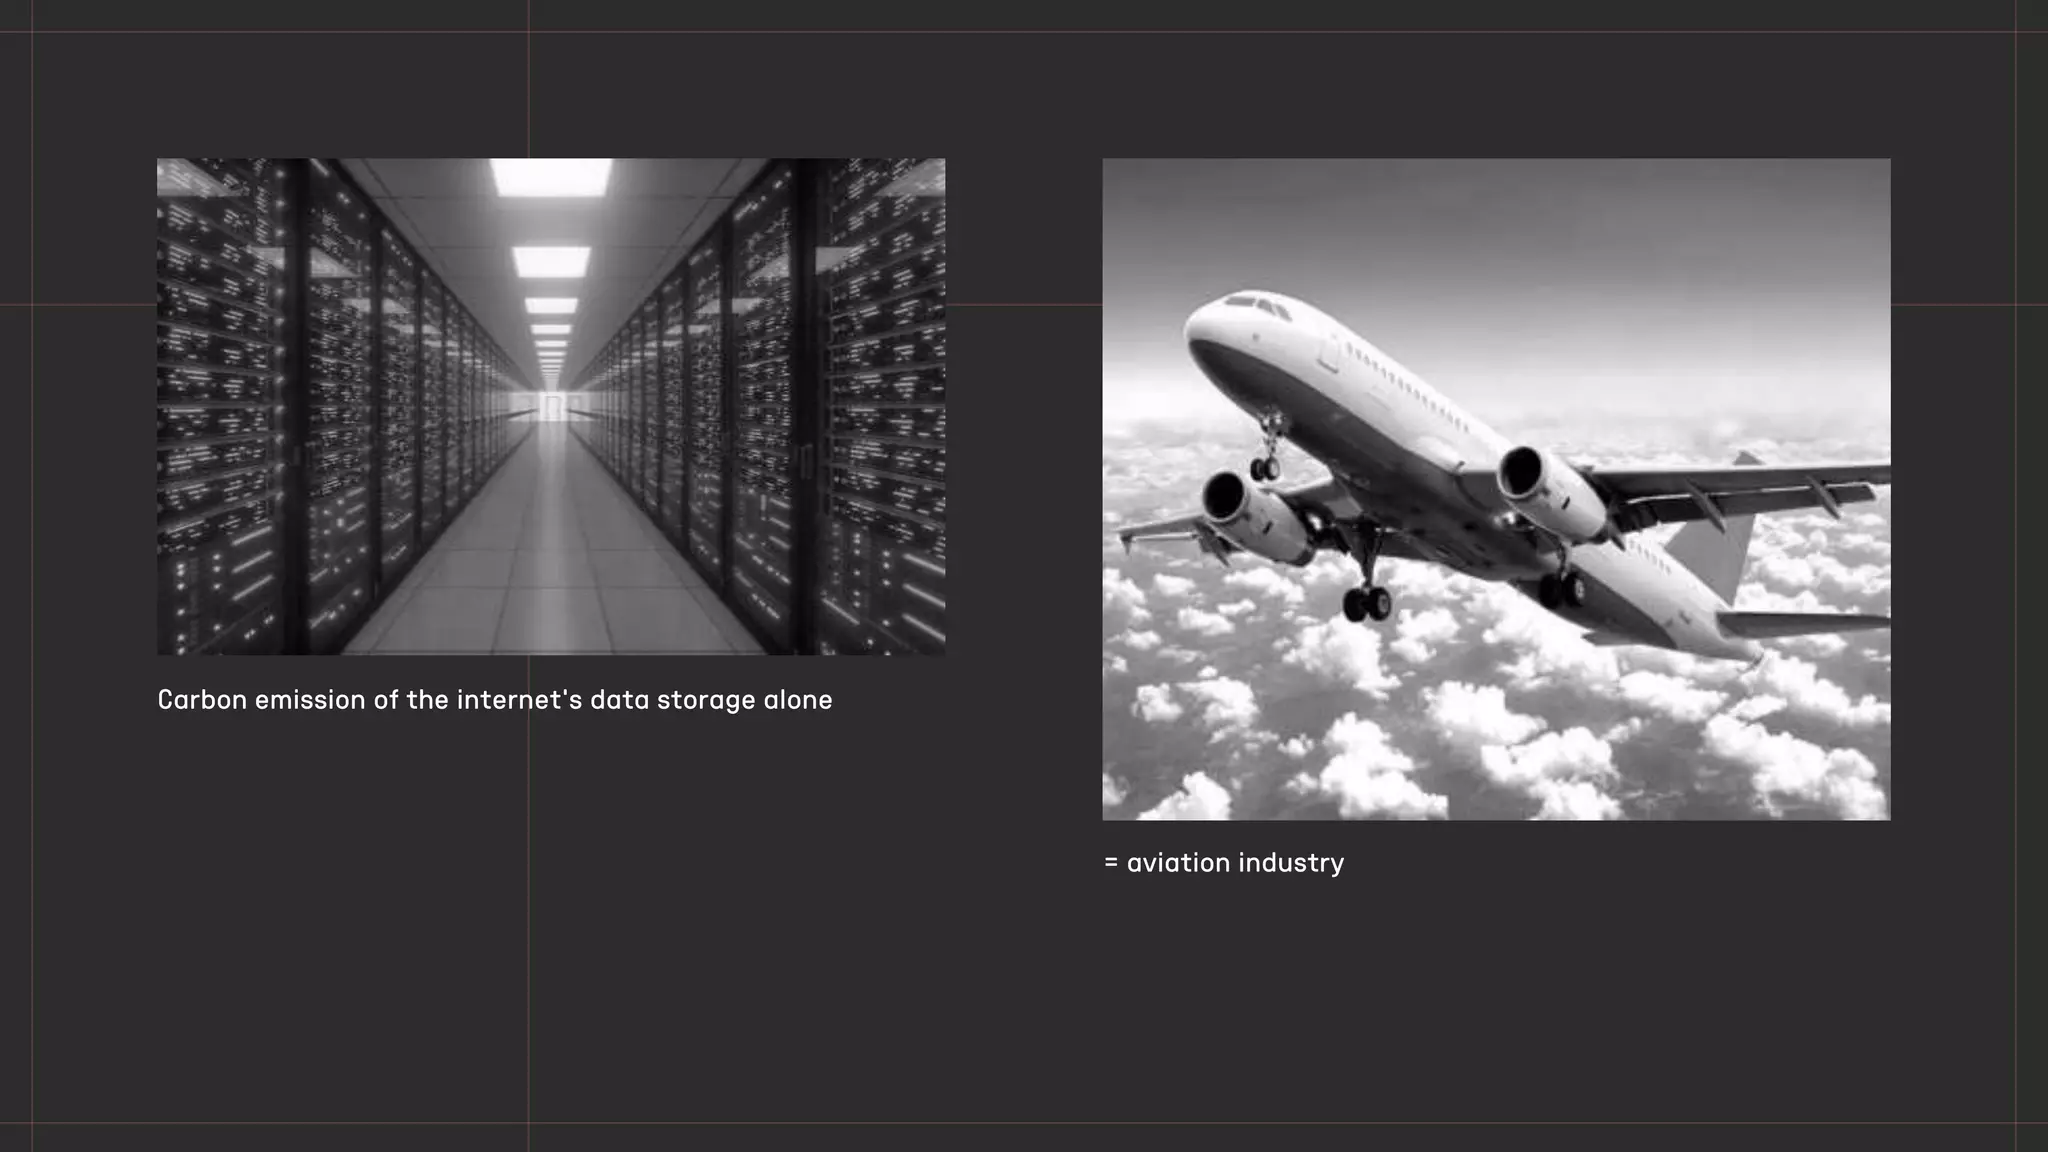
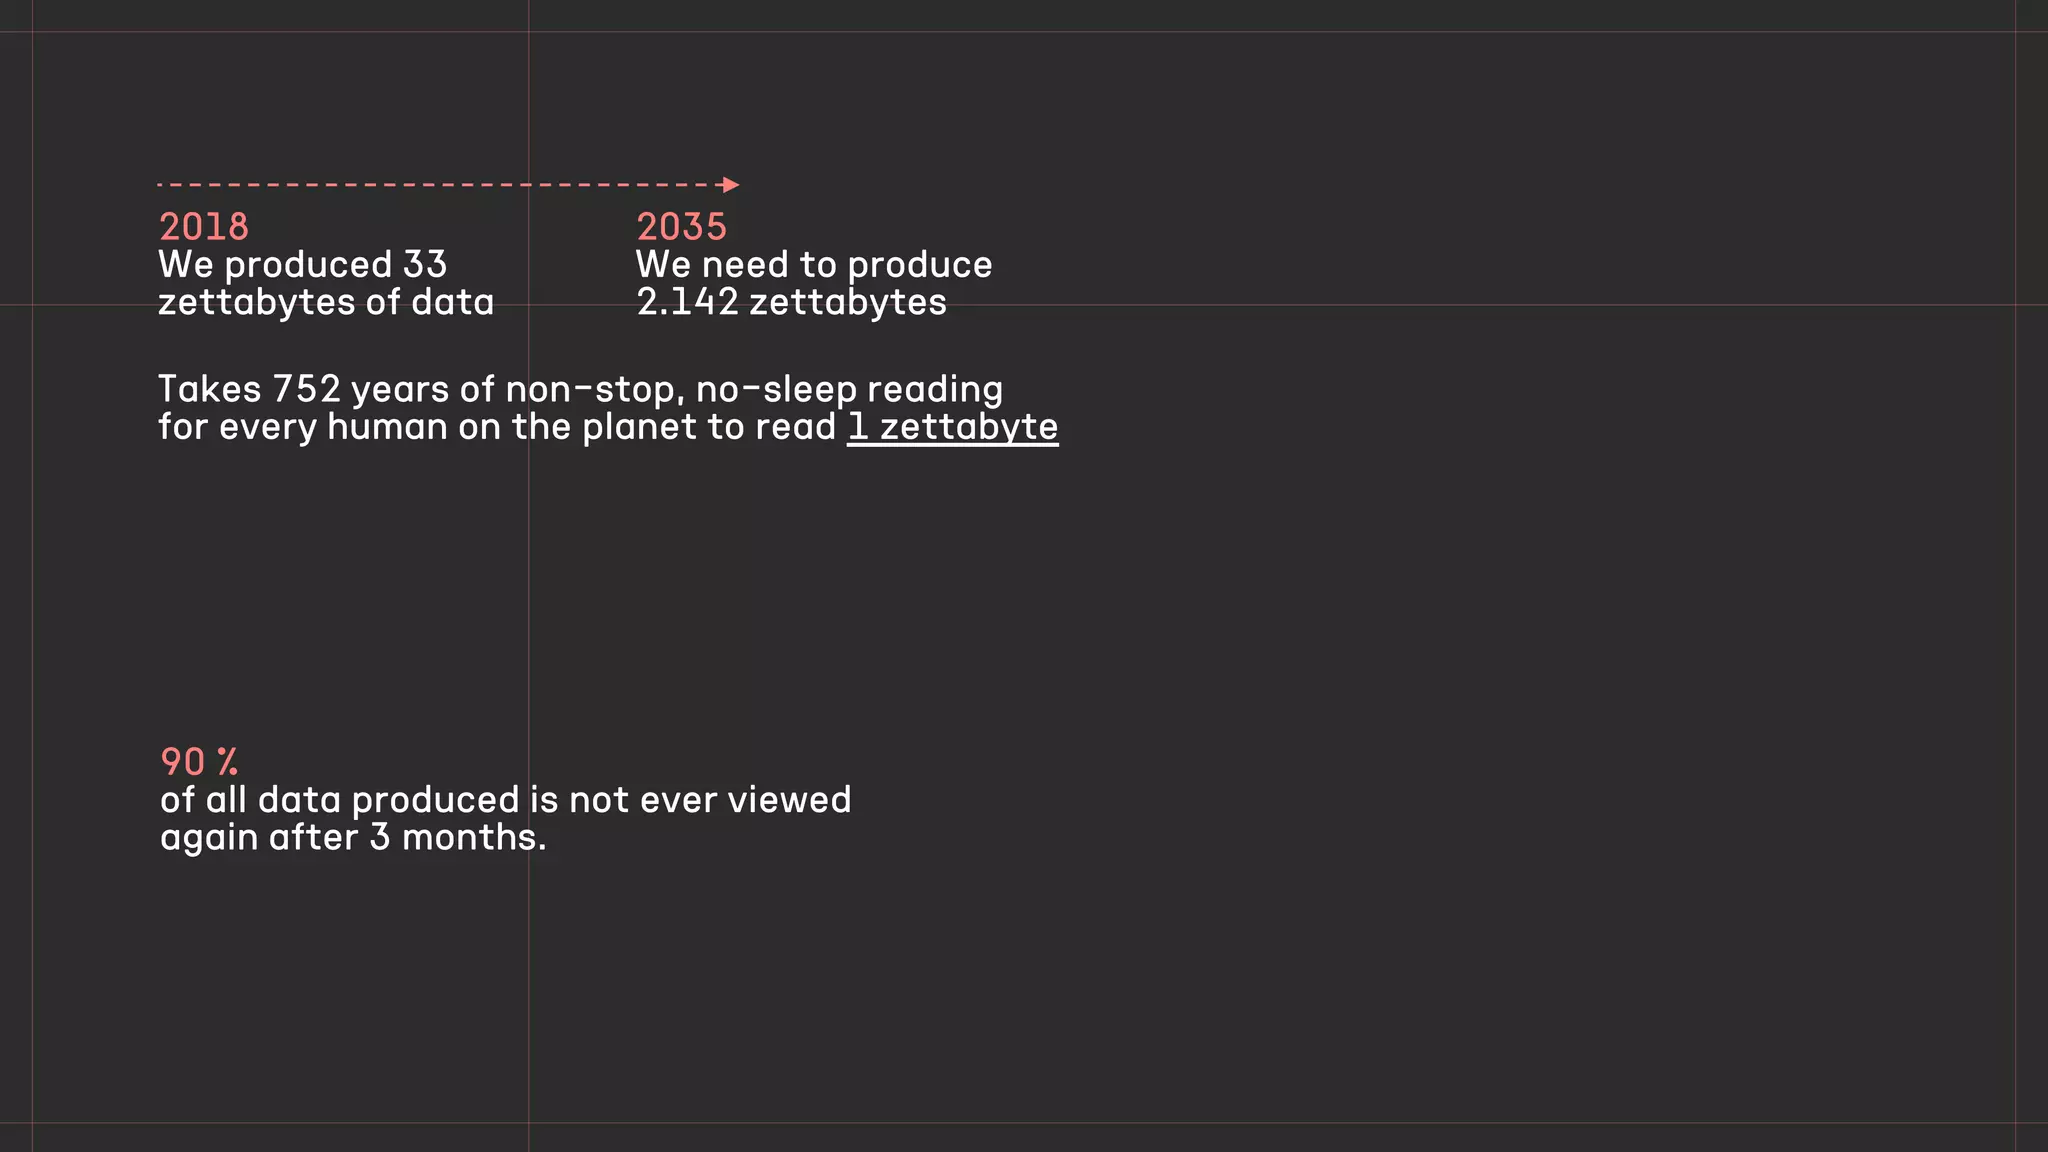
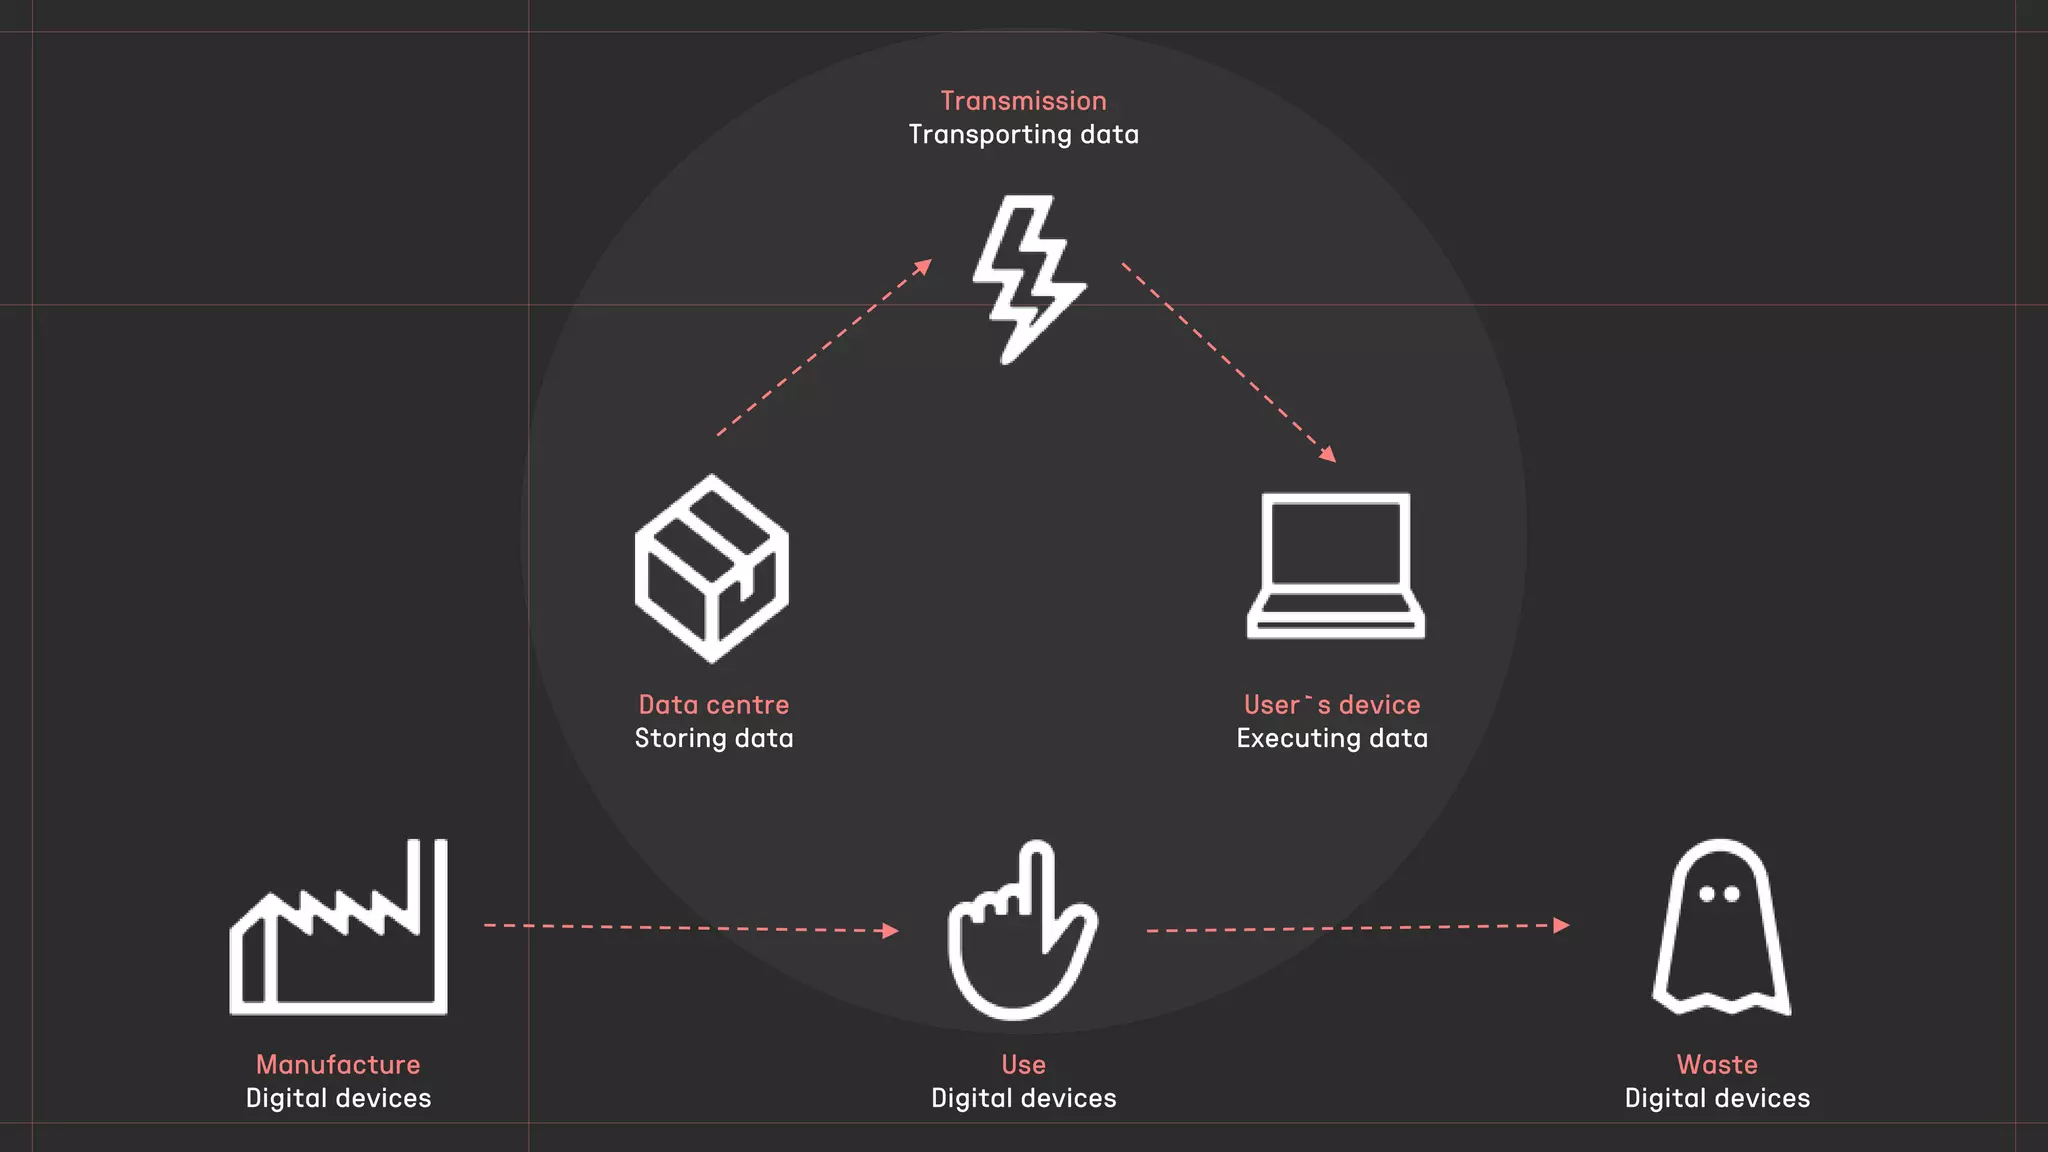
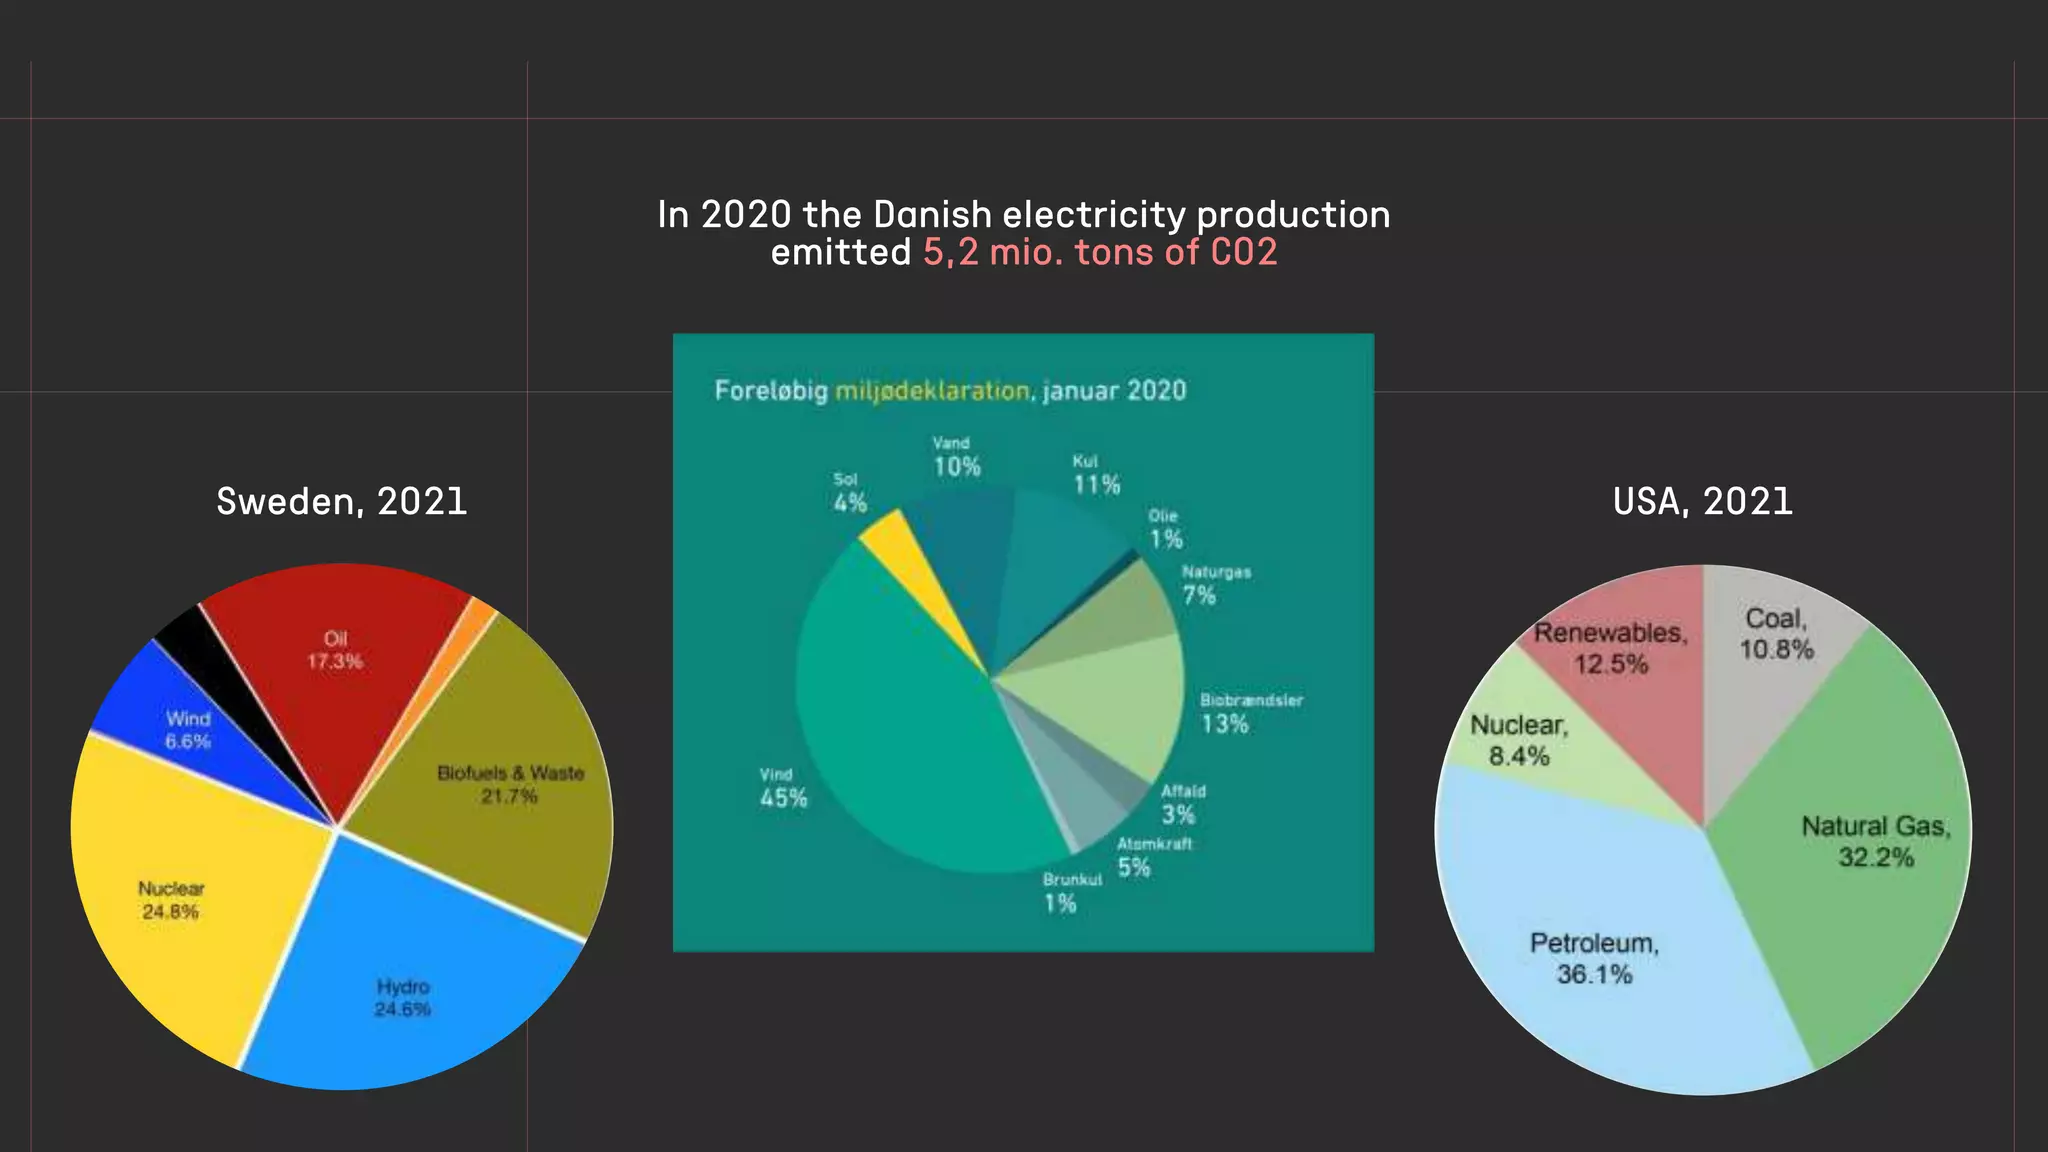
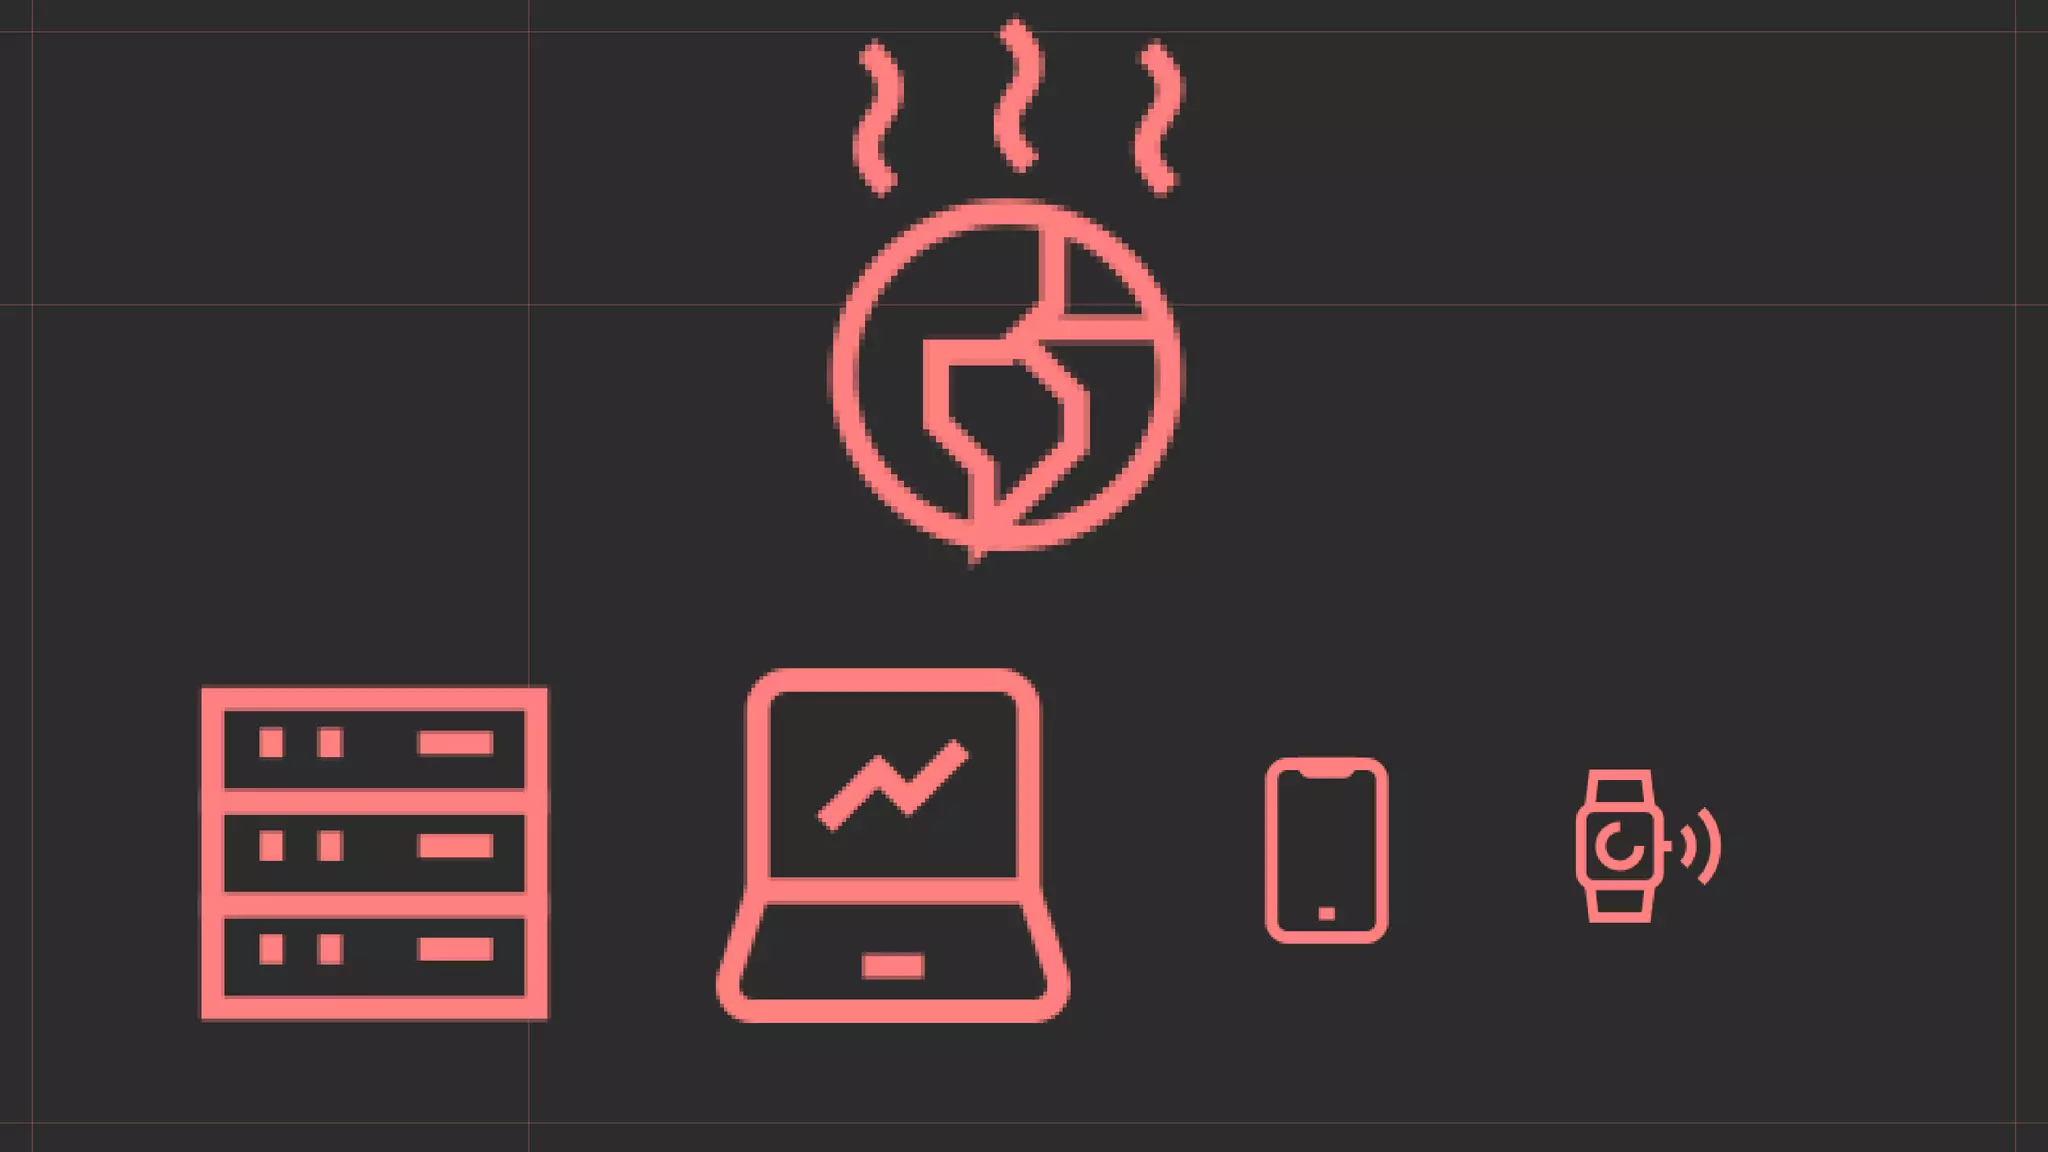
Discussion of the problems, including carbon emissions, waste, and data issues, highlighting the environmental challenges of the internet. Explores carbon emissions from digital devices and Danish electricity production statistics.
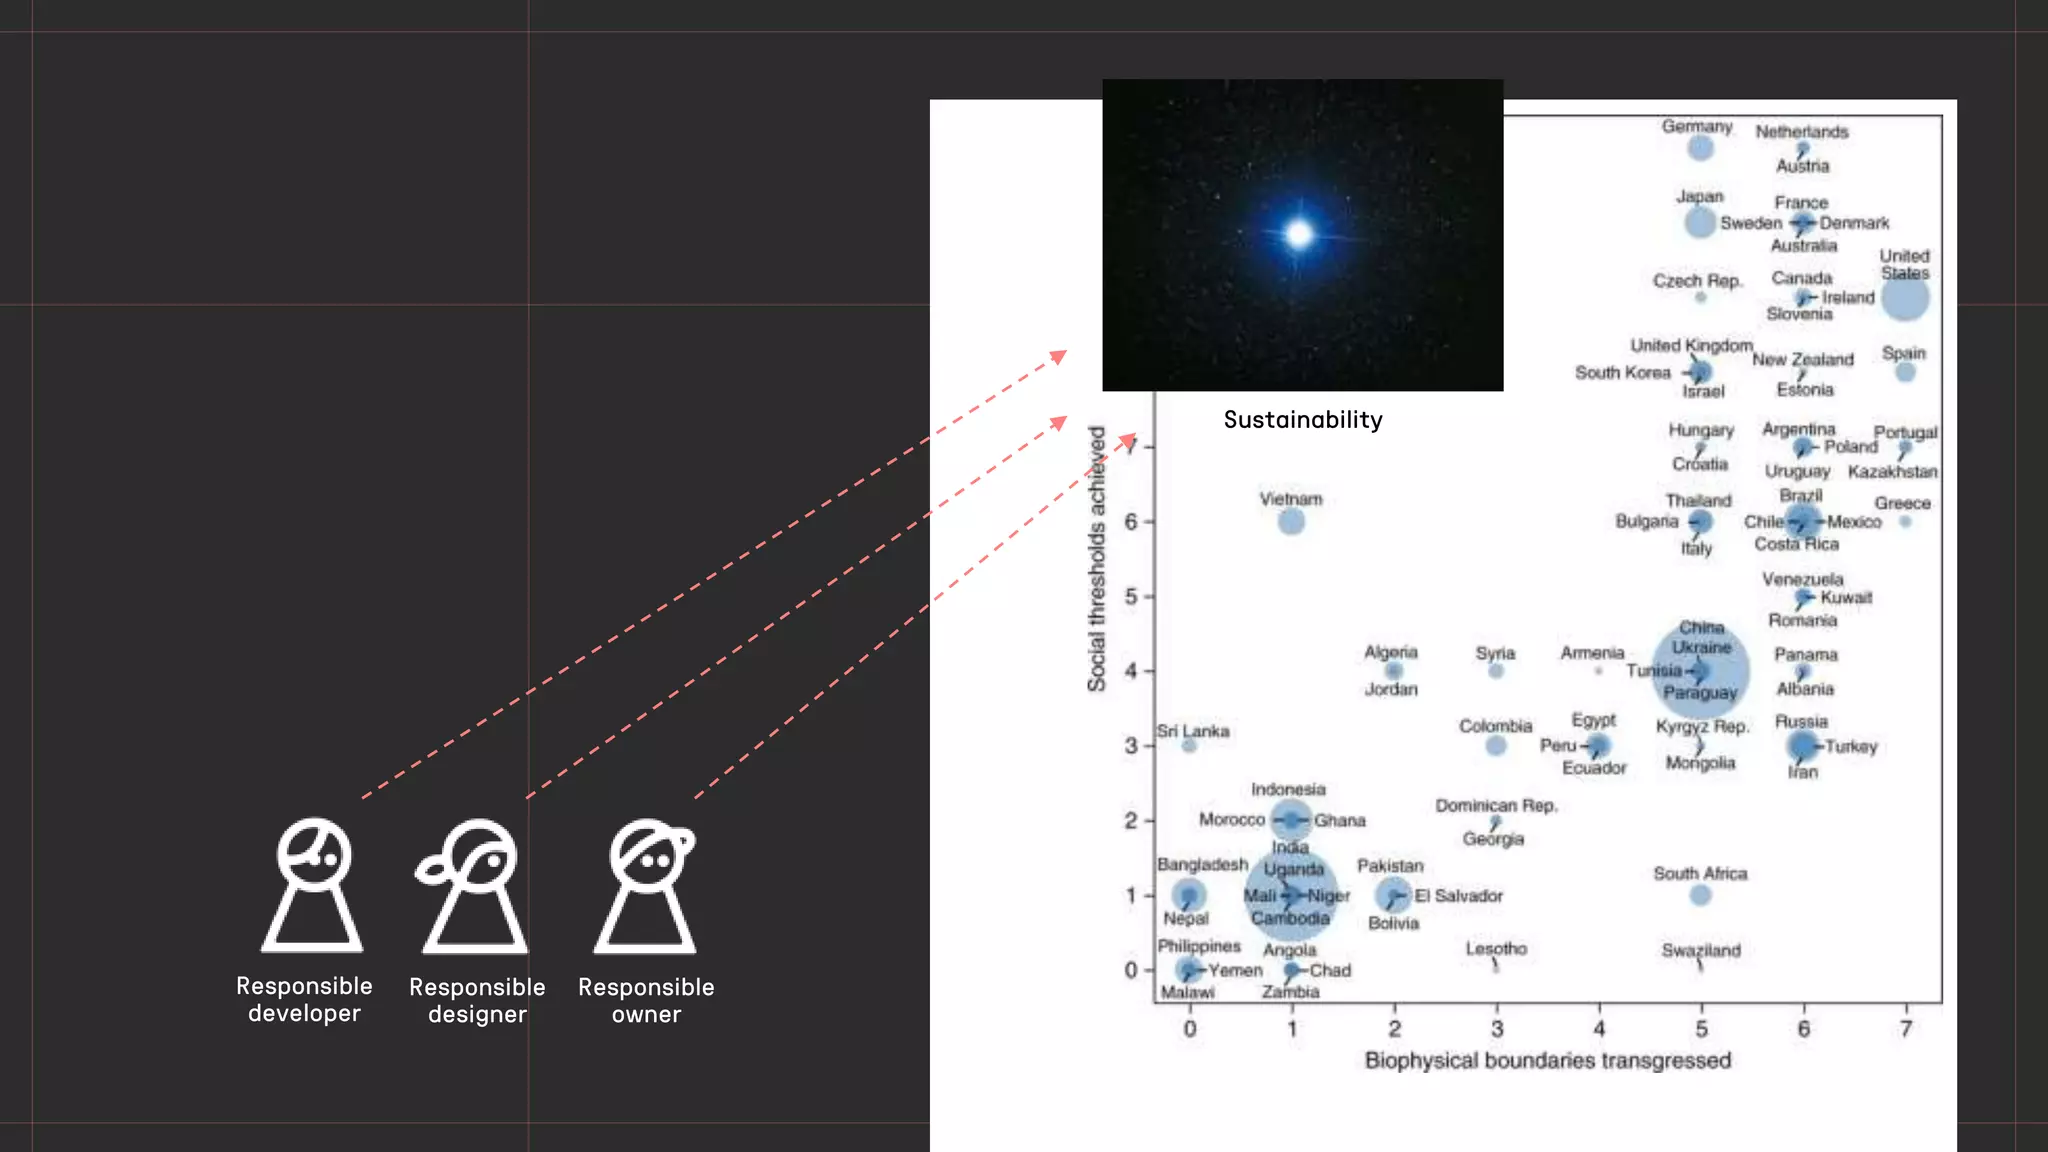
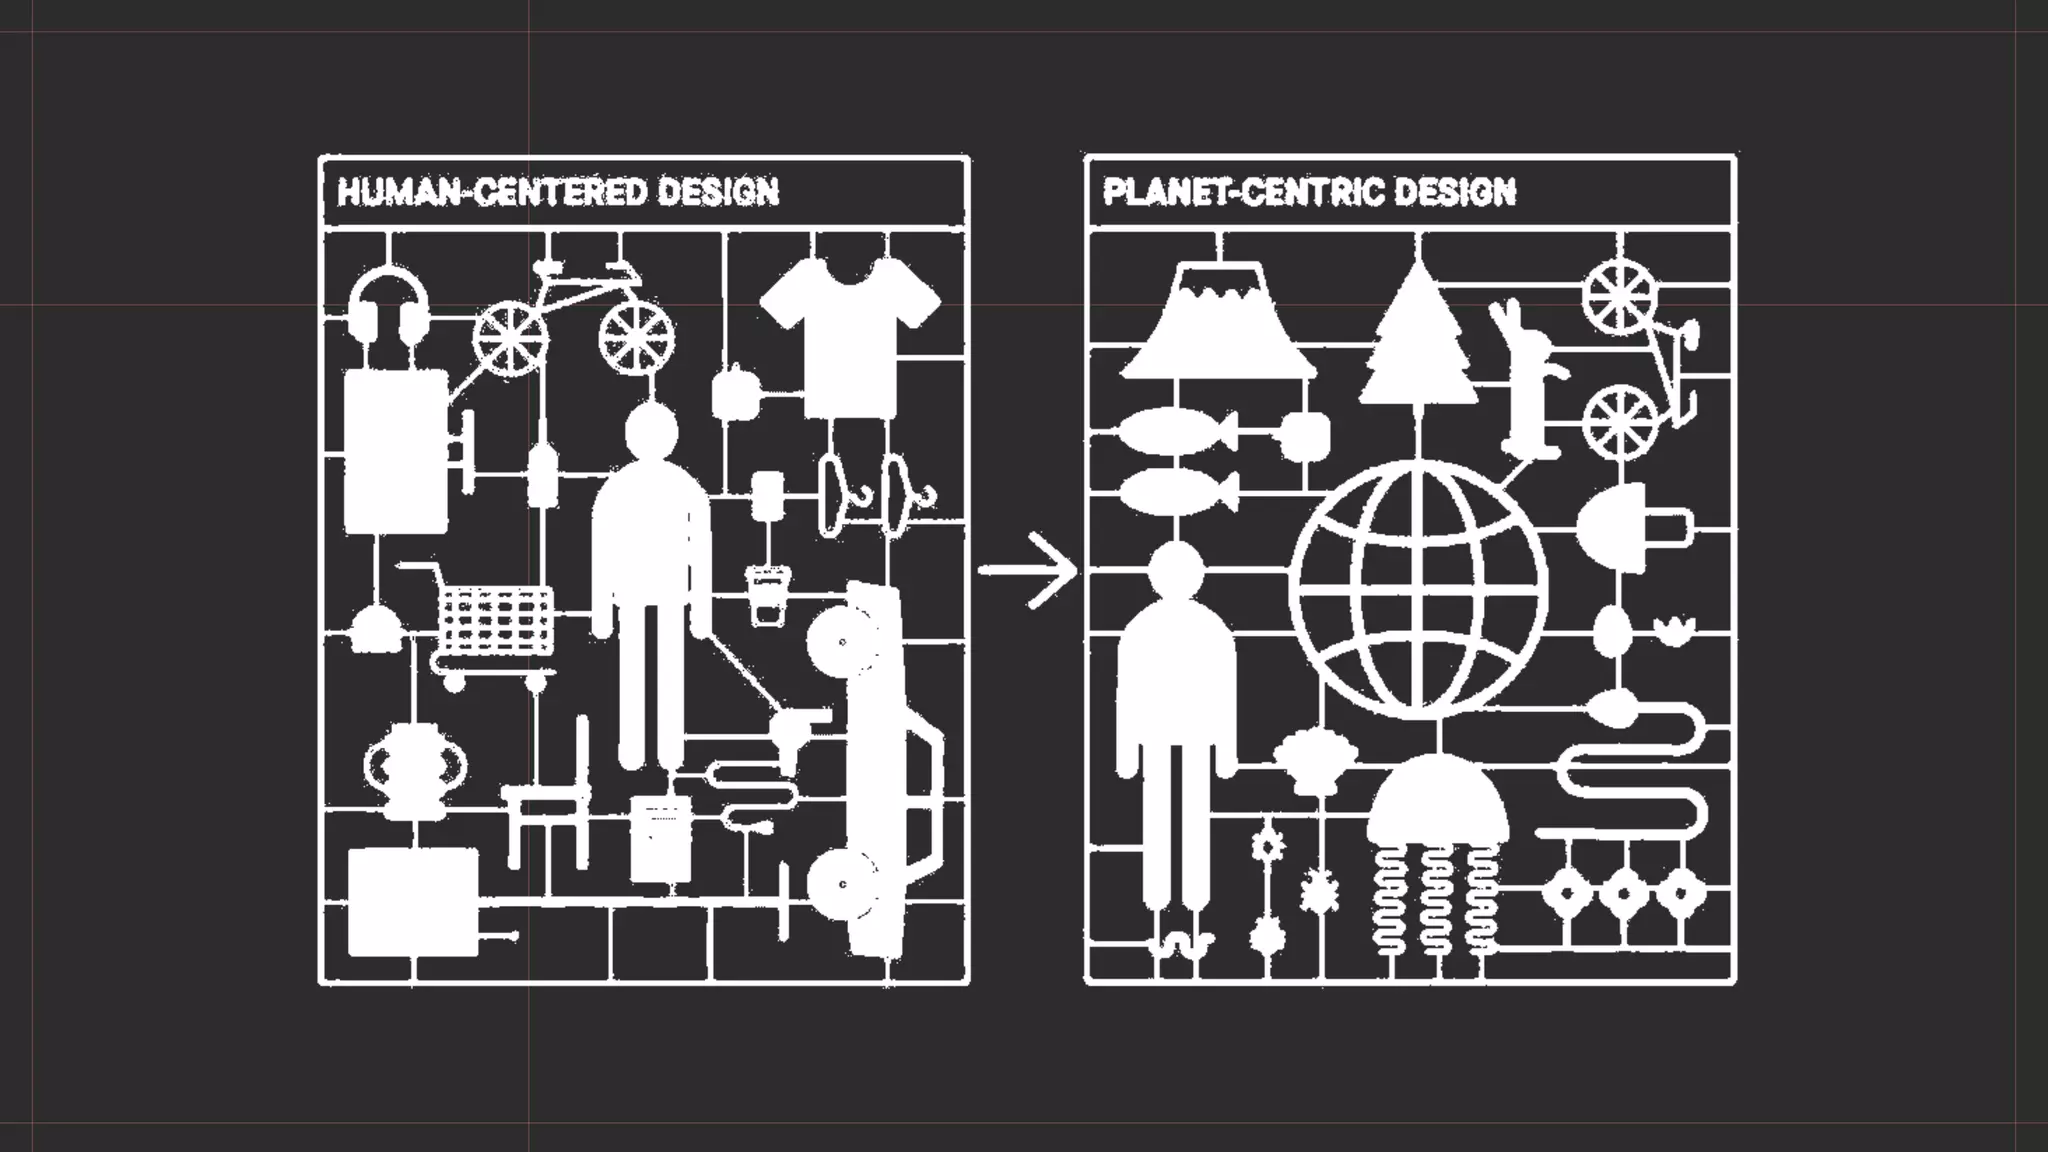
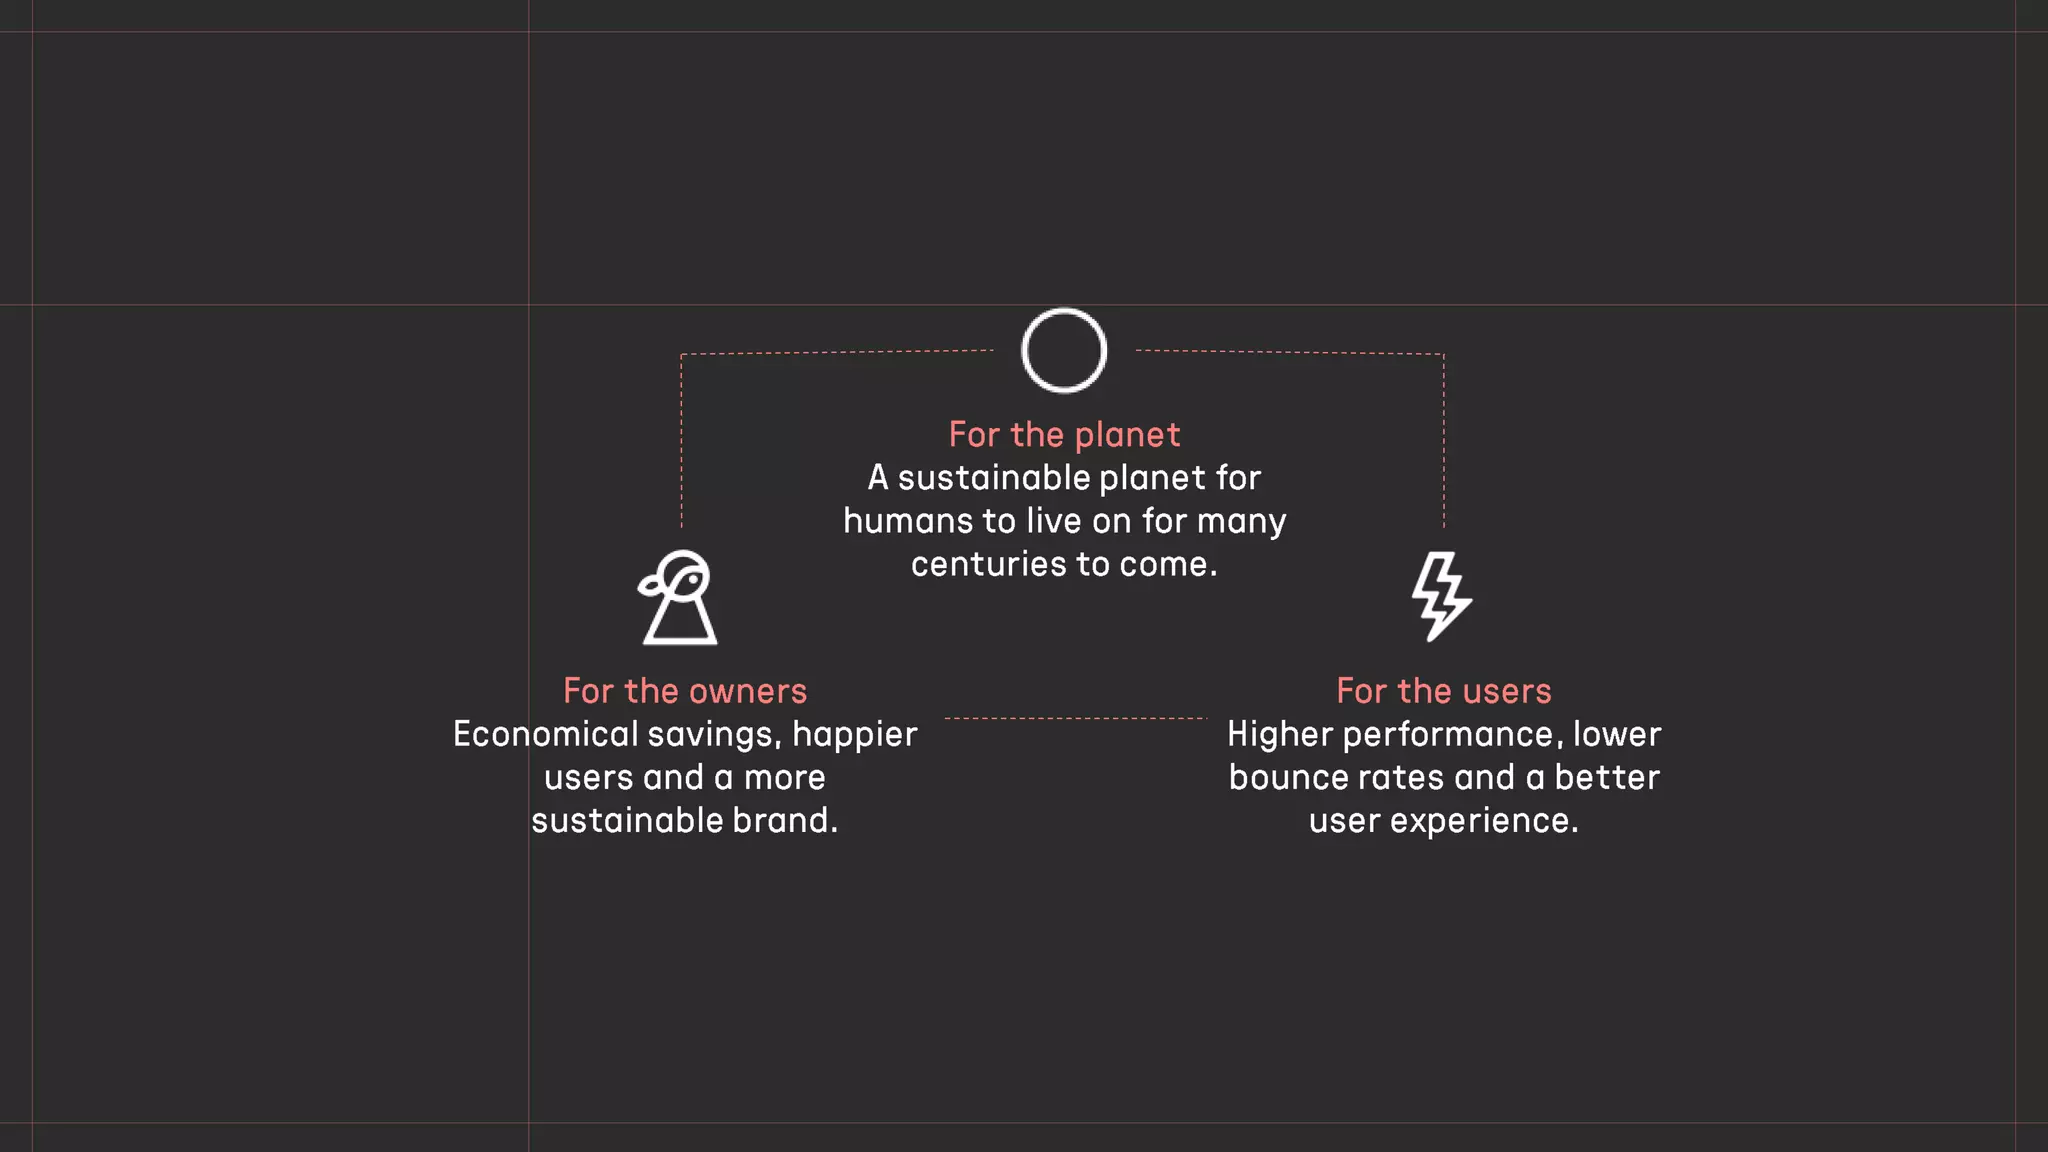
Reiteration of the agenda, promoting planet-centric solutions to achieve zero CO2 emissions and sustainable digital solutions.
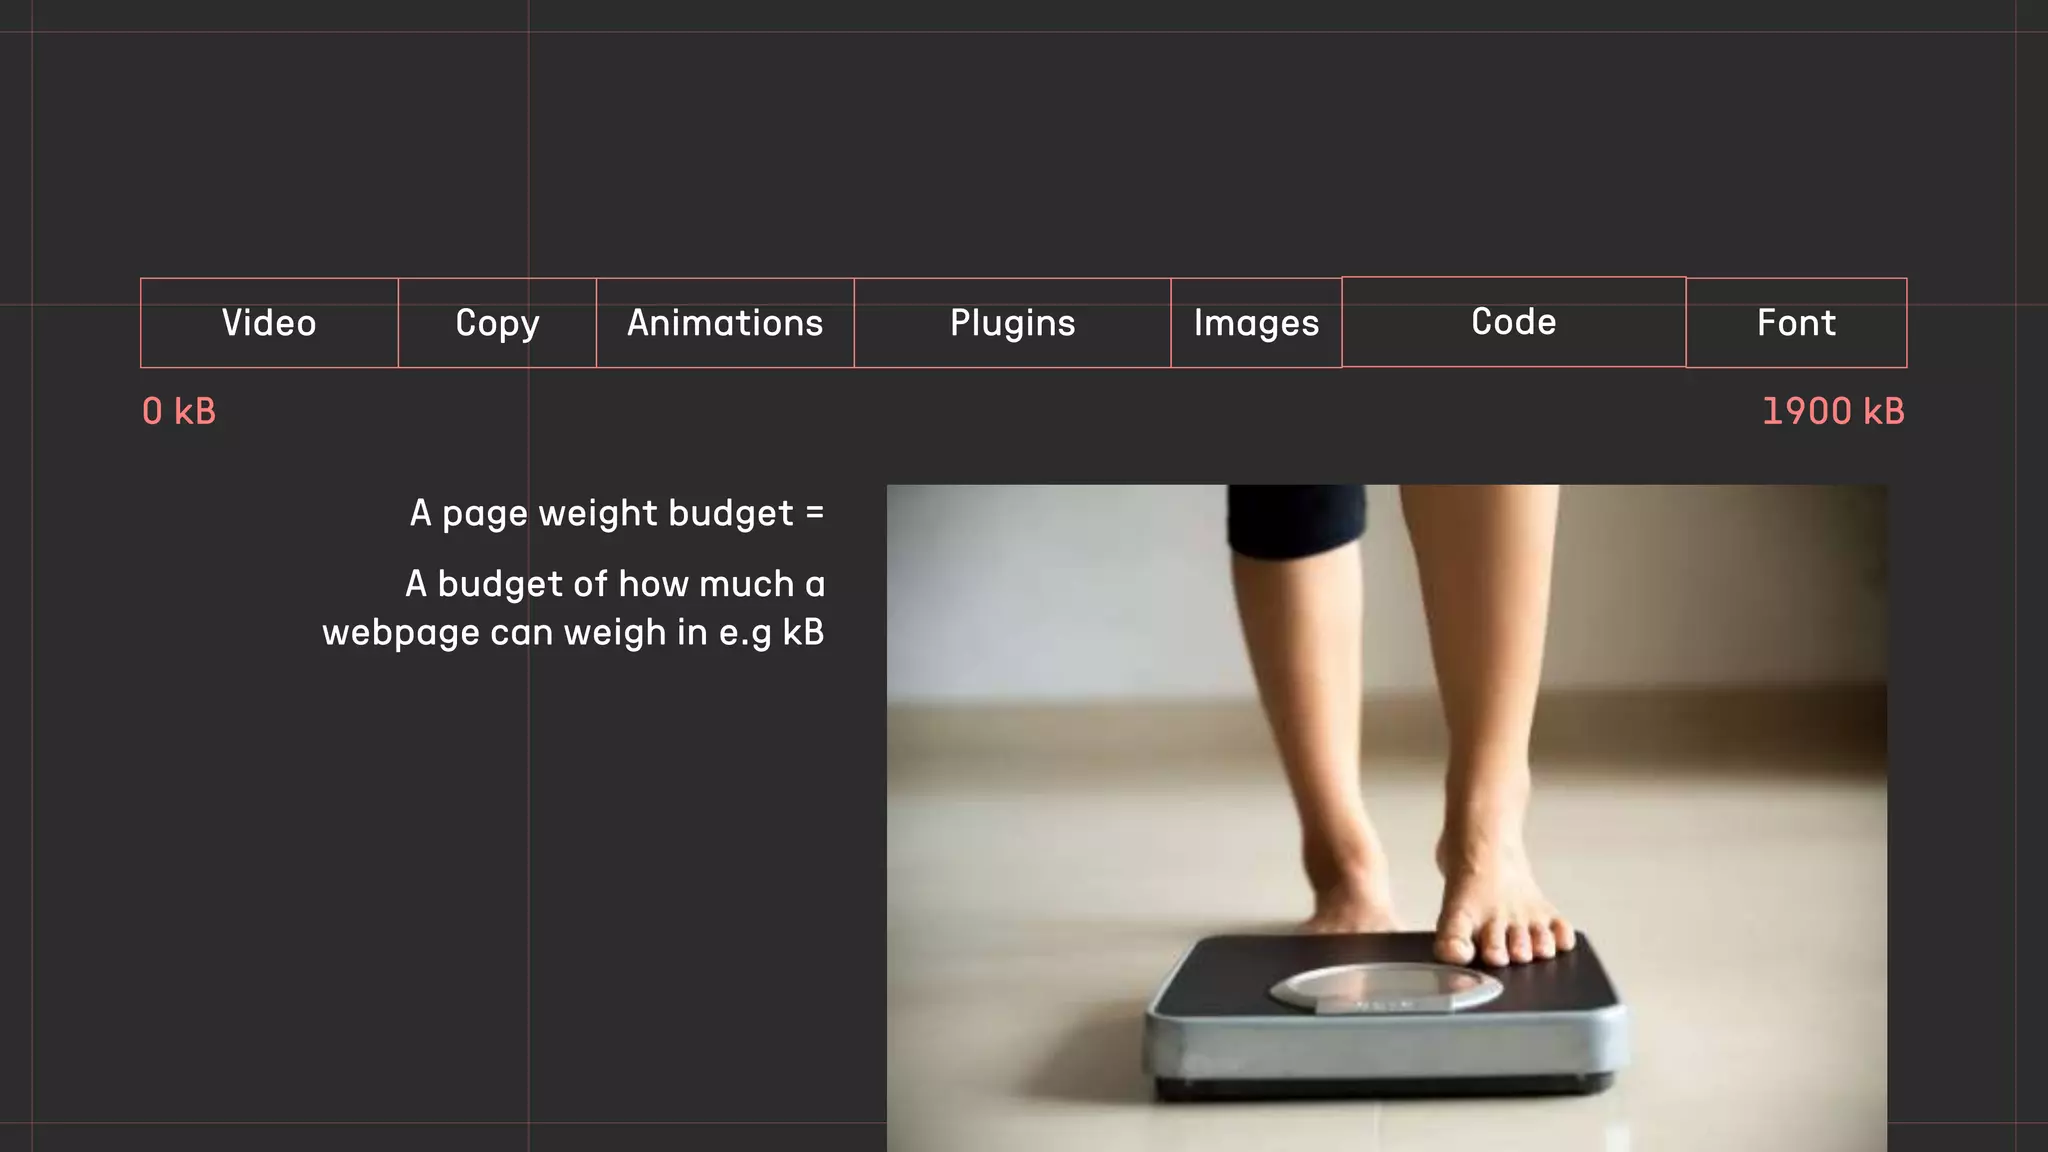
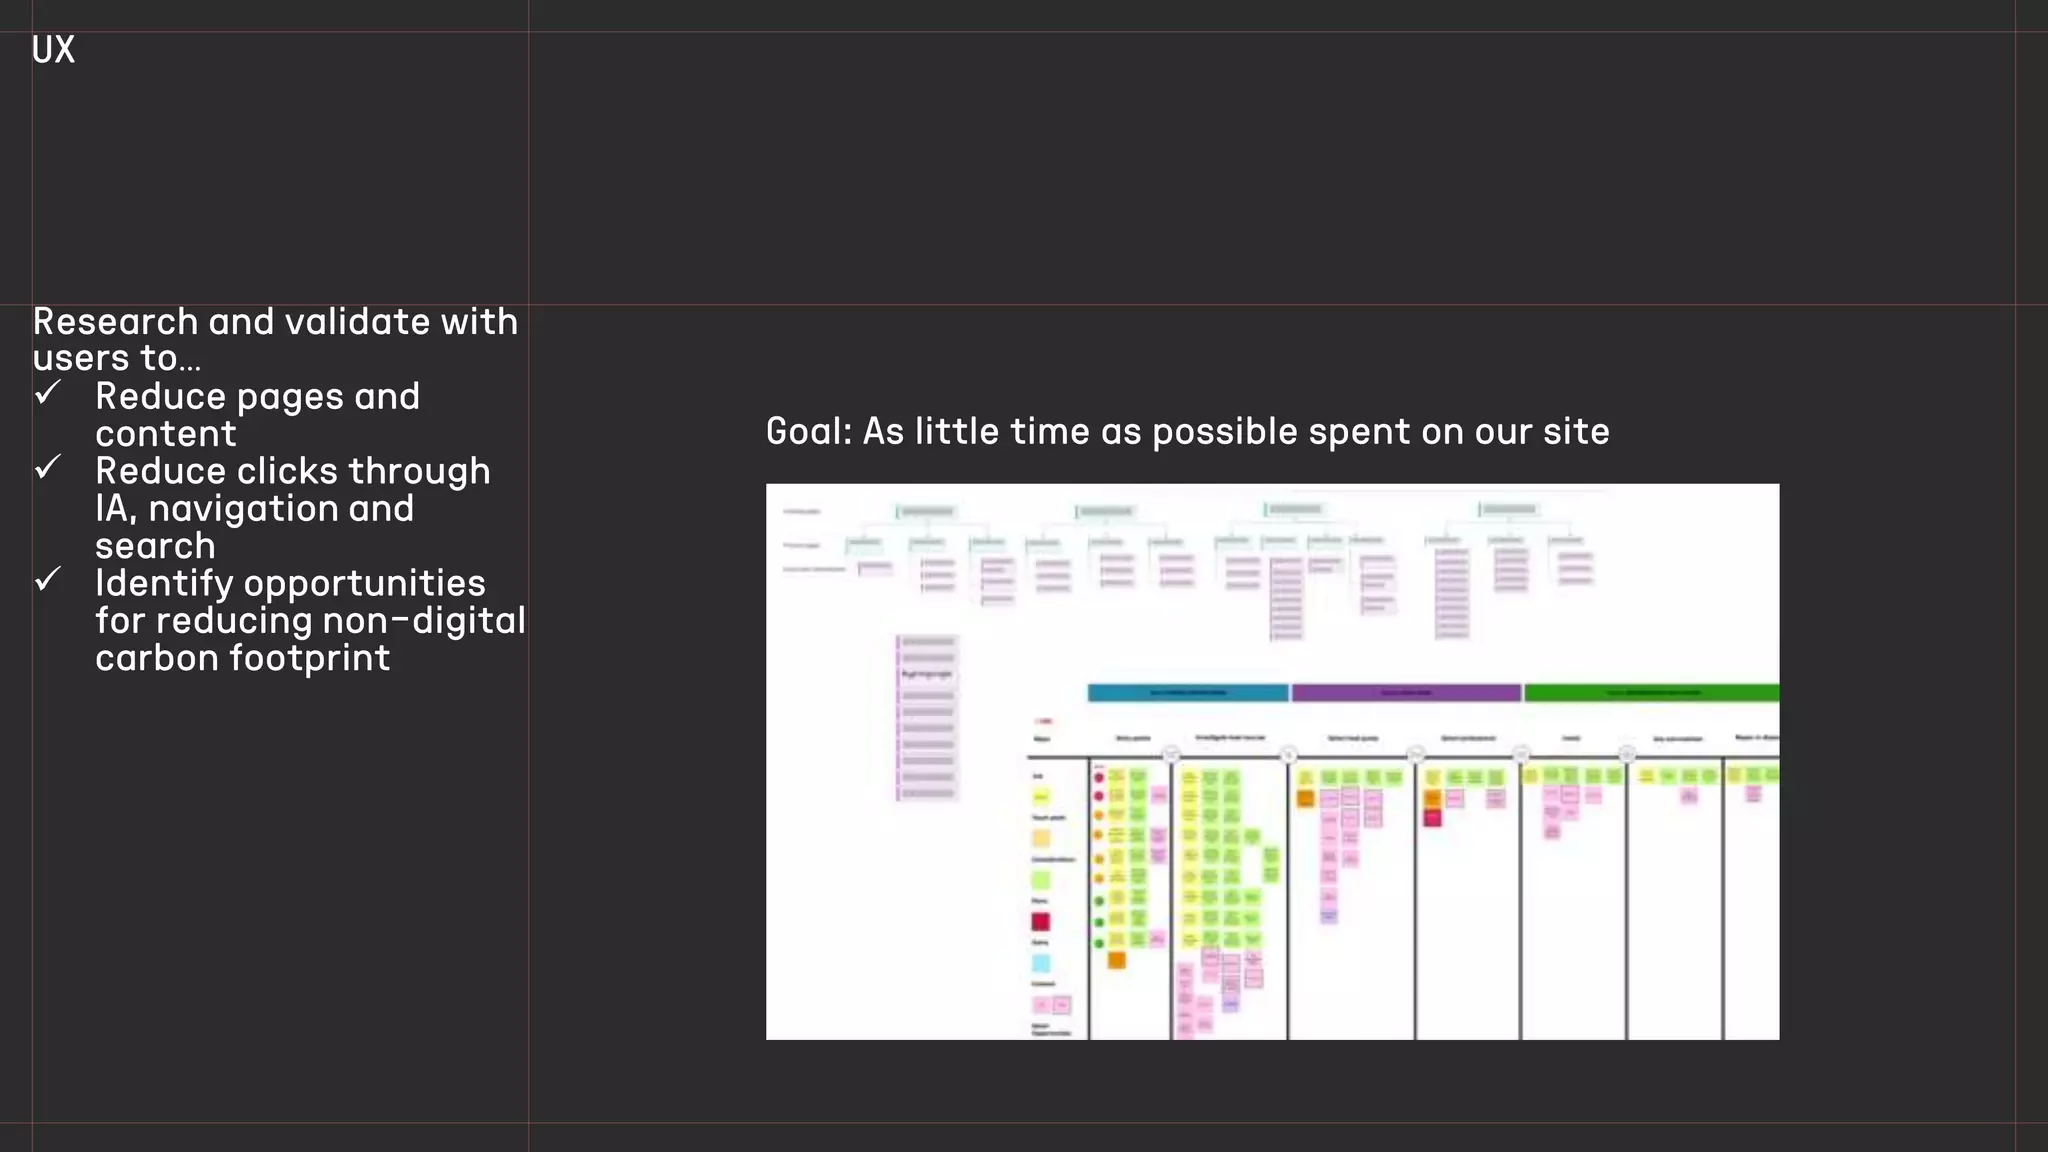
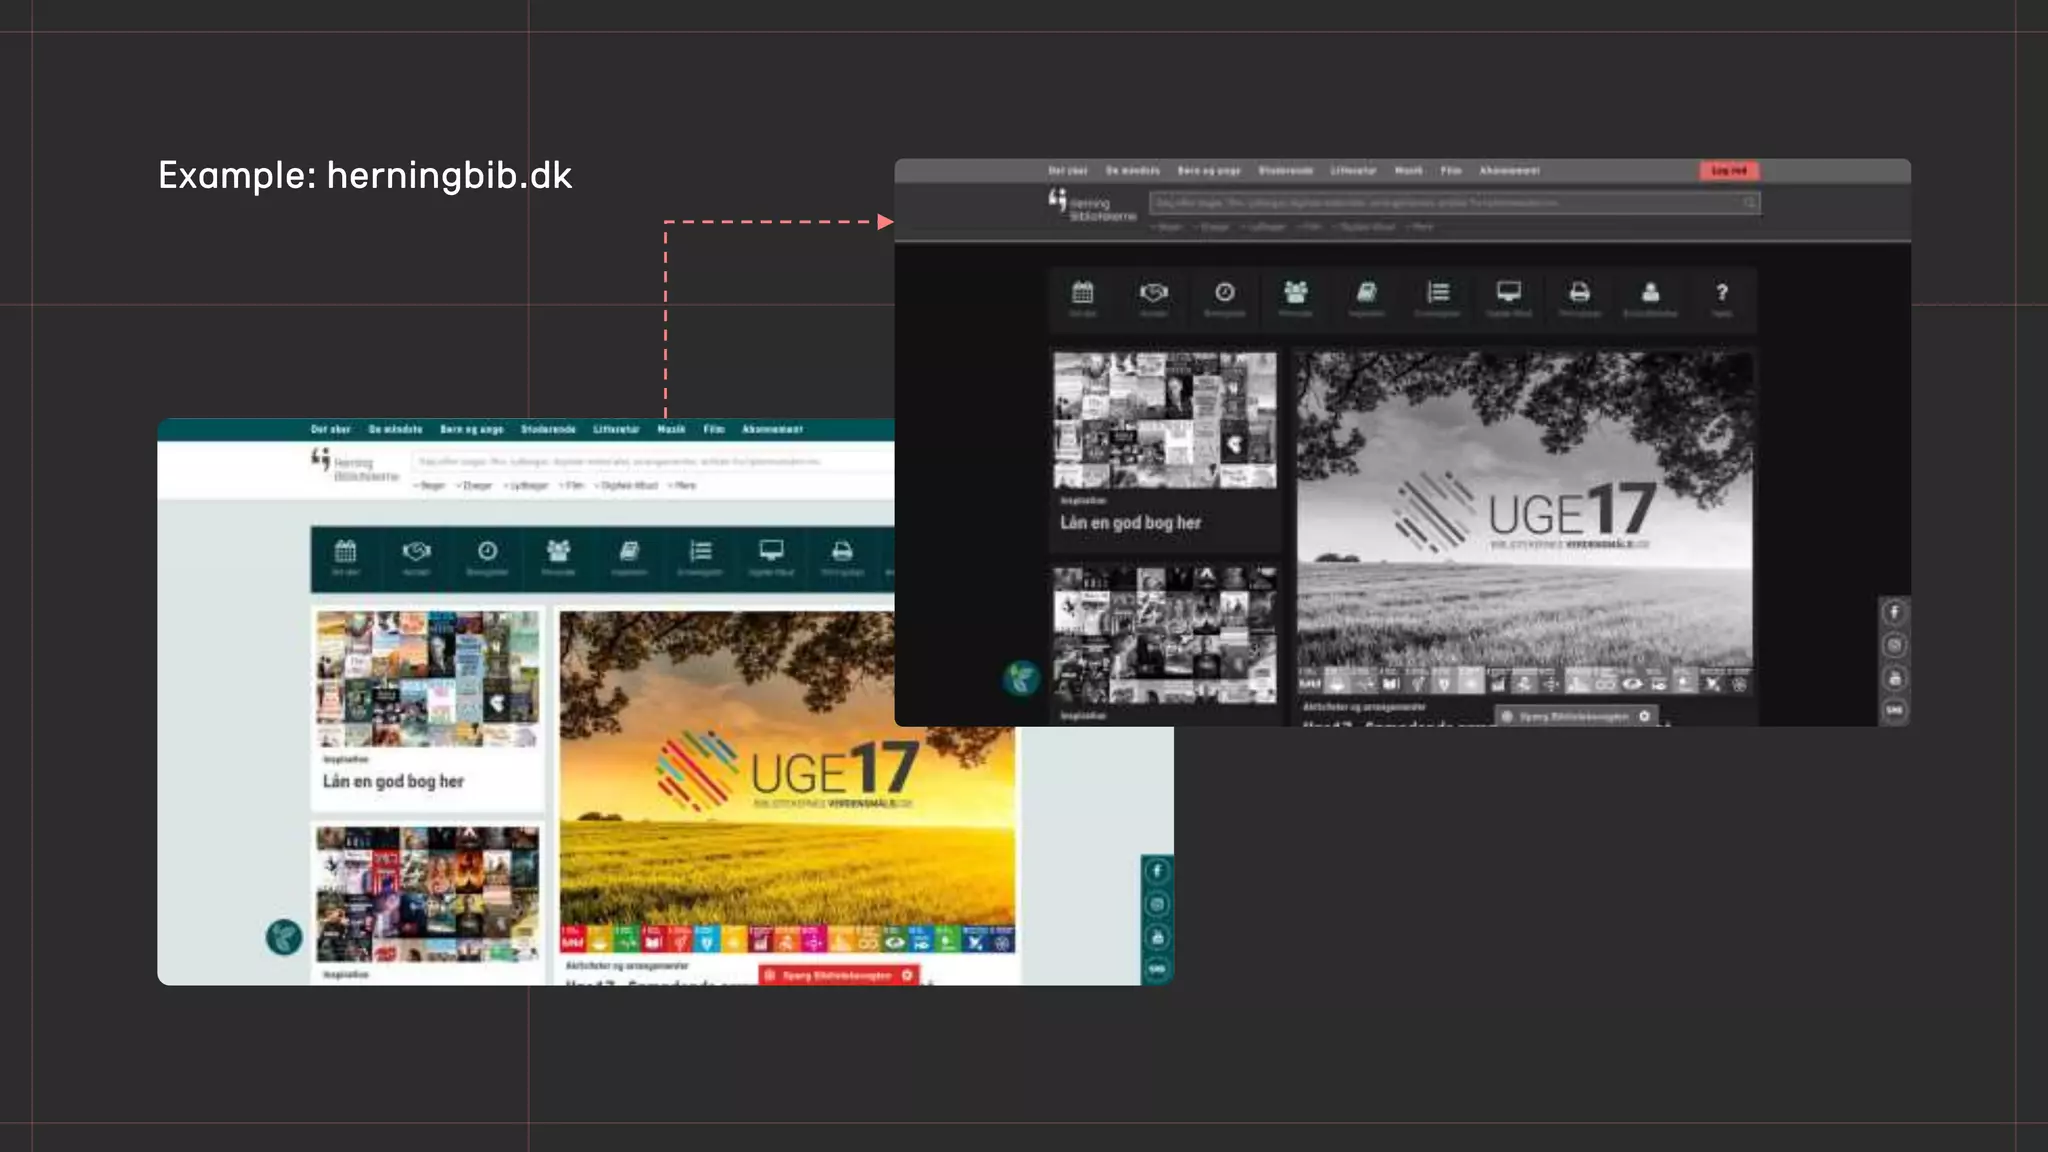
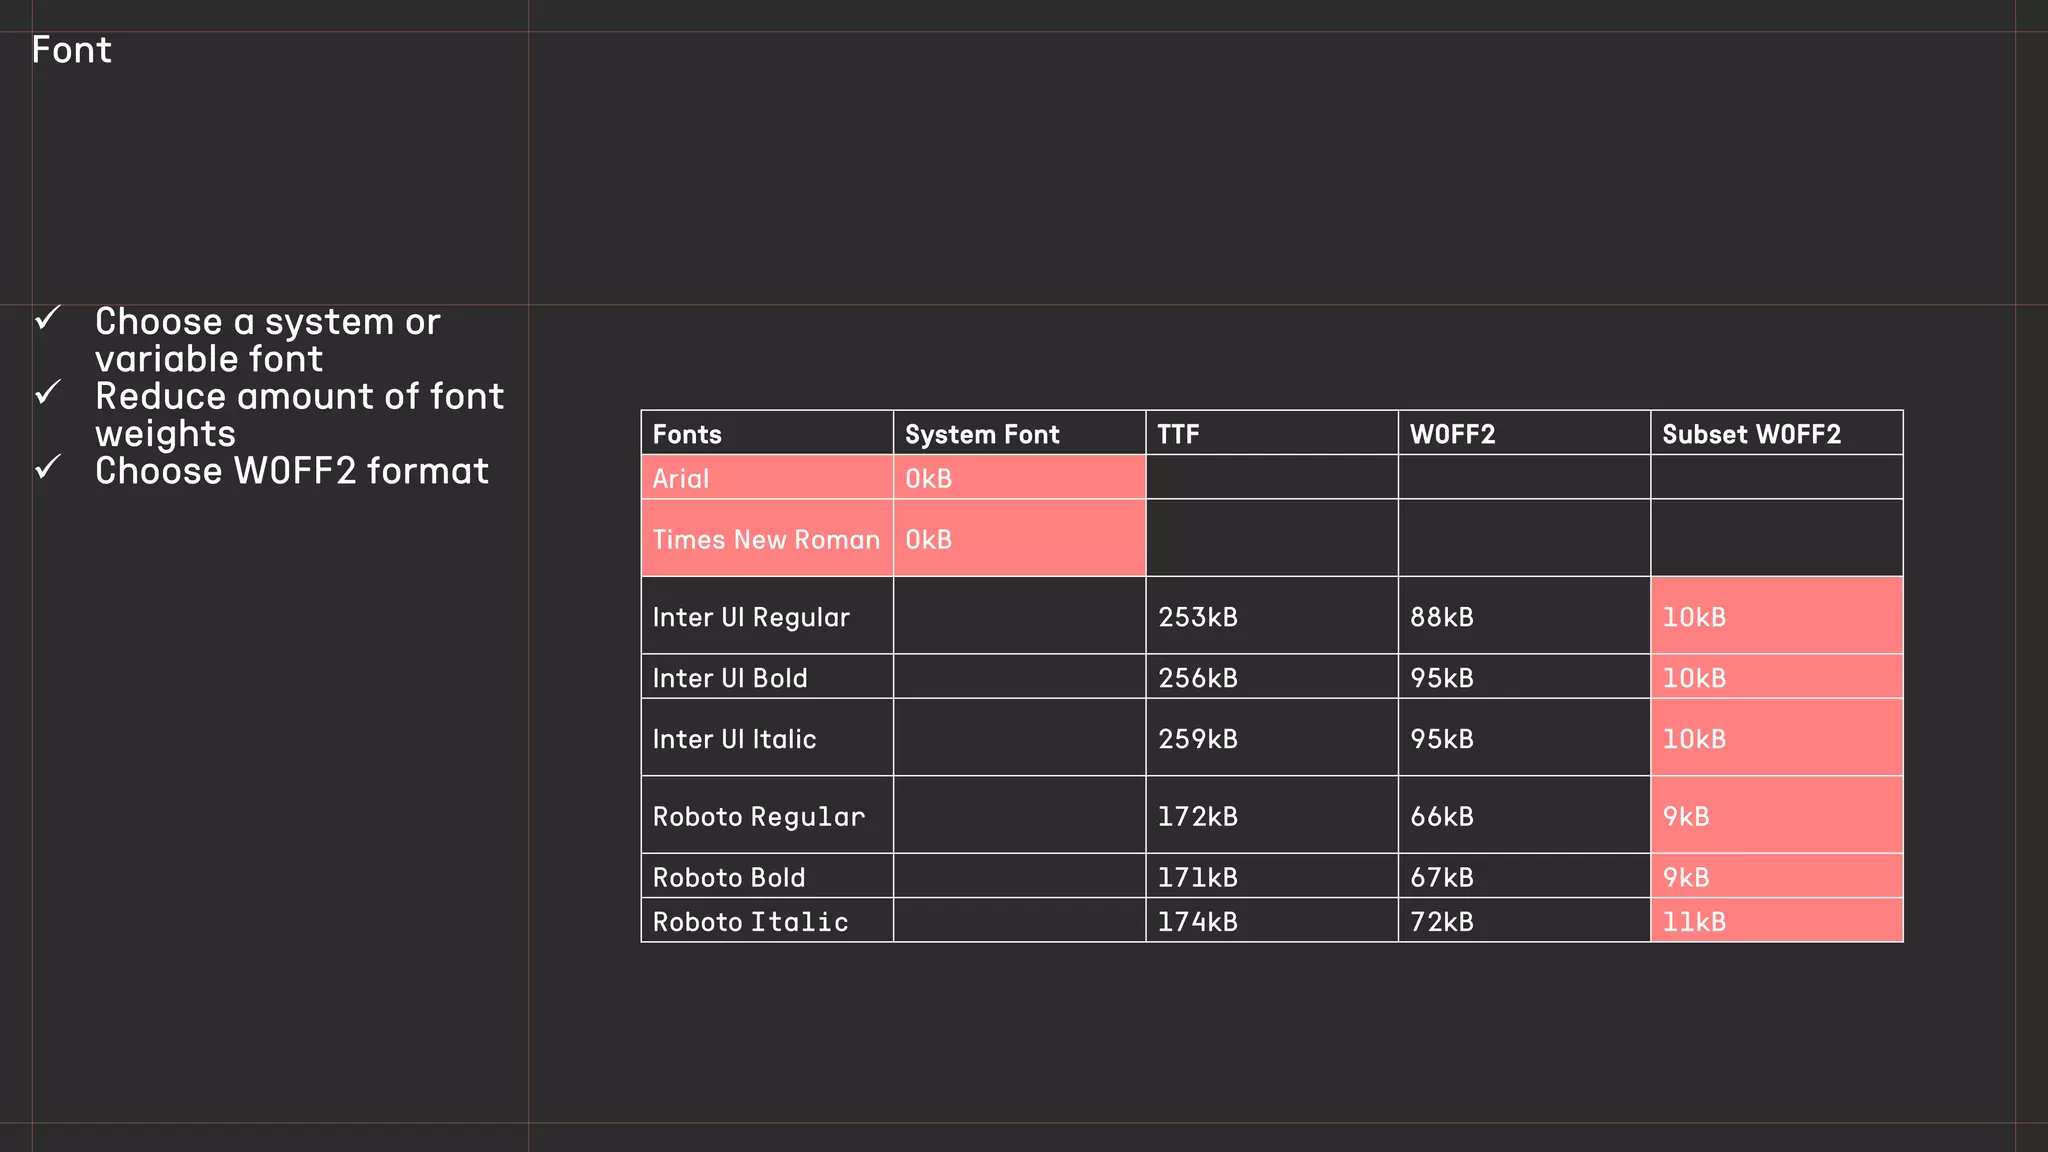
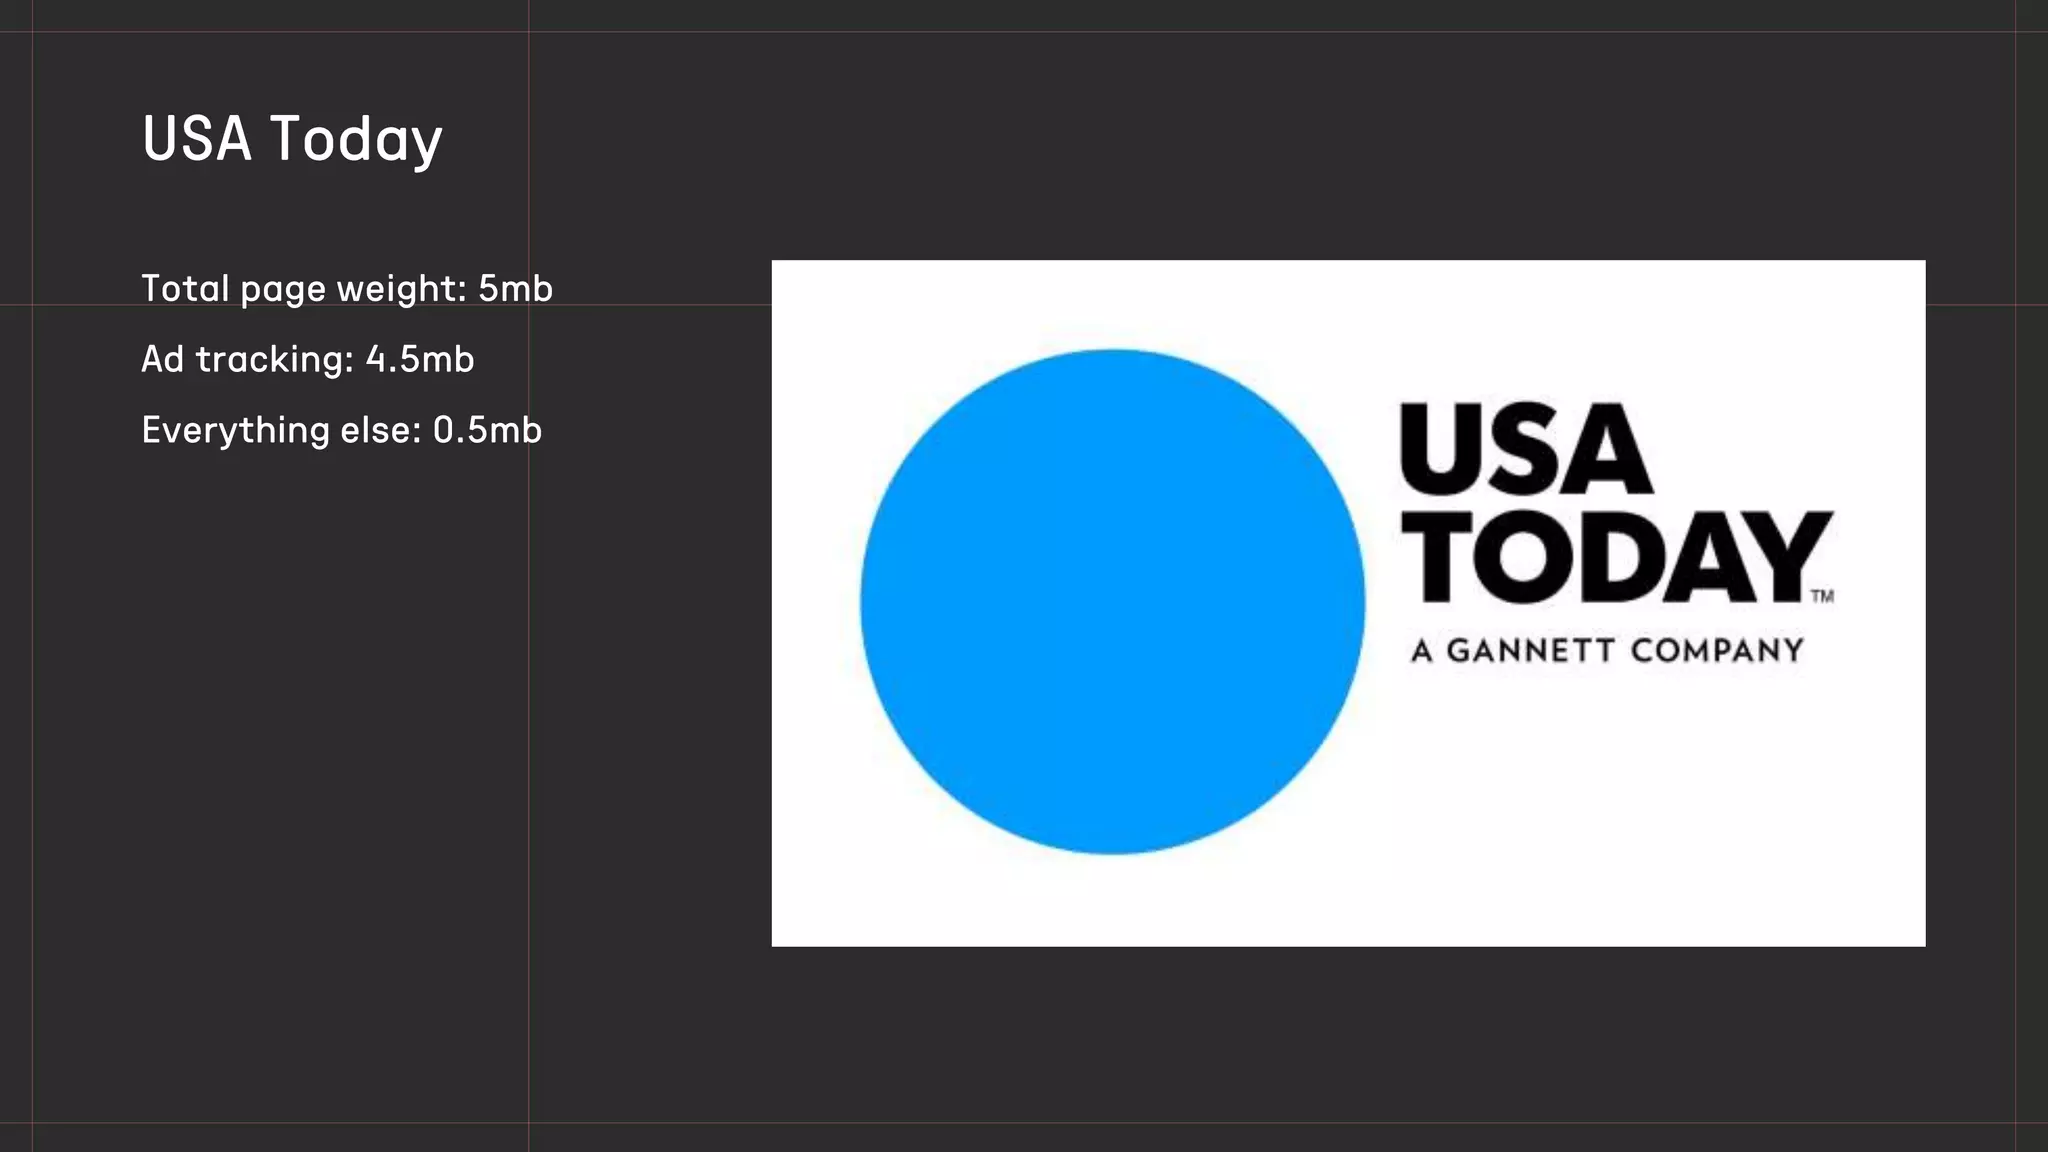
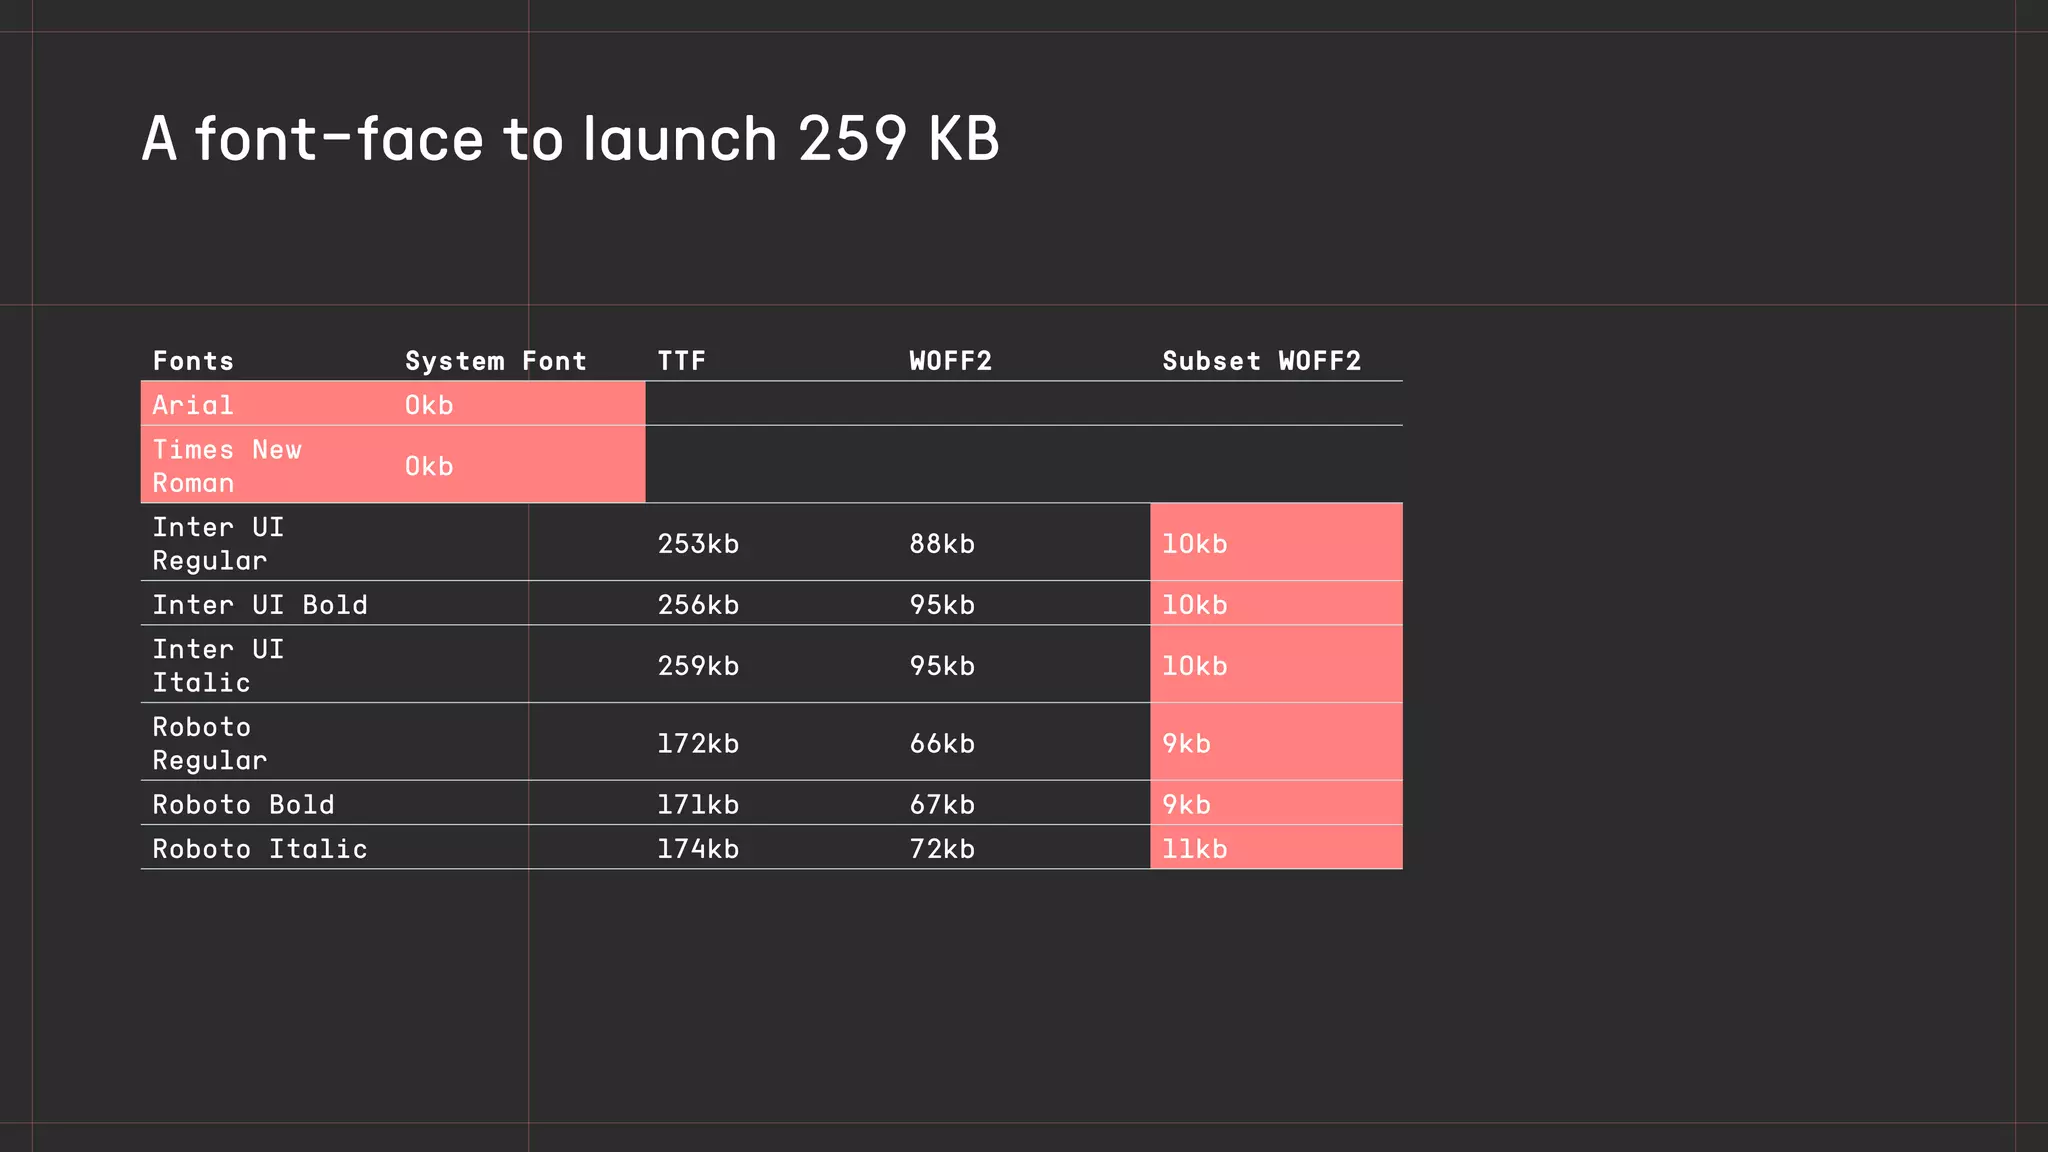
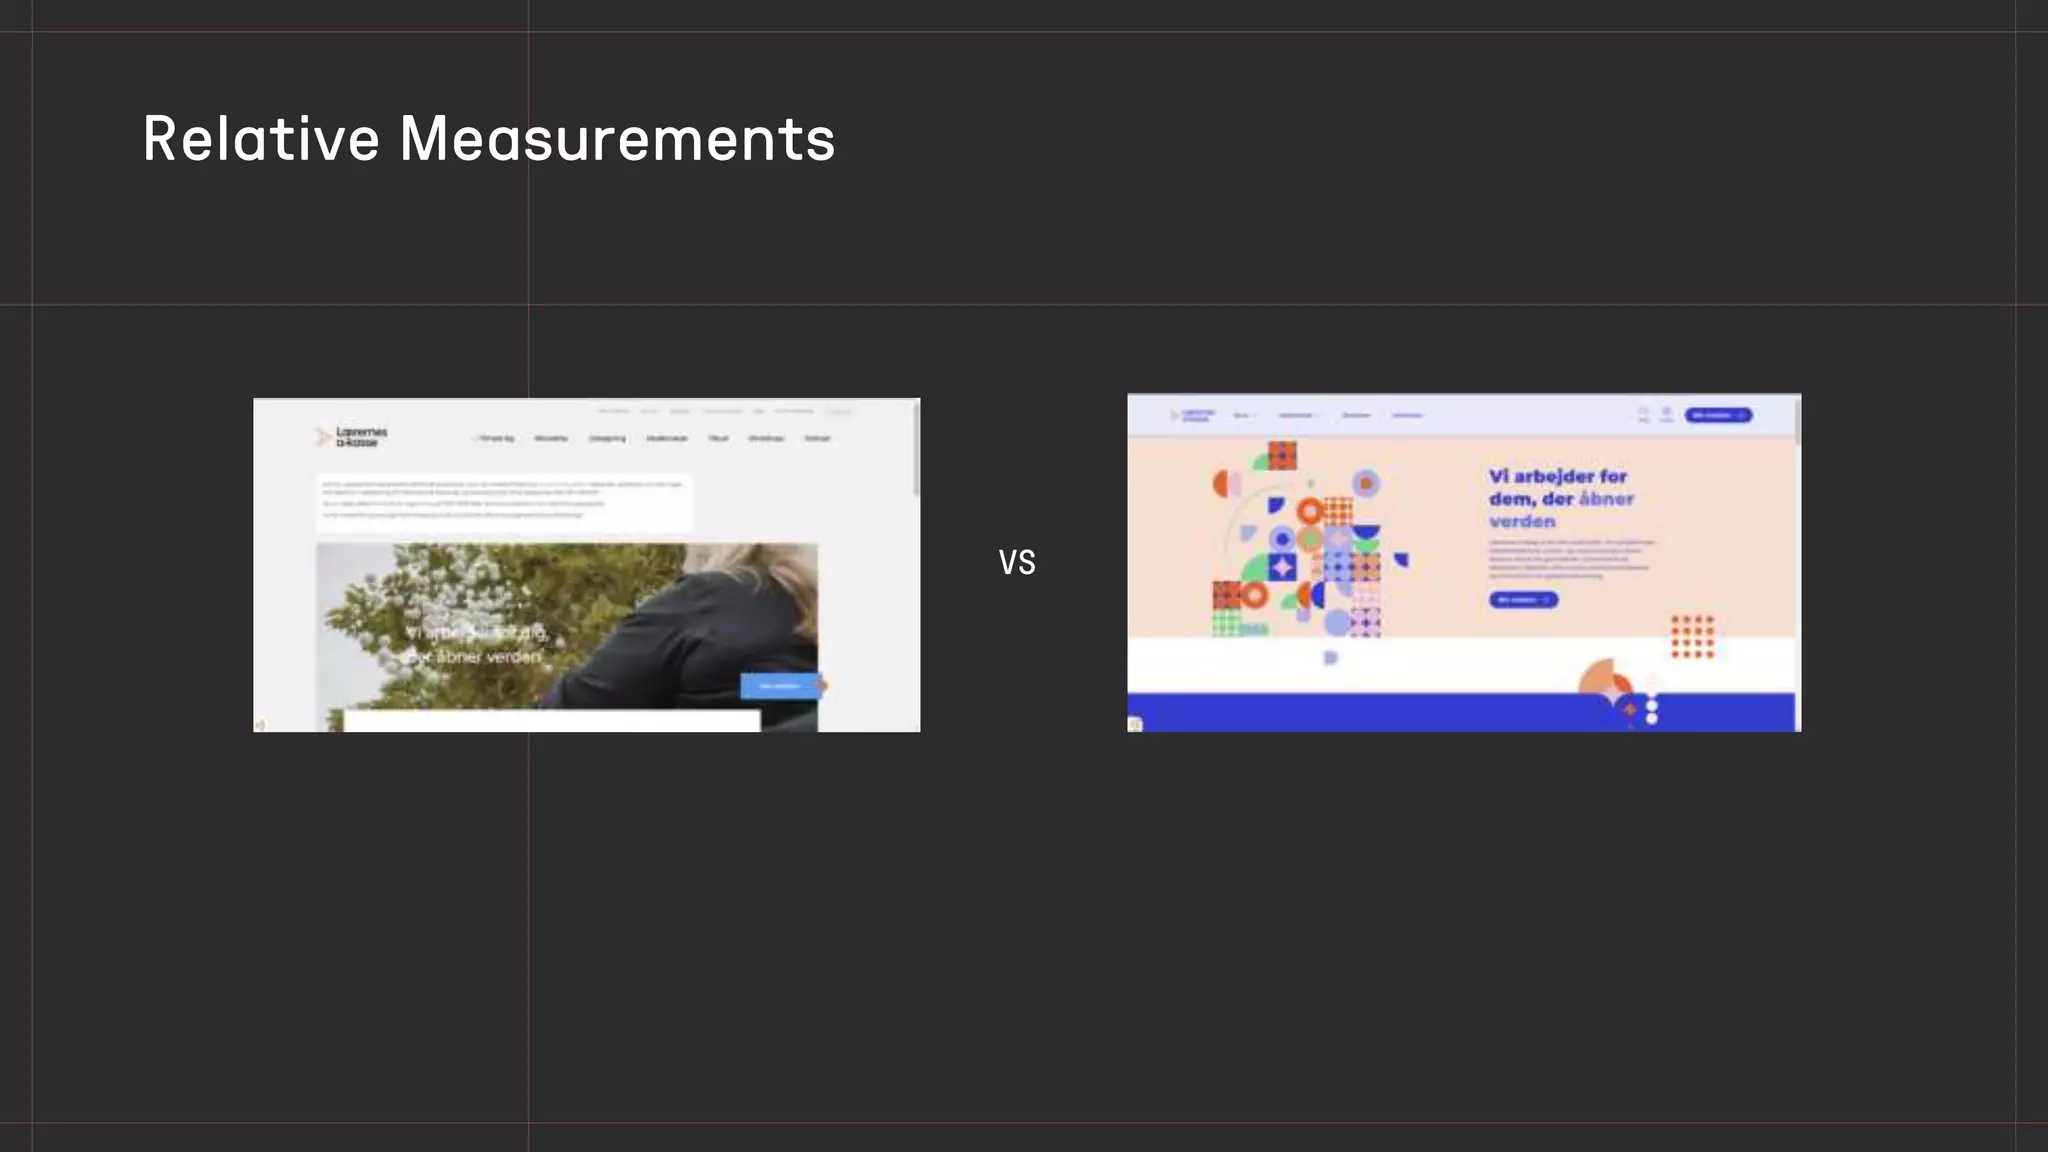
Focus on reducing webpage weight, optimizing content, images, and videos for sustainability in design.Strategies for using colored designs and fonts that are energy efficient to improve sustainability.
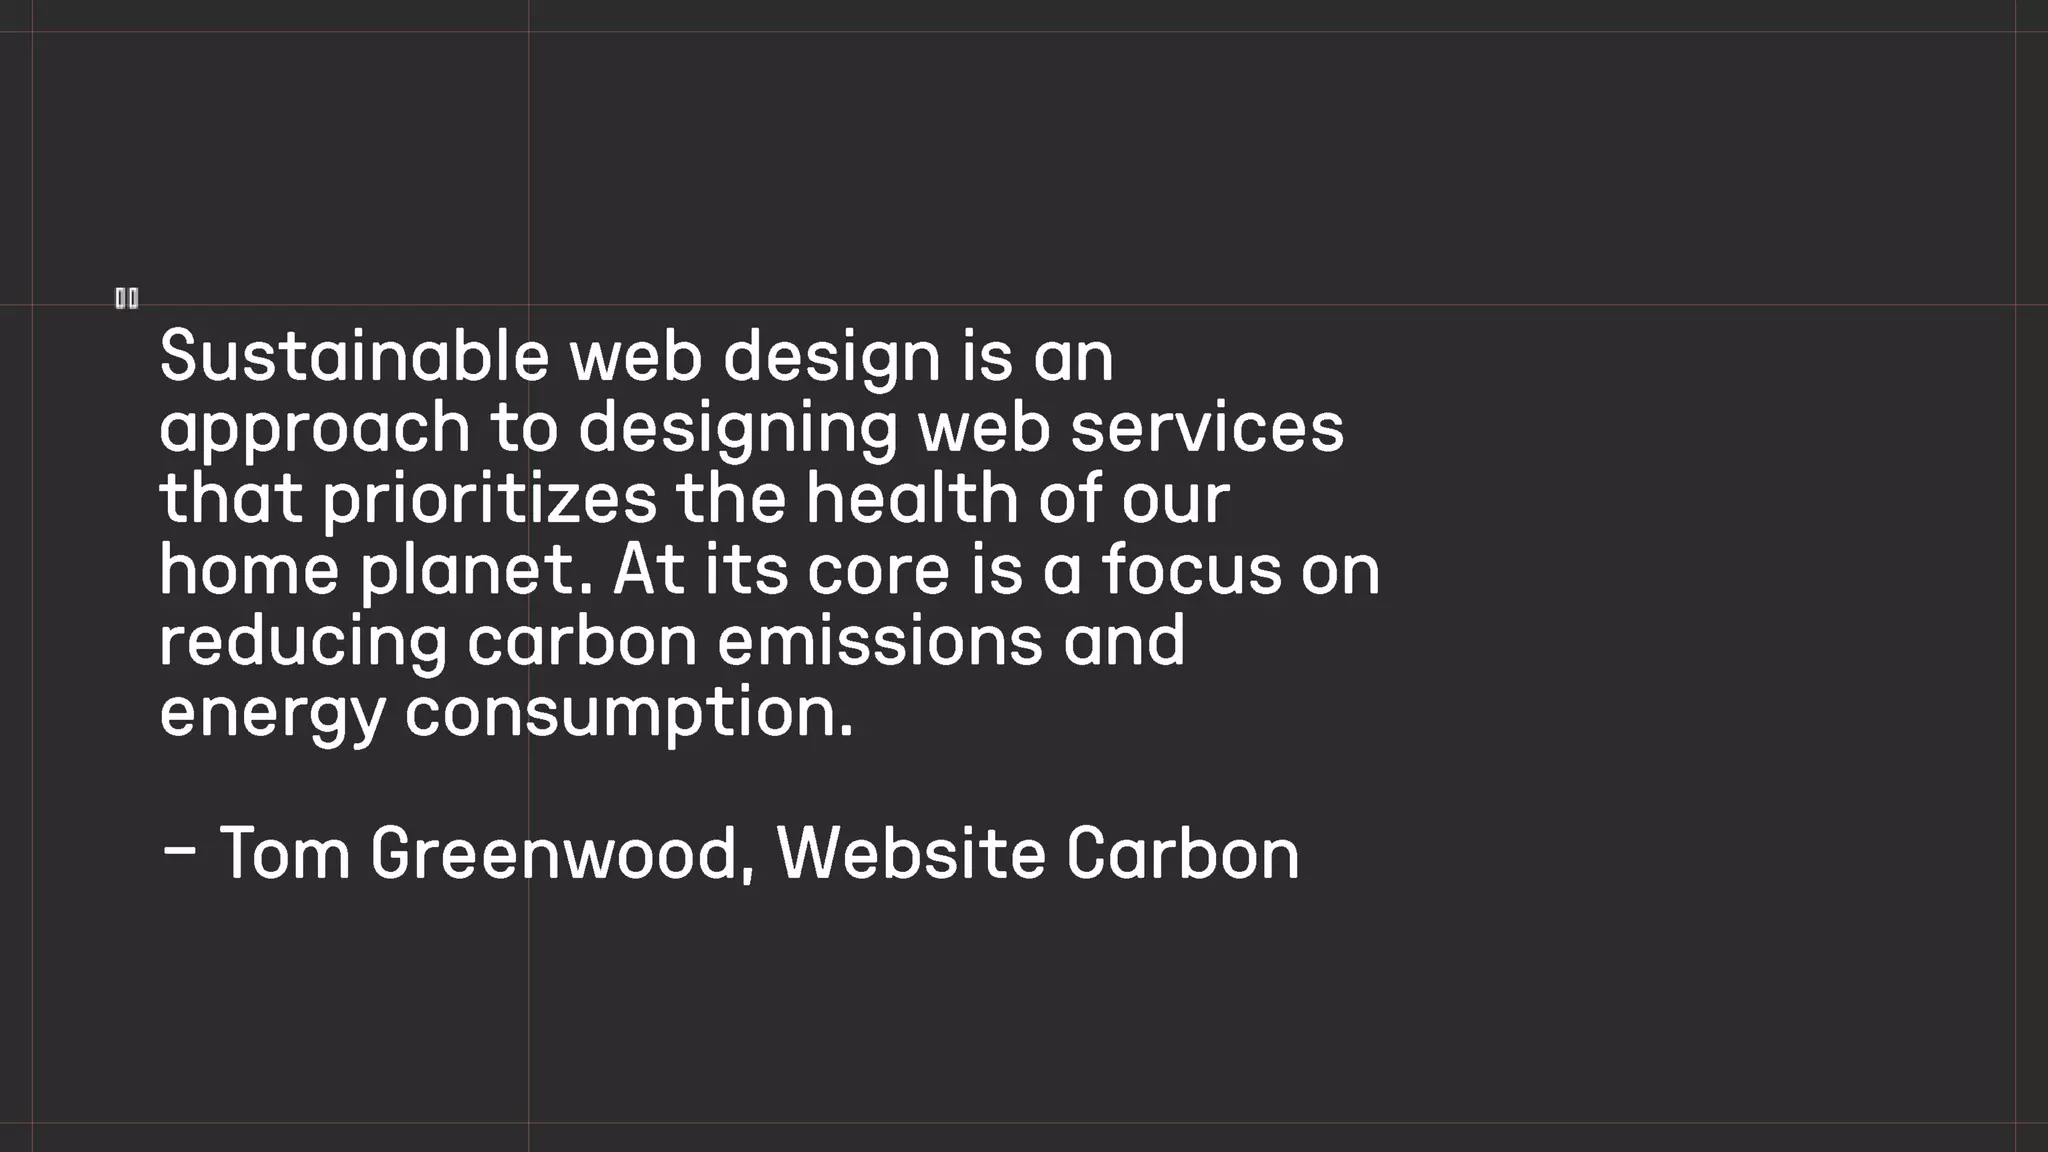
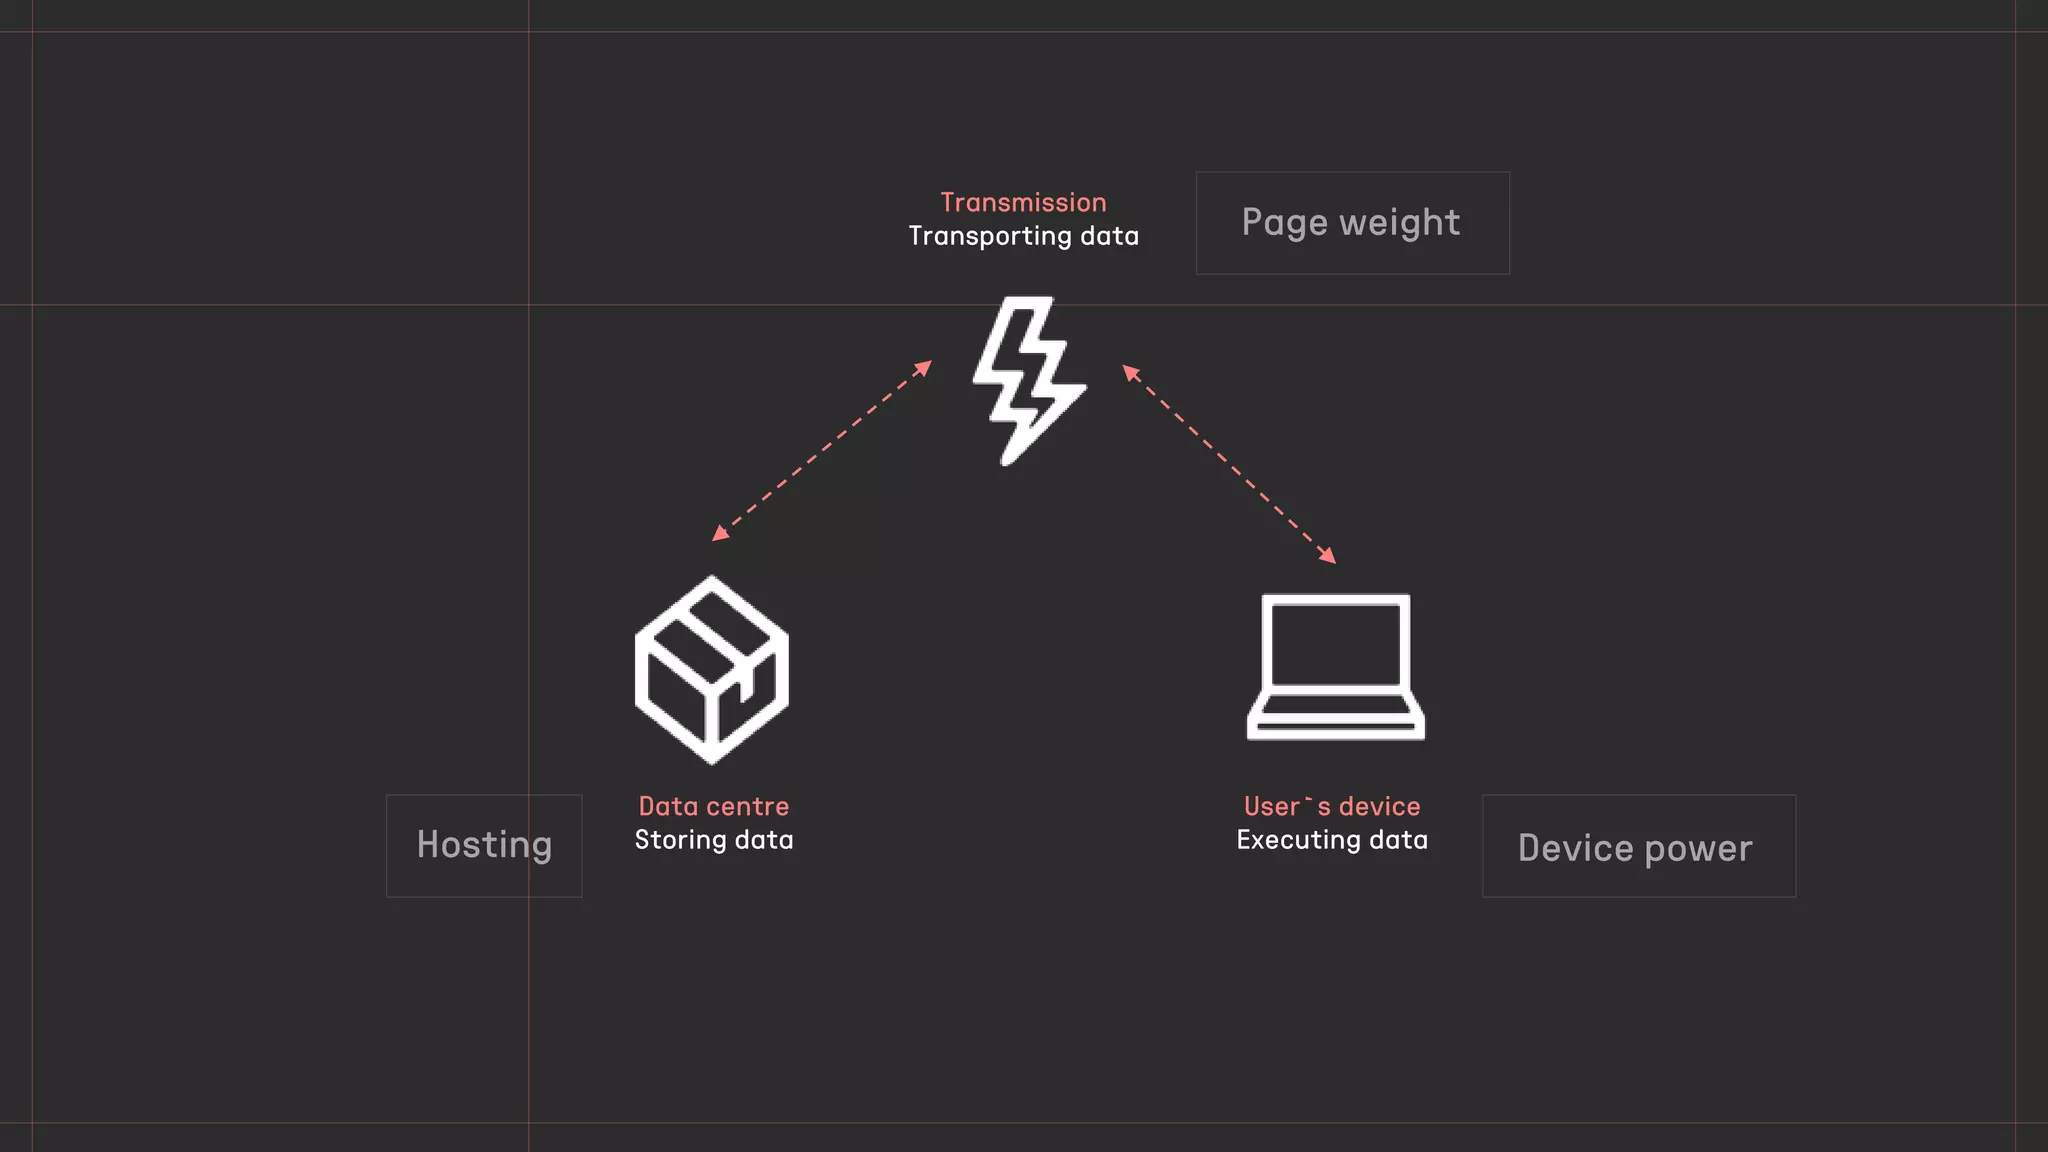
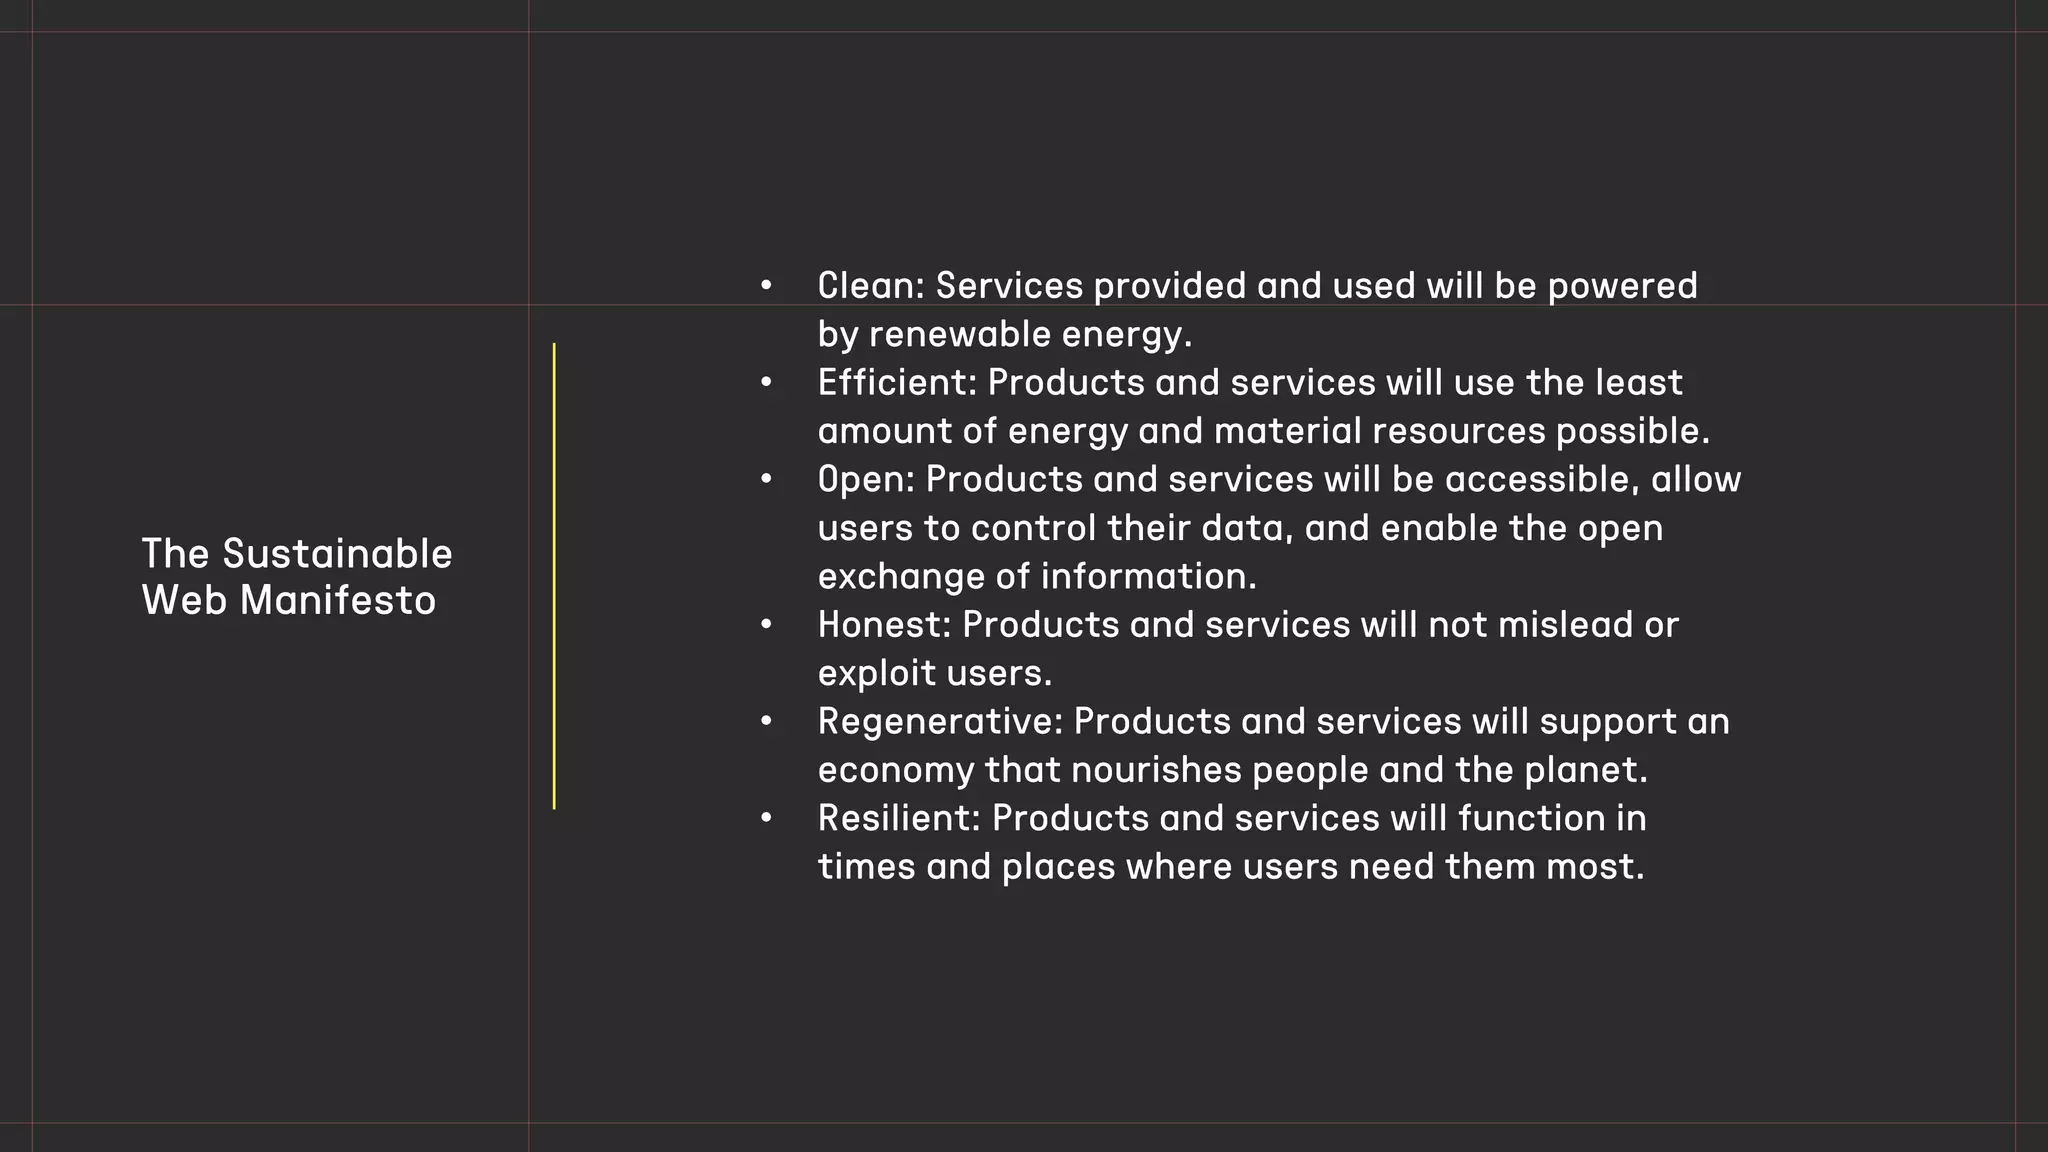
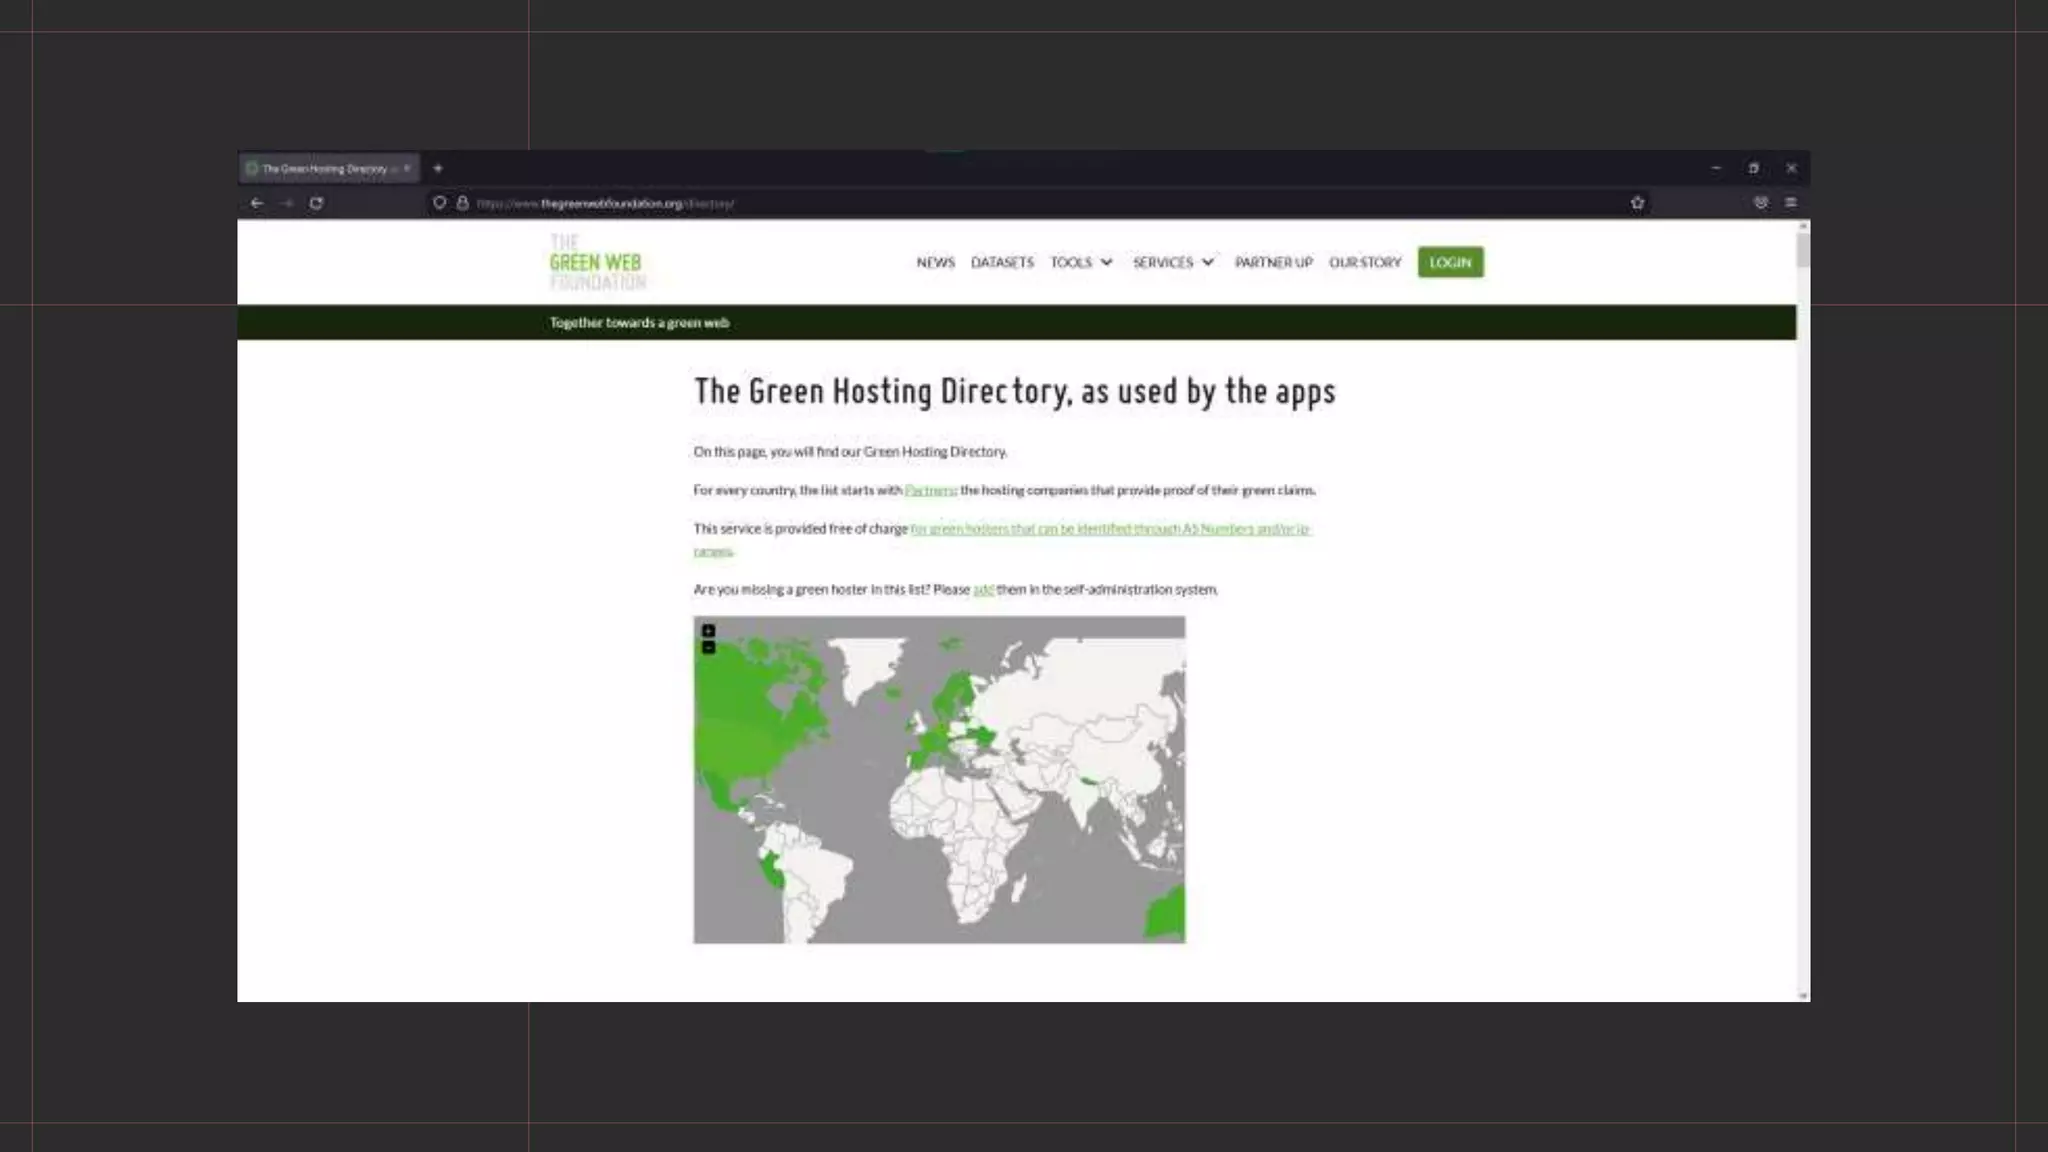
Key principles of sustainability in web development focusing on efficiency, honesty, and environmental impact.Statistics on greenhouse gas emissions from data storage, emphasizing localization of data centers for energy efficiency.
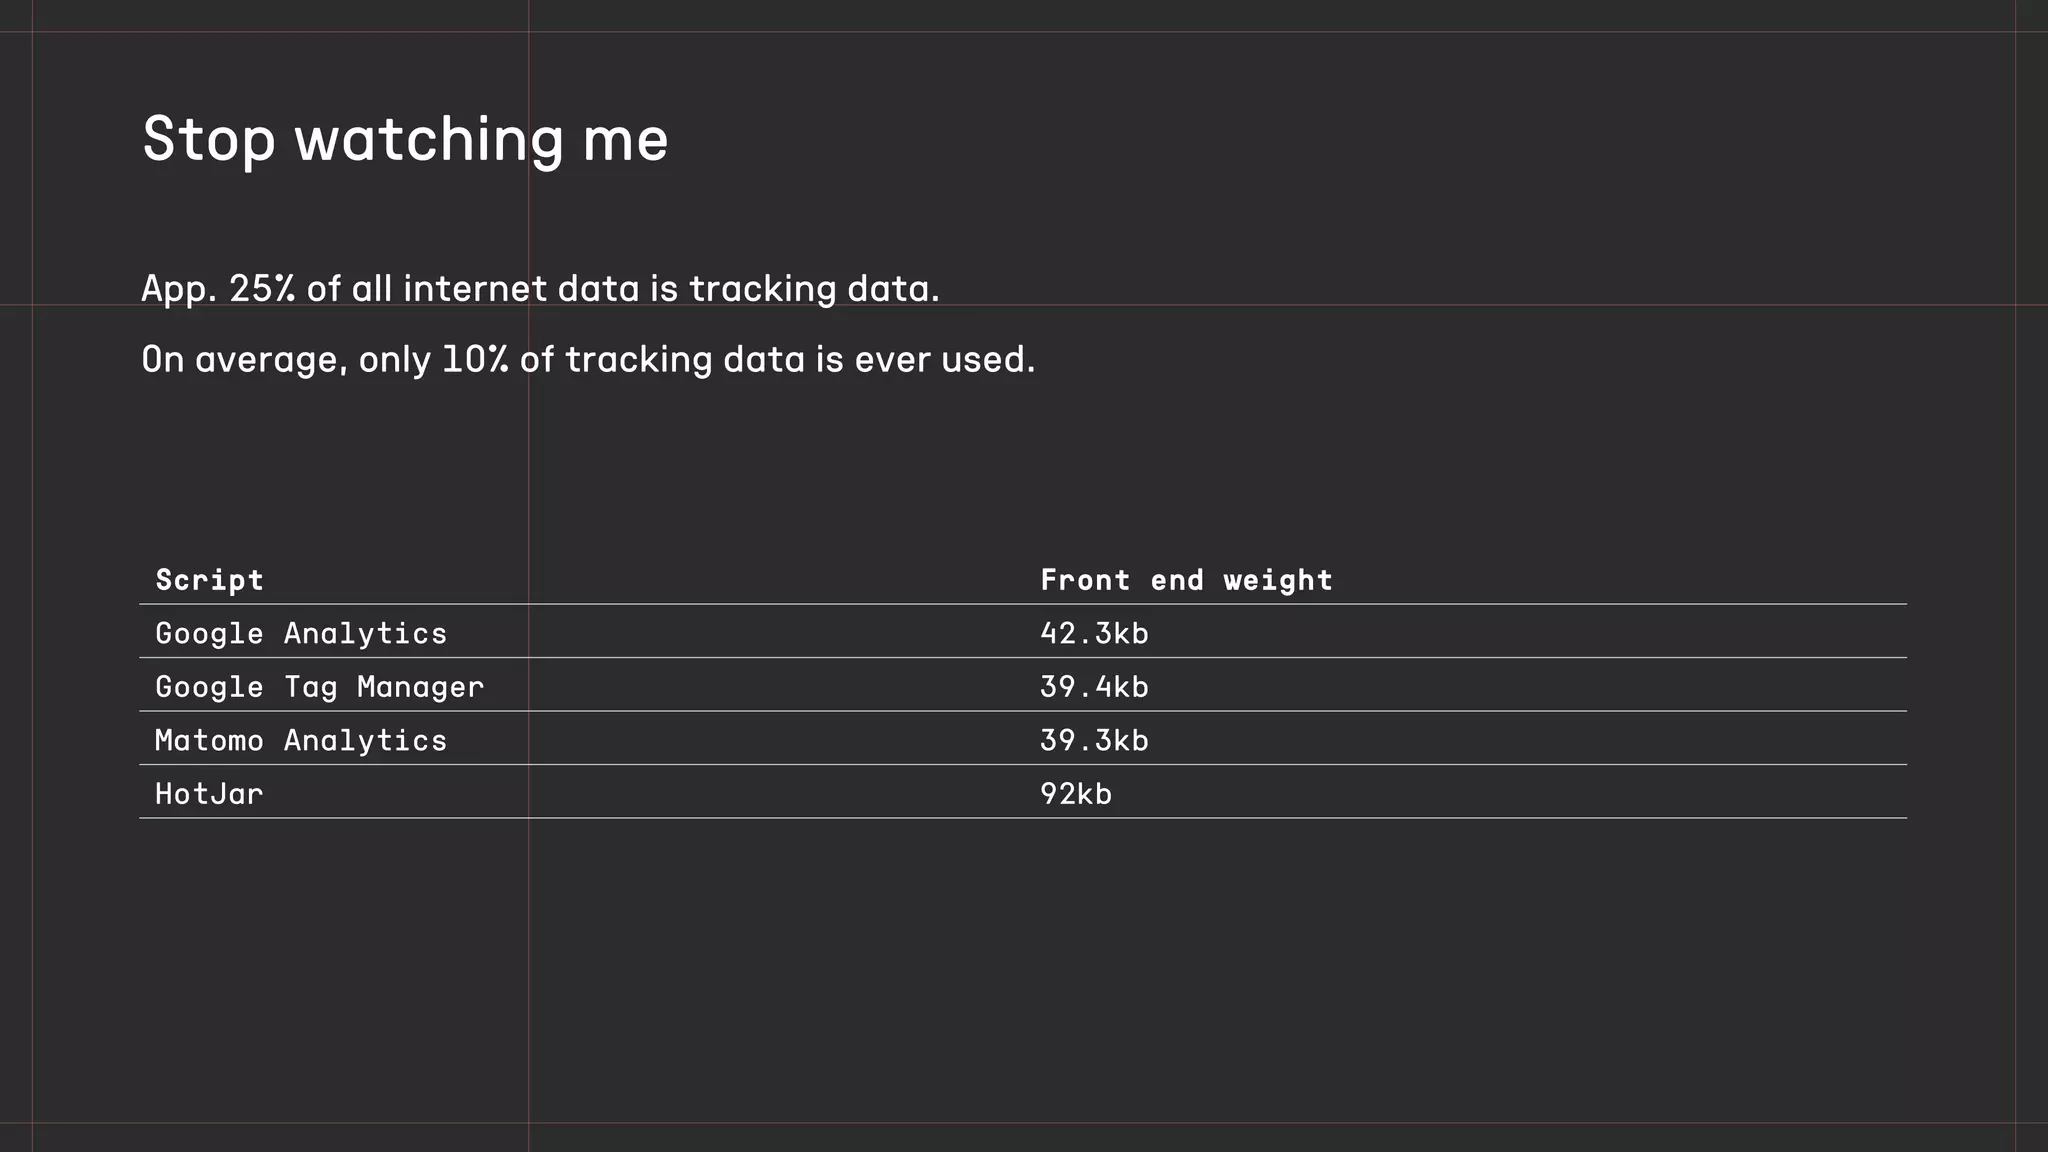
Energy efficiency evaluations across programming languages, and the impact of tracking data on emissions.
Statistics on video data consumption's carbon footprint, along with data on image formats and their sustainability.
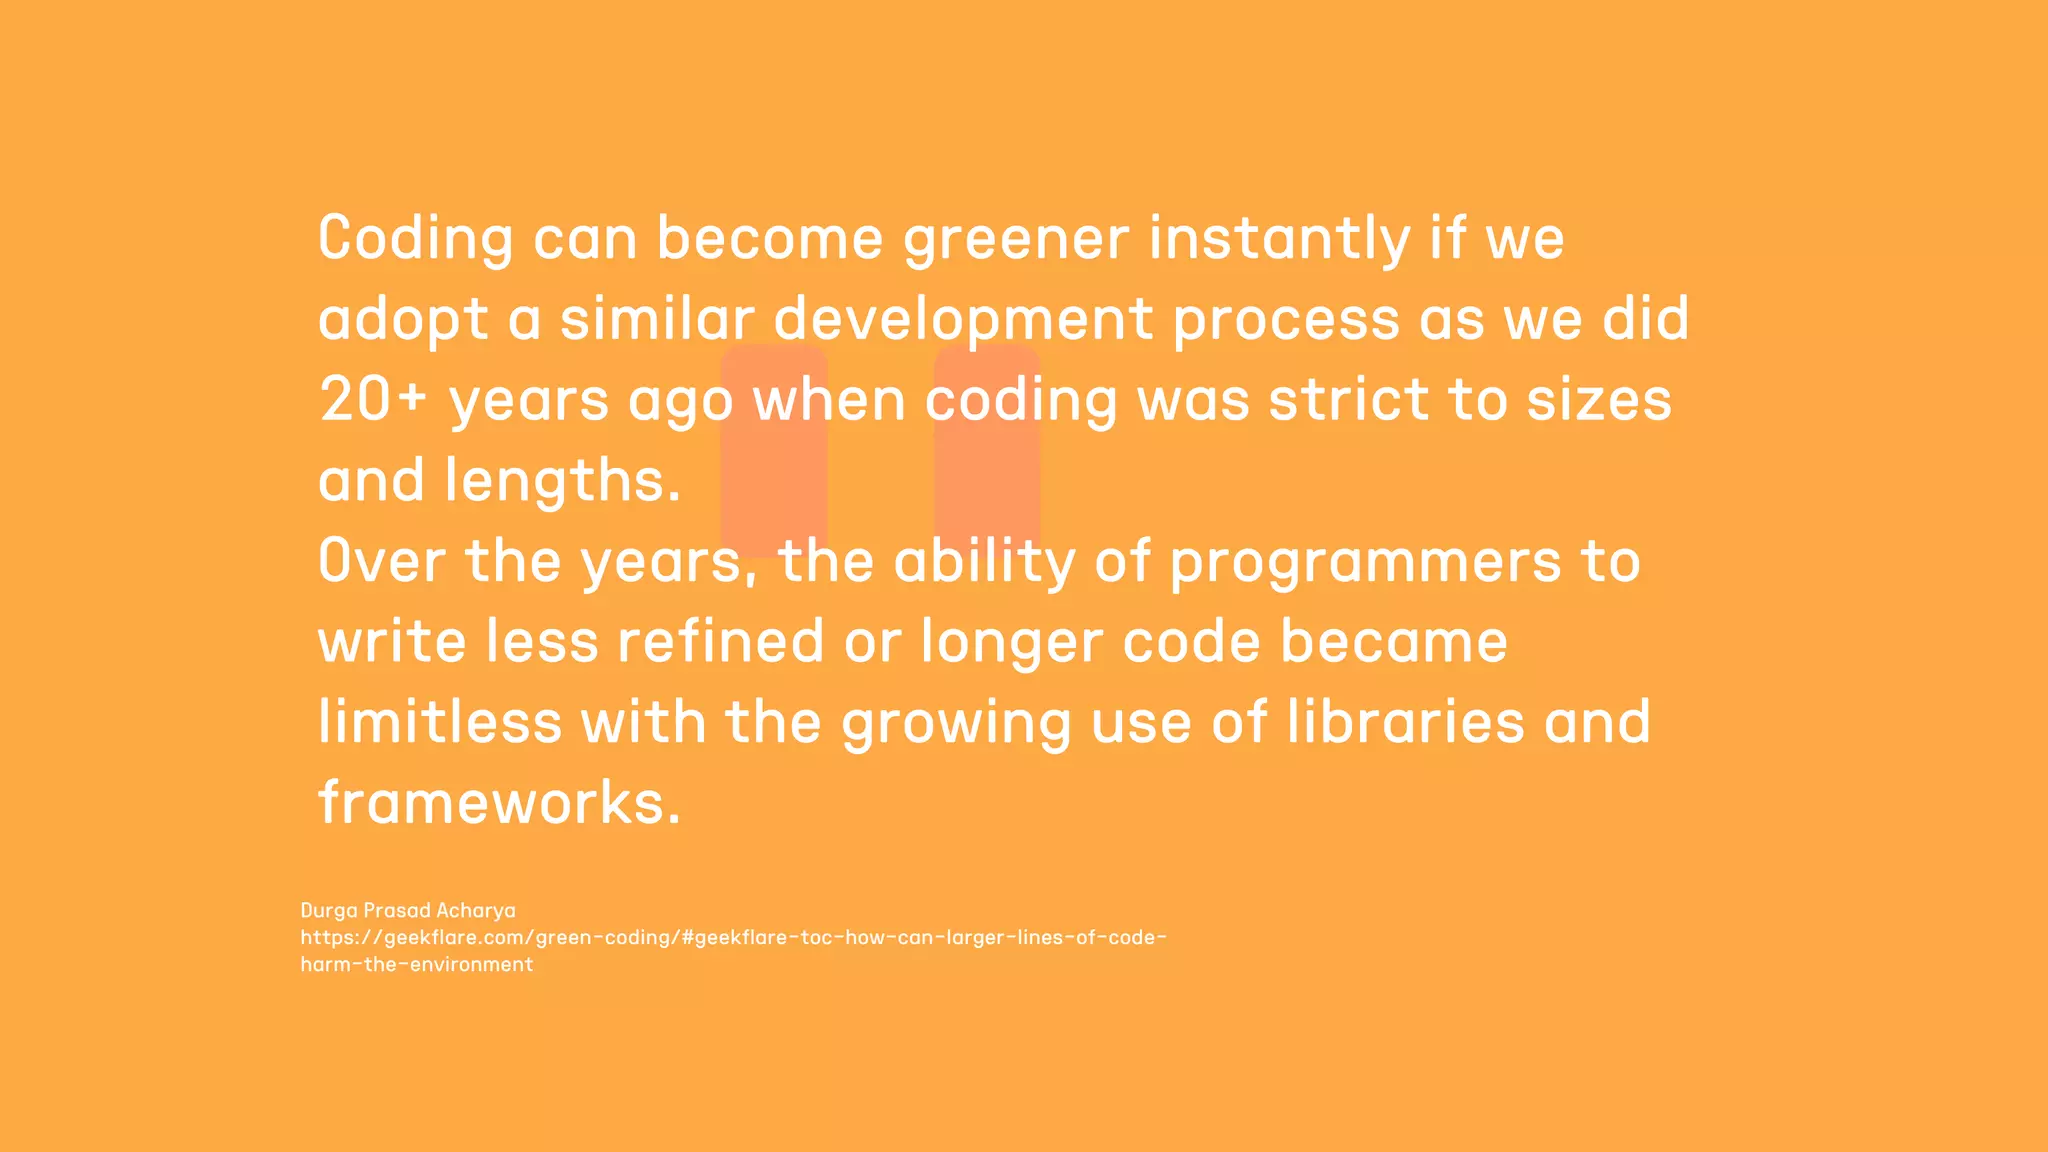
Advocates for environmentally friendly coding practices and the forthcoming need for sustainable development.
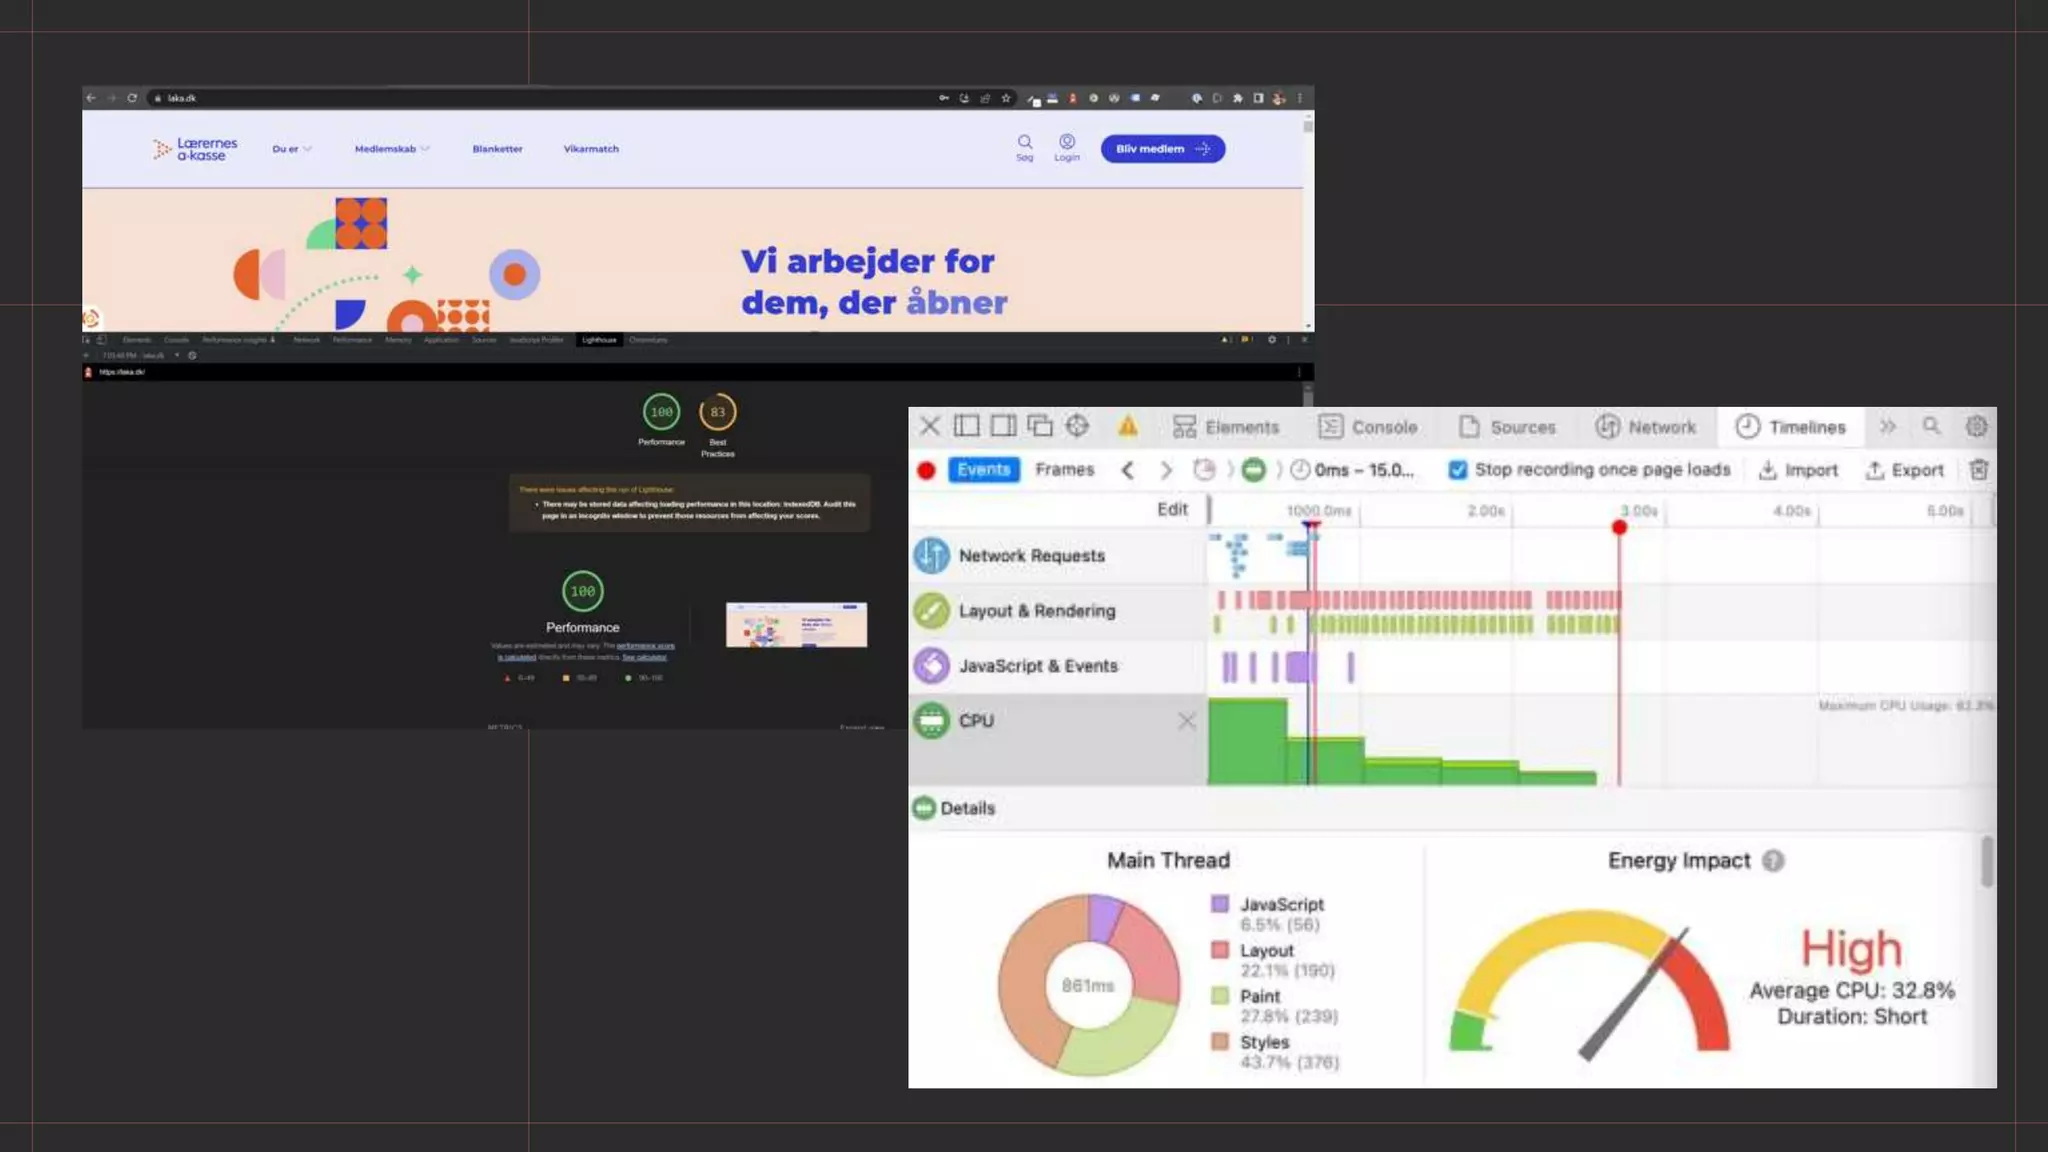
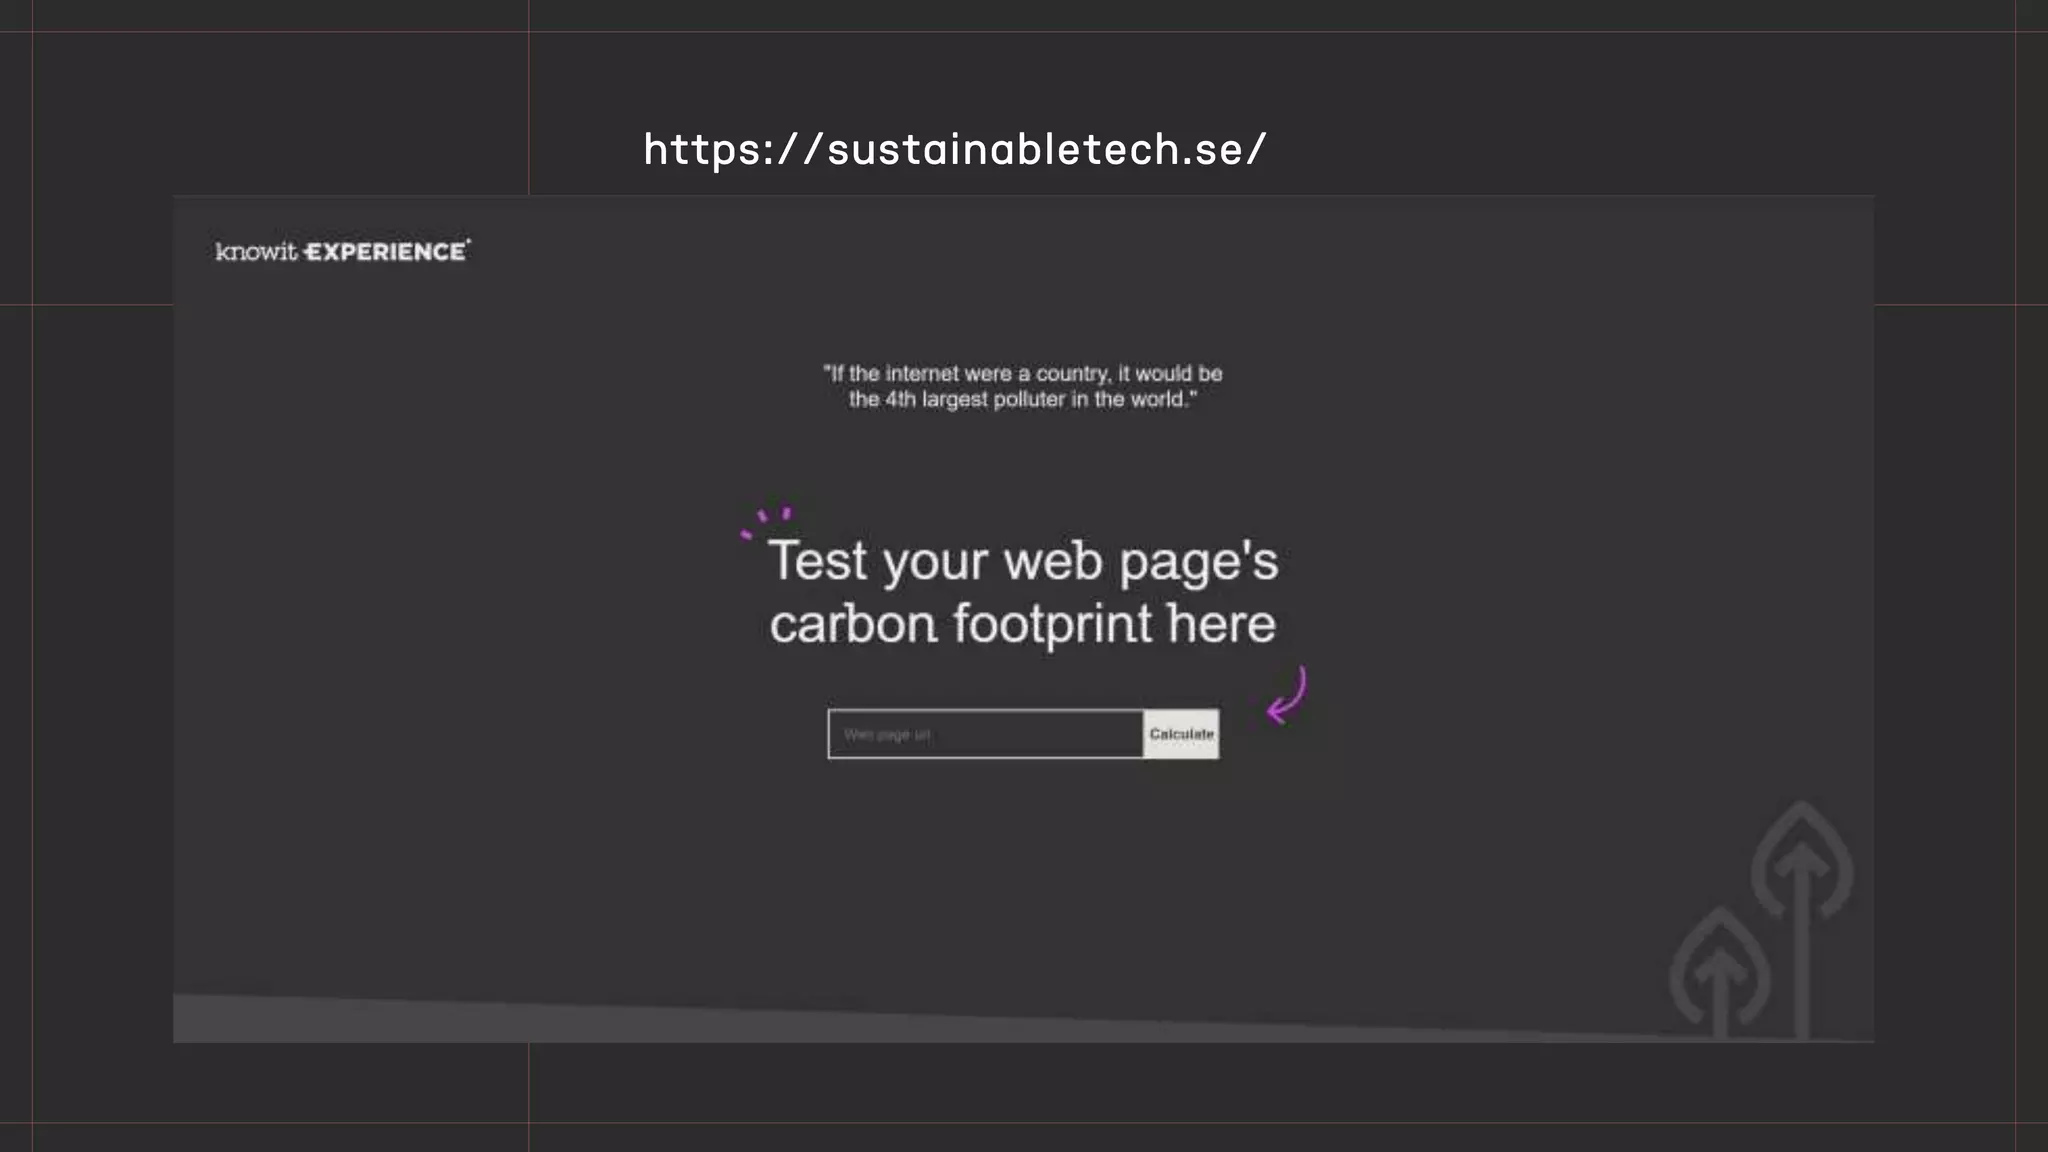
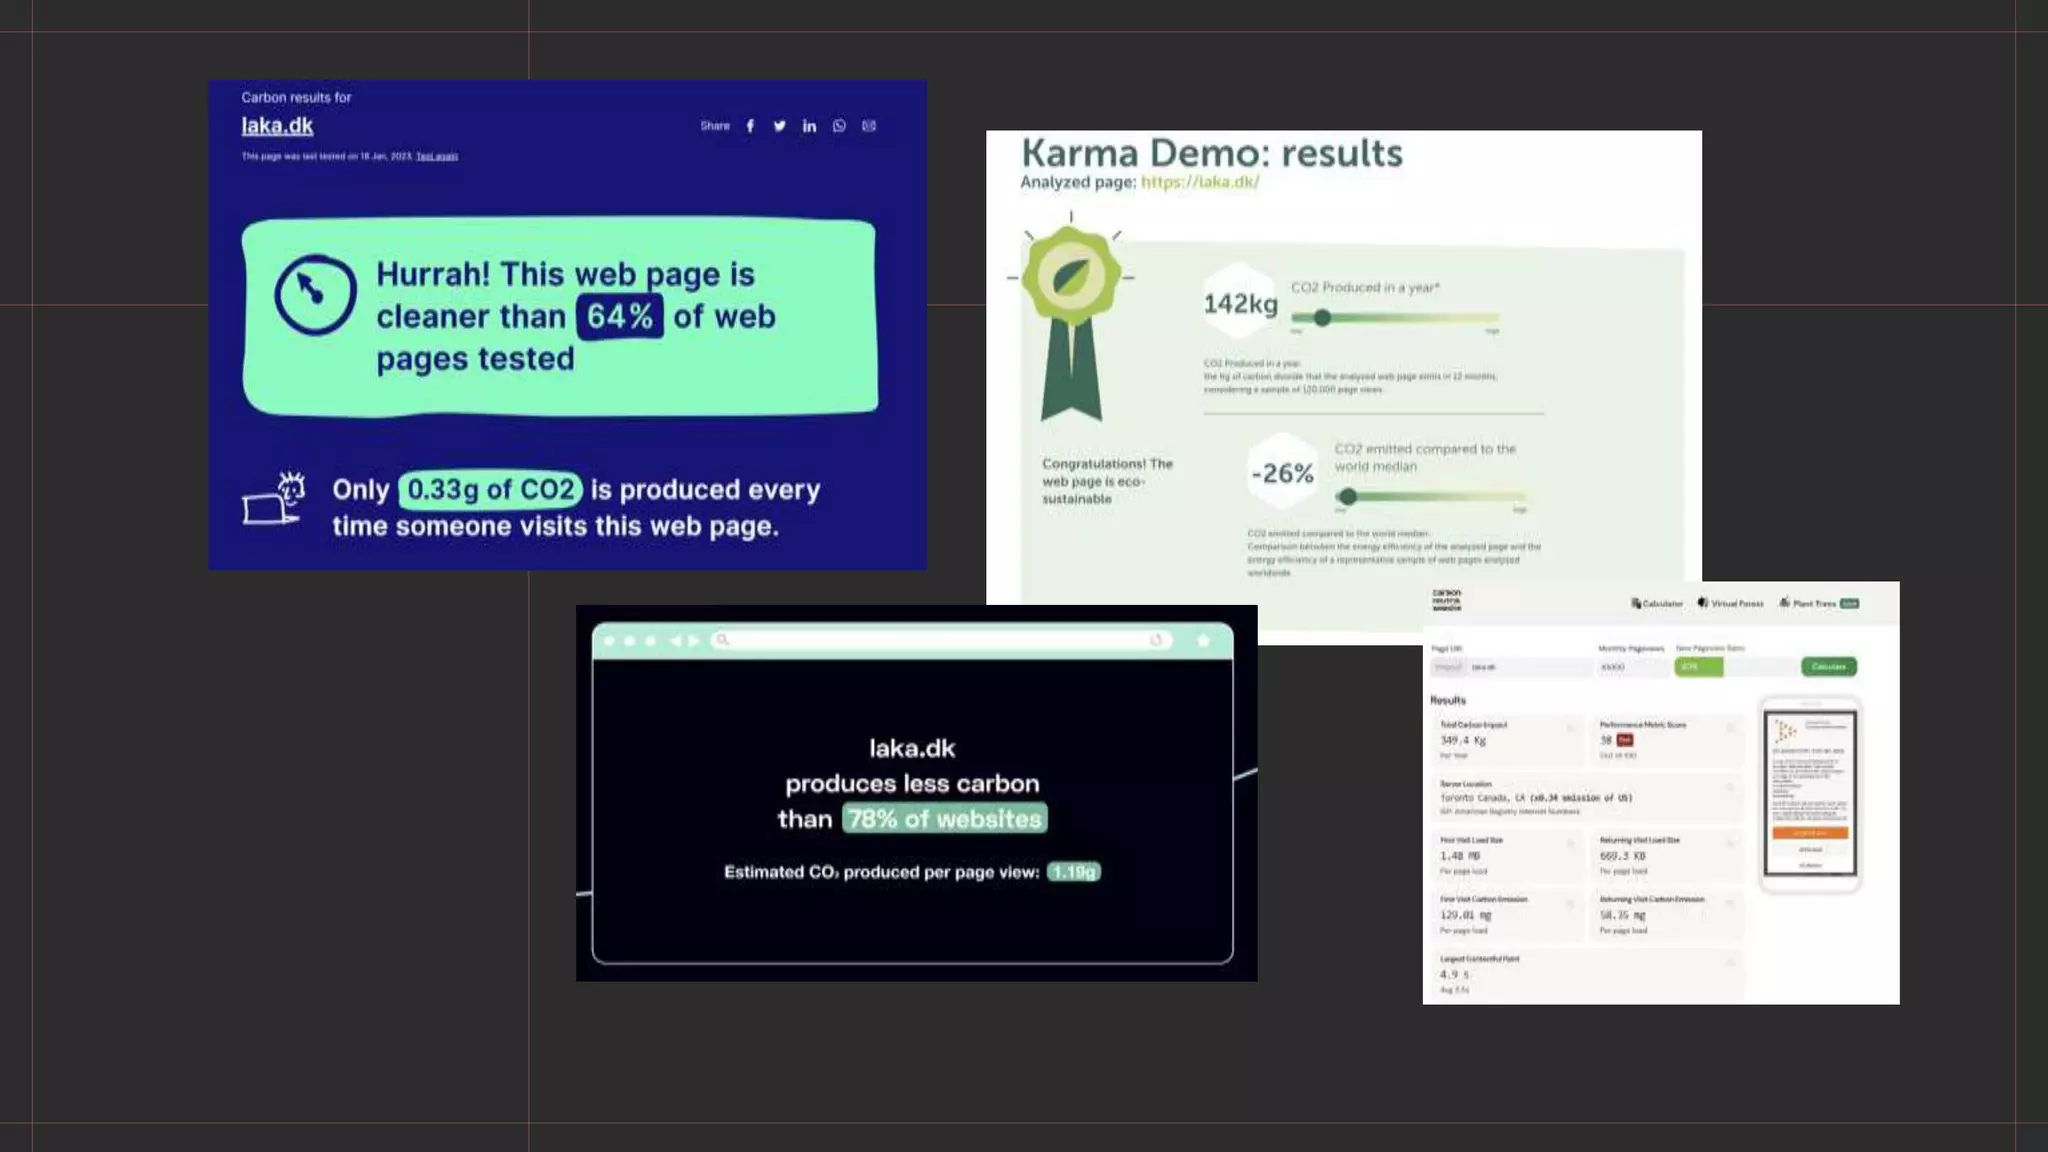
Methodologies for calculating energy use and CO2 emissions per website visit, encouraging measurement practices.
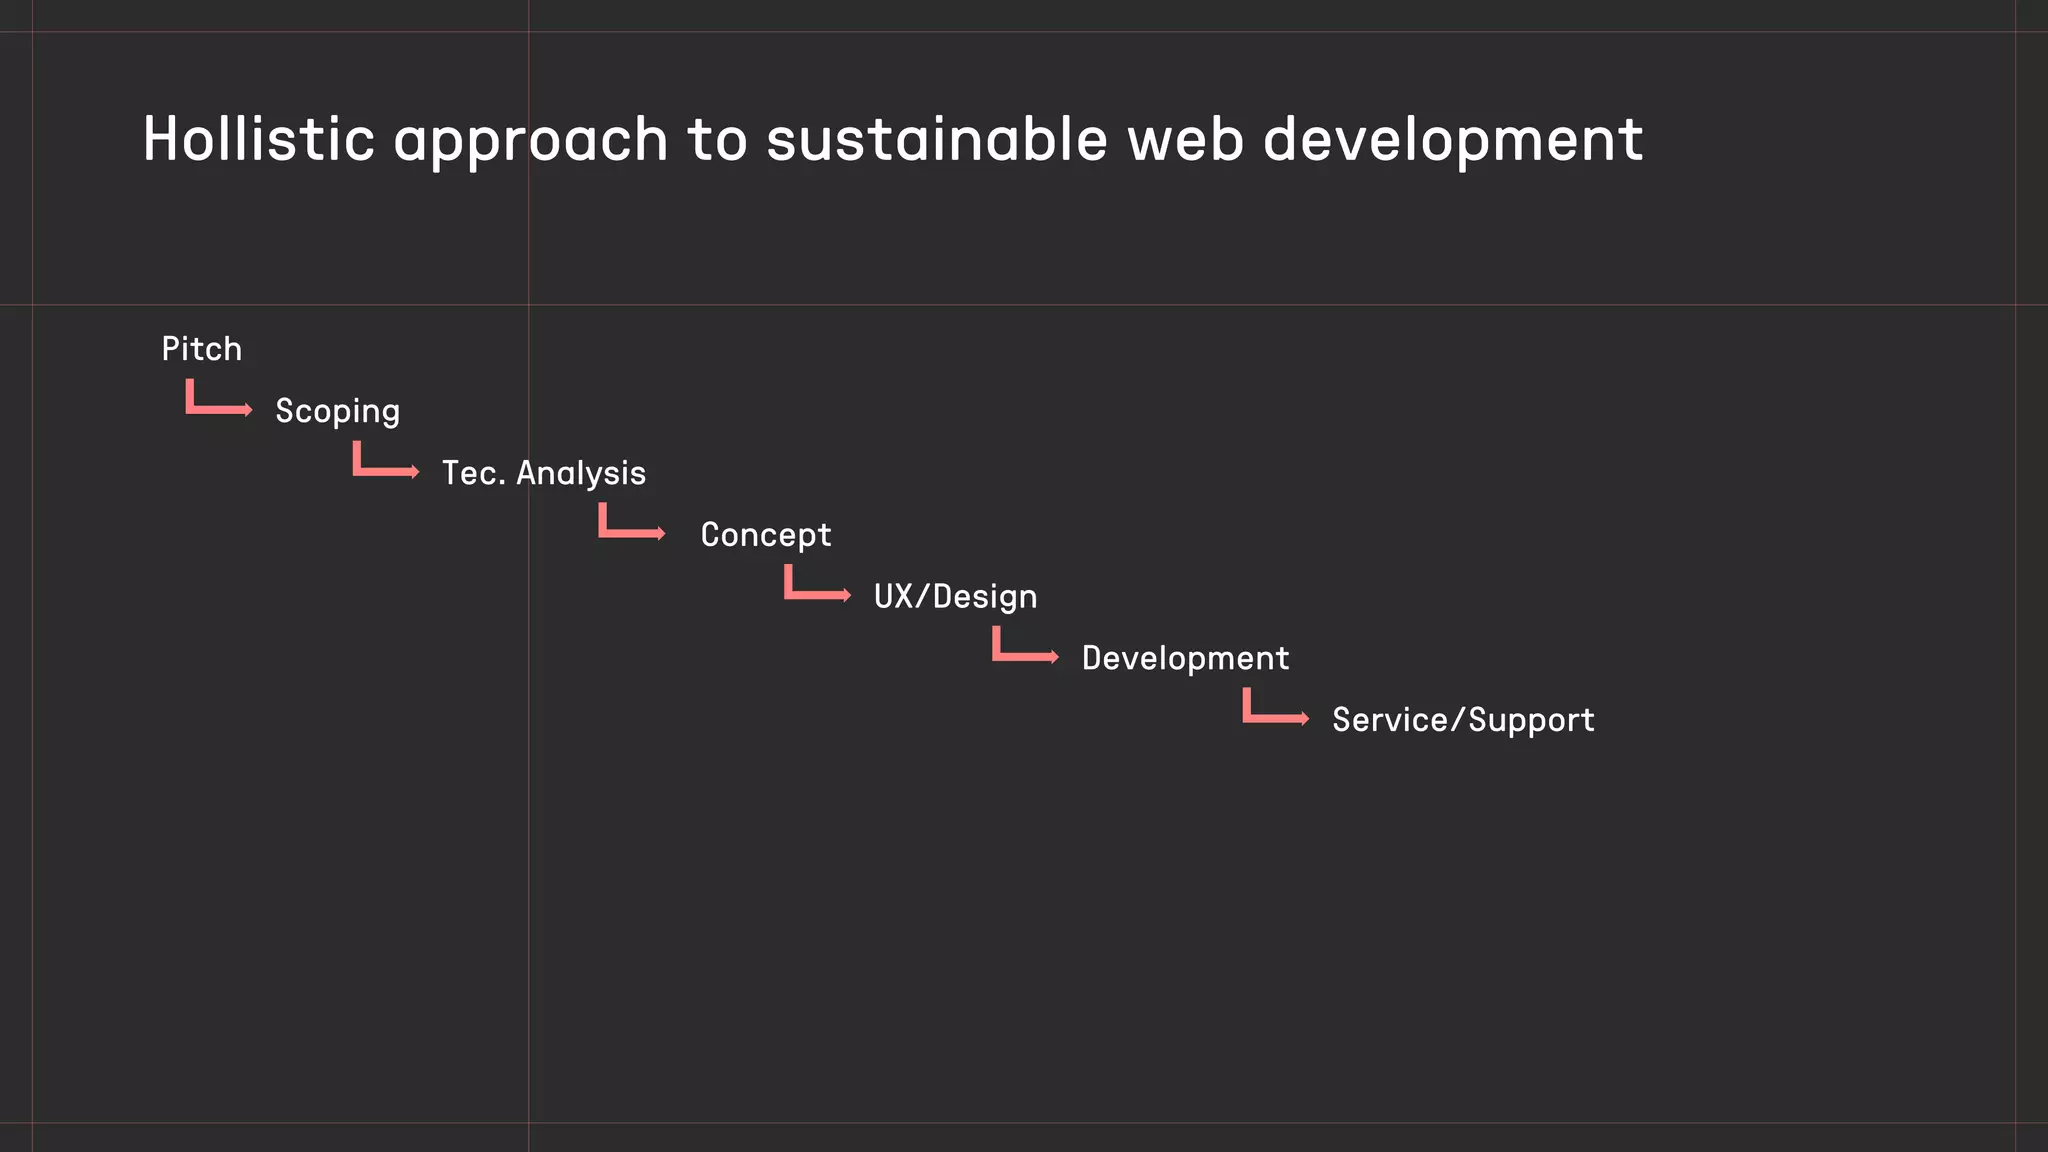
Emphasis on holistic sustainable web development, the 7 R’s of modernization, and a positive outlook on future improvements in sustainability.


![Soundtoys Mac v5.5.5.0 Crack for MacOS Full Version [Latest] pptx](https://cdn.slidesharecdn.com/ss_thumbnails/softwareoverview-251207193711-91d8ae6b-thumbnail.jpg?width=640&height=640&fit=bounds)

![WinRAR Crack 7.13 Final Mac Keygen 2026 Download [Latest] Software.pptx](https://cdn.slidesharecdn.com/ss_thumbnails/software-251207185858-eb450678-thumbnail.jpg?width=640&height=640&fit=bounds)

![iStat Menus 7.20 Crack for MacOS 2026 Full Version [Latest] pptx](https://cdn.slidesharecdn.com/ss_thumbnails/softwareoverview-251207191544-22b737dc-thumbnail.jpg?width=640&height=640&fit=bounds)

![Driver Easy Pro Key 7.1.0.2641 Full Mac Crack Free Activated Download [2026]....](https://cdn.slidesharecdn.com/ss_thumbnails/software-251207185324-b2fb71b4-thumbnail.jpg?width=640&height=640&fit=bounds)


![AnyTrans for iOS 8.9.14.20251127 With Crack for MacOS [Latest] pptx](https://cdn.slidesharecdn.com/ss_thumbnails/softwareoverview-251207190907-2316965f-thumbnail.jpg?width=640&height=640&fit=bounds)
![Chapter4_Initiation_of_Sediment_Motion_v2[1].pptx](https://cdn.slidesharecdn.com/ss_thumbnails/chapter4initiationofsedimentmotionv21-251208223747-f94ef163-thumbnail.jpg?width=640&height=640&fit=bounds)


![PowerISO 9.2 Mac Crack + Serial Key Free Download 2026 [Latest] Software.pptx](https://cdn.slidesharecdn.com/ss_thumbnails/software-251207185653-5d5700e6-thumbnail.jpg?width=640&height=640&fit=bounds)


