The document provides an introduction to the Abu Dhabi Roadside Design Guide. It discusses the background and purpose of developing uniform roadside design standards and guidelines for Abu Dhabi. It outlines the key approaches taken in the guide, including using a performance-based rather than prescriptive approach, emphasizing proprietary rather than non-proprietary systems, adopting American testing standards over European ones, and using a single testing standard. The scope of the guide is also summarized, covering topics like the risk mitigation process, clear zone concepts and calculations, hazard identification, passively safe design, and descriptions of different barrier types.
![ROADSIDE DESIGN GUIDE
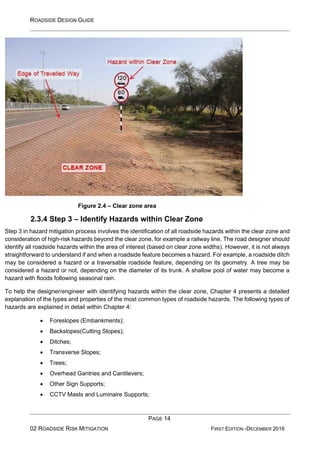
PAGE 1
01 INTRODUCTION FIRST EDITION -DECEMBER 2016
1 INTRODUCTION
1.1 Overview
In 2010, the Abu Dhabi Department of Municipal Affairs and Transport commenced with the “Unifying and
Standardizing of Road Engineering Practices” Project. The objective of the project was to enhance the
management, planning, design, construction, maintenance and operation of all roads and related
infrastructures in the Emirate and ensure a safe and uniform operational and structural capacity throughout
the road network.
To achieve this objective a set of standards, specifications, guidelines and manuals were developed in
consultation with all relevant authorities in the Abu Dhabi Emirate, including the Department of Municipal Affairs
(DMA) and Urban Planning Council (UPC). In future, all authorities or agencies involved in roads and road
infrastructures in the Emirate shall exercise their functions and responsibilities in accordance with these
documents. The purpose, scope and applicability of each document are clearly indicated in each document.
It is recognized that there are already published documents with similar objectives and contents prepared by
other authorities. Such related publications are mentioned in each new document and are being superseded
by the publication of the new document, except in cases where previously published documents are recognized
and referenced in the new document.
1.2 Purpose and scope
The guidance supplied in this document, the Abu Dhabi Roadside Design Guide (ADRSDG), is based on
established international practices. This especially includes the American Association of State Highway and
Transportation Officials (AASHTO) Roadside Design Guide [1] and is supplemented by recent research and
documents prepared by the CEDR funded ‘SAVERS’ [2] project, the United Kingdom, Austroads [3] and Dubai
[4].
This Guide has been prepared to provide uniform practices for government transport agencies within the Abu
Dhabi Emirate and consultant personnel preparing studies, reports and contract road plans for these agencies.
The designer should use this document to develop roadside designs that meet the operational and safety
requirements while preserving the aesthetic, historic, and cultural resources of an area. This Guide will be
updated regularly as new data and experience with best practices become available.
Roadside design is defined as the design of the area between the outside shoulder edge and the right-of-way
limits. The Abu Dhabi Emirate is reducing the number of fatalities year on year, however, roadside crashes
account for a significant portion of the total fatal highway crashes. Approximately 25 percent are the result of
a single vehicle run-off-the-road crash. This emphasizes the importance of providing as safe a roadside design
as practical.
1.3 The application of the Abu Dhabi Roadside Design Guide
The guidance presented in this document is intended for the roadside design of new construction and major
reconstruction of roads and streets located within the Abu Dhabi road network. Local municipalities are
encouraged to adopt these guidelines to ensure uniformity of roadside designs](https://image.slidesharecdn.com/documento50-1-120-5152borrador-240214213429-246eea16/85/Documento-50-1-120-51-52-borrador-pdf-1-320.jpg)
![ROADSIDE DESIGN GUIDE
PAGE 1
01 INTRODUCTION FIRST EDITION -DECEMBER 2016
1 INTRODUCTION
1.1 Overview
In 2010, the Abu Dhabi Department of Municipal Affairs and Transport commenced with the “Unifying and
Standardizing of Road Engineering Practices” Project. The objective of the project was to enhance the
management, planning, design, construction, maintenance and operation of all roads and related
infrastructures in the Emirate and ensure a safe and uniform operational and structural capacity throughout
the road network.
To achieve this objective a set of standards, specifications, guidelines and manuals were developed in
consultation with all relevant authorities in the Abu Dhabi Emirate, including the Department of Municipal Affairs
(DMA) and Urban Planning Council (UPC). In future, all authorities or agencies involved in roads and road
infrastructures in the Emirate shall exercise their functions and responsibilities in accordance with these
documents. The purpose, scope and applicability of each document are clearly indicated in each document.
It is recognized that there are already published documents with similar objectives and contents prepared by
other authorities. Such related publications are mentioned in each new document and are being superseded
by the publication of the new document, except in cases where previously published documents are recognized
and referenced in the new document.
1.2 Purpose and scope
The guidance supplied in this document, the Abu Dhabi Roadside Design Guide (ADRSDG), is based on
established international practices. This especially includes the American Association of State Highway and
Transportation Officials (AASHTO) Roadside Design Guide [1] and is supplemented by recent research and
documents prepared by the CEDR funded ‘SAVERS’ [2] project, the United Kingdom, Austroads [3] and Dubai
[4].
This Guide has been prepared to provide uniform practices for government transport agencies within the Abu
Dhabi Emirate and consultant personnel preparing studies, reports and contract road plans for these agencies.
The designer should use this document to develop roadside designs that meet the operational and safety
requirements while preserving the aesthetic, historic, and cultural resources of an area. This Guide will be
updated regularly as new data and experience with best practices become available.
Roadside design is defined as the design of the area between the outside shoulder edge and the right-of-way
limits. The Abu Dhabi Emirate is reducing the number of fatalities year on year, however, roadside crashes
account for a significant portion of the total fatal highway crashes. Approximately 25 percent are the result of
a single vehicle run-off-the-road crash. This emphasizes the importance of providing as safe a roadside design
as practical.
1.3 The application of the Abu Dhabi Roadside Design Guide
The guidance presented in this document is intended for the roadside design of new construction and major
reconstruction of roads and streets located within the Abu Dhabi road network. Local municipalities are
encouraged to adopt these guidelines to ensure uniformity of roadside designs](https://image.slidesharecdn.com/documento50-1-120-5152borrador-240214213429-246eea16/75/Documento-50-1-120-51-52-borrador-pdf-1-2048.jpg)

![ROADSIDE DESIGN GUIDE
PAGE 4
01 INTRODUCTION FIRST EDITION -DECEMBER 2016
1.3.4 Use of a Single Testing Standard
In the past, barriers successfully tested to the requirements of USA NCHRP350 [5]/MASH [6], European
EN1317 [7], and non-proprietary systems were permitted for use on the Abu Dhabi road Network, and in many
other countries. However, the testing parameters for these two types of international systems are very different.
As a result, no comparison or equivalence can be assumed between systems tested to the different standards.
This can lead to, for example, inappropriate transitions between systems, and unknown levels of performance
where the performance of one system depends on that of another (for example where the performance of a
safety barrier relies on the performance of a terminal). For this reason it is recommended that systems which
are tested only to a single standard are permitted for future use on the Abu Dhabi road network.
1.3.5 The Use of NCHRP350 and MASH Tested Products Instead of
EN1317
The road network and the vehicle fleet in Abu Dhabi are more similar to an American one rather than a
European one. The adoption of the American testing standards NCHRP350 and MASH are felt to be more
suitable for the Abu Dhabi road network, over the European test standard EN1317 for the reasons explained
in the following sub-sections. However, it is felt that the knowledge of the European test standard EN1317 [7]
can still be useful to designers/engineers, especially when comparing VRS products tested to different
standards. The Appendix A provides a brief overview of the EN1317. The information provided includes the
test types and performance classes and test criteria for barriers, bridge parapets, terminals, transitions and
crash cushions.
1.3.5.1 Weight of Vehicles used in NCHRP350, MASH & EN1317
Vehicles used in NCHRP350 and more recently MASH, represent larger and heavier vehicles, such as pickup
trucks, which are more common in the USA; whilst EN1317 uses smaller and lighter vehicles which are more
common in Europe. This can be seen by comparing Test Level-3 of MASH and NCHRP350 to containment
level N2 of EN1317 as these are the most commonly used base performance criteria for America and Europe,
respectively.
In MASH, a product should perform satisfactorily during impact testing to achieve the basic test level TL-3
using a 1,100 kg passenger car and a 2,270kg pickup truck. While in EN1317 to achieve an N2 containment
level, a barrier should perform satisfactorily using a 900kg passenger car and a 1,500kg passenger car (see
Appendix A). There is currently no vehicle type in EN1317 which represents an SUV or a pickup truck, which
are common in the Abu Dhabi vehicle fleet.
As a result, it can be said that American testing standards MASH and NCHRP350, offer a better representation
of the vehicle fleet, more specifically enabling vehicle restraint systems to prove their ability to safely contain
and redirect (under standard testing conditions) the high percentage of SUVs in Abu Dhabi; while the vehicle
classes in EN1317 do not represent the SUVs and therefore are not guaranteed to work on impact with these
types of vehicles.
1.3.5.2 Height of Vehicles used in NCHRP350, MASH & EN1317
The weight of the vehicles used in NCHRP350 and MASH are a better representation of the SUVs which
represent a high percentage of the vehicles used in Abu Dhabi. However, it is not only the](https://image.slidesharecdn.com/documento50-1-120-5152borrador-240214213429-246eea16/85/Documento-50-1-120-51-52-borrador-pdf-4-320.jpg)
![ROADSIDE DESIGN GUIDE
PAGE 8
01 INTRODUCTION FIRST EDITION -DECEMBER 2016
Guidance is provided on the lateral offset required between the roadway and the roadside hazards, for different
road configurations, such as curves, merge locations and junctions. Information is also provided on the specific
applications for pedestrian and bicyclist facilities. Finally, specific guidance is provided into the application of
common urban roadside features, such as curbs, pedestrian barriers, street furniture, etc.
1.5 References
[1]AASHTO, Roadside Design Guide, 4th Edition, Washington D.C.: American Association of State Highway
and Transportation Officials, 2011.
[2]CEDR, “SAVERS (Selection of Appropriate Vehicle Restraint Systems) - WP1: Defining the Different
Parameters which can Influence the Need and Selection of VRS (Unpublished Report),” Conference of
European Directors of Roads, 2014.
[3]Austroads, Guide to Road Design Part 6: Roadside Design, Safety and Barriers, Sydney, NSW: Austroads,
2010.
[4]Roads & Transport Authority, Roadside Design Guide for Dubai, First Edition, Dubai: RTA, 2008.
[5]NCHRP, “NCHRP Report 350, Recommended Procedures for the Safety Performance Evaluation of
Highway Features,” Transportation Research Board, National Research Council, Washington DC, 1993.
[6]AASHTO, “Manual for Assessing Safety Hardware,” Ammerican Association of State Highway and
Transportation Officials, Washington DC, 2009.
[7]CEN , “EN 1317 Road Restraint Systems - Part 2: Performance classes, impact test
acceptance criteria and test methods for safety barriers including vehicle parapets,” CEN (European
Committee for Standardization), Brussels, 2010.](https://image.slidesharecdn.com/documento50-1-120-5152borrador-240214213429-246eea16/85/Documento-50-1-120-51-52-borrador-pdf-8-320.jpg)
![ROADSIDE DESIGN GUIDE
PAGE 9
02 ROADSIDE RISK MITIGATION FIRST EDITION -DECEMBER 2016
2 ROADSIDE RISK MITIGATION
2.1 Introduction
There are many reasons why vehicles may leave the road and potentially encroach on the roadside. These
include:
• Driver fatigue or inattention;
• Excessive speed;
• Crash avoidance;
• Roadway conditions (e.g. pavement deterioration);
• Vehicle component failure;
• Poor visibility; and
• Driver impairment.
When a vehicle runs off the road, it may reach a hazard, collide or overturn; all of which may result in injuries
or even fatalities. These casualties may be reduced by making every roadside flat, traversable and free of
obstacles; therefore giving enough space to errant vehicles to regain control and return to the road with a
reduced likelihood of injury. However, in reality this is not always possible due to physical and economic
constraints. Engineers and designers often have to find an optimal solution; one that finds a balance between
the maximum amount of safety and economic feasibility.
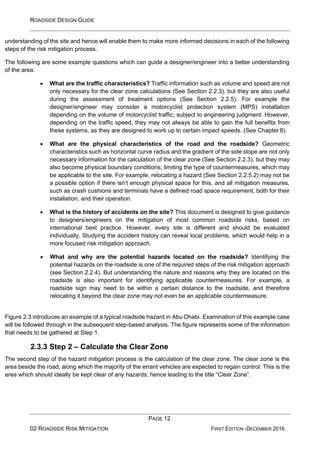
A good way of achieving this is to evaluate each roadside on a case by case basis with a risk based approach.
Not every road has the same probability of a vehicle running off the road, nor does every roadside hazard
have the same level of consequences, if reached by an errant vehicle. It is important to identify and prioritise
the sites with a higher level of risk and apply the necessary countermeasures to keep the risk to a reasonable
level.
This approach forms the basis for the roadside design guides and standards of many countries around the
world [1]. In the UK the decision for roadside treatments is based on The Road Restraint Risk Assessment
Process (RRRAP); a software based tool which aims to decrease the level of risk for the evaluated area to “As
Low as Reasonably Practicable” [2]. In Germany, the decision on whether to implement a roadside barrier is
based on the probability of a vehicle running off the road and the level of risk posed by different type of hazards
[3]. In the United States, a recommended practice is the evaluation of different roadside treatment options with
Roadside Safety Analysis Program (RSAP); a risk based benefit/cost analysis tool [4].
Following International best practice, the Abu Dhabi Roadside Design Guide is structured as an easy to use
and understand roadside risk mitigation tool.
This chapter presents an explanation of the concept of risk from a roadside safety perspective and the
recommended risk mitigation approach of this Guide.](https://image.slidesharecdn.com/documento50-1-120-5152borrador-240214213429-246eea16/85/Documento-50-1-120-51-52-borrador-pdf-9-320.jpg)
![ROADSIDE DESIGN GUIDE
PAGE 26
02 ROADSIDE RISK MITIGATION FIRST EDITION -DECEMBER 2016
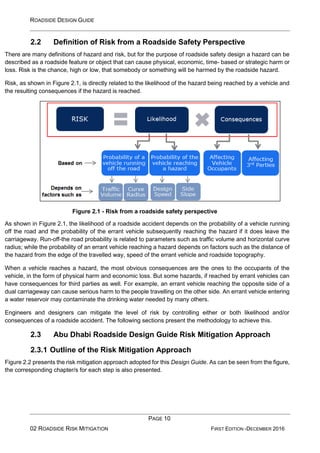
Risk, from a roadside safety perspective, is defined as the probability, high or low, that somebody or something
will be harmed by a roadside hazard. Roadside risk is directly related to both the likelihood of a roadside
accident and the consequences of it. Designers/engineers can mitigate the risk by controlling either or both
the likelihood or consequences of a run-off-the road accident, through the recommended treatment options.
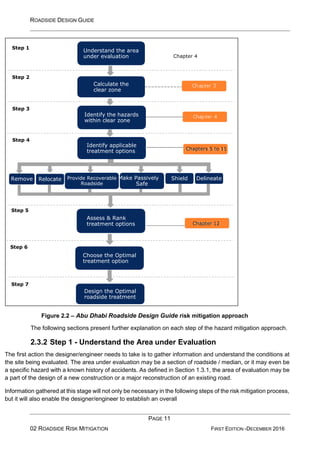
The recommended risk mitigation approach consists of the following stages:
1. Understand the area under evaluation;
2. Calculate the clear zone;
3. Identify the hazards located within the clear zone;
4. Identify applicable treatment options to mitigate risks from the hazards located within the
clear zone. Recommended treatment options include:
o Remove the hazard;
o Relocate the hazard;
o Provide recoverable roadside;
o Replace the hazard with a passively safe system;
o Shield the hazard with a VRS;
o Delineate the hazard;
5. Assess and rank applicable treatment options:
o Assess physical applicability;
o Assess economic feasibility;
o Rank treatment options economically;
o Assess non-monetary considerations;
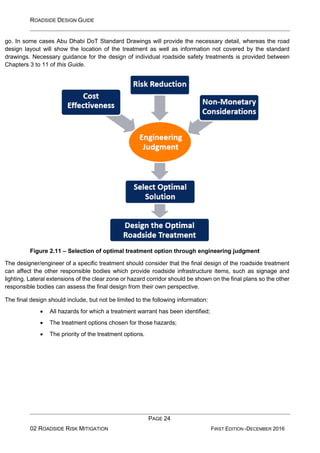
6. Choose the optimal treatment option through engineering judgment;
7. Design the appropriate (optimal) roadside treatment.
An overview of the DoT product approval process is also given in this chapter. Prior to the use of any
proprietary vehicle restraint system on the Abu Dhabi road network, the system must have been accepted for
use by the Abu Dhabi Department of Municipal Affairs and Transport, or its representatives.
2.6 References
[1]CEDR, “SAVERS (Selection of Appropriate Vehicle Restraint Systems) - WP1: Defining the Different
Parameters which can Influence the Need and Selection of VRS (Unpublished Report),” Conference of
European Directors of Roads, 2014.
[2]TD19/06 Design Manual for Roads and Bridges, Volume2 Highway Structures: Design, Section
2 Special Structures, Part 8, The Highways Agency, Transport Scotland, Welsh Assembly Government,
The Department for Regional Development Norther Ireland, 2006.
[3]FGSV, Traffic Management Work Group, “Guidlines for passive protection on roads by vehicle](https://image.slidesharecdn.com/documento50-1-120-5152borrador-240214213429-246eea16/85/Documento-50-1-120-51-52-borrador-pdf-26-320.jpg)
![ROADSIDE DESIGN GUIDE
PAGE 27
02 ROADSIDE RISK MITIGATION FIRST EDITION -DECEMBER 2016
restraint systems,” FGSV Verlag GmbH, Koln, 2009.
[4] AASHTO, Roadside Design Guide, 4th Edition, Washington D.C.: American Association of State
Highway and Transportation Officials, 2011.](https://image.slidesharecdn.com/documento50-1-120-5152borrador-240214213429-246eea16/85/Documento-50-1-120-51-52-borrador-pdf-27-320.jpg)
![ROADSIDE DESIGN GUIDE
PAGE 28
03 CONCEPT AND CALCULATION OF CLEAR ZONE FIRST EDITION -DECEMBER 2016
3 CONCEPT AND CALCULATION OF CLEAR ZONE
3.1 Introduction
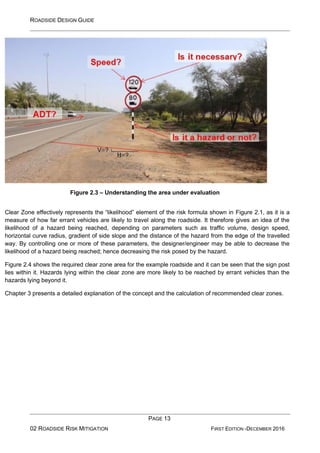
The “Clear Zone Concept” is a key part of this Guide’s risk mitigation process, as it provides engineers and
designers an easy to use tool for the assessment of risk of a roadside accident for selected road environments.
The chapter starts with a brief look at the concept of clear zone, its origins and its evolution over time. This is
followed by a look at the factors which may affect the required clear zone distance for different roads.
The Clear Zone Calculation Model for this Guide is presented in detail and followed by examples on clear zone
distance calculations.
3.2 The Clear Zone Concept
“The clear zone is the unobstructed, traversable area provided beyond the edge of the through travelled way
for the recovery of errant vehicles”. [1]
In an ideal world, providing unlimited, flat and obstacle-free areas along every road would completely eliminate
the problem of roadside accidents. However, in reality this is neither economically viable, nor physically
possible. For this reason, engineers and designers should assess the level of risk along each roadside and
find an optimal design solution; one which provides a balance between the amount of forgiving roadside
provided and the economic feasibility of the selected application.
Accordingly, AASHTO became the first organization to promote the idea of providing clear recovery areas
along highways. In 1974, the AASHTO document known as the “Yellow Book” stated that, “for adequate safety,
it is desirable to provide an unencumbered roadside recovery area that is as wide as practical on a specific
highway section. Studies have indicated that on high- speed highways, a width of 9 m or more from the edge
of the through travelled way permits about 80 percent of the errant vehicles leaving the roadway to recover.”
[2]. The idea of providing 9m wide clear zones was trialled by several highways agencies, and it was
understood that a constant width of recovery space is not always the optimal solution for roads with different
characteristics. Errant vehicles travel further along the roadside with increased traffic speeds, sharper
horizontal curves and steeper side slopes. Therefore 9m clear zone was not always enough for errant vehicles
to recover safely. On the other hand it was understood that 9m is too wide and economically not viable for
roads with lower speeds and traffic volumes.
For these reasons, in 1977 AASHTO modified its earlier clear zone concept by introducing variable clear-zone
distances based on traffic volumes, speeds and roadside geometry [3]. This new approach was well received
and became widespread. Many countries around the world today either use the exact AASHTO variable clear
zone model or modified versions of it to fit the specific needs of their road networks. [4]
The clear zone distances recommended by AASHTO Roadside Design Guide [1] are based on empirical
research data, which was later extrapolated to fill in the gaps of the database. Therefore, they are intended as
reference points rather than definitive values. It should be noted that these](https://image.slidesharecdn.com/documento50-1-120-5152borrador-240214213429-246eea16/85/Documento-50-1-120-51-52-borrador-pdf-28-320.jpg)
![ROADSIDE DESIGN GUIDE
PAGE 29
03 CONCEPT AND CALCULATION OF CLEAR ZONE FIRST EDITION -DECEMBER 2016
clear zone values, although considered sufficient for majority of errant vehicles to safely regain control, are not
enough to stop all 100% of errant vehicles. For example, the recommended clear zone widths may not be
enough for an over-speeding errant vehicle to safely regain control. A clear zone, where even the over-
speeding errant vehicles would regain control before reaching the end, would require a considerably wider
space. However, considering the low probability of such incidents, providing this extra space is not always
economically viable. However, The Abu Dhabi DoT lately extended the speed range of AASHTO Table, shown
in Table 3.2, up to 140 km/h. The values given were only extracted by interpolating the trend of previous speed
ranges given by AASHTO.
The relationship between the distance from the edge of the travelled way to a hazard and the proportion of
errant vehicles that will be able to reach the hazard has been the subject of several researches. One of the
most comprehensive datasets of run-off-road accidents was collected during late 1970s in Canada by P.
Cooper [5]. Cooper’s research involved weekly observations of wheel tracks on grass-covered roadsides of
rural highways of various functional classes, where he looked at the distance travelled by errant vehicles.
Cooper’s encroachment data was later re-analysed for development of the RSAP [6], and the relationship
shown in Figure 3.1 was derived. Figure 3.1 shows the proportion of errant vehicles which are expected to
travel over a certain distance from the edge of the travelled way during a run-off-road accident. The relationship
is presented for two-lane undivided roads, multi-lane divided roads and for the combination of both undivided
and divided roads. It can be seen from the figure that, as the distance from the edge of the travelled way
increases, the proportion of errant vehicles which are likely to reach the distance decreases.
Figure 3.1 shows that clear zone distances recommended by AASHTO are likely to allow enough space for
approximately 85% of the errant vehicles to stop or regain control. In other words, roughly 15% of errant
vehicles could still reach a hazard beyond these distances. A considerably wider space is required to ensure
that more than 85% of the errant vehicles will stop within the clear zone. For example for divided road,
increasing the proportion of vehicles which would stop within the clear zone from 85% to 95%, would require
the clear zone distance to increase from roughly around 12m to 20m. To take the same ratio from around 85%
to around 100%, the clear zone distance should almost be tripled from 12m to 30m. The considerable increase
in the required clear zone to cater for every single possible incident may not always be justified due to
economic reasons. Therefore, the designer should always use engineering judgment on a site-by- site basis
when deciding the acceptable clear zone distance.
However, some hazards, especially the ones where third parties may be affected, would yield more severe
consequences if reached by an errant vehicle. Examples of these are chemical plants, school playgrounds,
areas of public gathering, source of drinking water, etc. The consequences of a vehicle reaching these hazards
would be so high, that even a low likelihood of a vehicle reaching them would pose a significant risk (see
Section 2.2). For such high consequence hazards, the extra width required to increase the 85% mark to 95-
100% may be justified.
This approach of providing wider clear zones for higher consequence hazards is adopted by several countries
around the world. For example, the Norwegian VRS Manual [7] recommends up to doubling the clear zone
distance for higher risk hazards, while the German guidelines [8] recommend 8, 4 and 3m of extra clear zone
space for high risk hazards located close to highways of 100, 80 and 60km/h posted speed limit, respectively.
This approach forms the basis of the clear zone calculation model for the ADRSDG.](https://image.slidesharecdn.com/documento50-1-120-5152borrador-240214213429-246eea16/85/Documento-50-1-120-51-52-borrador-pdf-29-320.jpg)
![ROADSIDE DESIGN GUIDE
PAGE 30
03 CONCEPT AND CALCULATION OF CLEAR ZONE FIRST EDITION -DECEMBER 2016
Distance from the edge of travelled way (m)
Figure 3.1 – Distance from the edge of travelled way vs proportion of errant vehicles which may
reach it by highway type [6]
3.3 Factors Affecting the Clear Zone Distance
The required clear zone distance along a particular road is related to several factors. These factors are
explained briefly to provide an insight into how the clear zone calculation model works.
3.3.1 Traffic Volume
Traffic Volume is an important factor which affects the required clear zone distance, as it is directly related to
the exposure level of a roadside. Probability of a vehicle running off the road increases as the number of
vehicles passing through the area increases.
Traffic volume does not directly affect the distance travelled by an errant vehicle. However, there is an indirect
effect, as the probability of a faster vehicle running off the road increases with increased traffic volume. For
this reason, the required clear zone distance goes up with increased volume of traffic.
3.3.2 Design Speed
Design speed is another important factor, which affects the required clear zone distance. Design speed
determines the distance up to which an errant vehicle will travel and therefore the likelihood of the vehicle
reaching a hazard within a certain distance. For this reason, the required clear zone distance goes up with
increased design speed.
er
c
e
nt
of
v
e
hi
cl
e
s
e
x
c
e
e
di
10](https://image.slidesharecdn.com/documento50-1-120-5152borrador-240214213429-246eea16/85/Documento-50-1-120-51-52-borrador-pdf-30-320.jpg)
![ROADSIDE DESIGN GUIDE
PAGE 33
03 CONCEPT AND CALCULATION OF CLEAR ZONE FIRST EDITION -DECEMBER 2016
probability of a vehicle reaching them. Therefore, high risk hazards affect the required clear zone distance,
as they can economically justify the provision of wider clear zones.
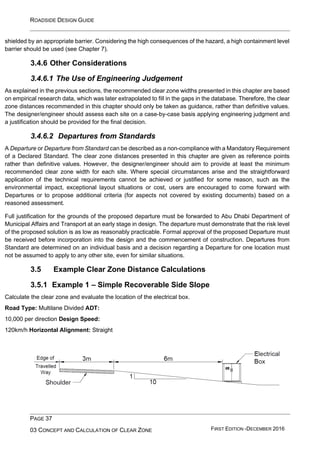
3.4 Calculation of Clear Zone Distance
3.4.1 Clear Zone Model
The clear zone is calculated by using the following formula, as detailed in Table 3.1:
Where:
Table 3.1 – Calculation of clear zone distance, Cz
Calculation of Clear Zone Distance, Cz
Cz=(Bcw x Mc)
Bcw, Base Clear Zone Width See Table 3.2
Mc, Modification Factor for
Outside of Horizontal Curves
Straight Sections & Inside of Curves Mc=1.0
Outside of Curves See Table 3.3
3.4.2 Base Clear Zone Width
The base clear zone width is the recommended clear zone width from the edge of the travelled way for straight
road sections, and it is determined on the basis of ADT, Design Speed and Side Slope, by using Table 3.2.
The clear zone distances presented in Table 3.2 are based on the clear zone distances suggested by AASHTO
Roadside Design Guide [1]. To cater for the needs of the Abu Dhabi Road Network the AASHTO clear zone
values are extrapolated for design speeds up to 140km/h.
The clear zone values presented in Table 3.2 are based on empirical research data, which was later
extrapolated to fill in the gaps of the database. Therefore, they are intended as guidance values rather than
definitive values. It should be remembered that, as explained in Section 3.2, some vehicles can still travel
further than these recommended clear zone distances. Therefore, designer/engineer should assess the risk
for each site on a case-by-case basis, using engineering judgment.
In Table 3.2, a two-way ADT should be used for single carriageways and one-way ADT should be used per
direction of dual carriageways. The traffic volumes should be based on a 20-year projection from the
anticipated date of construction. For recommended clear zone widths over 15m, an additional assessment
should be carried out to justify the required empty space, as these are likely to cross the right-of-way limitations.](https://image.slidesharecdn.com/documento50-1-120-5152borrador-240214213429-246eea16/85/Documento-50-1-120-51-52-borrador-pdf-33-320.jpg)
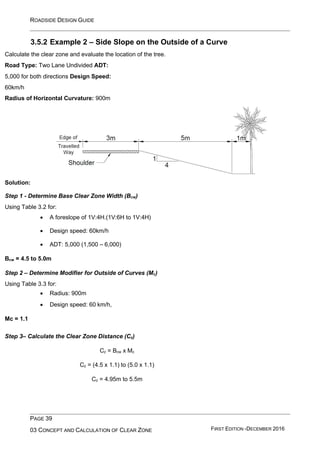
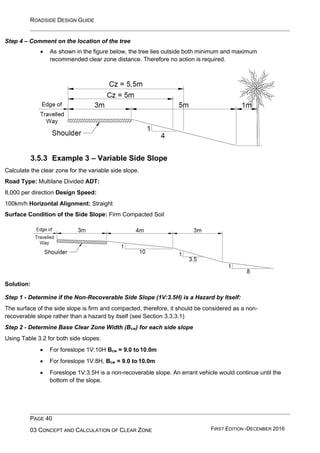
![ROADSIDE DESIGN GUIDE
PAGE 35
03 CONCEPT AND CALCULATION OF CLEAR ZONE FIRST EDITION -DECEMBER 2016
3.4.3 Modification for the Outside of Curves
The base clear zone width (Bcw) values in Section 3.4.2 assume a tangent alignment. However, horizontal
curves may increase the angle of departure from the roadway and thus increase the distance the vehicle will
need to recover. The designer should adjust the tangent values to provide wider clear zones on the outside of
horizontal curves. Table 3.3 provides recommended modification factors for the outside of curves (Mc). A value
of Mc=1.0 should be used for straight sections and insides of curves, as a modification is not necessary for
these.
3.4.4 Clear Zone on Combination of Slopes
3.4.4.1 Variable Slopes
Sometimes a combination of two different side slopes may be used on a roadside, as shown in Figure 3.5. A
common application is a relatively flat recovery area immediately adjacent to the roadway followed by a steeper
foreslope. This type of application, often called as ‘barn roof’, can provide the flat recovery area by using less
material and space than a single continuous slope would require.
Figure 3.5 – Variable Slope
If the clear zone width required for the first slope does not reach the second one, no extra consideration is
necessary, as an errant vehicle would stop before reaching the second slope. If the clear zone width required
for the first slope extends beyond the first and overlaps into the second slope, the clear zone width for the
steeper slope should be used.
Table 3.3 – Modification factor for the outside of curves, Mc [1]
Radius (m)
Design Speed km/h
60 70 80 90 100 110 120
900 1.1 1.1 1.1 1.2 1.2 1.2 1.3
700 1.1 1.1 1.2 1.2 1.2 1.3 -
600 1.1 1.2 1.2 1.2 1.3 1.4 -
500 1.1 1.2 1.2 1.3 1.3 1.4 -
400 1.2 1.2 1.3 1.3 1.4 - -
300 1.2 1.3 1.4 1.5 1.5 - -
200 1.3 1.4 1.5 - - - -
100 1.5 - - - - - -](https://image.slidesharecdn.com/documento50-1-120-5152borrador-240214213429-246eea16/85/Documento-50-1-120-51-52-borrador-pdf-35-320.jpg)
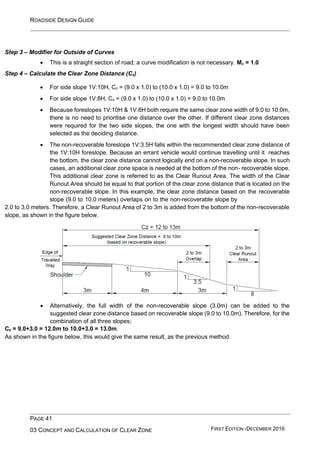
![ROADSIDE DESIGN GUIDE
PAGE 43
03 CONCEPT AND CALCULATION OF CLEAR ZONE FIRST EDITION -DECEMBER 2016
Cz = 11.0 to 12.5m
Step 4 – Check for High Risk Hazards
• There is a railway line located 3.0m further away from the minimum recommended clear
zone and 1.5m further away from the maximum recommended clear zone.
Step 5 – Comment on the location of the railway line
As shown in the figure above, the railway line does not lie within the normally recommended clear zone
distances. However, as explained in Section 3.2, a small percentage of errant vehicles may still travel further
than the recommended clear zone distance. Considering the high consequences of an errant vehicle reaching
a high-speed railway line, and the relatively close distance of the railway line to the minimum required clear
zone width (3.0m), it can be said that the level of risk posed by the current layout is unacceptable.
Designer/ Engineer should evaluate the following treatment options:
• Remove the railway line
• Relocate the railway line further away from the road
• Shield the railway line with an appropriate roadside barrier
3.6 References
[1] AASHTO, Roadside Design Guide, 4th Edition, Washington D.C.: American Association of State
Highway and Transportation Officials, 2011.
[2] J. Graham and D. Hardwood, “NCHRP Report 247: Effectiveness of Clear Recovery Zones,” NCHRP,
Transportation Research Board, Washington D.C., 1982.
[3] AASHTO, Guide for Selecting, Locating and Designing Traffic Barriers., Washington D.C.: American
Association of State Highway and Transportation Officials, 1977.
[4] CEDR, “SAVERS (Selection of Appropriate Vehicle Restraint Systems) - WP1: Defining the Different
Parameters which can Influence the Need and Selection of VRS (Unpublished Report),” Conference of
European Directors of Roads, 2014.
[5] P. Cooper, “Analysis of Roadside Encroachments - Single Vehicle Run-off-road Accident Data Analysis
for Five Provinces,” B.C. Research, Vancouver, British Columbia, Canada,](https://image.slidesharecdn.com/documento50-1-120-5152borrador-240214213429-246eea16/85/Documento-50-1-120-51-52-borrador-pdf-43-320.jpg)
![ROADSIDE DESIGN GUIDE
PAGE 44
03 CONCEPT AND CALCULATION OF CLEAR ZONE FIRST EDITION -DECEMBER 2016
March 1980.
[6] M. King and D. Sicking, “NCHRP 492 - Roadside Safety Analysis Program Engineer's
Manual,” Transportation Research Board, Washington, D.C., 2003.
[7] Norwegian Public Roads Administration, “Manual 231E, Vehicle Restraint Systems and
Roadside Areas,” Norwegian Directorate of Public Roads, Oslo, 2011.
[8] FGSV, Traffic Management Work Group, “Guidlines for passive protection on roads by vehicle
restraint systems,” FGSV Verlag GmbH, Koln, 2009.](https://image.slidesharecdn.com/documento50-1-120-5152borrador-240214213429-246eea16/85/Documento-50-1-120-51-52-borrador-pdf-44-320.jpg)
![ROADSIDE DESIGN GUIDE
PAGE 46
04 IDENTIFICATION OF HAZARDS FIRST EDITION -DECEMBER 2016
Table 4.1 – Guidance towards potential roadside hazards [1]
Type of Hazard Examples of Parameters to Evaluate
A - Hazards with Consequences to Vehicle Occupants
Roadside
Topography
Foreslopes (Embankments)
Backslopes (Cutting Slopes)
Gradient
Height
Compaction
Surface Condition
Ditches
Ditch Type
Gradient of Foreslope
Gradient of Backslope
Bottom Width
Compaction
Surface Condition
Transverse Slopes
Gradient Road
Type Design
Speed
Compaction
Surface Condition
Edges of Bridges & Retaining Walls Drop Height
Non-deformable
Single
Objects
Trees
Trunk Diameter
Stump Height
Overhead Gantries and Cantilevers Passively Safe or Not
Roadside Sign Supports
Support Structure
Diameter & Thickness of Support Posts
Passively Safe or Not
CCTV Masts and Luminaire Supports Passively Safe or Not
Concrete Foundations Protruding from the Ground Height from the Ground
Bridge Piers, abutments, tunnel portals Always considered as a hazard
Bridge Railing Ends & Ends of Concrete Barriers Always considered as a hazard
Above Ground Equipment Passively Safe or Not
Drainage Pipes & Culverts
Level with Ground Profile?
Pipe Diameter
Traversable or not?
Non-deformable
Continuous
Objects
Non-deformable extensive obstacles parallel to direction of
travel
Passively Safe or Not
Retaining walls Surface Roughness
Noise barriers Barrier Incorporated or not?
Fencing (Stone wall, wooden fence, concrete wall, etc.) Passively Safe or Not
Roadside Barriers Is it Necessary or not?
Permanent bodies or streams of water
Water Depth
Flooding Expected or not?
B - Hazards with Consequences to 3rd Parties
Adjacent Roads / Opposite Side of Dual Carriageways
Volume of Adjacent Road
Speed of Adjacent Road
Locations of Hazardous Material Storage such as Chemical Plants Always considered as a hazard
Structures at risk of collapse, support and load bearing Always considered as a hazard
Places of public gathering and heavy pedestrian activity
Average Number of People
Volume of Pedestrian Traffic
Average Time People are Exposed
Heavily used bicycle paths Volume of Bicycle Traffic
Structures at risk of collapse Always considered as a hazard
Adjacent Rail lines
Number of Trains per day
Average Speed of Trains
Area of environmental concern such as source of drinking water Always considered as a hazard](https://image.slidesharecdn.com/documento50-1-120-5152borrador-240214213429-246eea16/85/Documento-50-1-120-51-52-borrador-pdf-46-320.jpg)
![ROADSIDE DESIGN GUIDE
PAGE 47
04 IDENTIFICATION OF HAZARDS FIRST EDITION -DECEMBER 2016
4.3 Hazards with Risk to Vehicle Occupants
4.3.1 Roadside Topography
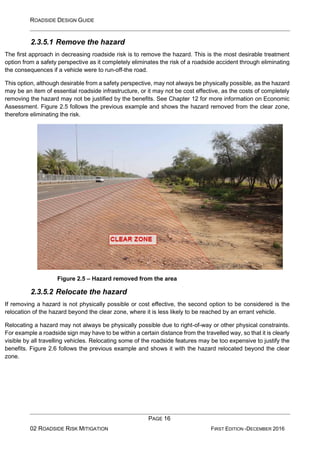
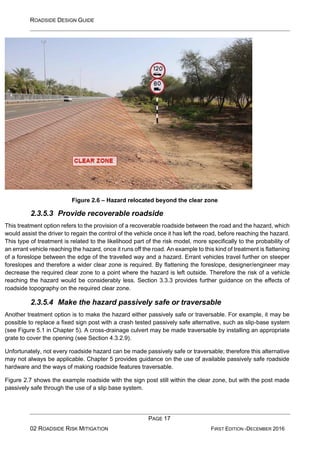
4.3.1.1 Fill Slopes / Embankments
Fill slopes / embankments are the front slopes extending outward and downward from the shoulder or verge
hinge point to intersect with the natural ground line. Consequences of reaching a fill slope for an errant vehicle
may be more serious depending on height, gradient, surface condition and compactness of the slope. A steep
embankment with a very high drop, such as the one shown in Figure 4.1, is an obvious hazard for errant
motorists. However, for embankments with less steep side slopes and lower drops, it may not always be
obvious if a foreslope should be considered as a hazard.
Figure 4.1 – A hazardous embankment
A foreslope of 1V:3H or steeper, such as the one shown in Figure 4.2, is considered as critical (see Section
3.3.3.1) and a hazard by many countries around the world (such as US [2], UK [3], Germany [4], etc.). This is
because experience shows that the likelihood of a rollover increases significantly when the slope is steeper
than the 1V:3H level.
Figure 4.2 – Critical side slope by an interchange ramp](https://image.slidesharecdn.com/documento50-1-120-5152borrador-240214213429-246eea16/85/Documento-50-1-120-51-52-borrador-pdf-47-320.jpg)
![ROADSIDE DESIGN GUIDE
PAGE 48
04 IDENTIFICATION OF HAZARDS FIRST EDITION -DECEMBER 2016
Foreslopes which have a gradient between 1V:3H and 1V:4H are generally considered as non- recoverable
by many countries around the world (such as US [2], UK [3], Australia [5], etc.). A vehicle entering a non-
recoverable slope is generally not expected to overturn, but it is expected to continue to the bottom of the slope
as it cannot generally regain control and return to the road. As long as they are free of obstacles and have a
traversable smooth surface, these slopes are not usually considered as hazards. However, the sandy roadside
environment of Abu Dhabi introduces an additional level of risk, as local experience indicates that vehicles are
more likely to overturn on areas of loose sand; even on side slopes flatter than 1V:3H. Unfortunately the
available research on the effect of loose sand on rollover incidents is not sufficient to provide a quantifiable
relationship. For this reason, engineering judgment should be used when evaluating fill sections with side
slopes from 1V:3H to 1V:4H and the height of the embankment and the compactness of the soil should also
be part of the evaluation process.
If the side slope has a loose sandy surface, which may cause vehicle snagging, the designer/engineer may
consider foreslopes up to 1V:4H as non-traversable and therefore a hazardous slope. Conversely, if the
foreslope has a firm compacted surface, or if it is treated with a concrete surface, as shown in Figure 4.3, it
may not be considered as a hazard for gradients between 1V:3H and 1V:4H, subject to engineering judgment.
Figure 4.3 – Concrete covered foreslope
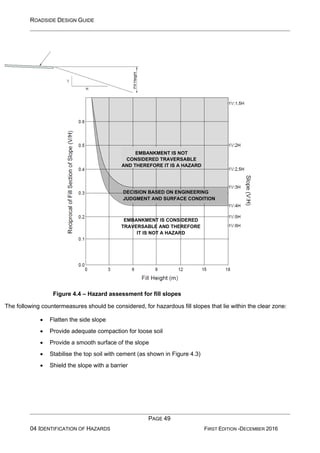
Fill slopes which are 1V:4H or flatter are considered as traversable and therefore generally not considered a
hazard. However 1V:6H is the recommended gradient for fill sections in new roadsby the Abu Dhabi Road
Geometric Design Manual [6]. Therefore, ideally, the designer/engineer should aim for foreslopes of 1V:6H
or flatter. In addition to increased roadside safety, such flat foreslopes are also ideal for maintenance
operations and erosion control.
Figure 4.4 summarizes the recommended approach on evaluating if a fill slope should be considered as a
hazard or not. This is based on the AASHTO Roadside Design Guide [2] approach and modified for the
requirements of the Abu Dhabi road network.
A fill section should ideally have a smooth surface, be free of rocks and any other obstacles. Fill sections with
non-smooth surfaces may be considered as hazards, subject to engineering judgment.](https://image.slidesharecdn.com/documento50-1-120-5152borrador-240214213429-246eea16/85/Documento-50-1-120-51-52-borrador-pdf-48-320.jpg)
![ROADSIDE DESIGN GUIDE
PAGE 50
04 IDENTIFICATION OF HAZARDS FIRST EDITION -DECEMBER 2016
4.3.1.2 Backslopes / Rock Cuts
A backslope in a cut section may be traversable and therefore not a hazard depending on its relative
smoothness and the presence of fixed obstacles. It may not be a significant obstacle if the front slope between
the roadway and the base of the backslope is traversable (1V:6H or flatter) and the backslope is obstacle-free.
However, a steep, rough-sided rock cut, as shown in Figure 4.5, is normally considered as a hazard and should
begin outside the clear zone or be shielded. A rock cut is considered to be rough-sided when the face is likely
to cause excessive vehicle snagging, rather than provide relatively smooth redirection.
Figure 4.5 – A hazardous rock cut, shielded by barrier
A common hazard associated with rock cuts is the rocks and boulders which may fall onto the road. These
rocks and boulders pose a significant danger to vehicles. To counter this problem, roadside ditches that are
wide enough to capture the falling rock, as shown in Figure 4.6, are one solution provided alongside rock cuts.
Other solutions which may be used include providing nets and stabilising surface with spray concrete.
The bottom flat section of the ditches for capturing falling rocks should also be considered as hazards and
therefore should not be located within the clear zone. If the ditch and the cut face have to be within the clear
zone, they should be shielded by an appropriate roadside barrier.
Figure 4.6 – Typical rock cut section [6]](https://image.slidesharecdn.com/documento50-1-120-5152borrador-240214213429-246eea16/85/Documento-50-1-120-51-52-borrador-pdf-50-320.jpg)
![ROADSIDE DESIGN GUIDE
PAGE 51
04 IDENTIFICATION OF HAZARDS FIRST EDITION -DECEMBER 2016
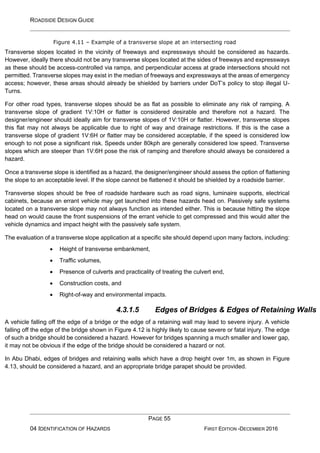
4.3.1.3 Roadside Ditches
On facilities without curbs, roadside ditches may be provided adjacent to embankment locations and in cut
sections to control drainage, as shown in Figure 4.7. A smooth and relatively flat ditch, with rounded corners
can be safely traversable and not considered a hazard. These traversable ditches should be considered as
variable slopes, for clear zone calculation purposes (see Section 3.4.5.1). Conversely a ditch with steeper
slopes and non-smooth toe transitions may not be safely traversable and could therefore pose the risk of
overturning or even launching an errant vehicle into the air. These non-traversable ditches should be
considered a hazard, and ideally should not be located within the clear zone.
Figure 4.7 – Typical roadway ditch section [6]
Figure 4.8 and Figure 4.9 give guidance on the assessment of basic ditch configurations, from a hazard
perspective, based on the profile, foreslope and back slope. In the figures, light grey areas represent
traversable geometry combinations as recommended by the AASHTO Roadside Design Guide [2]. Ditches
with these properties are not considered hazards. White areas are considered as non-traversable and a hazard
and therefore should be redesigned to be located within the traversable area.](https://image.slidesharecdn.com/documento50-1-120-5152borrador-240214213429-246eea16/85/Documento-50-1-120-51-52-borrador-pdf-51-320.jpg)
![ROADSIDE DESIGN GUIDE
PAGE 52
04 IDENTIFICATION OF HAZARDS FIRST EDITION -DECEMBER 2016
Ditch sections which are considered a hazard should be redesigned to a traversable cross section to eliminate
the risk, if practical,. However, if a redesign is not practical, a roadside barrier may be warranted.
Note: This chart is applicable to flat bottom ditches with bottom widths equal to or greater than 1.2 m.
Figure 4.8 – Assessment of cross sections for flat bottomed ditches [2]
HAZARDOUS AND
NON-TRAVERSABLE
DITCH
(NON-PREFERABLE
CROSS SECTION)
NON-HAZARDOUS AND
TRAVERSABLE DITCH
(PREFERABLE
CROSS SECTION)](https://image.slidesharecdn.com/documento50-1-120-5152borrador-240214213429-246eea16/85/Documento-50-1-120-51-52-borrador-pdf-52-320.jpg)
![ROADSIDE DESIGN GUIDE
PAGE 53
04 IDENTIFICATION OF HAZARDS FIRST EDITION -DECEMBER 2016
Note: This chart is applicable to all V-ditches and flat-bottom ditches with bottom
widths less than 1.2 m.
Figure 4.9 – Assessment of cross sections for V-profile ditches [2]
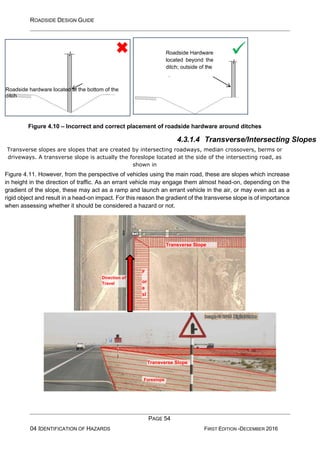
In addition to the geometry, the ditch should be smooth, well graded and should have well compacted firm
ground. Roadside hardware such as road signs, luminaire supports, electrical cabinets, etc. should not be
located in or near ditch bottoms, as shown in Figure 4.10, even if they are designed to be passively safe. This
is because an errant vehicle reaching the ditch is likely to be funnelled into the bottom of the ditch. Therefore,
any hazardous object located at or near the ditch bottom would be more likely to get hit. Furthermore, due to
the geometry of the ditch, an errant vehicle may hit the roadside hardware while sliding sideways or even go
airborne. In such an impact the passively safe system may not function as intended. For these reasons
roadside hardware should be moved beyond the ditch and outside of clear zone.
HAZARDOUS AND
NON-TRAVERSABLE
DITCH
(NON-PREFERABLE
CROSS SECTION)
NON-HAZARDOUS AND
TRAVERSABLE DITCH
(PREFERABLE
CROSS SECTION)](https://image.slidesharecdn.com/documento50-1-120-5152borrador-240214213429-246eea16/85/Documento-50-1-120-51-52-borrador-pdf-53-320.jpg)
![ROADSIDE DESIGN GUIDE
PAGE 58
04 IDENTIFICATION OF HAZARDS FIRST EDITION -DECEMBER 2016
Overhead gantries and cantilever sign supports should always be considered hazards. These structures, due
to their size and weight, are not designed to yield or breakaway during impact and pose a risk to the occupants
of errant vehicles. They also pose a risk of collapse on other road users during an impact by a vehicle. For
these reasons, the option of using a passively safe system is generally not available. Also, it is usually not
possible to relocate them too far off the road, as they should be clearly visible to road users.
Due to these limitations, roadside barriers are often the only treatment option available to reduce the risk posed
by these systems when they are located within the clear zone.
4.3.2.3 Roadside Sign Supports
Roadside sign supports may be considered crashworthy or a hazard, depending on their structure. Any support
structure which would not yield and cause the impacting vehicle to stop abruptly should be considered a
hazard.
Unlike gantries and cantilevers, large and small roadside sign supports can be designed to yield, break away
or absorb the energy during an impact. Signs with an area greater than 5m2
may be defined “large” and those
with an area smaller or equal to 5m2
may be defined “small” [2], as shown in Figure 4.16. These passively safe
sign supports are not considered hazards if their impact performances are proven in accordance with an impact
test standard acceptable by Abu Dhabi DoT, i.e. NCHRP350, MASH or EN12767. See Chapter 5 for more
information on the passively safe support structures and their testing.
Figure 4.16 – Small (left) and large (right) roadside sign supports
In addition to the impact worthy systems mentioned above, supports which are below certain physical
properties may also be accepted as passively safe and therefore not a hazard. These include:
• Steel posts that do not exceed the equivalent section properties of a tubular steel post
having an external diameter of 89 mm or less and a wall thickness of 3.2 mm or less [7]
• Wood posts with dimensions of 100 mm x 100 mm or less [2]
Once a hazardous sign support is identified within the clear zone, the designer/engineer should first consider
removing or relocating the sign, as this would eliminate the risk of impact. Removal or relocation is not always
practical as signs should remain near the travelled way to serve their](https://image.slidesharecdn.com/documento50-1-120-5152borrador-240214213429-246eea16/85/Documento-50-1-120-51-52-borrador-pdf-58-320.jpg)
![ROADSIDE DESIGN GUIDE
PAGE 59
04 IDENTIFICATION OF HAZARDS FIRST EDITION -DECEMBER 2016
intended purpose, therefore passively safe systems or shielding with a vehicle restraint system should be
considered.
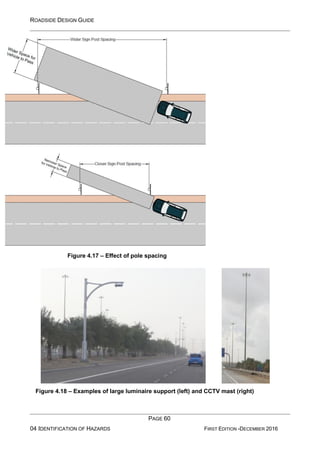
Another important factor to consider is the spacing of consecutive sign posts. Ideally, individual sign posts
should be as far away from each other as possible. This is firstly because consecutive signs in a small
area would catch the attention of drivers for a longer time and may cause confusion, which in turn may
lead to accidents. The second reason is that the probability of an errant vehicle hitting a pole increases as
the pole spacing decreases, as shown in Figure 4.17 – Effect of pole spacing
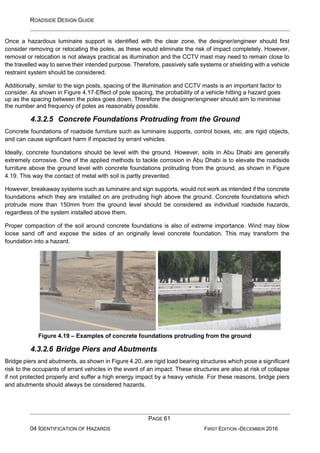
4.3.2.4 CCTV Masts and Luminaire Supports
Similar to sign supports, luminaire supports and CCTV masts are also considered as hazards if not designed
to be passively safe. Currently, luminaire supports which are up to a height of 18,5m & a mass of 450kg may
be designed to be passively safe [2]. However, passively safe designs are not generally possible for high-level
lighting supports and CCTV masts, which are fixed-base support systems. For more information on the
assessment of passive safety of luminaire supports please refer to Chapter 5.](https://image.slidesharecdn.com/documento50-1-120-5152borrador-240214213429-246eea16/85/Documento-50-1-120-51-52-borrador-pdf-59-320.jpg)
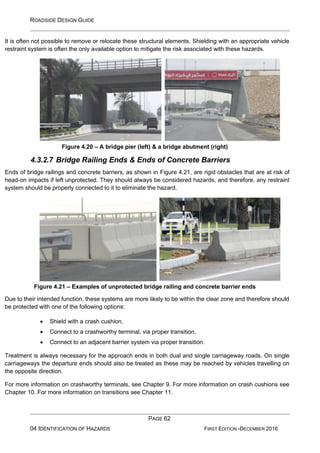
![ROADSIDE DESIGN GUIDE
PAGE 63
04 IDENTIFICATION OF HAZARDS FIRST EDITION -DECEMBER 2016
4.3.2.8Other Roadside Furniture, including Control Cabinets,
Electricity Cabinets, Speed Cameras, etc.
In addition to the specific examples given in the previous sections, there may be other items of roadside
furniture located within the clear zone, such as control cabinets, electricity cabinets, and speed cameras, as
shown in Figure 4.22.
In general, these objects should be considered hazards if they are expected to cause vehicle snagging and
an abrupt stop to an impacting errant vehicle. Conversely, if they are not expected to cause vehicle snagging,
they may not be considered hazards. One way of achieving this is the use of passively safe systems. For more
information on passive safety, refer to Chapter 5.
Figure 4.22 – Examples of roadside furniture as hazards
As shown in Figure 4.22, these objects come in different shapes and sizes, from a single electrical box to
multiple poles. When evaluating poles, guidance provided in Sections 4.3.2.3 and 4.3.2.4 should be followed.
When evaluating foundations protruding from the ground, guidance provided in Section 4.3.2.5 should be
followed.
For electrical boxes and control cabinets, it is possible to use passively safe systems. These systems are
designed to break away to minimize the forces exerted on the impacting vehicle, as shown in Figure 4.23.
They are also designed with electrical connections which disconnect during an impact to eliminate the risk of
electrocution. More information on these systems is given in Chapter 5.
Figure 4.23 – Test performance of a passively safe control cabinet [8]](https://image.slidesharecdn.com/documento50-1-120-5152borrador-240214213429-246eea16/85/Documento-50-1-120-51-52-borrador-pdf-63-320.jpg)
![ROADSIDE DESIGN GUIDE
PAGE 64
04 IDENTIFICATION OF HAZARDS FIRST EDITION -DECEMBER 2016
4.3.2.9 Drainage Pipes and Culverts
Drainage pipes and culvers are conduits which convey water flow through a roadway embankment or past
some other type of flow obstruction. Drainage pipes and culverts are constructed from a variety of materials
and shapes; from a single metal pipe to a multi-cell concrete box, as shown in Figure 4.24.
.
Figure 4.24 – Examples of a pipe (a) and a multi-cell box culvert (b) [9]
Pipes and culverts can be classified as either cross-drainage or parallel-drainage, according to their orientation
relative to the direction of travel, as shown in Figure 4.25.
Figure 4.25 – Cross and parallel drainage
Sections provide detailed guidance on the hazard assessment of cross and parallel drainage pipes and
culverts. In general, pipes and culverts located within the clear zone should be considered hazards if they are
not designed to be traversable. A pipe or culvert may be considered as non- traversable and therefore a
hazard, if:
• Its inlet and outlet is not matching the surface of the side slopes (see Figure 4.26);
• It has large gaps, into which a vehicle may fall and stop abruptly (see Figure 4.27);
• It has features such as headwalls or pipe ends protruding from the ground, which may
cause an errant vehicle to stop abruptly (see Figure 4.30); and if
• It is high enough (over 1m drop height see section 4.3.1.5) to be considered as a bridge
(see Figure 4.24).
Direction
of Travel](https://image.slidesharecdn.com/documento50-1-120-5152borrador-240214213429-246eea16/85/Documento-50-1-120-51-52-borrador-pdf-64-320.jpg)
![ROADSIDE DESIGN GUIDE
PAGE 65
04 IDENTIFICATION OF HAZARDS FIRST EDITION -DECEMBER 2016
Cross Drainage Structures:
Cross drainage structures are designed to carry water underneath the roadway embankment and are in
perpendicular orientation to the direction of travel. A cross drainage structure can be anything from a single
pipe to a multi-cell box as shown previously in Figure 4.24.
Research [10] shows that a small cross drainage pipe, with a diameter equal to or less than 900mm, is
traversable and therefore not a hazard, as long as long as the pipe inlets are matched with the slope of the
embankment.
A pipe inlet which is protruding from the ground, as shown in Figure 4.26a, is a hazard and should be levelled
with the slope surface, as shown in Figure 4.26 .
Figure 4.26 – Hazardous (left) [9] and traversable (right) pipe inlets [11]
Cross drainage structures with an opening wider than 900mm are considered as non-traversable and a hazard
[2]. Figure 4.27 shows an example of a hazardous cross-drainage culvert with a large opening. An errant
vehicle reaching such a culvert may overturn on impact or fall into the opening and come to an abrupt stop.
Figure 4.27 – Example of a hazardous cross-drainage culvert; with a large opening
Hazardous culverts with large openings can be made traversable by covering the opening with appropriate
pipe runners or a safety grate, as shown in Figure 4.28.
Diameter < 900mm
✓](https://image.slidesharecdn.com/documento50-1-120-5152borrador-240214213429-246eea16/85/Documento-50-1-120-51-52-borrador-pdf-65-320.jpg)
![ROADSIDE DESIGN GUIDE
PAGE 66
04 IDENTIFICATION OF HAZARDS FIRST EDITION -DECEMBER 2016
Figure 4.28 – Traversable safety grate (left) [9] and pipe runners (right) [11]
Bar spacing and pipe diameter are important parameters when designing traversable pipe runners or bar
grates. Figure 4.29 shows the recommended design criteria for safety grates and pipe runners, by AASHTO
Roadside Design Guide [2].
Figure 4.29 – Design criteria for safety treatment of pipes and culverts [2]
Bar grates and pipe runners designed to the above criteria were crash tested at the Midwest Roadside Safety
Facility in United States [12]. These tests showed that vehicles can traverse cross-drainage structures with
grated-culvert end sections constructed of steel pipes spaced on 760 mm centres on slopes as steep as 1V:3H
and at speeds ranging from 30 km/h to 100 km/h. The results clearly demonstrated that the culvert safety
grates and pipe runners recommended in Figure 4.29 are traversable and meet the safety performance
guidelines set forth in NCHRP-350.
Modifications to the culvert ends to make them traversable should not significantly decrease the hydraulic
capacity of the culvert. Safety treatments should be hydraulically efficient. The 750mm bar spacing
recommended in this manual is not expected to significantly change the flow capacity of the culvert pipe unless
debris accumulates and causes partial clogging of the inlet. The designer should consider shielding the
structure with a barrier if significant hydraulic capacity or clogging
Span Length
Maximum 750mm
Up to 3.65 m.............................................................75 mm
3.65 - 4.90 m ............................................................87 mm
4.90 – 6.10 m........................................................... 100 mm
Pipe Runner Diameter](https://image.slidesharecdn.com/documento50-1-120-5152borrador-240214213429-246eea16/85/Documento-50-1-120-51-52-borrador-pdf-66-320.jpg)
![ROADSIDE DESIGN GUIDE
PAGE 67
04 IDENTIFICATION OF HAZARDS FIRST EDITION -DECEMBER 2016
problems could result. Where flood debris is not a concern for median drainage, much smaller openings
between bars may be acceptable and grates similar to those commonly used for drop inlets may be
appropriate.
Another potential hazard related to culverts is headwalls protruding from the ground, as shown in Figure 4.30.
Ideally, culverts should be level with the surface and no structural element, which may cause an impacting
vehicle to stop abruptly, should protrude from the ground. Such headwalls should be considered as hazards.
Figure 4.30 – Examples of hazardous culvert headwalls protruding from the ground [13]
Non-traversable cross drainage culverts located within the clear zone, as shown in Figure 4.31 are hazards.
Figure 4.31 – A cross-drainage culvert within the clear zone area
Once a hazardous cross drainage culvert is identified within the clear zone, the following treatment options
should be considered:
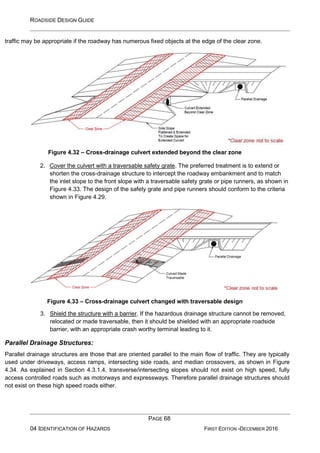
1. Remove the structure or extend it beyond clear zone. For inlets of pipes and culverts that
cannot be readily made traversable, designers may consider extending the structure so the
obstacle is located beyond the clear zone, as shown in Figure 4.32. However, this practice
does not completely eliminate the possibility of the pipe being hit. If the extended culvert
headwall is the only significant fixed object at the edge of the clear zone and the roadside is
generally traversable to the right-of-way line elsewhere, simply extending the culvert to
beyond the clear zone may not be the best alternative, particularly on freeways and
expressways. However, extending individual structures to the same minimum distance from](https://image.slidesharecdn.com/documento50-1-120-5152borrador-240214213429-246eea16/85/Documento-50-1-120-51-52-borrador-pdf-67-320.jpg)
![ROADSIDE DESIGN GUIDE
PAGE 69
04 IDENTIFICATION OF HAZARDS FIRST EDITION -DECEMBER 2016
Figure 4.34 – Example of a non-traversable parallel drainage structure [13]
As an errant vehicle is likely to impact the structure at approximately 90, parallel drainage structures represent
a potential hazard. Ideally, any parallel drainage structures will be located outside of the clear zone; however,
this will often not be practical because of the typical locations for these structures. In addition, the designer
must coordinate their design with that of the surrounding transverse slope (See section 4.3.1.4) to minimize
the hazard.
Research shows that parallel drainage pipes with a diameter equal to or less than 600mm are traversable [10]
and therefore not a hazard, as long as long as the pipe inlets are matched with the slope of the embankment
and the gradient of the transverse slope is 1V:6H or flatter, as recommended in Section 4.3.1.4.
Pipes with a diameter over 600mm are considered non-traversable and a hazard. However, just like cross
drainage structures, it is possible to make parallel drainage structures traversable via safety grates or pipe
runners, as shown in Figure 4.35.
Figure 4.35 – Traversable safety grate (left) [13] and pipes (right) [14]
Bar spacing and pipe diameter are important parameters when designing traversable safety grates. Research
has shown that for parallel drainage structures, a grate consisting of pipes set on 610mm centres will
significantly reduce wheel snagging [2]. Figure 4.36 shows a possible design for parallel safety grates,
recommended by AASHTO Roadside Design Guide [1].](https://image.slidesharecdn.com/documento50-1-120-5152borrador-240214213429-246eea16/85/Documento-50-1-120-51-52-borrador-pdf-69-320.jpg)
![ROADSIDE DESIGN GUIDE
PAGE 70
04 IDENTIFICATION OF HAZARDS FIRST EDITION -DECEMBER 2016
Figure 4.36 – Design criteria for safety treatment of parallel drainage structures [2]
Once a hazardous parallel drainage structure is located within the clear zone, the designer/engineer should
consider the following treatment options:
4. Remove the structures. The first treatment option to be considered is the removal of the
parallel drainage structure. Although this option completely eliminates the risk posed by this
hazard, it may not always be applicable due to drainage requirements. In low-volume
locations, such as local or collector roads, it may be possible to eliminate the parallel pipes
by constructing an overflow section on the intersecting side road.
5. Relocate the structure. The second treatment option to consider is the relocation of the
drainage feature to outside the clear zone, where it would be less likely to be reached by an
errant vehicle. Figure 21 presents a suggested design treatment.
Figure 4.37 – Alternate location for a parallel drainage culvert [2]
6. Cover the structure with a traversable safety grate. The third option is to make the drainage
feature traversable by matching its inlet to the slope surface and covering with a safety
grate or pipe runners as shown in Figure 4.36.](https://image.slidesharecdn.com/documento50-1-120-5152borrador-240214213429-246eea16/85/Documento-50-1-120-51-52-borrador-pdf-70-320.jpg)
![ROADSIDE DESIGN GUIDE
PAGE 71
04 IDENTIFICATION OF HAZARDS FIRST EDITION -DECEMBER 2016
7. Shield the structure with a barrier. If the hazardous drainage structure cannot be removed,
relocated or made traversable, then it should be shielded with an appropriate roadside
barrier, with an appropriate crash worthy terminal leading to it.
The following summarizes the preferred practices on the roadside safety treatment of parallel drainage
structures within the clear zone:
• Pipe diameter 450 mm. For these pipe sizes, a projecting end is acceptable.
• Pipe diameter > 450 mm to 600 mm. For these pipe sizes, the end of the pipe should match
the slope of the surrounding transverse slope. The opening to the pipe may remain.
• Pipe diameter > 600 mm. For these pipe sizes, the end of the pipe should match the
surrounding transverse slope, and the designer should provide grates across the opening.
This will reduce wheel snagging if an errant vehicle impacts the pipe end.
4.3.3 Non-deformable Continuous Objects
4.3.3.1 Fencing and Walls
Fencing and walls may be required along roads to protect drivers from unexpected intrusions from outside of
the right-of-way line. Fencing deters unauthorised and unsafe entry to the roadway by vehicles, pedestrians,
or animals.
Figure 4.38 – Pedestrian fencing along an urban road
Fence types used in Abu Dhabi include: woven wire, chain link, camel fence and pedestrian fences [6].
Fences and walls which are not designed to be passively safe should be considered hazards if they are located
within the clear zone. Unfortunately, currently there is no testing standard available specifically for the test of
such systems. For this reason engineering judgment should be used to assess the passive safety of such
systems. For more information on fencing, see Chapter
16.5 of Abu Dhabi Road Geometric Design Manual [6].](https://image.slidesharecdn.com/documento50-1-120-5152borrador-240214213429-246eea16/85/Documento-50-1-120-51-52-borrador-pdf-71-320.jpg)
![ROADSIDE DESIGN GUIDE
PAGE 72
04 IDENTIFICATION OF HAZARDS FIRST EDITION -DECEMBER 2016
4.3.3.2 Retaining Walls
Retaining walls may be considered hazards, depending on the smoothness of the surface and whether the
surface of the wall is sturdy enough to resist the shock of the initial impact with a vehicle.
Generally, the following types of retaining walls should be considered a hazard:
• Retaining walls which are covered by decorative panels for aesthetic purposes, such as the
one shown in Figure 4.39. If these walls are not designed to resist structural loading such as
that from an errant vehicle, there is a risk of an impacting vehicle snagging and stopping
abruptly, instead of sliding along the surface.
• Retaining walls with structural elements protruding from the surface, which may cause
vehicle snagging, such as the one shown in Figure 4.40.
• Retaining walls with a non-smooth surface, such as the types made of stacked prefabricated
elements, with large protruding parts.
Conversely, a retaining wall may not be considered a hazard if it has a smooth surface which would not cause
vehicle snagging and let the impacting vehicle slide along the surface. An example of this may be a reinforced
concrete retaining wall.
Figure 4.39 – Potentially hazardous retaining wall; covered with decorative panels [6]
Figure 4.40 – A retaining wall; with structural elements protruding from the surface](https://image.slidesharecdn.com/documento50-1-120-5152borrador-240214213429-246eea16/85/Documento-50-1-120-51-52-borrador-pdf-72-320.jpg)
![ROADSIDE DESIGN GUIDE
PAGE 76
04 IDENTIFICATION OF HAZARDS FIRST EDITION -DECEMBER 2016
• If previous options are not applicable, shield the pedestrian area with barrier.
On low-speed streets the practice is generally to separate pedestrians from traffic by a sidewalk separated
from the roadway by a raised curb. However, at speeds over 40km/h a vehicle may mount the curb for relatively
flat approach angles. Furthermore, it is generally impractical to separate pedestrians from the roadway with a
longitudinal roadside barrier. Thus, for streets with speeds over 40km/h, separating the sidewalk from the edge
of the roadway with a buffer space is encouraged [2].
When evaluating pedestrian activity, the designer/engineer should also consider the daily, weekly, and
seasonal fluctuations in the number of people using the area. If heavy pedestrian presence is expected only
for a short period of time for a specific event, such as a football match, concert etc., temporary barriers may
be considered instead of permanent installations.
Road user behaviour, including unauthorised pedestrian presence, as shown in Figure 4.43, should also be
considered. This type of risk should be eliminated through enforcement and by access control. For more
information on fencing, refer to Chapter 16.5 of the Abu Dhabi Geometric Design Manual.
Figure 4.43 – Example of unauthorised pedestrian presence at the side of a freeway
4.4.4 Cycle Lanes
Cycle lanes, similar to pedestrian facilities, may be considered as high risk hazards depending on factors such
as:
Frequency of Bicycle Traffic: Frequency is an important factor, because the probability of an errant vehicle
hitting a cyclist increases as the frequency of the cyclists on the cycle lane goes up. Conversely for infrequently
used cycle lanes or those designed with a roadside buffer, such as the one shown in Figure 4.44, even if a
vehicle runs off the road, the probability of it hitting a cyclist would be lower.
• Type of cyclists on the area: The area may be considered a higher risk in the presence of
specific type of cyclists, such as school children
• Geometry and characteristics of the road: Certain road geometries, such as a sharp
horizontal curve located at the end of a long straight, may increase the likelihood of a run-
off-the road incident. If the cycle lane is located near such an area the risk would be higher.](https://image.slidesharecdn.com/documento50-1-120-5152borrador-240214213429-246eea16/85/Documento-50-1-120-51-52-borrador-pdf-76-320.jpg)
![ROADSIDE DESIGN GUIDE
PAGE 78
04 IDENTIFICATION OF HAZARDS FIRST EDITION -DECEMBER 2016
4.4.6 Rail Lines
Although rare, if an errant vehicle collides with a train, the consequences are often catastrophic. The “Selby
Rail Crash” was a high-speed train accident, which occurred in England in 2001. This incident, where a high
speed train hit an errant vehicle from a nearby road bridge, caused 10 fatalities and 82 severe injuries [15].
Railway lines, including high speed rail, tram, light rail and others, should always be considered a high risk
hazard.
4.5 Summary and Conclusions
A hazard is a roadside feature or object that can cause physical, economic, time-based or strategic harm or
loss, if reached by an errant vehicle. Hazards that lie within the recommended clear zone area are under the
risk of being reached by errant vehicles, which may lead to injury or even fatal accidents.
This chapter presented an overview of the types and properties of roadside features that may be considered
hazards.
As a generalization, majority of the roadside hazards can be classified into one of the following categories:
A. Hazards with Consequences to Vehicle Occupants
a. Roadside Topography
i. Foreslopes
ii. Backslopes
iii. Ditches
iv. Transverse Slopes
v. Edges of Bridges and Retaining Walls
b. Non-deformable Single Obstacles
i. Trees
ii. Overhead Gantries and Cantilevers
iii. Roadside Sign Supports
iv. Luminaire Supports & CCTV Masts
v. Concrete Foundations Protruding from the Ground
vi. Bridge Piers, Abutments & Tunnel Portals
vii. Above Ground Equipment
viii. Drainage Pipes & Culverts
c. Non-deformable Continuous Obstacles
i. Retaining Walls
ii. Noise Barriers
iii. Fencing
iv. Permanent Bodies or Streams of Water
B. Hazards with Consequences to 3rd
Parties.
a. Adjacent Roads
b. Hazardous Material Storage
c. Places of Public Gathering & Pedestrian Activity
d. Heavily Used Bicycle Paths
e. Structures at Risk of Collapse](https://image.slidesharecdn.com/documento50-1-120-5152borrador-240214213429-246eea16/85/Documento-50-1-120-51-52-borrador-pdf-78-320.jpg)
![ROADSIDE DESIGN GUIDE
PAGE 79
04 IDENTIFICATION OF HAZARDS FIRST EDITION -DECEMBER 2016
f. Rail Lines
g. Areas of Environmental Concern
Information presented in this chapter does not cover every single possible roadside hazard and therefore
should be taken as a general guidance, rather than a definitive check-list. Engineering judgment should be
used to assess possible hazards on a case by case basis, prior to a final decision.
4.6 References
[1] CEDR, “SAVERS (Selection of Appropriate Vehicle Restraint Systems) - WP1: Defining the
Different Parameters which can Influence the Need and Selection of VRS (Unpublished
Report),” Conference of European Directors of Roads, 2014.
[2] AASHTO, Roadside Design Guide, 4th Edition, Washington D.C.: American Association of
State Highway and Transportation Officials, 2011.
[3] TD19/06 Design Manual for Roads and Bridges, Volume2 Highway Structures: Design,
Section 2 Special Structures, Part 8, The Highways Agency, Transport Scotland, Welsh
Assembly Government, The Department for Regional Development Norther Ireland, 2006.
[4] FGSV, Traffic Management Work Group, “Guidlines for passive protection on roads by vehicle
restraint systems,” FGSV Verlag GmbH, Koln, 2009.
[5] Austroads, Guide to Road Design Part 6: Roadside Design, Safety and Barriers, Sydney,
NSW: Austroads, 2010.
[6] Abu Dhabi Department of Transport, Road Geometric Design Manual, Abu Dhabi: Abu Dhabi
Department of Transport, 2014.
[7] CEN, Eurpean Standard EN12767: Passive Safety of Support Structures for Road Equipment
- Requirements, Classification and Test methods, CEN, Eurpopean Committee for Standardization, 2007.
[8] Ritherdon & Company Ltd, “Ritherdon Passively Safe Cabinet,” [Online]. Available:
http://www.ritherdon.co.uk/products/passive-safety/passively-safe-cabinet-product.html.
[Accessed 16 07 2015].
[9] J. Schall, P. Thompson, S. Zerges, R. Kilgore and J. Morris, Hydraulic Design of Highway
Culverts, Third Edition, Washington, D.C.: U.S. Department of Transportation, Federal
Highway Administration, 2012.
[10] H. Ross, T. H. D.L. Sicking, H. Cooner, J. Nixon, S. Fox and C. Damon, “Safety Treatment of
Roadside Drainage Structures,” Transportation Research Record, no. 2060-08, 1982.
[11] Texas DoT, Hydraulic Design Manual, Texas Department of Transportation, 2014.
[12] D. Sicking, R. Bielenberg, J. Rohde, J. Reid, R. Faller and K. Polivka, “Safety Grates for](https://image.slidesharecdn.com/documento50-1-120-5152borrador-240214213429-246eea16/85/Documento-50-1-120-51-52-borrador-pdf-79-320.jpg)
![ROADSIDE DESIGN GUIDE
PAGE 80
04 IDENTIFICATION OF HAZARDS FIRST EDITION -DECEMBER 2016
Cross-Drainage Culverts,” Transportation Research Record, no. 2060, pp. 67-73, 2008.
[13] H. McGee, D. Nabors and T. Baughman, Maintenance of Drainage Features for Safety,
Washington D.C.: U.S. Department of Transportation, Federal Highway Administration, 2009.
[14] Cherokee Culvert, “www.cherokeeculvert.com,” 17 05 2016. [Online]. Available:
http://cherokeeculvert.com/end-treatments/.
[15] BBC, “BBC News,” 6 January 2003. [Online]. Available:
http://news.bbc.co.uk/1/hi/in_depth/uk/2001/selby_train_crash/default.stm. [Accessed 1 May
2015].](https://image.slidesharecdn.com/documento50-1-120-5152borrador-240214213429-246eea16/85/Documento-50-1-120-51-52-borrador-pdf-80-320.jpg)
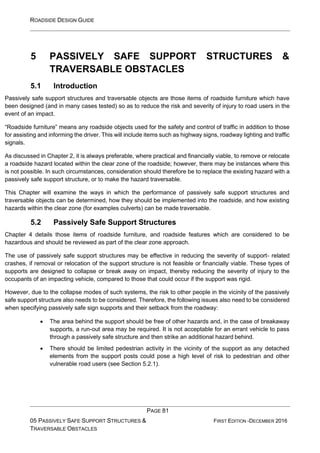
![ROADSIDE DESIGN GUIDE
PAGE 82
05 PASSIVELY SAFE SUPPORT STRUCTURES &
TRAVERSABLE OBSTACLES
FIRST EDITION -DECEMBER 2016
• The speed limit of the road, and which systems have been successfully tested to those speed
requirements;
• Whether the road is kerbed or un-kerbed, as any impact prior to that with a passively safe
support structure may influence the dynamic performance of the support structure;
• The location of the support structure (mid-block or at an intersection) as this will identify the
direction(s) in which the passively safe support structure may be struck. Some structures are
impact direction sensitive, and therefore the possible impact scenarios should be understood
and considered when selecting a passively safe support structure;
• Whether the support structure is to be located behind a road safety barrier as this will assist
in determining the level of safety which needs to be provided by the support structure;
• Maintenance, repair and replacement requirements and associated costs [1].
The damaged support and any elements that detach under impact should not pose a risk to other road users,
and any level of risk should be quantified before the use of a passively safe support structure is included within
any roadside design. This may involve locating them at the property line (urban and rural) or in an easement
(rural). In general, impact absorbing poles should be favoured over slip-base ones in areas of low traffic speed,
parking and in areas with large amounts of pedestrian activity. This is because the impact absorbing poles do
not become detached from their base during an impact, whereas the slip-base ones do. Therefore, the slip-
base systems have a higher risk of moving further than their base and collapsing on top of pedestrians or other
vulnerable road users.
Location of sign structures is important for road user safety. Factors such as road geometric alignment, sight
lines and decision distances should be considered to make sure the road users are provided with enough time
to read, understand and safely execute any manoeuvre required.
5.2.1 Types of Passively Safe Support Structures
There are a number of support structures often present in the roadside which can be made passively safe,
including:
• Supports for small and large roadside signs
• Gantries and cantilever sign supports (albeit in a small number of situations)
• Lighting columns
• Supports for traffic signals and surveillance cameras
• Emergency telephones
There are two main designs of passively safe support structures:
a) Slip-base and non-energy absorbing supports such as that shown in Figure 5.1 and Figure
5.2 are designed to breakaway at their base upon impact, allowing the vehicle to pass beneath the support to
minimise damage to the impacting vehicle and reduce the risk of injury to the vehicle occupant(s). This may
be achieved by a slip plane, plastic hinge, fracture element, or a combination of these features. These can be
uni-directional, bi- directional, or omni-directional, and details on these three subtypes can be found within
Section 5.2.2.3.](https://image.slidesharecdn.com/documento50-1-120-5152borrador-240214213429-246eea16/85/Documento-50-1-120-51-52-borrador-pdf-82-320.jpg)
![ROADSIDE DESIGN GUIDE
PAGE 83
05 PASSIVELY SAFE SUPPORT STRUCTURES &
TRAVERSABLE OBSTACLES
FIRST EDITION -DECEMBER 2016
b) Energy absorbing supports collapse on impact by an errant vehicle and are designed to
decelerate an impacting vehicle in a controlled way. In some cases this means that the
vehicle will stop at the base of the support. These deformable supports are designed to
remain in the ground after being struck as shown in Figure 5.3 and Figure 5.4.
Figure 5.1 – Example of a slip-base support
The two types of passively safe sign supports outlined in this section are typically integrated into, or promoted
as, proprietary systems. However, in addition to these designs of supports, there are a number of non-
proprietary sign supports which are deemed to be passively safe, and which are therefore also not considered
to represent a roadside hazard. These are:
• Steel posts that do not exceed the equivalent section properties of a tubular steel post having
an external diameter of 89 mm or less and a wall thickness of 3.2 mm or less [2], and
• Wood posts with dimensions of 100 mm x 100 mm or less [3].](https://image.slidesharecdn.com/documento50-1-120-5152borrador-240214213429-246eea16/85/Documento-50-1-120-51-52-borrador-pdf-83-320.jpg)
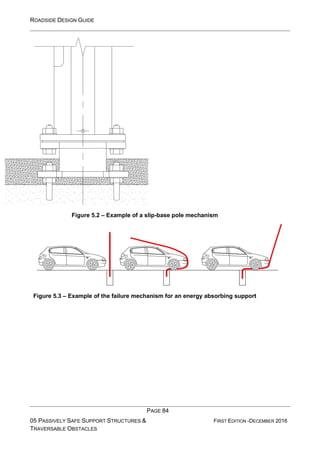
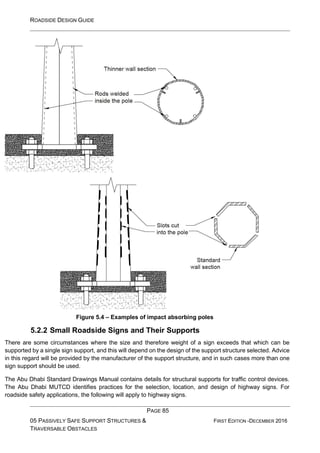
![ROADSIDE DESIGN GUIDE
PAGE 86
05 PASSIVELY SAFE SUPPORT STRUCTURES &
TRAVERSABLE OBSTACLES
FIRST EDITION -DECEMBER 2016
Small roadside signs are usually defined as those supported by one or more posts and which have a sign
panel not greater than 5 m2
in area [3]. The supports for small roadside signs are typically installed in one of
the following ways:
• Set in a precast cylindrical concrete base,
• Driven directly into the soil,
• Set in drilled holes, or
• Mounted on top of a separately installed base.
Unless successfully impact tested to the requirements of NCHRP 350 or MASH (see Section 5.2.8), sign
supports should not be braced as this can significantly affect the impact performance of an otherwise
acceptable design, especially in the case of yielding supports (see Figure 5.5). To avoid the need for bracing,
larger breakaway or multiple breakaway posts should be considered when it is necessary to increase the
strength of a support structure.
Figure 5.5 – Braced sign support [4]
The breakaway mechanisms for small sign supports consist of yielding, fracture or a slip-base design. The
most commonly used small sign support hardware and the characteristics of each are described in the
following sections. The mode of breakaway will be determined by the performance of the sign support during
the impact testing of the system.
Sign supports, gantries, cantilever sign supports, VMS and traffic light supports shall be designed according
to Abu Dhabi “Road Structures Design Manual” [4]. For issues not covered, the “AASHTO Standard
Specifications for Structural Supports for Lighting Signs, Luminaires and Traffic Signals” [5] shall be used.
5.2.2.1 Yielding supports for small signs
Yielding supports for small signs typically consist of:
• U-channel steel posts,
• Perforated square steel tubes,
• Thin-walled aluminium tubes, or
• Thin-walled fibreglass tubes.
Examples of these are presented in Figure 5.6.](https://image.slidesharecdn.com/documento50-1-120-5152borrador-240214213429-246eea16/85/Documento-50-1-120-51-52-borrador-pdf-86-320.jpg)
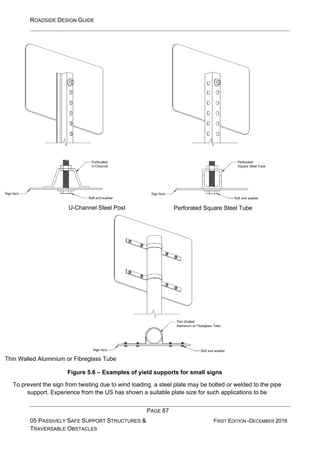
![ROADSIDE DESIGN GUIDE
PAGE 88
05 PASSIVELY SAFE SUPPORT STRUCTURES &
TRAVERSABLE OBSTACLES
FIRST EDITION -DECEMBER 2016
100 mm 300 mm 6 mm [3]. It is more difficult to predict the performance of yielding supports than other
support types as their dynamic behaviour can vary according to factors such as:
• The soil resistance,
• Variations in the depth of embedment,
• The size of the sign which is attached to the sign support,
• Stiffness of the sign support, and
• Mounting height of the sign.
5.2.2.2 Fracturing supports for small signs
Fracturing sign supports are those posts connected at ground level to a separate anchor. Anchors for steel
pipe and steel post systems are normally driven into the ground. Wood posts are typically set in drilled holes
and backfilled [3].
The breakaway feature for wood posts with dimensions greater than 100 mm x 100 mm can be achieved
through the process of drilling two 38 mm diameter holes near the ground level perpendicular to the flow of
traffic, and filled with expanding Styrofoam to prevent post deterioration [7]. It is recommended by the Federal
Highways Administration (FHWA) in the US that such holes are drilled 10.2cm (4”) and 45.7cm (18”) from the
ground, as shown in Figure5.7.
Figure 5.7 – Drilled holes in wooden posts](https://image.slidesharecdn.com/documento50-1-120-5152borrador-240214213429-246eea16/85/Documento-50-1-120-51-52-borrador-pdf-88-320.jpg)
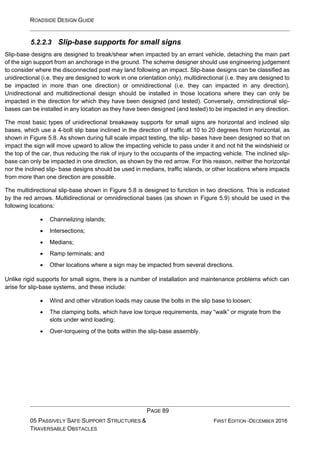
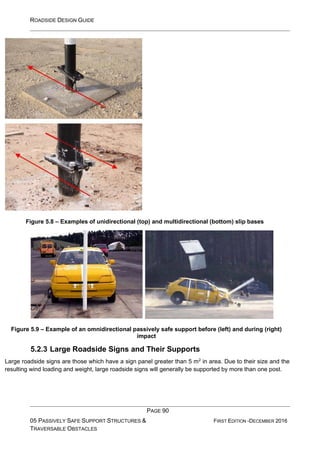
![ROADSIDE DESIGN GUIDE
PAGE 91
05 PASSIVELY SAFE SUPPORT STRUCTURES &
TRAVERSABLE OBSTACLES
FIRST EDITION -DECEMBER 2016
The breakaway mechanisms for the supports of large signs consist of fracture or a slip-base design. Typically,
the supports for large signs do not have a yielding mechanism. Further details of these failure mechanisms
can be found within Section 5.2.2.
5.2.3.1 Supports for large signs with an upper hinge design
A number of supports for large signs incorporate an upper hinge design – by this it is meant that there is a
designed saw cut through the web of the post to the rear flange and a slotted fuse plate on the expected impact
side. The rear flange then acts as a hinge when the post rotates upwards in the event of an impact, as
demonstrated in Figure 5.10. Slotted plates may be used on both sides of the post if impacts are expected
from either direction, thus making it multidirectional. An example of such a sign support is shown in Figure
5.11.
Figure 5.10 – Example of the failure mechanism for an upper hinge design
Due to the functional nature of supports with an upper hinge, there are a number of restrictions for their use:
• All signs should not be installed in such a way as to interfere with the functioning
mechanism of the post;
• Supplementary signs should not be installed below the hinges if the supplemental sign is
likely to strike the windshield of an impacting vehicle;
• The total mass of the support structure and any connected signs between the bottom of the
hinge and the top of the shear plate of the breakaway base should not exceed 270 kg [3];
• The hinge should be at least 2 m above the ground so that no portion of the sign or upper
section of the support is likely to penetrate the windshield of an impacting vehicle.](https://image.slidesharecdn.com/documento50-1-120-5152borrador-240214213429-246eea16/85/Documento-50-1-120-51-52-borrador-pdf-91-320.jpg)
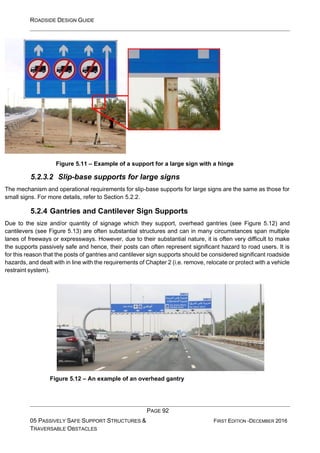
![ROADSIDE DESIGN GUIDE
PAGE 93
05 PASSIVELY SAFE SUPPORT STRUCTURES &
TRAVERSABLE OBSTACLES
FIRST EDITION -DECEMBER 2016
Figure 5.13 – An example of a cantilever sign
There are a number of passively safe gantries (see Figure 5.14) available on the market, and these have
the following advantages [8]:
• Lightweight construction;
• Passive safety – as shown by full scale impact testing conducted by TRL on behalf of
the UK Highways Agency in 2005 (shown in Figure 5.14);
• Strength;
• Quick installation;
• No maintenance (for aluminium systems);
• A fully engineered and developed design using proven components;
• Factory fabrication with good quality control of materials and components;
• Easy to recycle when the gantry is no longer needed.
Figure 5.14 – Example of a passively safe gantry [7]](https://image.slidesharecdn.com/documento50-1-120-5152borrador-240214213429-246eea16/85/Documento-50-1-120-51-52-borrador-pdf-93-320.jpg)
![ROADSIDE DESIGN GUIDE
PAGE 94
05 PASSIVELY SAFE SUPPORT STRUCTURES &
TRAVERSABLE OBSTACLES
FIRST EDITION -DECEMBER 2016
However, despite these advantages, in the event of an impact these may have serious consequences for other
road users. This may be the gantry falling down over or across the road and in some cases, following traffic
impacting the gantries and/or supported signs which would then lie in the carriageway. Hence, before
implementing a passively safe gantry across a carriageway, the risks associated with its installation, and any
subsequent impact must be ascertained and quantified. If in any doubt, a vehicle restraint system should be
provided in front of the legs of the gantry, even if it is a passively safe system. It should be noted that the
placement of overhead sign structures is important for driver safety. Consider sight lines, decision distance,
and road alignment to provide the motorists with sufficient time to read, interpret, and safely execute any
manoeuvres required [7].
Necessary vertical and horizontal clearances should be provided for gantries and cantilevers; i.e. 6.5m vertical
and 9.0m horizontal clearance. These requirements are presented in Abu Dhabi Manual for Uniformed Traffic
Control Devices (MUTCD).
5.2.5 Passively Safe Lighting Columns (Luminaires)
The Abu Dhabi Road Lighting Manual presents a detailed discussion on roadway lighting with respect to:
• The requirement to provide lighting and lighting columns;
• The requirements for locating the lighting columns; and
• The design of lighting columns to provide the required level of luminance and uniformity.
5.2.5.1 The Height and Mass of Passively Safe Lighting Columns
The height of the lighting column to be used in a particular location(s) will depend on the length of the arm at
the top of the lighting column and the intensity of the light given by the luminaire, however, as a general rule,
lighting columns typically used in Abu Dhabi are 10 m or 14 m in height. A typical installation of lighting columns
in the median of the E20 (Airport Freeway is shown in Figure 5.15.
Figure 5.15 – Example of 14m high lighting columns installed in the median
Following the risk assessment and mitigation approach within Chapter 2, if 10 m and 14 m lighting poles cannot
be removed or relocated outside of the clear zone, it may be possible to make them passively safe, and a
number of such products are available in the market. A level of passive](https://image.slidesharecdn.com/documento50-1-120-5152borrador-240214213429-246eea16/85/Documento-50-1-120-51-52-borrador-pdf-94-320.jpg)
![ROADSIDE DESIGN GUIDE
PAGE 95
05 PASSIVELY SAFE SUPPORT STRUCTURES &
TRAVERSABLE OBSTACLES
FIRST EDITION -DECEMBER 2016
safety can be achieved through either use of a slip-base, or by making the lighting column energy absorbing
in its overall design (for example by designing it to yield on impact). More details about these passively safe
failure modes can be found in Section 5.2.1.
The height of passively safe lighting columns should generally not exceed 12.5m on roadsides. However, on
central reservations, 15m and 18 m high poles can be used [8]. This is due to:
• The approximate maximum height of currently accepted hardware; and
• The height that can accommodate modern lighting design practices when foundations are
set at approximately the roadway grade.
On a limited number of roads, where adequate luminescence cannot be provided by using 18m high lighting
columns, high masts (which are 25 m high) are used. Due to their height, these lighting columns are very rigid
and therefore present a significant risk to road users. It is for this reason that these lighting columns should
always be protected by a safety barrier [3].
Following the clear roadside principals in Chapter 2, designers should also consider the use of high-mast
lighting columns as these can be used to both reduce the number of lighting columns within the roadside, as
well as enabling the columns to be placed further away from the travelled carriageway. High-mast lighting
columns are fixed-base systems which are not passively safe. Where used, such systems should be located
outside of the clear zone or shielded with an appropriately specified barrier and should be located away from
the natural impact side of the roadway (e.g. the inner side of a loop interchange). As with all roadside hazards,
high-mast lighting columns should be located sufficiently far behind the barrier in such a way that in the event
of an impact, the deflection of the barrier will not interfere with the lighting column. This distance will be
determined by the dynamic performance of the barrier during full-scale impact testing to NCHRP350 or MASH
(see Chapter 6).
The mass of a breakaway lighting column should not exceed 450 kg to reduce the potential for serious
consequences [3].
5.2.6 Passively Safe Traffic Signal and Surveillance Camera Supports
The Abu Dhabi Traffic Signals, Electronic Warning, and Information Systems Manual presents a detailed
discussion on the design of these elements.
Traffic signal supports and surveillance cameras are a special situation where the use of a passively safe
support structure may not be suitable for a number of reasons. The first is that the signals will typically be
installed in areas of high traffic volumes and, in some cases, high pedestrian volumes (refer to Figure 5.16
and Figure 5.17). As a result any detached elements are likely to pose an unacceptably high level of risk to
these parties. In addition, the confusion and level of risk posed by the absence of a traffic signal is also likely
to be high in the event of an impact.
For these reasons, the use of a passively safe support for a traffic signal or a surveillance camera is only likely
to be suitable in a limited number of applications, following the application of engineering judgement. In the
majority of cases, traffic signals and surveillance cameras should not be made passively safe, but should be
moved away from the edge of the carriageway as far as](https://image.slidesharecdn.com/documento50-1-120-5152borrador-240214213429-246eea16/85/Documento-50-1-120-51-52-borrador-pdf-95-320.jpg)
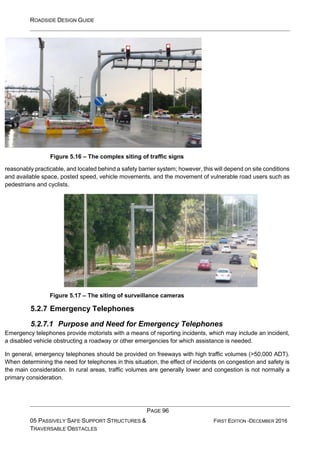
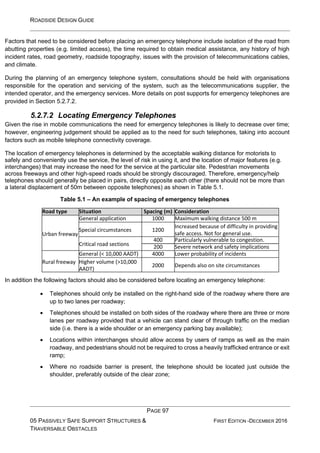
![ROADSIDE DESIGN GUIDE
PAGE 98
05 PASSIVELY SAFE SUPPORT STRUCTURES &
TRAVERSABLE OBSTACLES
FIRST EDITION -DECEMBER 2016
• Isolated sections of roadside barrier should not be introduced solely for the protection of a
telephone. Where a continuous roadside barrier is present, the telephone should be placed
near the end of the barrier;
• It desirable that emergency telephones are oriented so that the user faces the oncoming
traffic while operating the telephone;
• Emergency telephones should be situated at or near each major road feature, such as a
major interchange on a freeway or a major intersection on a highway. In such cases,
telephones are placed on the departure side of the feature;
• Approaching drivers should have adequate sight distance to the telephone;
• Visibility of the site from surveillance cameras should also be maintained;
• Access to telephone lines should be considered whilst determining the location of an
emergency telephone;
• Ambient noise levels should not unduly affect telephone usage;
• The location of lighting columns and signs must not conflict with the site proposed for the
telephone. However, at the same time road lighting must provide adequate illumination of the
telephone and phones should be placed within 10m on the approach side of a street lighting
pole. If street lighting is not provided, or is inadequate for identification and/or operation of
the telephone, special provisions may be needed to enable operating instructions to be
followed;
• Existing or planned vegetation must not obscure telephones or the vision of camera coverage
of the site;
• The topography of the ground in the vicinity of the telephone should also be considered and,
where possible, emergency telephones should be located in areas with a gradient of 1:6 or
flatter (locations on steep batters are unsuitable);
• All emergency telephones should be numbered to assist callers reporting incidents, and to
provide unambiguous identification of the site for the deployment of emergency services and
maintenance staff.
Emergency telephones should be readily identifiable from the road during the day and at night from a distance
that enables drivers to stop safely.
5.2.8 EN12767, NCHRP350 and MASH Performance Classifications for
Passively Safe Supports
All passively safe structures shall have demonstrated compliance with the European requirements of EN12767
[2] and/or the American recommendations in either NCHRP350 [10] or MASH [11] and additional local
conditions for the Abu Dhabi Road Network. Evidence of this shall be presented and approved by the
Overseeing Organization prior to the use of these systems. Only systems approved by the Overseeing
Organization shall be used.
After January 1, 2011, newly-tested passively safe support structures must be evaluated in accordance with
either EN12767 or MASH. However, support structures that were accepted before the adoption of MASH by
using criteria contained in NCHRP350 may remain in place and may continue to be manufactured and
installed.](https://image.slidesharecdn.com/documento50-1-120-5152borrador-240214213429-246eea16/85/Documento-50-1-120-51-52-borrador-pdf-98-320.jpg)
![ROADSIDE DESIGN GUIDE
PAGE 99
05 PASSIVELY SAFE SUPPORT STRUCTURES &
TRAVERSABLE OBSTACLES
FIRST EDITION -DECEMBER 2016
The European standard EN12767 classifies the support structures according to three main categories:
• Impact Speed;
• Energy Absorption; and
• Occupant Safety.
All EN12767 tests are carried out with a 900kg test vehicle; impacting the support structure head- on, as shown
in Figure 5.18.
There are four different types of tests; all with different impact speeds as shown in Table 5.2. All systems must
first be tested with an impact speed of 35km/h. This low speed test is designed to demonstrate if the failure
mechanism works, even in low energy impacts. A secondary impact test, with an impact speed of either 50,
70 or 100km/h, then follows. This secondary test determines the system’s Impact Speed Class, as shown in
Table 5.2.
Figure 5.18 – Example of an EN12767 test
Table 5.2 – EN12767 impact speed categories [2]
Speed Class km/h Impact Speeds km/h
50 35 and 50
70 35 and 70
100 35 and 100
An important measure of performance for a passively safe support structure is the amount of energy
absorbed during the impact. The lower the impact absorption, the higher the safety is likely to be. As an
example, a regular support structure would absorb all the energy during an impact and therefore the impact
force is exerted into the vehicle and then to the occupants; causing injury. In EN12767, the energy
absorption characteristic of a system is assessed through the reduction in the speed of the vehicle, as a
result of the impact. Depending on the amount of reduction, the product is classified as either High Energy
Absorbing (HE), Low Energy Absorbing (LE) or Non Energy absorbing (NE), as shown in Table 5.3.](https://image.slidesharecdn.com/documento50-1-120-5152borrador-240214213429-246eea16/85/Documento-50-1-120-51-52-borrador-pdf-99-320.jpg)
![ROADSIDE DESIGN GUIDE
PAGE 100
05 PASSIVELY SAFE SUPPORT STRUCTURES &
TRAVERSABLE OBSTACLES
FIRST EDITION -DECEMBER 2016
Table 5.3 – EN12767 energy absorption categories [2]
Impact Speed (km/h) 50 70 100
Energy Absorption Category Exit speed, ve (km/h)
HE ve = 0 0 ≤ ve ≤ 5 0 ≤ ve ≤ 50
LE 0 < ve ≤ 5 5 < ve ≤ 30 50 < ve ≤ 70
NE 5 < ve ≤ 50 30 < ve ≤ 70 70 < ve ≤ 100
In addition, EN12767 also requires passively safe products to be classified by their impact severity. During the
test, longitudinal and angular accelerations are measured through accelerometers installed on the test vehicle.
The occupant safety is then assessed through severity indices, which are based on the accelerometer
measurements. Following are the indices, which are used to evaluate occupant safety in EN12767:
• Acceleration Severity Index (ASI): A concept which has been developed for assessing
occupant impact severity for vehicles involved in collisions with road restraint systems;
• Theoretical Head Impact Velocity (THIV): A concept where the theoretical velocity of the
impact of an occupant’s head with the interior surface of the vehicle is assessed as a
measure of impact severity.
Once the ASI and THIV are calculated, the Occupant Severity Level is then determined as shown in Table 5.4.
The lower the ASI and THIV values are, the higher the occupant safety would be. Therefore, the Occupant
Severity Level 3 provides the highest level of safety, which is followed by Levels 2 and 1.
Table 5.4 – EN12767 occupant safety classification [2]
Energy
Absorption
Categories
Occupant
Severity Level
Speeds
Mandatory Low Speed Test at
35km/h
Speed Class Impact Test at 50,
70 or 100km/h
Maximum Value Maximum Value
ASI THIV (km/h) ASI THIV (km/h)
High Energy
Absorbing
(HE),
1 1,0 27 1,4 44
2 1,0 27 1,2 33
3 1,0 27 1,0 27
Low Energy
Absorbing (LE)
1 1,0 27 1,4 44
2 1,0 27 1,2 33
3 1,0 27 1,0 27
Non Energy
absorbing
(NE),
1 1,0 27 1,2 33
2 1,0 27 1,0 27
3 0,6 11 0,6 11
4
No
requirement
No
requirement
Impact speed - exit speed
<3km/h
In addition, during the test the structure must ensure that:](https://image.slidesharecdn.com/documento50-1-120-5152borrador-240214213429-246eea16/85/Documento-50-1-120-51-52-borrador-pdf-100-320.jpg)
![ROADSIDE DESIGN GUIDE
PAGE 101
05 PASSIVELY SAFE SUPPORT STRUCTURES &
TRAVERSABLE OBSTACLES
FIRST EDITION -DECEMBER 2016
• The test item shall behave in a manner predicted by the manufacturer, in terms of shearing
or detaching, deforming only, or deforming and shearing;
• The test item or detached elements, fragments or other major debris from the test item shall
not penetrate the occupant compartment. The windscreen may be fractured but shall not be
penetrated;
• The vehicle shall remain upright for not less than 12 m beyond the impact point with a (roll
angle) less than 45º and a (pitch angle) less than 45º. Roll and pitch refer to the angle of
change along x and y axes respectively, as shown in Figure 5.19.
For testing to the American requirements of NCHRP350 or MASH, the breakaway support must perform in a
predictable manner when struck head-on by an 820 kg car (NCHRP350) and/or an 1100 kg car and a 2270 kg
pickup truck (MASH), at a speed from 30 km/h to 100 km/h [2]. In addition, the testing is conducted to ensure
that:
• When impacted, the structural support must react in a predictable manner by breaking away,
fracturing or yielding;
Figure 5.19 – Pitch and Roll Angles
• No components must penetrate or show potential to penetrate the occupant compartment
of the test vehicle;
• The vehicle must remain stable and upright during and after the impact;
• There must be no significant deformation or intrusion of the windshield or passenger
compartment;
• Limits are placed on the transverse and longitudinal components of the occupant impact
velocity to avoid the possibility of serious injury.
These specifications also establish a maximum stub height of 150 mm. This reduces the possibility of snagging
the undercarriage of a vehicle after a support has broken away from its base.
5.2.9 Selection Criteria for Passively Safe Support Structures
In Abu Dhabi, breakaway supports can be used on roads with a design speed equal to, or greater than 80
km/h.](https://image.slidesharecdn.com/documento50-1-120-5152borrador-240214213429-246eea16/85/Documento-50-1-120-51-52-borrador-pdf-101-320.jpg)
![ROADSIDE DESIGN GUIDE
PAGE 102
05 PASSIVELY SAFE SUPPORT STRUCTURES &
TRAVERSABLE OBSTACLES
FIRST EDITION -DECEMBER 2016
Where a passively safe support is to be used, it shall have been tested to an impact speed which reflects the
posted speed limit of the road. Within NCHRP350 and MASH, the maximum designated test speed is 100km/h.
For roads with a speed limit equal to or in excess of 100km/h, the passively safe structure shall have been
tested to 100km/h.
When choosing an EN12767 system, the following should be considered, with regards to Energy Absorption
characteristics. Category NE supports provide a lower risk of injury to vehicle occupants than HE or LE, and
can be the most appropriate choice on non-built up roads with insignificant volumes of non-motorized users
(NMUs). Category LE and HE supports reduce the risk of secondary incidents and collision with NMUs, as the
vehicle exit speed is lower, and thus can have advantages on built-up roads where there is a significant volume
of NMUs. [12]
Category NE supports are generally slip-base systems. Slip-base supports are mostly suitable for locations
where vehicle speeds are greater than 60 km/h and are the preferred type of frangible poles [13]. Due to the
risk posed from detached elements from the slip-base systems, impact absorbing supports are suited to
locations where it is undesirable for a pole to fall to the ground, such as in high pedestrian use areas or where
the median or traffic island in which the pole is located is narrow and traffic volumes are high [13]. Impact
absorbing supports are usually category LE in EN12767. In areas where pedestrians are likely to exist, the
volume of pedestrian traffic should be reviewed to determine if a slip-base support will present a greater
potential hazard to the pedestrian traffic than a non-breakaway support will to the vehicular traffic. This should
be ascertained using engineering judgement and experience. Locations where the hazard potential to
pedestrian traffic may be greater than the risk to vehicle occupants will include:
• Parking lots;
• Tourist attractions;
• School zones; or
• Central business districts and local residential neighbourhoods where the posted speed
limited is 50 km/h or less [3].
In these locations, non-passively safe supports and lighting columns may be a better choice. Non- passively
safe supports are generally category HE in EN12767. Other locations that typically require the use of non-
breakaway bases, regardless of the pedestrian traffic volume, are rest areas and combined light and traffic
signal poles.
In some rare cases an engineer may consider placing a passively safe support structure within the working
width of a barrier. However, whilst they are designed to reduce the risk of injury to road users in the event of
an impact, passively safe products should not be placed within the working width of a safety barrier (or
equivalent for other vehicle restraint system types). One such case is shown in Figure 5.20; where there is an
existing barrier to shield the rock face but not enough space beyond the working width of the barrier to place
a support structure. In this case an engineer may be tempted to place a passively safe system, within the
working width, as there is not enough space to place a rigid one behind the working width. The safety of this
kind of installation is debatable; as these systems are designed and tested to work without secondary impacts.](https://image.slidesharecdn.com/documento50-1-120-5152borrador-240214213429-246eea16/85/Documento-50-1-120-51-52-borrador-pdf-102-320.jpg)
![ROADSIDE DESIGN GUIDE
PAGE 103
05 PASSIVELY SAFE SUPPORT STRUCTURES &
TRAVERSABLE OBSTACLES
FIRST EDITION -DECEMBER 2016
Figure 5.20 – Passively safe supports should not be installed in the working width of a safety
barrier
5.2.10 Application Criteria for Passively Safe Supports
The Abu Dhabi Standard Drawings Manual presents the hardware details for the safe installation of
roadside furniture such as highway signs, lighting columns, and traffic signals.
Following the approach detailed within Chapter 3, before specifying the use of any type of support structure
within the roadside or median, the following points should be considered [1]:
• Avoid placing poles close to the roadway - Any roadway improvement that involves
reconstruction of utility services should take the opportunity to avoid placement of poles close
to the roadway. This proactive approach will avoid problems rather than having to rectify them
in future. Where possible, poles should be located as far away from the roadside as possible
to minimise the risk of an errant vehicle hitting them;
• Pole removal – In all cases, poles should be removed wherever possible. It should be noted
however, that on tangents to curves where there is a crash history, the removal of a pole may
lead to crashes migrating to the next available pole. When considering removal of a pole with
a crash history it is important to understand why vehicles are leaving the road and take action
to keep vehicles on the road;
• Undergrounding cables – The relocation of utility services to underground ducts and
removal of the poles is the most effective option for the treatment of hazardous poles;
• Rationalisation of pole functions - It may be possible to rationalise the number of poles
along a road corridor by combining separate functions and services onto common poles. For
example, traffic signals, road lighting and large signage may be supported by the same poles.
Power cables, telecommunication services and spotlights can share common poles.
However, care must be taken so as not to overload the post and, in the case of passively](https://image.slidesharecdn.com/documento50-1-120-5152borrador-240214213429-246eea16/85/Documento-50-1-120-51-52-borrador-pdf-103-320.jpg)
![ROADSIDE DESIGN GUIDE
PAGE 104
05 PASSIVELY SAFE SUPPORT STRUCTURES &
TRAVERSABLE OBSTACLES
FIRST EDITION -DECEMBER 2016
safe sign supports, adversely affect their impact performance characteristics. It may be possible to place all
poles on the side of the road that has the better safety performance or least risk. This may involve changing
the poles from side to side as the crash risk changes along a curved route;
• Reducing pole numbers by increasing spacing - Increased pole spacing provides areas
for errant vehicles to pass between poles as shown in Figure 5.21.
• The effective gaps for vehicles to pass through are dependent on the width of the vehicle and
the exit angles. If increased pole spacing is used to reduce the roadside risk then designers
should check that the poles being removed to increase pole spacing are those that have
been involved in crashes or have the higher risk. It would be counterproductive to remove
poles which have not been a hazard but leave the high-risk poles in place;
Relocation - Pole relocation needs to target areas where the run-off-road crashes are likely, for example on
the approach to curves, the outside of curves, near lane merges, lane terminations, adjacent to exits from
roundabouts and intersections. Research [1] has confirmed the belief that the number of crashes decreases
as poles are moved further from the roadway. The expected percentage reduction in pole crashes with
increasing distance from the roadway is shown in Table 5.5.
Figure 5.21 – Reducing pole numbers by increasing spacing](https://image.slidesharecdn.com/documento50-1-120-5152borrador-240214213429-246eea16/85/Documento-50-1-120-51-52-borrador-pdf-104-320.jpg)
![ROADSIDE DESIGN GUIDE
PAGE 105
05 PASSIVELY SAFE SUPPORT STRUCTURES &
TRAVERSABLE OBSTACLES
FIRST EDITION -DECEMBER 2016
Table 5.5 – Percentage reduction in pole crashes with increasing distance from the roadway [1]
Distance from roadway
before relocation (m)
Distance from roadway after relocation (m)
1.8 2.4 3.0 3.7 4.6 5.2 6.1 7.6 9.1
0.6 50 58 64 68 72 74 77 80 82
0.9 35 46 53 58 64 67 70 74 77
1.2 22 35 44 50 57 60 65 69 73
1.5 11 26 36 43 51 55 59 65 69
1.8 0 17 28 36 45 49 54 61 65
2.1 8 20 29 39 44 50 57 62
2.4 0 13 23 33 39 45 53 58
3.0 0 11 23 29 37 45 52
3.3 5 18 25 33 42 49
3.7 0 14 20 29 39 46
4.0 9 16 25 35 43
4.3 4 12 21 32 40
4.6 0 8 17 29 37
Example: A lighting pole is located 1.8m from the edge of the travelled way. If the pole is relocated to 5.2m
from the edge of the travelled way, a 49% reduction is expected in the number of crashes with the pole; using
Table 5.5.
5.2.10.1 Foundation Requirements for Passively Safe Systems
In many cases, the performance of a passively safe support will be dependent on the foundations surrounding
the support. In some cases, the design of the support system will be such that any movement or rotation of
the support in the ground may inhibit (or in extreme cases, stop) the safe functioning of the passively safe
device. For this reason it is essential that the promoter of the system is requested to provide details of the
foundation requirements for their system, prior to its installation. In those cases where the system has not been
tested in the soil type into which it is to be installed, the promoter should be asked to provide supporting
evidence to ensure that the full performance of the system can be realised in the foundation into which it is to
be installed.
As shown through full-scale impact testing, slip-base mechanisms (see Section 5.2.2.3) are designed to
release when impacted at a typical bumper height of about 500mm and properly to activate if loaded in shear
rather than bending stress. For this reason, slip-base systems should only be installed in areas where the
foreslope is limited to 1V:6H. Supports placed on foreslopes that are between 1V:4H and 1V:6H are only
acceptable when the face of the support is within 600mm of the intersection of the shoulder slope and the
foreslope, as shown in Figure 5.22.
No passively safe supports should be located in drainage ditches where erosion of the ditch could affect the
proper operation of the breakaway mechanism. A vehicle entering the ditch could also be inadvertently guided
into the support.](https://image.slidesharecdn.com/documento50-1-120-5152borrador-240214213429-246eea16/85/Documento-50-1-120-51-52-borrador-pdf-105-320.jpg)
![ROADSIDE DESIGN GUIDE
PAGE 106
05 PASSIVELY SAFE SUPPORT STRUCTURES &
TRAVERSABLE OBSTACLES
FIRST EDITION -DECEMBER 2016
Intersection of shoulder slope and fore slope
Less than 600mm Acceptable
Passively Safe Support Structure Foreslope between 1V:4H and
1V:6H
Greater than 600mm Not Acceptable
Figure 5.22 – Use of passively safe support structures on slopes
5.2.10.2 Electrical Disconnection of Passively Safe Lighting columns,
Traffic Signals and Illuminated Signs
For passively safe lighting columns, traffic signals and illuminated signs, a power supply will be required into
to provide the power for the lighting systems. In many passively safe designs, the associated electrical
connections are also designed to disconnect in the event of an impact, and then subsequently easy to
reconnect.
There are a range of different commercially available electrical isolation solutions, and these fall into three
broad categories [8]:
Pull-out plug – This solution utilises a rugged plug and socket assembly mounted within the signal pole at
ground level. In the event of an impact, the plug assembly will be pulled apart due to the movement of the
pole, therefore achieving electrical isolation of the pole. Both LE and NE products will probably give the
movement needed to separate a pull-out plug system. If the broken post was effectively tethered by the
electrical supply, this would interfere with the movement of the post and the vehicle might overrun the post, or
a restrained post might hit a windscreen [8]. A HE support may not give the movement needed to separate a
plug system depending on the rotation of the post in the ground.
Circuit breaker – This method obtains electrical isolation by using a current sensor to ascertain if the electrical
current drawn exceeds a present threshold. If a fault state is achieved, isolators automatically turn off the
power within a maximum duration of 0.4 seconds.
Impact sensor – Similar to the circuit breaker system, the impact sensor is mounted in the pole, which in the
event of a vehicle striking the pole, is used to activate isolators mounted in the traffic signal cabinet.
Any exposed electrical connection (when detached from the support structure), can pose a risk of electrocution
to the occupant of the errant vehicle, other road users and/or emergency services attending the scene. For
this reason the electrical circuit controlling the power to the mounted system should operate with a maximum
disconnection time of 0.4 seconds when fault conditions occur [2]. In addition, the electrical disconnection
should take place in a location which is as close to the foundation as practicable.](https://image.slidesharecdn.com/documento50-1-120-5152borrador-240214213429-246eea16/85/Documento-50-1-120-51-52-borrador-pdf-106-320.jpg)
![ROADSIDE DESIGN GUIDE
PAGE 107
05 PASSIVELY SAFE SUPPORT STRUCTURES &
TRAVERSABLE OBSTACLES
FIRST EDITION -DECEMBER 2016
5.2.10.3 Locating Passively Safe Sign Supports
Although the Abu Dhabi MUTCD specifies the general location of large roadside signs, the designer has to
apply engineering knowledge with regard to the exact placement of any given sign. Further guidance on the
locating of posts can be found within Section 5.2.10.
It should be borne in mind that once struck, the sign can become a maintenance problem, requiring repair. It
is for this reason that even passively safe sign supports should be located where they are least likely to be hit
and, when feasible, outside the clear zone. Furthermore, the continuous wind buffeting caused by passing
vehicles may create fatigue problems on the threaded components of sign supports, if they incorporate such
components. To overcome this problem, passively safe signs should wherever possible be placed so that the
edge of the sign is not closer than 1.2 m from the carriageway edge [12].
5.2.10.4 Locating Passively Safe Lighting Columns
It may be the case that the design of the lighting is such that lighting columns are needed to be place in high
risk locations such as gore areas, traffic islands, off ramps, and intersections. At all times, the safety
implications of locating the lighting column should be considered using engineering judgement and if possible,
the lighting column should be moved to a location which would represent a lower level of risk to the road user.
This may mean removing the lighting column. In cases where the column cannot be moved, engineering
judgement should be applied to determine the best solution to reduce the risk posed to road users.
Figure 5.23 gives an example of a poor location of a lighting column as there is little protection given to road
users on the main line of the road, those turning right, or those turning from the road on the right onto the main
line. In such a location, it would be prudent to consider removing the lighting column (an example of which is
shown in Figure 5.24), moving it behind the safety barrier further down the road, or to consider the use of a
crash cushion in front of the lighting column and signs. Note that in the example shown in Figure 5.24, the
large posts and raised kerb will also present a hazard and hence, this is still not an optimised solution.
Figure 5.23 – Example of poor lighting column positioning at a traffic island](https://image.slidesharecdn.com/documento50-1-120-5152borrador-240214213429-246eea16/85/Documento-50-1-120-51-52-borrador-pdf-107-320.jpg)
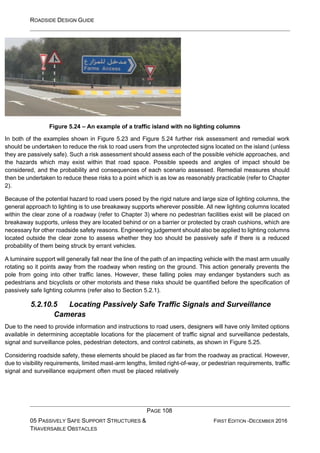
![ROADSIDE DESIGN GUIDE
PAGE 109
05 PASSIVELY SAFE SUPPORT STRUCTURES &
TRAVERSABLE OBSTACLES
FIRST EDITION -DECEMBER 2016
close to the travelled way as shown in Figure 5.25. Note that in the example of Figure 5.25 risks to road users
are also posed from the trees and the other roadside posts/lighting columns.
Figure 5.25 – Example of a surveillance camera and control cabinet
When placing passively safe traffic signals and surveillance cameras, the requirements of Chapter 3 should
be considered, and the hazard should be placed outside of the calculated clear zone. However, it is not only
the support which poses a risk to road users, it may also be the associated control cabinet.
In determining the location of the control cabinet, the designer should consider the following:
• The controller cabinet should be placed in a position so that it is unlikely to be struck by
errant vehicles. It should be outside the clear zone, if practical;
• The controller cabinet should be located where it can be easily accessed by maintenance
personnel;
• The controller cabinet should be located so that a technician working in the cabinet can see
the signal indications in at least one direction;
• The controller cabinet should be located where the potential for water damage is
minimized;
• The controller cabinet should not obstruct intersection sight distance;
• The power service connection should be reasonably close to the controller cabinet [3]
A good example of locating the control cabinet can be seen in Figure 5.25 where the cabinet is located away
from the edge of both carriageways, and between two rigid objects (trees) which will provide protection to the
cabinet, in the absence of a barrier system. However, ease of access to the cabinet by a maintenance team
should also be considered.
5.3 Traversable Obstacles
As identified in Chapter 4, there are a number of roadside hazards which relate more to the geometry of the
roadside, rather than to specific types of hazards or items located within it. Such roadside geometry cannot be
made ‘passively safe’ in the purest sense of the word, instead they](https://image.slidesharecdn.com/documento50-1-120-5152borrador-240214213429-246eea16/85/Documento-50-1-120-51-52-borrador-pdf-109-320.jpg)
![ROADSIDE DESIGN GUIDE
PAGE 111
05 PASSIVELY SAFE SUPPORT STRUCTURES &
TRAVERSABLE OBSTACLES
FIRST EDITION -DECEMBER 2016
• Lighting columns;
• Supports for traffic signals and surveillance cameras;
• Emergency telephones.
Roadside topography which can be made traversable includes:
• Culverts and drainage structures;
• Transverse slopes;
• Ditches.
There are two main types of passively safe support structures:
• Slip-base and non-energy absorbing supports are designed to breakaway at their base upon
impact, allowing the vehicle to pass beneath the support to minimise or avoid injury to vehicle
occupants;
• Energy-absorbing supports collapse on impact by an errant vehicle, and are designed to
decelerate an impacting vehicle to a controlled way.
When using slip-base supports, consideration should be given to whether the system is unidirectional (i.e. they
are designed to work in one orientation only), multidirectional (i.e. they are designed to be impacted in more
than direction) or omnidirectional (i.e. they can impacted in any direction). Unidirectional and multidirectional
should be installed in those locations where they can only be impacted in the direction for which they have
been designed (and tested). Conversely, omnidirectional slip bases can be installed in any location as they
have been designed (and tested) to be impacted in any direction.
Slip-base mechanisms are designed to release when impacted at a typical bumper height of about 500mm
and properly activates if loaded in shear rather than bending stress. For this reason, slip- base systems should
only be installed in areas where the foreslope is limited to 1V:6H. Supports placed on foreslopes that are 1V:4H
through 1V:6H are only acceptable when the face of the support is within 600mm of the intersection of the
shoulder slope and the foreslope. In addition, no passively safe supports should be located in drainage ditches
where erosion of the ditch could affect the proper operation of the breakaway mechanism. A vehicle entering
the ditch could also be inadvertently guided into the support.
In addition, when utilising a slip-base system, the hazard posed from detached parts of slip-base systems,
should be considered, in particular the risk posed to other road users, in particular pedestrians. This may
restrict the use of slip-base systems in some locations.
All passively safe system used should meet the testing requirements of EN12767, NCHRP350 or MASH.
Where a passively safe support is to be used, it shall have been tested to an impact speed which reflects the
speed limit of the road. Within NCHRP350 and MASH, the maximum designated test speed is 100km/h. For
roads with a speed limit equal to or in excess of 100km/h, the passively safe structure shall have been tested
to 100km/h.
5.5 References
[1] Austroads, Guide to Road Design Part 6: Roadside Design, Safety and Barriers, Sydney,](https://image.slidesharecdn.com/documento50-1-120-5152borrador-240214213429-246eea16/85/Documento-50-1-120-51-52-borrador-pdf-111-320.jpg)
![ROADSIDE DESIGN GUIDE
PAGE 112
05 PASSIVELY SAFE SUPPORT STRUCTURES &
TRAVERSABLE OBSTACLES
FIRST EDITION -DECEMBER 2016
NSW: Austroads, 2010.
[2] CEN, Eurpean Standard EN12767: Passive Safety of Support Structures for Road Equipment -
Requirements, Classification and Test methods, CEN, Eurpopean Committee for
Standardization, 2007.
[3] AASHTO, Roadside Design Guide, 4th Edition, Washington D.C.: American Association of
State Highway and Transportation Officials, 2011.
[4] Abu Dhabi Department of Transport, Road Structures Design Manual, First Edition, Abu Dhabi:
Department of Transport,
[5] AASHTO Standard Specifications for Structural Supports for Lighting Signs, Luminaires and
Traffic Signals, Fifth Edition, Washington D.C.: American Association of State Highway and
Transportation Officials, 2009
[6] Federal Highway Administration, Maintenance of Signs and Sign Supports, Washington D.C.:
US Department of Transportation, January 2010.
[7] Alberta Infrastructure and Transportation, Roadside Design Guide, Alberta Infrastructure and
Transportation, November 2007.
[8] The Passive Revolution, Designing Safer Roadsides, A Handbook for Engineers, Exeter, UK:
Hemming Information Services in association with The Passive Revolution and Traffic
Engineering & Control, 2008.
[9] G. Williams, J. Kennedy, J. Carroll and R. Beesley, “The use of passively safe signposts and
lighting columns, PPR342,” Transport Research Laboratory, Wokingham, UK, August, 2008.
[10] NCHRP, “NCHRP Report 350, Recommended Procedures for the Safety Performance
Evaluation of Highway Features,” Transportation Research Board, National Research Council,
Washington DC, 1993.
[11] FHWA, “Manual for Assesing Safety Hardware (MASH),” [Online]. Available:
http://safety.fhwa.dot.gov/roadway_dept/policy_guide/road_hardware/ctrmeasures/mash/.
[Accessed 23 02 2015].
[12] BSI, “Passive safety of support structures for road equipment - Requirements, classification
and test methods,” British Standards Institution, October 2009.
[13] Roads & Transport Authority, Roadside Design Guide for Dubai, First Edition, Dubai: RTA,
2008.](https://image.slidesharecdn.com/documento50-1-120-5152borrador-240214213429-246eea16/85/Documento-50-1-120-51-52-borrador-pdf-112-320.jpg)
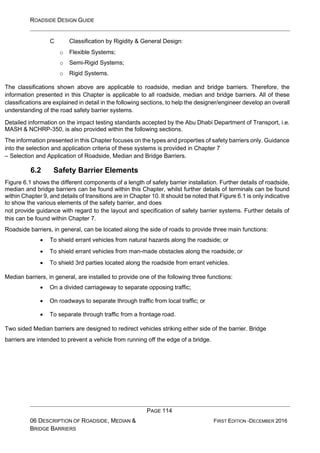
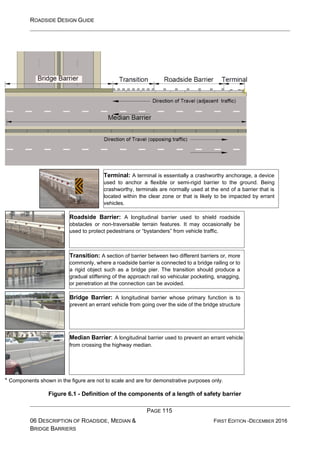
![ROADSIDE DESIGN GUIDE
PAGE 116
06 DESCRIPTION OF ROADSIDE, MEDIAN &
BRIDGE BARRIERS
FIRST EDITION -DECEMBER 2016
6.3 Classification of Safety Barriers by Performance
6.3.1 Overview
Perhaps the most important and relevant type of classification for safety barriers is the performance
classification. The performance classification is assessed and demonstrated through a series of standardised
full scale impact tests, such as the one shown in Figure 6.2. These impact tests not only prove whether a
barrier performs satisfactorily under certain impact conditions, but they also provide a controlled way of
accurately measuring certain impact characteristics of the system under test. These important impact
characteristics, such as dynamic deflection, working width, zone of intrusion and impact severity levels, provide
the vital information that a designer/engineer needs when designing the roadside geometry and selecting an
appropriate barrier system. These impact characteristics, which are explained in further detail in the following
sections, are often more relevant to the roadside designer/engineer than the individual dimensions of the
system.
Figure 6.2 – Impact testing of a roadside safety barrier
At the moment there are two main established impact test standards, which are used widely around the world.
These are:
• The American Guidelines - MASH [1] (previously NCHRP350 [2]); and
• The European Standard – EN1317 [3].
Due to the reasons explained in Chapter 1, the selected impact test guidelines for the safety barriers to be
used in the Abu Dhabi Road Network are MASH and NCHRP350. All safety barriers (used in the roadside,
median and on the edge of bridges) shall have demonstrated compliance with the American recommendations
in either NCHRP Report 350 (FHWA, 2004) or MASH (AASHTO, 2009) and additional local conditions for the
Abu Dhabi Road Network. Evidence of this shall be presented and approved by the Overseeing Organization
prior to the use of these systems. Only systems approved by the Overseeing Organization shall be used.
Performance classification according to these guidelines is presented in more detail in the following sections.
A brief overview of the EN1317 standard is also provided in Section 6.3.4, for informative purposes only. This
is further expanded in Appendix A.](https://image.slidesharecdn.com/documento50-1-120-5152borrador-240214213429-246eea16/85/Documento-50-1-120-51-52-borrador-pdf-116-320.jpg)
![ROADSIDE DESIGN GUIDE
PAGE 117
06 DESCRIPTION OF ROADSIDE, MEDIAN &
BRIDGE BARRIERS
FIRST EDITION -DECEMBER 2016
6.3.2 NCHRP350 and MASH Performance Classifications
After January 1, 2011, newly-tested safety barriers must be evaluated in accordance with MASH. However,
vehicle restraint systems that were accepted before the adoption of MASH by using criteria contained in
NCHRP Report 350 may remain in place and may continue to be manufactured and installed.
In order to meet the requirements of NCHRP350, or MASH, the safety barrier must demonstrate that it can
successfully decelerate (and in some cases redirect) an impacting vehicle without the unsafe detachment of
elements. During such times, the impacting vehicle should maintain an upright orientation, whilst meeting the
requirements of two severity indices; Occupant Impact Velocity (OIV) and Occupant Ride-down Acceleration
(ORA). The portion of the end treatment included in a barrier’s length-of-need must have re-directional
characteristics similar to those of the barrier to which it is attached.
The purpose of NCHRP350 and MASH is to present uniform guidelines for the impact testing of both
permanent and temporary highway safety features and recommended evaluation criteria to assess test results.
It should be noted that both NCHRP350 and MASH are guidelines and not formal standards and hence, they
only provide advice on the way in which testing should be conducted.
6.3.3 Test Types in NCHRP350 and MASH
The guidelines of NCHRP350 and MASH contain a number of Tables and Figures to explain the testing which
was undertaken to demonstrate the performance of a particular vehicle restraint system. This is based on over
40 years of experience from those involved within the industry, on an International basis. The underlying
philosophy in the development of the guidelines is that the testing conditions should represent the “worst case.”
This is particularly true for the determination of the impact weight, speed and angles of the tests.
For example, the weight of the small passenger car test vehicle was selected to represent approximately the
98th percentile of passenger type vehicles in the USA; i.e. only two percent of vehicles weigh less than the
specified test weight. The impact speed and angle combination represents approximately the 92.5 percentile
of real-world crashes [2]. The test requirements for longitudinal barrier systems are included in Table 6.1 and
Table 6.2.
When the combined effects of all testing parameters are considered, the testing represents the extremes of
impact conditions to be expected in real-world situations. At the same time, the existence of consistent
guidelines ensures that there is a level platform on which to test, and therefore ultimately compare, the
performance of different products.
It is also implicitly assumed that, if a roadside safety feature performs satisfactorily at the two extremes, for
example at TL-1 and TL-6, then the feature would also work well for all impact conditions in between, such as
TL-2, TL-3, TL-4 and TL-5. This assumption has shown to be reasonable for most roadside safety features [2].
Following an impact test to the requirements of NCHRP350 or MASH, the performance of the tested system
is evaluated in terms of the stability of the impacting vehicle; risk of injury to the occupants inside the impacting
vehicle, the structural adequacy of the safety feature, the exposure to workers and pedestrians that may be
behind a barrier or in the path of debris resulting from impact with a safety feature, and the post-impact
behaviour of the test vehicle.](https://image.slidesharecdn.com/documento50-1-120-5152borrador-240214213429-246eea16/85/Documento-50-1-120-51-52-borrador-pdf-117-320.jpg)
![ROADSIDE DESIGN GUIDE
PAGE 118
06 DESCRIPTION OF ROADSIDE, MEDIAN &
BRIDGE BARRIERS
FIRST EDITION -DECEMBER 2016
Table 6.1 - Test requirements for NCHRP350 [2]
Test Level
Test conditions
Test vehicles
Vehicle speed
(km/h)
Impact angle
(°)
TL-1
820-kg passenger car
2000-kg pickup truck
50
50
20
25
TL-2
820-kg passenger car
2000-kg pickup truck
70
70
20
25
TL-3
820-kg passenger car
2000-kg pickup truck
100
100
20
25
820-kg passenger car 100 20
TL-4 2000-kg pickup truck 100 25
8,000-kg single-unit truck 80 15
820-kg passenger car 100 20
TL-5 2000-kg pickup truck 100 25
36,000-kg semi-trailer truck 80 15
820-kg passenger car 100 20
TL-6 2000-kg pickup truck 100 25
36,000-kg tanker truck 80 15
Table 6.2 - Test requirements for MASH [1]
Test Level
Test conditions
Test vehicles
Vehicle speed
(km/h)
Impact angle
(°)
TL-1
1100-kg passenger car
2270-kg pickup truck
50
50
25
25
TL-2
1100-kg passenger car
2270-kg pickup truck
70
70
25
25
TL-3
1100-kg passenger car
2270-kg pickup truck
100
100
25
25
TL-4
1100-kg passenger car
2270-kg pickup truck
10,000-kg single-unit truck
100
100
90
25
25
15
TL-5
1100-kg passenger car
2270-kg pickup truck
36,000-kg semi-trailer truck
100
100
80
25
25
15
TL-6
1100-kg passenger car
2270-kg pickup truck
36,000-kg tanker truck
100
100
80
25
25
15](https://image.slidesharecdn.com/documento50-1-120-5152borrador-240214213429-246eea16/85/Documento-50-1-120-51-52-borrador-pdf-118-320.jpg)
![ROADSIDE DESIGN GUIDE
PAGE 119
06 DESCRIPTION OF ROADSIDE, MEDIAN &
BRIDGE BARRIERS
FIRST EDITION -DECEMBER 2016
If a system successfully meets these parameters, its performance during the impact test is then classified by:
• Containment Level;
• Deflection Distance;
• Zone of Intrusion;
• Impact Severity Level.
Further details of these classifications are given in the following sections. These factors can then be used to
specify the performance of the system which is required at a particular site. It is therefore emphasised that for
a particular road safety application, it is not a product which should be specified, but the performance
requirements of the safety measure which is to be installed. Once the performance requirements of a particular
site are specified, a product which meets the requirements can be selected from the Abu Dhabi Department
of Municipal Affairs and Transport’s list of accepted proprietary products.
Other factors that should be evaluated in the design of a safety feature, include aesthetics, cost (initial and
maintenance), and durability (ability to withstand environmental conditions, wind- induced fatigue loading, sand
accumulation, effects of moisture, ultraviolet radiation, etc.). These are not addressed by these testing
standards, as this is not their purpose. However, the designer/engineer should evaluate the importance of
these factors on a site-by-site basis through engineering judgment.
6.3.3.1 Classification by Containment/Test Level
The containment/test level of a safety barrier relates specifically to the combination of weight, impact angle
and speed of test vehicle which the barrier has shown to successfully contain and redirect under full scale
impact testing to NCHRP350 or MASH. Reference should be made to Table 6.1 and Table 6.2 for further
details on the testing requirement for each containment/test level.
For example, if a barrier was shown to contain an 1100kg passenger car at 100km/h and 25 degrees, and a
2270kg pickup truck at 100km/h and 25 degrees, the system would be classified as a ‘TL-3’ safety barrier
under the criteria defined in MASH (Table 6.2).
It can also be observed from these tables, that the higher test levels require successful performance with
heavier impact vehicles or higher impact speeds. Therefore, the higher test levels prove successful
performance with higher energy impacts.
The TL-1 & TL-2 systems have been developed primarily for passenger cars and pick-up trucks for roads
where the speed limit isn’t over 50km/h or 70km/h respectively. These systems provide less protection
compared to the systems which are designed to the higher test levels. The most commonly used barriers
around the world today are the TL-3 systems [6]. TL-4 and TL-5 systems are generally designed for heavier
vehicles, weighing up to 10,000 and 36,000kg respectively. TL- 6 systems are also designed for impacts with
vehicles up to 36,000kg, but for the TL-6 test a tanker truck is used, whereas for the TL-5 test a semi-trailer
truck is used.
The higher test level barriers (TL-4 and over) are usually more expensive compared to the lower test level
ones. However, they may be justified for locations with high traffic volumes, higher traffic speeds, poor road
geometry, significant volume of heavy vehicle traffic and 3rd
party risk nearby](https://image.slidesharecdn.com/documento50-1-120-5152borrador-240214213429-246eea16/85/Documento-50-1-120-51-52-borrador-pdf-119-320.jpg)
![ROADSIDE DESIGN GUIDE
PAGE 120
06 DESCRIPTION OF ROADSIDE, MEDIAN &
BRIDGE BARRIERS
FIRST EDITION -DECEMBER 2016
(See Chapter 4, Section 4.4). On the other hand, a TL-3 system may not be cost effective for locations with
low traffic speed and volume. In such locations a TL-2 or a TL-1 system may be enough to contain the likely
range of vehicle impacts.
For design of barriers and railings refer to “AASHTO-LRFD Bridge Design Specifications” [4] and “AASHTO
Standard Construction Specifications” [5].
6.3.3.2 Classification by Deflection Characteristics
Deflection characteristics are among the most important features of a safety barrier. The amount of deflection,
which a system shows during an impact, changes from one design to another.
In general, barrier systems with higher deflection characteristics, i.e. flexible systems (see Section 6.5.1),
would dissipate the energy of a crash more and therefore lower the impact forces imposed upon the vehicle
occupants. On the other hand, systems with higher deflection would require more clear space behind them to
work safely. This is because, an errant vehicle can still reach the hazard behind and experience a secondary
impact, as shown in Figure 6.3, if the distance between the hazard and the barrier is less than the barrier’s
deflection distance. For this reason, depending on the available space on the site, the designer/engineer may
need to choose a system which has less deflection (see Chapter 7 for application requirements).
Figure 6.3 – A hazard, located within the deflection distance of the safety barrier
The deflection characteristics of a safety barrier are determined through full scale impact testing and are
expressed with the following properties:
• Dynamic Deflection: is the maximum dynamic lateral displacement of the traffic face of the
barrier that occurs during impact [1], as shown in Figure 6.4;
• Working Width: is the distance between the traffic face of the barrier before the impact and
the maximum lateral position of any major part of the system or vehicle, during the impact
as shown in Figure 6.4.
Both dynamic deflection and working width are determined through the analysis of high speed video coverage,
recorded during the impact test. The designer/Engineer can find this information through the promoter of the
system or within the test report.](https://image.slidesharecdn.com/documento50-1-120-5152borrador-240214213429-246eea16/85/Documento-50-1-120-51-52-borrador-pdf-120-320.jpg)
![ROADSIDE DESIGN GUIDE
PAGE 121
06 DESCRIPTION OF ROADSIDE, MEDIAN &
BRIDGE BARRIERS
FIRST EDITION -DECEMBER 2016
(See Chapter 4, Section 4.4). On the other hand, a TL-3 system may not be cost effective for locations with
low traffic speed and volume. In such locations a TL-2 or a TL-1 system may be enough to contain the likely
range of vehicle impacts.
For design of barriers and railings refer to “AASHTO-LRFD Bridge Design Specifications” [4] and “AASHTO
Standard Construction Specifications” [5].
6.3.3.1 Classification by Deflection Characteristics
Deflection characteristics are among the most important features of a safety barrier. The amount of deflection,
which a system shows during an impact, changes from one design to another.
In general, barrier systems with higher deflection characteristics, i.e. flexible systems (see Section 6.5.1),
would dissipate the energy of a crash more and therefore lower the impact forces imposed upon the vehicle
occupants. On the other hand, systems with higher deflection would require more clear space behind them to
work safely. This is because, an errant vehicle can still reach the hazard behind and experience a secondary
impact, as shown in Figure 6.3, if the distance between the hazard and the barrier is less than the barrier’s
deflection distance. For this reason, depending on the available space on the site, the designer/engineer may
need to choose a system which has less deflection (see Chapter 7 for application requirements).
Figure 6.3 – A hazard, located within the deflection distance of the safety barrier
The deflection characteristics of a safety barrier are determined through full scale impact testing and are
expressed with the following properties:
• Dynamic Deflection: is the maximum dynamic lateral displacement of the traffic face of the
barrier that occurs during impact [1], as shown in Figure 6.4;
• Working Width: is the distance between the traffic face of the barrier before the impact and
the maximum lateral position of any major part of the system or vehicle, during the impact
as shown in Figure 6.4.
Both dynamic deflection and working width are determined through the analysis of high speed video coverage,
recorded during the impact test. The designer/Engineer can find this information through the promoter of the
system or within the test report.](https://image.slidesharecdn.com/documento50-1-120-5152borrador-240214213429-246eea16/85/Documento-50-1-120-51-52-borrador-pdf-121-320.jpg)
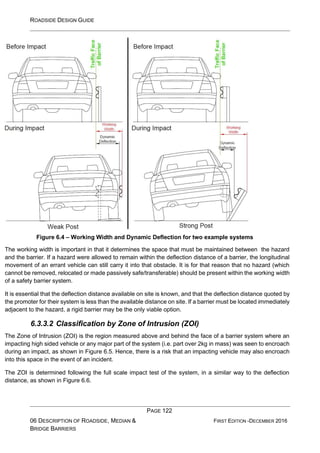
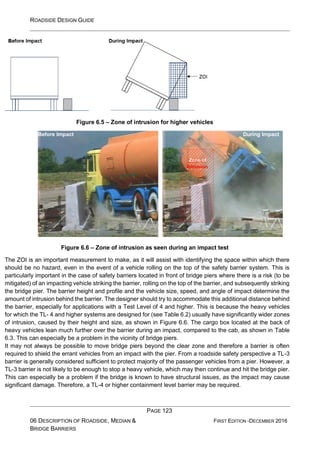
![ROADSIDE DESIGN GUIDE
PAGE 124
06 DESCRIPTION OF ROADSIDE, MEDIAN &
BRIDGE BARRIERS
FIRST EDITION -DECEMBER 2016
Table 6.3 – Examples of ZOI width for selected barrier types and test levels*
Test
Level
Barrier Type
Barrier Height
Range (Bh) in mm
Zone of Intrusion
Width (ZOIw) in mm
TL-2
Concrete 508-686 711
Concrete 686-1067 305
TL-3
Sloped-face
Concrete
762-813 457
Vertical
Concrete
737-813 610
Combination
of concrete
and steel
889-1067 610
Steel tubular
rails on curb
813-864 457
Steel tubular
without
curbs
705-914 762
TL-4 All 737-1067
864
(ZOIw_cab)
2030
(ZOIw_cargo)
* Adapted from AASHTO Roadside Design Guide [5]](https://image.slidesharecdn.com/documento50-1-120-5152borrador-240214213429-246eea16/85/Documento-50-1-120-51-52-borrador-pdf-124-320.jpg)
![ROADSIDE DESIGN GUIDE
PAGE 125
06 DESCRIPTION OF ROADSIDE, MEDIAN &
BRIDGE BARRIERS
FIRST EDITION -DECEMBER 2016
As guidance, in the USA, the AASHTO LRFD Bridge Design Specifications [7] set out the requirements for
design evaluation and rehabilitation of bridges. According to these specifications, bridge piers that are within
9m of the travelled way should be designed to withstand a large impact load or be shielded with a barrier. The
following height guidelines from the AASHTO LFRD Bridge Design Specifications are based on offset from the
travelled way to the face of the pier [6]:
• A 1370mm high barrier located 3m or less from the pier; or
• A 1070mm high barrier located more than 3m from the pier [7].
These values are only given as general guidance. The engineer/designer can identify the ZOI of individual
systems by referring to the crash test reports and high speed videos. This way, the required distance between
the barrier and the pier can be adjusted according to the impact behaviour of the individual product.
Narrowing of the roadway is not preferred on high-speed facilities to accommodate additional clearance for
ZOI. For example, do not reduce the shoulder width to gain additional clearance behind the barrier to meet the
ZOI guidelines. In those cases where the height of the hazard does not exceed the height of the barrier, the
ZOI is not considered to be relevant.
6.3.3.3 Classification by Impact Severity Level
Another important characteristic of a safety barrier is the impact severity level. As explained in Chapter 2, a
roadside barrier should also be considered as a hazard and it should only be used if the consequences of
hitting the barrier are expected to be less than hitting the hazard behind. Every barrier has different impact
characteristics and some absorb the impact energy better than the others, therefore exerting less impact forces
on the occupants of the errant vehicle. Rigid barriers for example (see Section 6.5.3) do not deflect as much
during an impact, as the flexible barriers (see Section 6.5.1) would and therefore usually higher forces are
exerted on the vehicle occupants during an impact with a rigid system.
The impact severity level of a system is determined through full scale impact testing. Due to the cost, reliability
and design of impact test dummies, occupant risk in NCHRP350 and MASH is assessed by the response of a
theoretical unrestrained front seat occupant whose motion, relative to the occupant compartment is determined
by the vehicle’s accelerations. The ‘point mass’ occupant is assumed to move through space until it strikes a
hypothetical part of the vehicle’s interior, and subsequently is assumed to then experience the remainder of
the vehicle’s acceleration pulse by remaining in contact with the vehicle interior. The two performance factors,
which determine the impact severity level for a barrier, are:
a) Occupant Impact Velocity (OIV): Which is the lateral and longitudinal component of
occupant velocity at the time when it impacts the vehicle’s interior;
b) Occupant Ride-down Acceleration (ORA): Which is the highest lateral and longitudinal
component of the resultant vehicular acceleration averaged over a 10ms interval following
the impact
Methods for calculating these values can be found in both NCHRP350 [2] and MASH [1]. Table 6.4 presents
the preferred and maximum allowable OIV & ORA Values from MASH.](https://image.slidesharecdn.com/documento50-1-120-5152borrador-240214213429-246eea16/85/Documento-50-1-120-51-52-borrador-pdf-125-320.jpg)
![ROADSIDE DESIGN GUIDE
PAGE 126
06 DESCRIPTION OF ROADSIDE, MEDIAN &
BRIDGE BARRIERS
FIRST EDITION -DECEMBER 2016
Table 6.4 - Preferred and maximum allowable OIV & ORA values from MASH [1]
Occupant Impact Velocity (OIV) Limits
Component Preferred Maximum Allowable
Longitudinal and Lateral 9.1 m/s 12.2 m/s
Longitudinal 3.0 m/s 4.9 m/s
Occupant Ride-down Acceleration (ORA) Limits
Component Preferred Maximum Allowable
Longitudinal and Lateral 15.0 G 20.49 G
* For more information on test types, please refer to MASH [1]
OIV and ORA provide a method of ranking the severity of the impact with the safety barrier system, and give
an indicative guide to the level of injury which might be expected from an impact with an errant vehicle
(assuming all of the impact parameters are the same as those under which the safety barrier was tested). In
general terms, the lower the value of OIV and ORA for a particular system, the lower the risk of injury would
be to the vehicle occupants in the event of an impact.
6.3.1 The European Standard EN1317
Whilst vehicle restraint systems used within Abu Dhabi should be successfully tested to the requirements of
NCHRP350 and MASH, for completeness, reference is also made to the European Standard for the testing of
road restraint systems, EN1317 (see also Appendix A).
The European standard has been prepared by the European Committee for Standardization (CEN). During
the initial drafting of EN1317 in the mid-1990s, developments within the preparation of NCHRP350 were
followed closely by the standards writers in Europe, and every effort was made to harmonize the impact
performance standards (e.g. using the same or similar testing conditions and evaluation criteria). However,
given the inherent differences in highway and traffic conditions between the United States and EU, differences
between the U.S. guidelines and CEN standards arose. The gap between these two sets of requirements has
opened even further in the preparation of the MASH and latest published versions of EN1317 [8].
Despite a number of attempts, no equivalence can be found between testing to NCHRP350/MASH and
EN1317. Due to the different testing methods, test vehicle types and speeds, the use of both EN1317 and
NCHRP350/MASH products on the same scheme is strongly discouraged.
EN1317 is split into a number of different parts, each concentrating on a different product sector, the latest
published versions of which are outlined below:
• EN1317-1: 2010 - Terminology and general criteria for test methods;
• EN1317-2: 2010 - Performance classes, impact test acceptance criteria and test methods
for safety barriers including vehicle parapets;
• EN1317-3: 2010 - Performance classes, impact test acceptance criteria and test methods
for crash cushions;
• ENV1317-4; 2002 - Performance classes, impact test acceptance criteria and test methods
for terminals and transitions of safety barriers;](https://image.slidesharecdn.com/documento50-1-120-5152borrador-240214213429-246eea16/85/Documento-50-1-120-51-52-borrador-pdf-126-320.jpg)
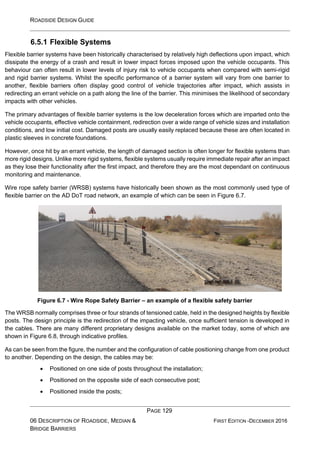
![ROADSIDE DESIGN GUIDE
PAGE 130
06 DESCRIPTION OF ROADSIDE, MEDIAN &
BRIDGE BARRIERS
FIRST EDITION -DECEMBER 2016
• Or intertwined.
Apart from the ones where the cables are positioned on a single side of the posts throughout the installation,
the WRSB are designed to contain impacts from both sides and are therefore commonly used as median
barriers.
*Profiles are not to scale and are shown for indicative purposes only.
Figure 6.8 – Examples of WRSB profiles
It is not possible to make a general statement about the impact performance characteristics of different cable
configurations, i.e. it is not possible to say that one configuration is safer than the other. The engineer/designer
should refer to the test results and manufacturer’s specifications to compare different products. The majority
of the WRSB systems available on the market today are tested to TL-3; however, there are also TL-4 systems
available.
The height of the individual cables is important and changes from one system to another. A typical system can
have an upper cable height of 580mm to 720mm from the ground level [9]. The cable heights are generally
designated as the result of numerous crash tests and computer simulations to provide the optimum
performance. If the cables are too low, an impacting vehicle may go over the barrier; whereas if the cables are
too high, an impacting vehicle may go under the barrier. For this reason it is very important that the cable
heights of the installed system is the same as the crash tested one.
Another important property is the post spacing. Although the main aim of the posts in a flexible system is to
keep the cables at the designated height and easily bend under the vehicle impact, they do also add stiffness
to the overall system. As the post spacing decreases, the stiffness of the system increases and therefore the
deflection of the system decreases. A lot of the proprietary systems are available in different post spacing
configurations to provide systems with different](https://image.slidesharecdn.com/documento50-1-120-5152borrador-240214213429-246eea16/85/Documento-50-1-120-51-52-borrador-pdf-130-320.jpg)
![ROADSIDE DESIGN GUIDE
PAGE 131
06 DESCRIPTION OF ROADSIDE, MEDIAN &
BRIDGE BARRIERS
FIRST EDITION -DECEMBER 2016
working widths. However, as the number of posts increase, so does the cost of the system. As a very general
guidance, a typical WRSB system can have post spacing anywhere between 1.8m to 3.2m.
Depending on the type of soil, the post may be driven directly to the ground, installed in sockets which are
driven into the ground or installed in sockets with concrete casings, as shown in Figure
6.9. Type and the depth of foundation required changes from one design to another, and therefore the selection
should be made according to the manufacturer’s instructions. However, as a very general guidance, a typical
WRSB system can have foundation depths anywhere between 400mm to 1,000mm, although these may need
to be increased where sandy or weak soil conditions exist.
*Profiles are not to scale and are shown for indicative purposes only.
Figure 6.9 – Examples of WRSB foundation types
The majority of the WRSB systems available on the market today are designed to have higher tensions on the
cables, compared to the first WRSB designs. During the evolution of these systems, it was understood that by
applying higher tension to the cables, lower deflections can be achieved under impact. As the cables are
already tensioned before the impact, it takes less deflection for the system to build the necessary tension to
redirect the errant vehicle. For this reason, it is important that the tensions on the cables are kept within the
acceptable limits. These limits change from one product to another and every product should be tensioned to
the manufacturer’s specifications. This is especially important in Abu Dhabi, where the high temperatures can
cause the cables to expand and therefore decrease the tension. The tension in the cables can be increased
or decreased through cable tensioners located at the anchorages (see Figure 6.7) or on the cables, depending
on the design and length of installation.
A negative effect of using tensioned cables is that it limits the road geometries on which the systems can be
installed. This is especially true on tight horizontal curves, where the high tension can bend the posts; and on
sag vertical curves, where the high tensions can lift the cables from the posts and increase the cable height to
unacceptable limits. The minimum allowable horizontal curve radius for WRSB installation changes from one
design to another, but as a general guideline 200m can be indicated as the recommended minimum for most
systems [9].](https://image.slidesharecdn.com/documento50-1-120-5152borrador-240214213429-246eea16/85/Documento-50-1-120-51-52-borrador-pdf-131-320.jpg)
![ROADSIDE DESIGN GUIDE
PAGE 132
06 DESCRIPTION OF ROADSIDE, MEDIAN &
BRIDGE BARRIERS
FIRST EDITION -DECEMBER 2016
The length of the tested system makes a considerable difference in the deflection characteristics. It is known
that short test installations, such as 100-150m, can demonstrate lower deflections compared to longer
installations such as 250-300m. This is because, in short installations, the tension builds up with less deflection
and some of the tension is shared by the ground anchors located at the ends of the system. As a result, WRSB
systems should ideally not be installed on the roadside, in lengths longer than the ones used during the impact
test. If they are installed in longer lengths, they may deflect further than the distances recorded during the
impact test; which may cause errant vehicles to reach the hazards behind the barrier.
Another type of flexible system is the weak post w-beam barrier, an example of which is shown in Figure 6.10.
This system behaves like a low tension WRSB, i.e. the barrier posts are weak and designed to bend easily
during an impact, without too much resistance. Naturally, this system does not incorporate blockouts, as these
would increase the stiffness of the posts and therefore would be against its working principle. The posts are
placed far apart and their main function is to keep the w-beam at the required height rather than adding
significant stiffness to the system. Variations of this system have been successfully tested to TL-2 and TL-3
[5]. The weak posts used in these systems are similar to those of the WRSB designs. Similar to the WRSB,
the required beam height, foundation depth and post spacing would change from one system to another, and
therefore the system installed on the roadside should be the same as the system tested during the full-scale
crash test. Please refer to the individual details of products provided by manufacturers. However, as a very
general guidance, a typical weak post system can have post spacing of around 3.8m, a beam height of around
710mm and a foundation depth of around 900mm.
Figure 6.10 – Weak Post W-Beam Barrier
In sandy areas, the open design of the wire rope system prevents drifting on or alongside the roadway.
However the local experience shows that the sand accumulation is still a problem with the weak post w-beam
system. Therefore designer/engineer should assess the potential sand accumulation of a system, on a product-
by-product basis; independent of its rigidity classification. Such accumulation of sand against the face of a
barrier can, in itself, present a risk of injury to road users, as shown in Figure 6.11.](https://image.slidesharecdn.com/documento50-1-120-5152borrador-240214213429-246eea16/85/Documento-50-1-120-51-52-borrador-pdf-132-320.jpg)
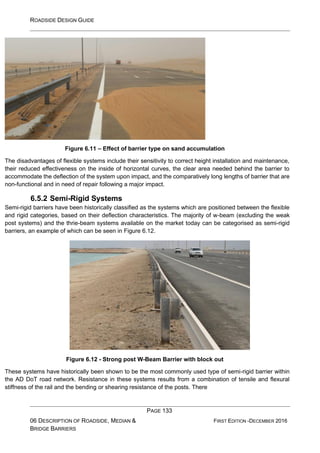
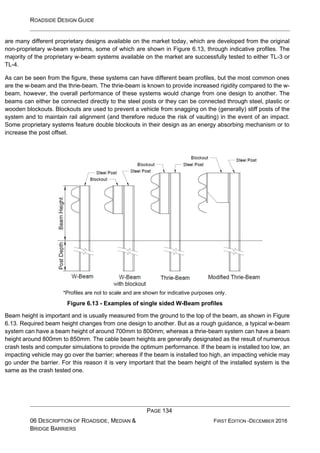
![ROADSIDE DESIGN GUIDE
PAGE 135
06 DESCRIPTION OF ROADSIDE, MEDIAN &
BRIDGE BARRIERS
FIRST EDITION -DECEMBER 2016
Another important property is the post spacing. As the post spacing decreases, the stiffness of the system
increases and therefore the deflection of the system decreases. This effect is demonstrated in Table 6.5,
through very general, indicative values for selected systems. The table shows the effect of changing the post
spacing on the maximum deflection. The values shown here are based on two sources. The first source is the
results of a computer simulation using the Numerical Analysis of Roadside Design (NARD) Program. The
second source is the full scale impact tests carried out by the Kansas Department of Transportation. Both, the
simulations and the full scale impact tests shown in the table were carried out with a 2,000kg passenger car
at an impact angle and speed of 25° and 97km/h [6]. As can be seen from the table, barriers deflect more once
the post spacing is increased. The values shown in this table are very general and for indicative purposes only.
A lot of the proprietary systems are available in different post spacing configurations to provide systems with
different working widths. However, as the number of posts increases, so does the cost of the system. As a
very general guidance, a typical w-beam system can have post spacing anywhere between 0.6 m to 5.0m.
The designer/engineer should refer to the crash test reports for each individual product to determine the
maximum deflection and working width. Impact tested products should not be modified on site to alter their
post spacing, as doing so effectively creates a new system, and therefore further impact testing is required.
Table 6.5 – Effect of post spacing on barrier deflection*
Barrier Type
Impact
Angle (°)
Post Spacing
(mm)
Maximum Deflection (mm)
Simulation
Result
Impact Test
Result
Single W-
beam
25 1,905 907 754
25 952 541 597
Double W-
beam
25 952 437 498
25 476 320 N/A
Single Thrie-
Beam
25 1,905 716 N/A
25 952 480 N/A
* Adapted from AASHTO Roadside Design Guide [6]
It is often possible to find double sided versions of a lot of the designs available on the market. The double
sided systems are designed to be used in the median as they can withstand impacts from both sides. The
addition of the second beam on the opposite side increases the rigidity and as a result affects the impact
characteristics of the system. For this reason, the double sided versions of the single sided w-beam designs
should also be impact tested. Experience shows that the double sided versions of single sided w-beam design
often successfully pass the same test levels with less deflection. Figure 6.14, shows some indicative profiles
of the common double sided w-beam systems.](https://image.slidesharecdn.com/documento50-1-120-5152borrador-240214213429-246eea16/85/Documento-50-1-120-51-52-borrador-pdf-135-320.jpg)
![ROADSIDE DESIGN GUIDE
PAGE 136
06 DESCRIPTION OF ROADSIDE, MEDIAN &
BRIDGE BARRIERS
FIRST EDITION -DECEMBER 2016
*Profiles are not to scale and are shown for indicative purposes only.
Figure 6.14 - Examples of double sided W-Beam profiles
Similar to WRSB systems, the w-beam posts can be driven directly to the soil, placed in sockets which are
driven into the soil or placed in concrete casings (see Figure 6.9). The type and depth of the foundation required
changes from one design to another and therefore, a selection should be made according to the manufacturer’s
instructions. However, as very general guidance, a typical w-beam system can have foundation depths
anywhere between 1,000mm to 1,200mm.
Semi-rigid barriers deform or deflect upon impact but to a lesser extent than flexible systems. When struck by
an errant vehicle, the support posts are designed to bend/collapse and the barrier rail to deform and act as a
belt to absorb some of the impact force. The tensile forces developed in the barrier rail assist in redirecting
the impacting vehicle. Resistance is achieved through the combined flexure and tensile strength of the rail.
In terms of advantages and disadvantages, semi-rigid barriers are positioned between flexible and rigid
systems.
• Their initial cost is usually higher than the flexible ones but lower than the rigid ones;
• Depending on the severity of impact, semi-rigid barriers usually retain a level of functionality
(albeit reduced) after a slight/moderate collision, thereby eliminating the need for immediate
repair [6]. This makes the semi-rigid systems more durable compared to the flexible ones.
Therefore, they are less dependent on maintenance and immediate repair, compared to the
flexible systems. However, they are not as durable or maintenance-free as the rigid systems;
• In terms of impact forces exerted on to vehicle occupants, semi-rigid systems, in general,
provide a smoother deceleration compared to rigid systems. However, the flexible systems
provide even smoother deceleration than the semi-rigid systems;](https://image.slidesharecdn.com/documento50-1-120-5152borrador-240214213429-246eea16/85/Documento-50-1-120-51-52-borrador-pdf-136-320.jpg)
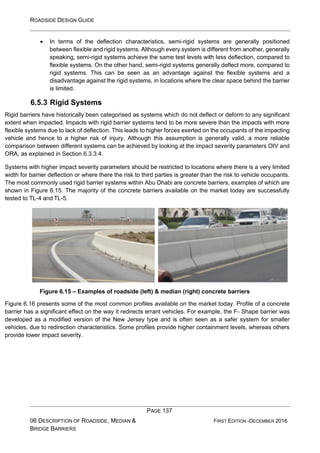
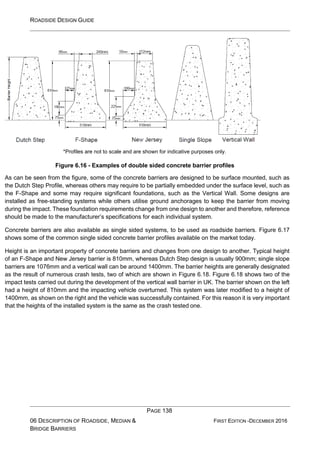
![ROADSIDE DESIGN GUIDE
PAGE 139
06 DESCRIPTION OF ROADSIDE, MEDIAN &
BRIDGE BARRIERS
FIRST EDITION -DECEMBER 2016
*Profiles are not to scale and are shown for indicative purposes only.
Figure 6.17 - Examples of single sided concrete barrier profiles
Figure 6.18 – Effect of concrete barrier height on impact performance
Due to their rigid nature, and their ability to successfully contain vehicles with minimal damage, the cost to
maintain and repair rigid barriers over their life (often quoted as 50 years) is less than for semi-rigid and flexible
systems [9]. However, it is often the case that the cost of initially installing rigid systems will be greater than
for semi-rigid and flexible systems with the same containment capability.
Concrete barriers can be installed in two methods, precast or cast in-situ, as shown in Figure 6.19. In precast
systems, the individual concrete blocks are built at a factory and joined together on site. This type of concrete
barrier takes less time to install compared to in-situ alternative. The connection details between the individual
blocks changes from one system to another and is of vital importance. The Engineer/Designer should make
sure the connections are done in-line with the original design and the system on the road is installed to the
same standard as the impact tested system.](https://image.slidesharecdn.com/documento50-1-120-5152borrador-240214213429-246eea16/85/Documento-50-1-120-51-52-borrador-pdf-139-320.jpg)
![ROADSIDE DESIGN GUIDE
PAGE 140
06 DESCRIPTION OF ROADSIDE, MEDIAN &
BRIDGE BARRIERS
FIRST EDITION -DECEMBER 2016
The in-situ concrete barriers are cast on the site via mobile slip form machines. The installation in this type of
system takes longer compared to pre-cast systems; however, the resulting barrier often provides higher
performance due to its continuous structure.
Figure 6.19 – Examples of in-situ (left) [10] and pre-cast (right) concrete barriers
Pre-cast systems utilise a number of different interlocking mechanisms to connect individual concrete blocks.
These mechanisms often require a block to be slid over the edge of the next one to create an interlocking
connection. Some of these are patented systems and are unique to specific manufacturers. A representation
of such an interlocking mechanism is shown in Figure 6.20.
Figure 6.20 – Example of a pre-cast concrete barrier connection mechanism
Concrete barriers can be installed in a number of different ways, as shown in Figure 6.21. The in- situ systems
are often cast on asphalt or gravel bases and are free-standing. Pre-cast systems can be embedded within a
layer of asphalt, placed on a gravel or asphalt base or they can be anchored to the ground. Embedding the
system within a layer of asphalt adds additional resistance against lateral movement during impact, and
therefore helps decrease the deflection. On the other hand, the freestanding pre-cast systems may deflect
during an impact, depending on the specific design.](https://image.slidesharecdn.com/documento50-1-120-5152borrador-240214213429-246eea16/85/Documento-50-1-120-51-52-borrador-pdf-140-320.jpg)
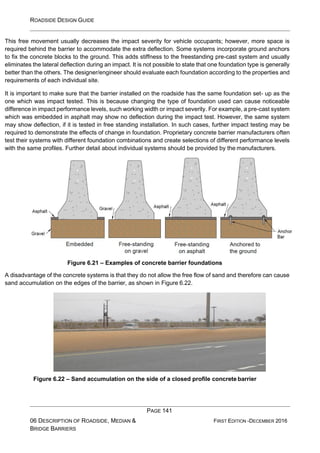
![ROADSIDE DESIGN GUIDE
PAGE 142
06 DESCRIPTION OF ROADSIDE, MEDIAN &
BRIDGE BARRIERS
FIRST EDITION -DECEMBER 2016
A rigid barrier can be considered for freeways, truck roads, and expressways in the following cases:
• to shield objects close to the roadway where deflection space is limited;
• On truck roads where there is a high volume (10% or more) of heavy trucks [12];
• To minimize repair and maintenance;
• To reduce headlight glare into nearby buildings or other sensitive areas;
• To reduce headlight glare between frontage roads and the mainline, especially where the
alignment directs headlights at opposing traffic; and
• Areas where it is especially critical to contain errant vehicles.
Where a concrete barrier is used as a rigid barrier system, the following considerations should be made:
• For roadside and bridge applications, the safety shape should be located on the traffic side
with (if present), the vertical face on the back;
• Concrete barriers can be backfilled behind the barrier, as shown in Figure 6.23, to provide
lateral support and to further reduce deflection in the event of an impact;
Figure 6.23 – Example of a concrete median barrier with backfill
• Due to the rigid nature of the system, taller vehicles such as HGVs and buses may roll on the
top of the barrier (see ZOI in Section 6.3.3.3). This should be considered when specifying the
concrete barrier system, and the distance between the front of the barrier system and the
hazard located behind it;
• Due to their rigid nature, concrete barriers should ideally only be located in places where the
anticipated angle of impact is less than 15 degrees to reduce the risk of injury to vehicle
occupants in the event of an impact. These are mainly high speed dual carriageway roads;
• Concrete barriers must not be located more than 4 m from the edge of the nearest traffic lane
because greater distances increase the risk of higher angle collisions with the barrier [9];
• For a concrete barrier to be effective, the barrier must be able to resist the impact load through
a combination of moment and shear loads. To achieve this, a minimum length of barrier is
required. Achieving this minimum length depends on the type of system, method of
anchorage of the barrier and the detail of the connections between elements of the](https://image.slidesharecdn.com/documento50-1-120-5152borrador-240214213429-246eea16/85/Documento-50-1-120-51-52-borrador-pdf-142-320.jpg)
![ROADSIDE DESIGN GUIDE
PAGE 143
06 DESCRIPTION OF ROADSIDE, MEDIAN &
BRIDGE BARRIERS
FIRST EDITION -DECEMBER 2016
system. Therefore designer/engineer should refer to the installation guidelines of the system, as
recommended by the manufacturer.
Bridge barriers are also considered as rigid systems. Due to the higher risks associated with the consequences
of falling off the side, bridge barriers are usually designer to containment level of TL-4 and higher. These
systems can be made of concrete, aluminium, steel or a combination of concrete and metal. Some of the
common profiles are shown in Figure 6.24, for indicative purposes.
*Profiles are not to scale and are shown for indicative purposes only.
Figure 6.24 – Examples of common bridge barrier profiles
Concrete systems are generally known for their ability to contain heavier vehicles and lower maintenance
costs, as they require virtually no maintenance for most hits. Concrete barriers such as New Jersey, F-Shape,
Single Slope and Vertical wall are considered to be MASH TL-5 bridge railings when adequately reinforced
and built to a minimum height of 1,067mm [6]. However, these systems are heavy and introduce a permanent
load on the bridge, which should be considered during the bridge design. Sometimes metal sections are added
on top of the concrete to increase the height of the system and therefore the containment level.
Metal bridge barriers can be made of aluminium or steel. The metal systems, especially the aluminium ones,
are lighter than concrete alternatives and therefore introduce less loading on the bridge. However, they are
more likely to be damaged during impacts than the concrete ones and therefore have higher maintenance
costs. In general, steel systems can contain heavier vehicles than the aluminium one do; although this would
change from one design to another. Aluminium systems available on the market are mostly tested up to TL-4,
whereas it is possible to find TL-5 steel systems. Bridge barriers available on the market are predominantly
proprietary systems and therefore the design details can change dramatically from one system to another.
Further information should be provided by the manufacturer.
6.3 Summary and Conclusions
Safety barriers can be classified into different categories by several of their properties. These include:
• Impact Test Performance:](https://image.slidesharecdn.com/documento50-1-120-5152borrador-240214213429-246eea16/85/Documento-50-1-120-51-52-borrador-pdf-143-320.jpg)
![ROADSIDE DESIGN GUIDE
PAGE 144
06 DESCRIPTION OF ROADSIDE, MEDIAN &
BRIDGE BARRIERS
FIRST EDITION -DECEMBER 2016
o Containment Level;
o Working Width & Dynamic Deflection;
o Vehicle Intrusion;
o Impact Severity.
• Developer of the System:
o Proprietary Systems;
o Non-Proprietary Systems;
• Rigidity and General Design:
o Flexible Systems;
o Semi-Rigid Systems;
o Rigid Systems.
Of all these classifications, the most important and relevant ones are the performance classifications. The
performance classification of a system is determined through full scale impact testing. Performance of barrier
systems should be specified in terms of containment/test level (i.e. the weight and speed of vehicle for which
the system has been successfully tested), deflection distance (i.e. the distance which the barrier deflects under
impact), zone of intrusion (i.e. the distance above and behind the barrier where a higher vehicle may roll into),
and impact severity (i.e. how high is the risk of injury to the occupant of a vehicle in the event of an incident).
The recommended impact test guidelines for Abu Dhabi are MASH and NCHRP350.
Barrier systems can be designated as either proprietary (i.e. they are owned by a manufacturer) or non-
proprietary (i.e. they are patent free). Proprietary systems are to be preferred as they are tested to the latest
standards and will have a great amount of supporting information in terms of site suitability, training and
maintenance requirements.
Historically, barrier systems have been categorised as flexible, semi-rigid and rigid. With the increase of the
number and variety of available systems on the market, the boundaries between these categories have
disappeared. Therefore a more meaningful and recommended classification is the performance based one.
Each type of barrier has its place on the Abu Dhabi Road Network. However, care must be taken to ensure
that the minimum performance requirements specified for a particular barrier type are correct and that the
barrier selected meets or exceeds these minimum requirements.
Only barrier systems accepted by the Abu Dhabi Department of Municipal Affairs and Transport are permitted
to be installed on the road network.
6.4 References
[1] FHWA, “Manual for Assesing Safety Hardware (MASH),” [Online]. Available:
http://safety.fhwa.dot.gov/roadway_dept/policy_guide/road_hardware/ctrmeasures/mash/.
[Accessed 23 02 2015].](https://image.slidesharecdn.com/documento50-1-120-5152borrador-240214213429-246eea16/85/Documento-50-1-120-51-52-borrador-pdf-144-320.jpg)
![ROADSIDE DESIGN GUIDE
PAGE 145
06 DESCRIPTION OF ROADSIDE, MEDIAN &
BRIDGE BARRIERS
FIRST EDITION -DECEMBER 2016
[2] NCHRP, “NCHRP Report 350, Recommended Procedures for the Safety Performance
Evaluation of Highway Features,” Transportation Research Board, National Research Council,
Washington DC, 1993.
[3] CEN, “EN 1317 Road Restraint Systems - Part 2: Performance classes, impact test acceptance
criteria and test methods for safety barriers including vehicle parapets,” CEN (European
Committee for Standardization), Brussels, 2010.
[4] AASHTO-LRFD Bridge Design Specifications, 7th
Edition, Washington D.C.: American
Association of State Highway and Transportation Officials, 2014.
[5] Standard Specifications for Highway Bridges, 17th
Edition, Washington D.C.: American
Association of State Highways and Transportation Officials, 2005.
[6] AASHTO, Roadside Design Guide, 4th Edition, Washington D.C.: American Association of
State Highway and Transportation Officials, 2011.
[7] American Association of State Highway and Transportation Officials, AASHTO LRFD Bridge
Design Specifications, Washington DC: AASHTO, 2010.
[8] Roadside Safety Design Comittee, “Transportation Research Circular E-C172,” Transportation
Research Board, Washington D.C., 12 July 2012.
[9] RTA, Roadside Design Guide for Dubai, First Edition, Dubai: Roads and Transport Authority,
2008.
[10] G. Williams, “Whole Life Cost-Benefit Analysis for Median Safety Barriers,” TRL, 2008.
[11] Delta Bloc, Delta Bloc International GmbH, [Online]. Available:
http://www.deltabloc.co.uk/en/Product-
Categories/Permanent_Safety_Barriers8/pproducts/0.html. [Accessed 06 09 2015].
[12] Austroads, Guide to Road Design Part 6: Roadside Design, Safety and Barriers, Sydney, NSW:
Austroads, 2010.](https://image.slidesharecdn.com/documento50-1-120-5152borrador-240214213429-246eea16/85/Documento-50-1-120-51-52-borrador-pdf-145-320.jpg)
![ROADSIDE DESIGN GUIDE
PAGE 147
07 SELECTION AND APPLICATION OF ROADSIDE, MEDIAN
AND BRIDGE BARRIERS
FIRST EDITION -DECEMBER 2016
Table 7.1 - Selection criteria for roadside barriers
Criteria Comments
1. Containment requirements
(Performance Capability)
The barrier must be structurally able to contain and redirect an
errant vehicle, and hence the appropriate Test Level (TL) should
be selected.
2. Deflection distance and
clearance
Adequate deflection distance must be available so that the barrier
can deflect on impact without contacting rigid objects behind the
barrier. This will also require consideration of the Zone of Intrusion
(ZOI).
3. Site Conditions The slope approaching the barrier, slope behind the barrier, and
distance from travelled way may preclude the use of some barrier
types, as too might the ground conditions into which the barrier
will be installed.
4. Cost Standard barrier systems are relatively consistent in cost, but
special-use systems can cost significantly more.
5. Traffic Volumes and percentage
of heavier vehicles
A high volume of traffic on the road will increase the exposure of
the barrier system to impacts (both collision and nuisance hits).
Roads with a higher percentage of heavier vehicles will require the
provision of barrier with a higher test level (level of containment)
6. Maintenance
a. Routine The barrier should not require a significant amount of routine
maintenance.
b. Collision Damage Generally, flexible systems require significant repair after a
collision, semi-rigid systems have fewer repair requirements and
rigid systems or higher performance railings require an even
smaller amount of repair, sometimes nil. [1]
c. Nuisance Hits Flexible barriers will require the most frequent attention for
nuisance hits (e.g. mowers, minor vehicular encroachments).
Semi-flexible barriers will require repairs where nuisance hits
cause kinks or tears. Rigid barriers will seldom require repairs for
nuisance hits.
d. Materials Storage The fewer the number of different systems used, the fewer
inventory items/storage space required.
e. Simplicity Simpler designs, in addition to costing less, are more likely to be
repaired properly by field personnel.
7. Compatibility The barrier system selected may need to be connected to other
systems and/or terminals.
8. Aesthetics There may be some instances where the appearance of the
barrier, or the ability to see through the barrier may influence the
choice of barrier used.
9. Field Experience The performance and maintenance requirements of existing
systems should be monitored to identify problems that could be
lessened or eliminated by using a different barrier type.](https://image.slidesharecdn.com/documento50-1-120-5152borrador-240214213429-246eea16/85/Documento-50-1-120-51-52-borrador-pdf-148-320.jpg)
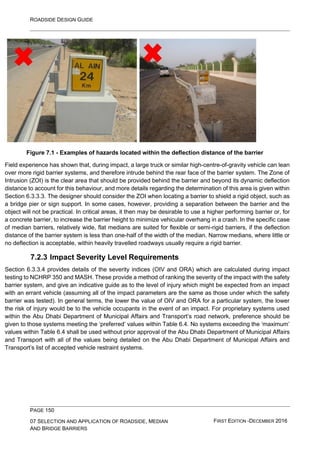
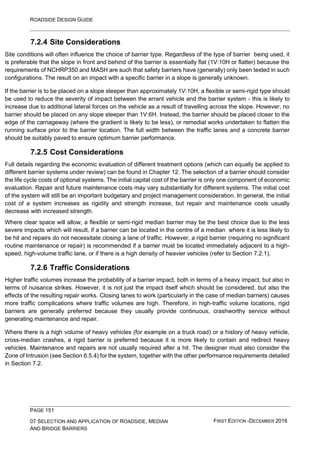
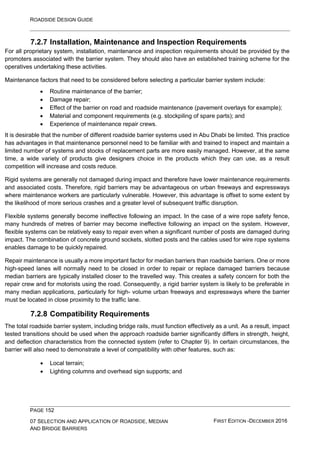
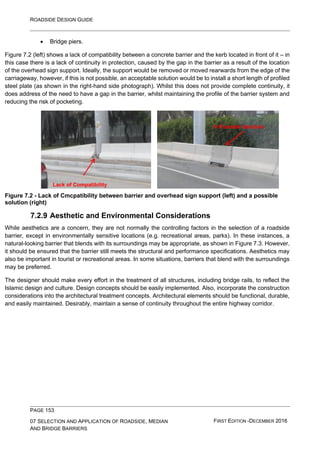
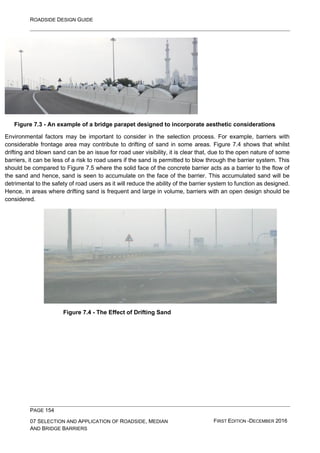
![ROADSIDE DESIGN GUIDE
PAGE 155
07 SELECTION AND APPLICATION OF ROADSIDE, MEDIAN
AND BRIDGE BARRIERS
FIRST EDITION -DECEMBER 2016
Figure 7.5 - Sand accumulation on the face of a concrete barrier
In a similar way, open profile barriers should be preferred in areas liable to flooding to allow the passage of
water through the system. Of course, the provision and maintenance of drainage solutions in these areas
should be reviewed when flooding is an issue.
Certain types of steel barrier will deteriorate in corrosive or abrasive environments; typically the soils in Abu
Dhabi are generally extremely corrosive due to the resistivity of the soil, the temperature and humidity, and
high winds.
Soil Resistivity is a measure of how much the soil can resist the flow of electricity. Corrosiveness of a soil can
be rated according to its resistivity; smaller resistivity results in more severe corrosivity rating. The soil
resistivity in Middle Eastern sandy desert environment is usually less than 2000ohm cm, which makes it
severely corrosive as shown in Table 7.3.
Table 7.3 - Soil Corrosivity Scale [2]
Soil Resistivity Range (Ω cm) Corrosivity Rating
0 – 2000 Severe
2000 - 10000 Severe to moderate
10000 - 30000 Mild
30000 and above Not likely
Temperature and humidity are important factors in soil corrosivity. High yearly means of temperatures and
humidity contribute to Abu Dhabi’s very corrosive environment. Wind velocity is relatively high in coastal
regions; sometimes with blowing sand (as shown in Figure 7.4). The combination of all of these properties
creates a very corrosive environment, which tests the durability of road safety systems and in particular, their
foundations.
Acceptable solutions such as protective coatings or thicker gauge metal could be utilised. The posts used for
a particular location will depend on two main aspects:
• The performance requirements and design of the barrier system;](https://image.slidesharecdn.com/documento50-1-120-5152borrador-240214213429-246eea16/85/Documento-50-1-120-51-52-borrador-pdf-156-320.jpg)
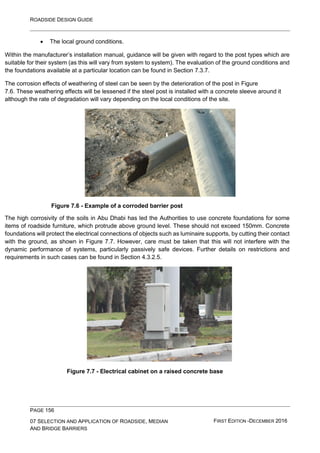
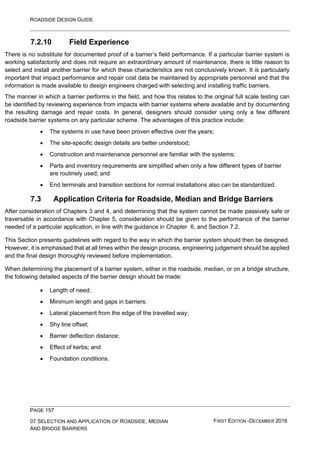
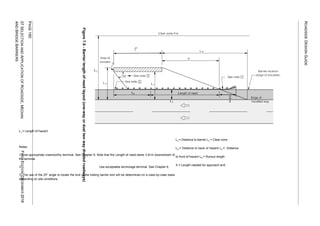
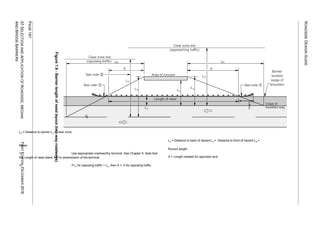
![ROADSIDE DESIGN GUIDE
PAGE 162
07 SELECTION AND APPLICATION OF ROADSIDE, MEDIAN
AND BRIDGE BARRIERS
FIRST EDITION -DECEMBER 2016
7.3.2 Minimum Length and Gaps in Barriers
To perform satisfactorily, barriers must have sufficient length to enable the strength to be developed
through the system and into the foundations and/or anchorages as impact occurs. Hence, even if the
length of need is shorter, the installation length of a barrier system should at least be the minimum
length of the barriers systems. Designers should, therefore, check that the distance between the
leading and trailing points of need is greater than the minimum length of barrier for the chosen barrier
type. The lengths to be considered in the design of roadside barriers are the [3]:
• Terminal lengths;
• Transition length; and
• Minimum length of barrier.
For proprietary systems, the minimum length of a barrier system should be stated within the
manufacturer’s installation manual. However, as a general guide, for semi-rigid systems, the barrier
should have at least 30m [1] of barrier section exclusive of terminal sections and/or transition sections.
For flexible systems, the minimum length is 60m [4], exclusive of the terminal or transition sections.
For rigid barriers, a minimum length of 20-30m may be suitable [1].
Likewise, short gaps between runs of barrier are undesirable. This is because short gaps introduce
discontinuities into the system, and increase the risk for errant motorists; as they can hit the ends of
the barriers. These barrier ends should be shielded by crashworthy terminals (see Chapter 9). A single
gap requires two terminals (one for each end) and the cost of two crash-worthy terminals is likely to be
more than the cost of a short distance of standard barrier section. Ultimately, the cost effectiveness of
each option will depend on the costs of terminals and the standard section of barrier and also on the
length of the gap. The evaluation should be done by the designer/engineer for each scenario. However
as a rough guidance, gaps of less than 60m between barrier termini should be connected into a single
run, unless a gap is required for access, in which case the end of the barriers should be terminated
using appropriate terminal designs.
7.3.3 Lateral Placement
Barriers in themselves can be hazardous to errant vehicles, it is just that the risk of injury, and severity
of injury should be less than that resulting from an impact with the hazard located behind the barrier
system. However, the lateral position of a barrier can greatly affect the outcome on an incident, either
affecting the probability of the incident occurring, or the severity of injuries resulting from an impact.
This equally applies to roadside, median and bridge barrier systems.
As a general rule, a roadside barrier should be placed as far from the travelled way as practical, while
maintaining the proper operation and performance of the system [5]. This way, a wider clear area is
provided, which would increase the chances of an errant vehicle to regain control, without hitting the
barrier. Furthermore, the designer/engineer should understand the following effects, with regards to
the lateral placement of barriers:](https://image.slidesharecdn.com/documento50-1-120-5152borrador-240214213429-246eea16/85/Documento-50-1-120-51-52-borrador-pdf-163-320.jpg)
![ROADSIDE DESIGN GUIDE
PAGE 163
07 SELECTION AND APPLICATION OF ROADSIDE, MEDIAN
AND BRIDGE BARRIERS
FIRST EDITION -DECEMBER 2016
• As the distance from the edge of the travelled way increases, the proportion of errant vehicles
which are likely to reach the distance decreases (see Chapter3, Figure 3.1). This means that,
barriers which are placed closer to the edge of the travelled way are more likely to get hit by
errant vehicles, compared to ones which are placed further away. Therefore, the barriers
which are located closer to the edge of the travelled way are likely to be impacted more
frequently than the ones located further away. This, in effect, is likely to cause higher property
damage costs for road users and higher maintenance costs for road authorities, and as a
result, increase the risk of injury to road workers during maintenance and repair;
• Barriers which are located closer to the edge of the travelled way, on average, are likely to
get hit at higher speeds than the ones located further away. This is simply because barriers
which are located further away will provide more empty space, along which the errant vehicle
can slow down, before reaching the barrier;
• Experience shows that barriers which are located closer to the edge of the travelled way are
likely to get hit at lower impact angles, whereas the barriers which are located further away
are likely to get hit at higher impact angles [1]. This is because the errant vehicles do not
always follow a straight line as they leave the road. In scenarios, where an errant vehicle
follows a curved path, the angle of impact would increase as the distance of the barrier from
the edge of the road increase. This can especially be a problem for rigid systems, such as
concrete barriers, as high impact angles, combined with the rigid nature of the system can
increase the impact severity. Therefore, consideration should be taken, when placing rigid
systems further away from the road. However, by their nature, rigid systems are more likely
to be chosen, in locations where the lack of space does not permit other systems, due to
working width requirements. Therefore, rigid barriers are likely to be located close to the edge
of the travelled way anyway;
• Barriers which are placed too close to the edge of the travelled way may cause drivers to
consider them as hazards and to shy away from barrier and drive closer to the lane on the
other side. The net effect is a reduction in traffic speed, which affects the capacity of the road.
The distance from the edge of the travelled way beyond which a roadside barrier will not be
perceived as a hazard and result in motorists reducing speed or changing vehicle position on
the roadway, which is referred to as the shy-line offset [5]. Further information on the shy-line
offset is provided in Section 7.3.4;
• There is an increased risk of sideswipe crashes if lane widths less than 3.65m are used next
to barriers. This occurs because drivers tend to move away from the barrier and may
encroach into adjoining travel lanes;
• Drivers will travel at moderate speeds close to long lengths of barrier; however, this is
generally only successful in a high-stress driving environment (e.g. tunnels and bridges)
where drivers are attentive and ready to react quickly to risks;
• Driving close to barriers increases the stress of the driving task and cannot be sustained for
long periods.](https://image.slidesharecdn.com/documento50-1-120-5152borrador-240214213429-246eea16/85/Documento-50-1-120-51-52-borrador-pdf-164-320.jpg)
![ROADSIDE DESIGN GUIDE
PAGE 164
07 SELECTION AND APPLICATION OF ROADSIDE, MEDIAN
AND BRIDGE BARRIERS
FIRST EDITION -DECEMBER 2016
In addition to operational considerations, a roadside barrier and its foundation should not [1]:
• interfere with any utilities, drainage conduits or structures; or
• impair access of personnel or machinery to any utilities, drainage conduits or installation or
structures.
The lateral position of a barrier is influenced by the [1]:
• Road cross-section (e.g. need for shoulder and/or kerb);
• Barrier-to-hazard clearance (see Section 7.3.5);
• Shy line offset (see Section 7.3.4);
• Trajectory of vehicles when crossing kerbs and slopes (see Section 7.3.6); and
• Desire to avoid nuisance damage (frequent strikes).
Depending on the local circumstances, it may be preferable to provide the same shoulder width
adjacent to barriers as is provided elsewhere along a road as this will provide the road user with a
consistent roadside geometry. However, consider the provision of a wider shoulder (e.g. 3m to 4m from
the edge of the adjacent traffic lane to the barrier) to provide space for vehicles parked on the nearside
to open their doors and/or to provide space for maintenance vehicles to stand clear of the traffic lane
[1].
In some cases, the distance between the edge of the travelled way and the hazard may be limited, in
which case, the designer must consider how the available space will be best used and what type of
barrier is most suitable for the particular situation. Where space is limited, and discretionary parking or
emergency stopping is not essential, it may be preferable to provide a reduced shoulder width in front
of the barrier, provided that the shy line principle (refer to Section 7.3.4) is given adequate
consideration [1].
When a vehicle passes over a kerb or a slope, its trajectory and/or the height of the vehicle may be
affected and this may, in turn, affect the way in which the vehicle interacts with the barrier system. For
that reason it is important to consider the effect of the kerb strike and/or slope geometry on the lateral
placement of the barrier system. Further details of these issues are considered in Sections
7.3.6 and 7.4.1.
The barrier offset should match or exceed the desirable shoulder width on the roadway for the service
life of the infrastructure element being designed. For example, for a new bridge, the projected traffic
volume for the next 50 years is of interest. It is normal practice on new bridge designs to provide
sufficient width such that widening would not be required in the 25 to 30 years following construction
[6]. As long as the barrier is located beyond the perceived shoulder of a roadway, it will have minimum
impact on driver speed or lane position [5].
7.3.4 Shy line offset
When roadside features such as bridge railings, parapets, retaining walls, fences or roadside barriers
are located too close to traffic, drivers in the adjacent traffic lane tend to reduce speed, drive off-centre
in the lane, or move into another lane. The distance from the edge of the travelled way beyond which
a roadside object will not be perceived as a hazard and results in motorists](https://image.slidesharecdn.com/documento50-1-120-5152borrador-240214213429-246eea16/85/Documento-50-1-120-51-52-borrador-pdf-165-320.jpg)
![ROADSIDE DESIGN GUIDE
PAGE 165
07 SELECTION AND APPLICATION OF ROADSIDE, MEDIAN
AND BRIDGE BARRIERS
FIRST EDITION -DECEMBER 2016
reducing speed or changing vehicle position on the roadway is referred to as the shy-line offset [5].
Table 7.4 provides suggested shy line offsets based on design speed.
Where possible, barriers should be located outside of the shy-line, particularly where relatively short
lengths of barrier are used. For long, continuous runs of barriers, this offset distance is not as critical,
especially if the barrier is first introduced beyond the shy-line and gradually transitioned toward the
roadway [1].
However, there is also some evidence available that the presence of a safety barrier may influence the
operating speed of traffic. Research has shown that the mean traffic speed on sections of road with
median road safety barriers is higher than similar sections of road without median road safety barriers.
Experience in Sweden is that traffic speeds increased on a narrow road after construction of a median
wire rope road safety barrier [1].
Shy-line offset distance is seldom a controlling criterion for barrier placement. It will have minimum
impact on driver’s speed or lane position as long as the barrier is located beyond the perceived
shoulder of a roadway. However, the shy-line offset should not be used to determine the shoulder
width. Where a roadside barrier is needed to shield an isolated condition, adherence to the uniform
clearance criteria is not critical; however, barrier deflection distance (7.3.5) needs to be considered. It
is more important in these cases that the barrier is located as far from the travelled way as practical.
Table 7.4 - Suggested shy-line offset
Design speed (km/h) Shy line offset (m)
140 3.8
130 3.7
120 3.2
110 2.8
100 2.4
90 2.2
80 2.0
70 1.7
60 1.4
50 1.1
Source: Adapted from AASHTO Roadside Design Guide [5]
7.3.5 Barrier deflection distance
When a vehicle strikes a roadside barrier, the dynamic deflection of a barrier varies according to the
characteristics of the impacting vehicle, impact speed, angle of impact and the characteristics of the
barrier system. Sufficient lateral clearance should be provided between the barrier and a hazard to
accommodate the appropriate dynamic deflection [1]. Further information regarding the determination
of the deflection distance for barrier systems during impact testing at NCHRP350 and MASH can be
found in Sections 6.3.3.2 and 7.2.2. The designer needs to consider the distance a barrier will deflect
upon impact as a critical factor in the selection and lateral placement of barrier, in particular if the
obstruction being shielded is a rigid object.](https://image.slidesharecdn.com/documento50-1-120-5152borrador-240214213429-246eea16/85/Documento-50-1-120-51-52-borrador-pdf-166-320.jpg)
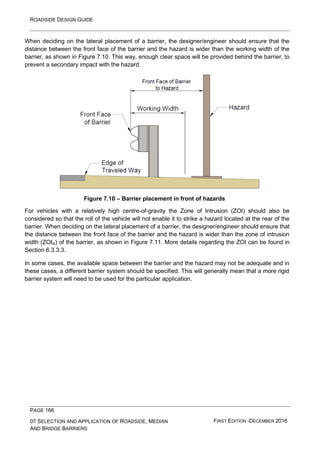
![ROADSIDE DESIGN GUIDE
PAGE 167
07 SELECTION AND APPLICATION OF ROADSIDE, MEDIAN
AND BRIDGE BARRIERS
FIRST EDITION -DECEMBER 2016
Figure 7.11 – Consideration of ZOI in barrier placement
When used in front of embankments, sufficient space should be provided between the back of posts
and the embankment, as shown in Figure 7.12. This is done to ensure that adequate soil support is
provided behind the posts to obtain proper operational characteristics of the barrier.
Figure 7.12 - Barrier placement in front of embankments
Limited test results indicate that the offset distance for embankments is not as critical as it is for rigid
objects. A 600mm distance is desirable for adequate post support, but this may vary depending on the
slope of the embankment, soil type, expected impact conditions, post cross section and embedment,
and the type of barrier system. Increasing the embedment length of barrier posts by 300mm or more
can compensate for the reduced soil foundation support near the slope break point [5], as too can the
use of posts with soil plates’ located at the bottom of the posts to increase the area of interaction
between the post and the supporting ground. However, the](https://image.slidesharecdn.com/documento50-1-120-5152borrador-240214213429-246eea16/85/Documento-50-1-120-51-52-borrador-pdf-168-320.jpg)
![ROADSIDE DESIGN GUIDE
PAGE 168
07 SELECTION AND APPLICATION OF ROADSIDE, MEDIAN
AND BRIDGE BARRIERS
FIRST EDITION -DECEMBER 2016
designer/engineer should not carry out any modifications to impact tested systems without consulting
the manufacturer and the highways authority.
Figure 7.13 - Different generic post types (from left to right: standard post, long post,
standard post with pressure plate, longer post with pressure plate)
7.3.6 Lateral Placement of Barriers behind Kerbs
Kerbing has been shown to be a major contributor to the vaulting and destabilization of impacting errant
vehicles, particularly at high speeds and with higher kerbs. When the tyres of an errant vehicle strike
a kerb, the impact tends to bounce the vehicle upwards, which can contribute to vaulting or penetration
of the rail. This effect contributes to destabilization. When the destabilizing or vertical bounce effects
act in combination with either the destabilizing effects of striking a rigid barrier or the large deflection
of a flexible barrier system, unsatisfactory results may occur and the barrier may be breached, and the
vehicle not contained.
When a vehicle strikes a kerb, the resulting trajectory of the impacting vehicle depends upon several
variables:
• Size, weight and suspension characteristics of the vehicle;
• Size of the impacting vehicle’s tyres;
• The impacting vehicle’s impact speed and angle; and
• The height, shape and the overall installation of the kerb itself.
Barrier/kerb combinations should be discouraged on high speed roads. At those locations where a kerb
might be considered an appropriate solution (e.g. for drainage or delineation), alternative treatments
should be considered when a roadside barrier system is to be installed. In particular, where a rigid
barrier is used, a kerb will impart a vertical force to the vehicle, the dynamic effect of which could
adversely affect the performance of the barrier [7].
Where there are no feasible alternatives, the designer should consider using a 100mm or less sloping
kerb and/or consider stiffening the barrier to reduce the potential deflection. Kerbs with a lower height
are preferred in all cases, and again, if the kerb can be removed, this is the most preferable action.
Ground Level
60
0m
m
900m
m
Soil Plate](https://image.slidesharecdn.com/documento50-1-120-5152borrador-240214213429-246eea16/85/Documento-50-1-120-51-52-borrador-pdf-169-320.jpg)
![ROADSIDE DESIGN GUIDE
PAGE 169
07 SELECTION AND APPLICATION OF ROADSIDE, MEDIAN
AND BRIDGE BARRIERS
FIRST EDITION -DECEMBER 2016
On lower-speed facilities (i.e. less than 70km/h), a vaulting potential still exists, but the risk of such an
occurrence is lessened [5]. Engineering judgement should be applied on a case-by-case basis for each
situation considering the anticipated speeds and consequences of vehicular penetration.
7.3.6.1 Recommended Installation Procedures for Semi-Rigid W-Beam
Barriers In-line with a Kerb
When using a semi rigid barrier in combination of a sloping-face kerb, the ideal way of installation is to
have the front face of the barrier flush with the front face of the kerb. The recommended types of kerbs
to be used in these types of installations differ according to the design speed of the road. These are
shown in Figure 7.14 and explained further below. Note that the height of the barrier must be measured
from the pavement surface and should be in accordance with the manufacturer’s installation
instructions for the product.
• Design Speed < 80km/h: A semi-rigid w-beam barrier can be used with any combination of
a sloping-faced kerb that is 150mm or shorter if installed in-line with the front (traffic) face of
the barrier for design speeds up to80 km/h;
• Design Speed 80 to 100km/h: For design speeds above 80 to 100km/h, a 100mm or shorter
sloping kerb is recommended for installations where the face of the kerb is flush with the face
of the barrier;
• Design Speed > 100km/h: For design speeds greater than 100 km/h, the sloping kerb face
should be 1V:3H or flatter and no higher than 100mm although the use of kerbs on roads
with a design speed of 100km/h or greater is discouraged.
Figure 7.14 – Placement of w-beam barriers in-line with kerbs
7.3.6.2 Recommended Installation Procedures for Semi-Rigid W-Beam
Barriers - Set-back from a Kerb
When using a semi rigid barrier in combination of a sloping-face kerb, the ideal way of installation is to
have the front face of the barrier flush with the front face of the kerb (as explained in Section 7.3.6.1).
However, it may not always be possible to install the barrier in-line with the front face of the kerb. In
such cases the barrier may be installed at a set-back, which provides enough space for the suspension
and bumper of the errant vehicle to come back to their normal pre-departure](https://image.slidesharecdn.com/documento50-1-120-5152borrador-240214213429-246eea16/85/Documento-50-1-120-51-52-borrador-pdf-170-320.jpg)
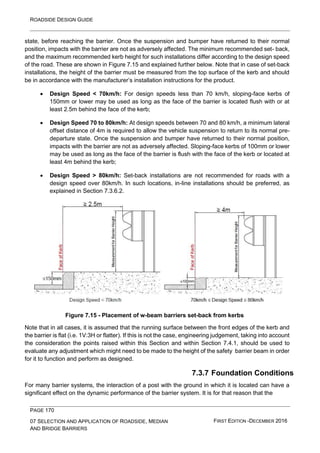
![ROADSIDE DESIGN GUIDE
PAGE 171
07 SELECTION AND APPLICATION OF ROADSIDE, MEDIAN
AND BRIDGE BARRIERS
FIRST EDITION -DECEMBER 2016
performance of the barrier in the ground into which it is to be installed should be understood. This may
not necessarily mean that the barrier will be tested within the soil (although this is preferable), but in
some cases it will be possible for manufacturers and promoters to demonstrate the change in
performance (if any) due to the installation in different ground. The testing requirements within
NCHRP350 and MASH provide details on the different types of soils into which guardrails for testing
could be installed, and on the requirements for the associated compaction of the soil [3], [7].
For proprietary systems, the effect of different ground conditions and the ways in which different ground
conditions can be dealt with will be contained within the manufacturer’s installation manual. On the Abu
Dhabi Department of Municipal Affairs and Transport road network, all soil should be compacted or
stabilised such that there is additional foundation support provided by the soil surrounding the posts.
Whilst not applying in all cases, in general terms many systems (particularly flexible systems) work by
the post to rail connections breaking on impact (as designed), and the impacting vehicle travelling over
the resulting line of posts, bending them to ground level as the vehicle passes over them. At this time,
the beam of the barrier system is maintained at a constant height by the posts in front of, and behind,
the impacting vehicle. Therefore, in order for the system to perform as designed, the ability of the
ground to withstand the impact forces (applied through the post) and for the ground to not move during
the event, is critical to the performance of the barrier system. There are two ways in which this can be
achieved:
1. Regulate the material into which the post of the barrier is located on the roadside so that it
mirrors that into which the barrier was installed during full scale testing; and
2. Understand the ability of the ground to withstand the impact forces.
The first way, i.e. recreating the ground conditions as it was tested, is generally considered an
unrealistic solution. This is due to two reasons. The first one is the difficulty of recreating the same
ground conditions in different places, due to the differing local conditions and the effects of compaction,
ground water table, humidity, etc. The second reason is the high costs involved. Instead, it is
recommended to measure the quasi-static properties of the soil and to ensure that these meet
minimum values. This is the technique often employed within the installation manual for proprietary
systems.
The design of the test procedure for ground conditions has been in use within the UK for many years,
and is detailed within the British Standard BS7669-3 [8]. An alternative testing method (involving an
instrumented post and a trolley can be found in Annex B of MASH [7], however, this test method is
tailored for test house use, and not for use on the roadside. The UK test method is commonly known
as the ‘push/pull’ test, and requires and incremental load to be applied to the top of a post (not
connected to the beam of a barrier at the time of testing). This incremental load can either be applied
through pushing or pulling the top of the post, as shown in Figure 7.16.
The process for undertaking the push post testing (which is the most commonly used of the two
methods) is explained in BS7669-3: Vehicle Restraint Systems - Part 3: Guide to the Installation,
Inspection and Repair of Safety Fences [8]:](https://image.slidesharecdn.com/documento50-1-120-5152borrador-240214213429-246eea16/85/Documento-50-1-120-51-52-borrador-pdf-172-320.jpg)
![ROADSIDE DESIGN GUIDE
PAGE 172
07 SELECTION AND APPLICATION OF ROADSIDE, MEDIAN
AND BRIDGE BARRIERS
FIRST EDITION -DECEMBER 2016
Figure 7.16 - Push testing of a driven (left) [9] and a surface mounted (right) post
7.3.8 Common Installation, Maintenance and Inspection Issues
Whilst every attempt is made to install, maintain and inspect the barrier systems on the Abu Dhabi road
Network in accordance with best practice, a number of common issues with regard to the way in which
barrier systems had been installed prevail. The following sections outline these issues, and offer
solutions for ways in which these issues can be avoided in the future.
7.3.8.1 Problems with Lap Joints in W-Beams
For W-beam barriers, the way in which adjacent rails are lapped is of extreme importance. Beams
which are lapped incorrectly are known to fail at the joints on impact, subsequently impaling impacting
vehicles and greatly increasing the risk of severe injuries to the vehicle occupants. An example of an
incorrect lap-joint barrier beam overlap is shown in Figure 7.17. In all cases, the lap of the barrier
should be such that, in the direction of traffic, the end of the first barrier encountered is located in front
of the approach end of the second barrier encountered, as shown in the right hand picture in Figure
7.17.
Figure 7.17 - The lap of adjoining w-beam rails](https://image.slidesharecdn.com/documento50-1-120-5152borrador-240214213429-246eea16/85/Documento-50-1-120-51-52-borrador-pdf-173-320.jpg)
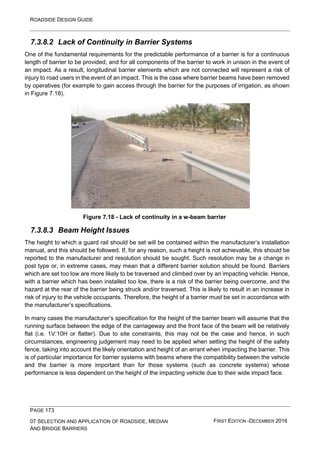
![ROADSIDE DESIGN GUIDE
PAGE 174
07 SELECTION AND APPLICATION OF ROADSIDE, MEDIAN
AND BRIDGE BARRIERS
FIRST EDITION -DECEMBER 2016
7.3.8.4 Foundation and Compaction Related Issues
The installation of barrier systems, particularly for semi-rigid systems, the posts of safety barrier
systems may be provided with an integral concrete foundation, as shown in Figure 7.19.
Reinforced concrete strip footings that have been structurally designed are acceptable to support
barrier systems where the relevant road authority has accepted a base plated post version. When
placed in concrete strips, the posts should be able to deflect laterally during an impact.
Figure 7.19 - Steel posts supplied with integrated concrete foundations
To ensure appropriate performance of the concrete foundations and the post and rail systems ground
conditions must be compacted properly to ensure the foundations do not become extracted from the
ground upon vehicle impact as shown in Figure 7.20. For w-beam barriers, a potential improvement to
the soft soil conditions is to install the system with 2100mm trie-beam posts instead of the standard
1800mm posts [1].
Figure 7.20 - Effect of uncompacted soil on a barrier impact](https://image.slidesharecdn.com/documento50-1-120-5152borrador-240214213429-246eea16/85/Documento-50-1-120-51-52-borrador-pdf-175-320.jpg)
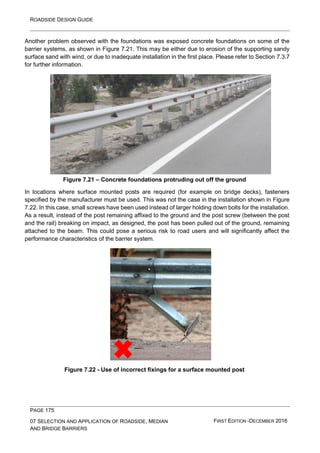
![ROADSIDE DESIGN GUIDE
PAGE 176
07 SELECTION AND APPLICATION OF ROADSIDE, MEDIAN
AND BRIDGE BARRIERS
FIRST EDITION -DECEMBER 2016
7.4 Additional Application Criteria for Roadside Barriers
7.4.1 Placement on slopes
Terrain conditions between the travelled way and the barrier can have significant effects on the barrier’s
impact performance. Generally, acceptable impact conditions at the moment of impact occur when all
of the wheels of the vehicle are on the ground and its suspension system is neither compressed nor
extended. Such is the vehicle’s orientation and stability at the time of impact during the testing to
NCHRP350 and MASH – testing under which the performance characteristics of the barrier systems
are determined.
Similar to crashes involving kerbing, a wide range of factors will influence the behaviour and trajectory
of errant vehicles as they traverse slopes (e.g. suspension stiffness, vehicle weight, speed of impact,
angle of impact). Consequently, there is uncertainty about where to position barriers so that [7]:
• The vehicle does not vault over the barrier; or
• The vehicle does not go under the barrier with consequent snagging on the barrier supports
and other problems.
Figure 7.23 illustrates the bumper trajectory as a car leaves the travelled way and crosses the shoulder
and the embankment. The primary area of concern is the zone where the bumper height is likely to be
above that of normal bumper height. A barrier placed in this zone can be expected to be struck at a
point higher than had it been installed on a level surface and, unless it has been designed for such
impacts, its performance may be inadequate, and the barrier may fail to successfully contain and/or
redirect an errant vehicle.
Figure 7.23 also illustrates parameters (∆HS, ∆HM, ∆H2, LM, and L) for determining bumper heights.
Values ∆HS and ∆H2 are important because most roadside barriers are placed between the edge of
the shoulder and 0.6m off the shoulder.
Table 7.5 contains trajectory data for rounded embankments for 100km/h encroachments at angles of
25 and 15 degrees. These numbers were obtained primarily from computer simulation [5].
Figure 7.24 shows an example application of Table 7.5, to determine the areas to avoid on a 1V:6H
slope for barrier installation. In general, barrier installations on 1V:6H slopes are not recommended.
Slopes in front of a barrier should be 1V:10H or flatter [10]. This also applies to the areas in front of the
flared section of barrier and to the area approaching the terminal ends, as shown in Figure B.5 in
Appendix B.
A rounded slope configuration will reduce the risk of an errant vehicle becoming airborne and affords
the driver more control over the vehicle. Typically 1.2m to 1.8m is used for slope rounding and this can
generally be obtained as part of the slope grading and vegetation establishment.
The type of barrier is also important as the performance of those systems with a very open profile (such
as wire rope and steel post and rail systems) is likely to be more affected by the height of an impacting
vehicle than for closed profile systems (such as concrete barriers). In these cases the area of
compatibility between vehicle and barrier is much increased and therefore closed systems may be
more preferable in locations where they are installed in a slope location.](https://image.slidesharecdn.com/documento50-1-120-5152borrador-240214213429-246eea16/85/Documento-50-1-120-51-52-borrador-pdf-177-320.jpg)
![ROADSIDE DESIGN GUIDE
PAGE 177
07 SELECTION AND APPLICATION OF ROADSIDE, MEDIAN
AND BRIDGE BARRIERS
FIRST EDITION -DECEMBER 2016
Figure 7.23 - Design parameters for vehicle encroachments on slopes [5]
Figure 7.24 – Barrier placement considerations on 1V:6H embankments Table 7.5 -
Example bumper trajectory data
Encroachment
Angle
(degrees)
Embankment
Slope (V:H)
L (m) ∆HS (mm) ∆H2 (mm)
∆HM
(mm)
Lm (m)
25 1V:6H 9.1 102 122 175 6.1
25 1V:4H 10.7 102 122 200 7.0
25 1V:3H 12.2 102 122 200 7.0
25 1V:2H 12.2 102 122 200 7.0
15 1V:6H 7.0 48 71 114 4.9
15 1V:4H 7.9 48 71 175 5.5
15 1V:3H 8.5 48 71 210 6.1
15 1V:2H 10.1 48 71 244 7.6](https://image.slidesharecdn.com/documento50-1-120-5152borrador-240214213429-246eea16/85/Documento-50-1-120-51-52-borrador-pdf-178-320.jpg)
![ROADSIDE DESIGN GUIDE
PAGE 178
07 SELECTION AND APPLICATION OF ROADSIDE, MEDIAN
AND BRIDGE BARRIERS
FIRST EDITION -DECEMBER 2016
7.4.2 Rate of Flare
Motorists are less likely to perceive roadside barriers to be a hazard if the barrier is introduced gradually
to the roadside environment through the use of a “flare”, i.e. the line of the barrier at the beginning of
the terminal is set back a distance from the travelled way and is then gradually brought closer to the
line of the travelled way. Consequently, some end terminals are designed to be flared away from the
approaching traffic. The flare rate is the ratio of the length of the flared part of the barrier (measured
parallel to the road) to the barrier offset [1].
Using a flared barrier in advance of a roadside hazard may be advantageous. A barrier may be flared
to:
• Locate the barrier terminal farther from the travelled way;
• Minimize a driver’s reaction to an obstacle near the roadway by gradually introducing a
parallel barrier installation;
• Transition a roadside barrier closer to the roadway because of an obstacle; or
• To reduce the total length of barrier need.
Also following should be considered:
• A flared barrier results in increased impact angles with the potential for greater severity of
impact;
• A flared barrier increases the likelihood that the vehicle will be redirected into the opposing
lane of traffic or across the roadway;
• The grading required to provide 1V:10H or flatter slopes in front of the flared section of
barrier may interfere with roadside drainage and/or may require additional right of way.
The flare rate is typically expressed as a ratio (a:b), as shown in Figure 7.25. For example, a flare rate
of 19:1 means that for every one metre travelled rearwards from the edge of the carriageway (b), the
line of the barrier should be such that 19 metres are travelled along the carriageway (a).
As indicated, one disadvantage is that a flare will increase the vehicular angle of impact, although some
w-beam barriers have been successfully crash tested with flare rates as high as 1:7 [5]. It will also
increase the amount of earthwork needed to provide 1V:10H slopes in front of the barrier and
approaching the terminal. When choosing how much to flare the barrier, the designer will need to strike
a balance between the length of the barrier and how far the installation projects toward the ditch and
the corresponding need for flattening the approach slopes.](https://image.slidesharecdn.com/documento50-1-120-5152borrador-240214213429-246eea16/85/Documento-50-1-120-51-52-borrador-pdf-179-320.jpg)
![ROADSIDE DESIGN GUIDE
PAGE 179
07 SELECTION AND APPLICATION OF ROADSIDE, MEDIAN
AND BRIDGE BARRIERS
FIRST EDITION -DECEMBER 2016
Figure 7.25 – Flare rate layout
Table 7.6 presents suggested flare rates for roadside barriers based on design speed and barrier type.
It should be noted that the flare rate values required for rigid and semi-rigid barrier installations within
the shy-line, yield smaller flare angles, compared to situations where they are located outside the shy-
line. It should also be noted that for proprietary systems, the manufacturer should provide details of
the recommended flare rate for their system within their accompanying installation manual.
Flatter flare rates (i.e. those with a lesser gradient) may be used, particularly where extensive grading
of the existing ground surface would be required to obtain a flat approach to the barrier from the
travelled way. Note that the recommended flare rate for barriers within the shy-line is approximately
twice that for barriers located outside the shy-line distance [5]. This is more applicable where the
approach roadway is wider than the roadway near the obstacle and has an offset less than the
suggested shy-line offset. For example, if an approach roadway is wider then a bridge roadway, the
designer should use flatter flare rates based on inside the recommended shy- line values.
Another disadvantage to flaring a barrier installation is the increased likelihood that a vehicle will be
redirected back into or across the roadway following an impact. This situation is especially undesirable
on single carriageways where the impacting vehicle could be redirected into oncoming traffic.](https://image.slidesharecdn.com/documento50-1-120-5152borrador-240214213429-246eea16/85/Documento-50-1-120-51-52-borrador-pdf-180-320.jpg)
![ROADSIDE DESIGN GUIDE
PAGE 180
07 SELECTION AND APPLICATION OF ROADSIDE, MEDIAN
AND BRIDGE BARRIERS
FIRST EDITION -DECEMBER 2016
Table 7.6 - Suggested flare rates for barrier design
Design
speed
(km/h)
Flare rate for
barrier
inside shy line (a:b)
Shy-line
Offset
Flare rate for barrier at or beyond
shy line
Rigid
(a:b)
Semi-rigid
(a:b)
Flexible
(a:b)
140 38:1 3.8 26:1 21:1 50:1
130 35:1 3.7 24:1 19:1 50:1
120 32:1 3.2 22:1 17:1 50:1
110 30:1 2.8 20:1 15:1 50:1
100 26:1 2.4 18:1 14:1 50:1
90 24:1 2.2 16:1 12:1 50:1
80 21:1 2.0 14:1 11:1 50:1
70 18:1 1.7 12:1 10:1 50:1
60 16:1 1.4 10:1 8:1 50:1
50 13:1 1.1 8:1 7:1 50:1
Source: Adapted from AASHTO Roadside Design Guide [5].
7.4.3 Short Radius Barriers at Intersections
A side road or entrance within the length of need of a barrier installation poses a severe challenge to
the design of a safe roadside. This is especially true if the intersection is located close to a bridge.
Figure 7.26 demonstrates these difficulties through three example scenarios. Scenario a) shows a
standard barrier installation which can be used to shield motorists from hazards such as rigid roadside
furniture, a river, road, railway or the end of a rigid bridge barrier. In this scenario a minimum length of
barrier is required both to stop errant vehicles reaching the hazards (see Section 7.3.1) and due to the
minimum length of installation required for the barrier to work as intended (see Table 7.2).
Scenario b) introduces a side road connection within close proximity to the bridge. The close proximity
of the side road does not allow enough space for the minimum length of installation required. In such
a scenario, the only hazards located in the vicinity of the intersection can be rigid roadside furniture.
Intersection corners often have hazardous roadside furniture installed, such as traffic signs, signals,
electrical cabinets, utility poles, etc. These hazards, should either be removed, relocated or made
passively safe (see Chapter 2), if possible. This way the need for the barrier could completely be
eliminated.
However, in scenarios where the intersection is located close to a bridge, which is located over a higher
risk hazard such as a river, railway or another road, it may not be possible to eliminate the need for a
barrier. This is because, as shown in Scenario c), even if the ends of the rigid barriers](https://image.slidesharecdn.com/documento50-1-120-5152borrador-240214213429-246eea16/85/Documento-50-1-120-51-52-borrador-pdf-181-320.jpg)
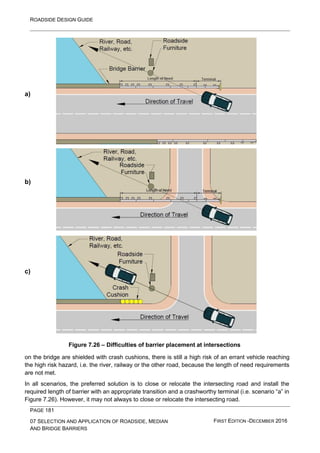
![ROADSIDE DESIGN GUIDE
PAGE 182
07 SELECTION AND APPLICATION OF ROADSIDE, MEDIAN
AND BRIDGE BARRIERS
FIRST EDITION -DECEMBER 2016
In such cases, a short radius barrier installation may be considered, as shown in Figure 7.27. The
difficulty with the short radius barrier installations is the potential of high angle impacts, which is likely
to cause high severity outcomes for regular rigid and semi-rigid systems; whereas flexible systems are
unsuitable for such small radii. A vehicle impacting the radius at a high angle and speed may penetrate
the barrier, or vault over the barrier after the posts lean back, creating a ramping effect. Where
penetration or vaulting does not occur, the vehicle may be decelerated at an excessive rate. However,
there are some short radius barrier systems, which are specifically designed and successfully crash
tested for these situations. Examples of these systems are shown in Figure 7.28 and Figure 7.29. The
principle of these systems is to provide acceptable rate of deceleration for vehicles impacting at high
angles. This is achieved by:
• The use of break-away (may be wooden) posts at 2.0m spacing;
• Omitting blockouts;
• Not providing washers on the mushroom-headed bolts connecting the rail to blockouts. [1]
When using short radius barriers, it should be remembered that they should only be used if the
alternative of removing the side road is not applicable. When they are the only choice, the use of a
short radius barrier system will impose constraints on how close it can be installed to a bridge, what
radius can be used, and how far it must run along the intersecting side road. When terminating the
radius barrier system, the barrier on the intersecting roadway should be completed to any required
length of need and terminated with an appropriate end treatment.
Figure 7.27 – Possible solution to barrier placement at intersections](https://image.slidesharecdn.com/documento50-1-120-5152borrador-240214213429-246eea16/85/Documento-50-1-120-51-52-borrador-pdf-183-320.jpg)
![ROADSIDE DESIGN GUIDE
PAGE 183
07 SELECTION AND APPLICATION OF ROADSIDE, MEDIAN
AND BRIDGE BARRIERS
FIRST EDITION -DECEMBER 2016
Source: Adapted from Austroads Guide to Road Design [1]
Figure 7.28 - Short radius barrier at intersection (2.5 m to 10 m radius)
5. Remove blockouts](https://image.slidesharecdn.com/documento50-1-120-5152borrador-240214213429-246eea16/85/Documento-50-1-120-51-52-borrador-pdf-184-320.jpg)
![ROADSIDE DESIGN GUIDE
PAGE 184
07 SELECTION AND APPLICATION OF ROADSIDE, MEDIAN
AND BRIDGE BARRIERS
FIRST EDITION -DECEMBER 2016
Source: Adapted from Austroads Guide to Road Design [1]
Figure 7.29 - Short radius barrier at intersection ( to 10 m radius)
7.4.4 Sight Distance
Concrete barriers and, to a lesser extent, w-beam barriers can obstruct visibility. Barriers located close
to intersections can impede the safe intersection sight distance and minimum gap sight distance
available to drivers attempting to select a safe gap in traffic on the major road. This issue applies to
barriers located on the verge and barriers located in medians [3]. Where barriers are needed on the
inside of curves, the horizontal sight distance should be checked in accordance with the criteria for
stopping sight distance. The designer should check to determine if barrier conflicts exist on a given
curve and should carefully weigh the alternatives before selecting the barrier configuration.](https://image.slidesharecdn.com/documento50-1-120-5152borrador-240214213429-246eea16/85/Documento-50-1-120-51-52-borrador-pdf-185-320.jpg)
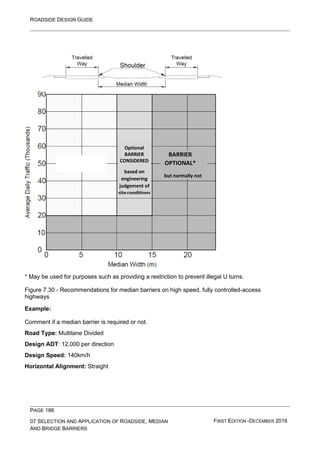
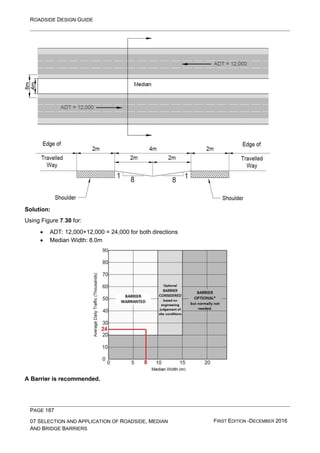
![ROADSIDE DESIGN GUIDE
PAGE 188
07 SELECTION AND APPLICATION OF ROADSIDE, MEDIAN
AND BRIDGE BARRIERS
FIRST EDITION -DECEMBER 2016
7.5.2 Terrain Effects on the Lateral Placement of Median Barriers
As detailed within Section 7.4.1, barriers perform best when an impacting vehicle has all of its wheels
on the ground at the time of impact, and its suspension system is neither compressed nor extended,
i.e. the vehicle is in a stable condition. This is the way in which barrier systems are tested and hence,
their performance (under defined impact conditions) is known. Therefore, the effect of terrain is a major
factor to consider when locating a median barrier. As a result, consideration should be given to the
following aspects when determining the placement of such barriers, and engineering judgement should
be applied in all cases:
• The most desirable median is one that is relatively flat (i.e. slopes of 1V:10H or flatter) and
free of objects. The median barrier then can be placed at the centre of the median. Placement
guidelines are necessary when these conditions cannot be met. However, a rigid barrier
should not be used in the middle of wide medians (i.e. greater than 3.0 m to 4.0 m from the
edge of the traffic lane) because of the likelihood of higher impact angles and resultant higher
severity of impacts [1]. A flexible barrier located on both sides of the median has the
advantage that it maximises the opportunity to contain deflections within the median.
However, a central location has the advantages in that [1]:
o Debris from damaged barriers is less likely to encroach into the carriageway;
o Sight distance past the barrier on curves is maximised;
o The barrier sustains less nuisance impacts than a barrier on the side of the median;
and
o The cost is less than a barrier on both sides of a median.
• Features within the median between the travelled way and the barrier can have a significant
effect on the barrier’s impact performance. Kerbs and sloped medians (including super-
elevated sections) are two prominent features that deserve attention. Refer to Section 7.3.6
for further guidance regarding the use of barriers in conjunction with kerbs. Uncompacted
ground conditions and drainage swales can impart a roll moment on a traversing vehicle, and
the slopes in the median can affect the performance of the barrier as the vehicle suspension
is compressed. A vehicle that traverses one of these features prior to impact may go over or
under the barrier or snag on the support posts of a strong- post system.
• Figure 7.31 illustrates the basic median sections for which placement guidelines are
presented:
o Depressed medians or medians with a ditch section (Median Section I);
o Stepped medians or medians that separate travelled ways with significant
differences in elevation (Median Section II); and
o Median embankments (Median Section III).
7.5.2.1Depressed medians or medians with a ditch section (Median
Section I)
Firstly the slope and the ditch sections should be examined in line with the recommendations within
Chapter 3 to determine if a roadside barrier is warranted (if the slopes and ditches cannot be](https://image.slidesharecdn.com/documento50-1-120-5152borrador-240214213429-246eea16/85/Documento-50-1-120-51-52-borrador-pdf-189-320.jpg)
![ROADSIDE DESIGN GUIDE
PAGE 189
07 SELECTION AND APPLICATION OF ROADSIDE, MEDIAN
AND BRIDGE BARRIERS
FIRST EDITION -DECEMBER 2016
made traversable). In such cases that a barrier is warranted the barrier should be located as indicated
below, with reference to Figure 7.31:
Figure 7.31 - Recommended barrier placement in non-level medians [5]](https://image.slidesharecdn.com/documento50-1-120-5152borrador-240214213429-246eea16/85/Documento-50-1-120-51-52-borrador-pdf-190-320.jpg)
![ROADSIDE DESIGN GUIDE
PAGE 190
07 SELECTION AND APPLICATION OF ROADSIDE, MEDIAN
AND BRIDGE BARRIERS
FIRST EDITION -DECEMBER 2016
Illustration 1: A roadside barrier should be placed near the shoulder on each side of the median (as
shown at locations “b” and “d”), if both slopes require shielding (i.e. the ditch is non- traversable). A
median barrier should be placed at “b,” if only one slope requires shielding (e.g. S2). In this situation, a
rigid or semi-rigid barrier is typical.
Illustration 2: This applies where neither slope requires shielding but either one or both are steeper
than 1V:10H. In such cases the median barrier should be located on the side with the steeper slope.
This will typically be a rigid or semi-rigid system.
Illustration 3: If both slopes are relatively flat, the median barrier should be located at or near the
centre of the median (at “c”) if vehicle override is unlikely. The designer can use any type of median
barrier having an appropriate test level for the application, if its dynamic deflection is not greater than
one-half the median width. It is not generally desirable to locate the barrier in the drain at the centre of
wider medians because of the potential for debris to accumulate around the barrier and adversely
affect flow within the drain. There is also potential for the post foundations to be affected due to sodden
soil within the drain [1].
When locating a barrier in a non-level application, the manufacturer/promoter of the system should be
consulted to ascertain whether the system would be suitable for such an application.
7.5.2.2Stepped medians or medians that separate travelled ways with
significant differences in elevation (Median Section II)
For this section, the following placement criteria apply, with reference to Figure 7.31:
Illustration 4: If the embankment slope is steeper than approximately 1V:10H, the median barrier
should be located “b.”
Illustration 5: If the slope contains obstacles or consists of a rough rock cut, a roadside barrier should
be located at both “b” and “d.” This section may have a retaining wall at “d.” If so, the base of the wall
should be smooth and continuous – where possible the profile should reflect that of a successfully
tested concrete barrier system.
Illustration 6: If the cross slope is flatter than approximately 1V:10H, a barrier should be located at or
near the centre of the median.
7.5.2.3 Median embankments (Median Section III)
For this section, the following placement criteria apply, with reference to Figure 7.31:
Illustration 7: This type of median design should not be considered to be a barrier or to provide positive
protection against crossover crashes. A barrier should be installed and located at “b” and “d” if both
slopes are not traversable. If retaining walls are used at “b” and “d,” contour the base of the wall should
be smooth and continuous – where possible the profile should reflect that of a successfully tested
concrete barrier system.
If the slopes are traversable, and it is considered that a vehicle could pass over the apex of the median
(indicated by “c”), a non-rigid median barrier may be placed at the apex of the cross section. For non-
traversable slopes, a barrier should be placed adjacent to the shoulder of each carriageway. If retaining
walls are used adjacent to each carriageway, it is recommended that the base of the wall be
constructed to the external shape of the preferred standard concrete barrier [1].](https://image.slidesharecdn.com/documento50-1-120-5152borrador-240214213429-246eea16/85/Documento-50-1-120-51-52-borrador-pdf-191-320.jpg)
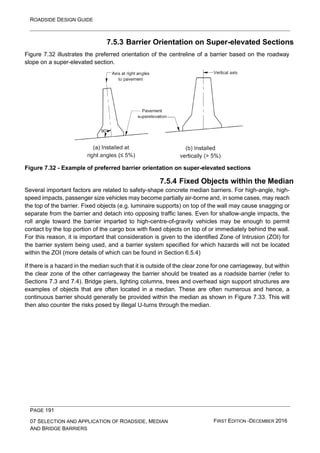
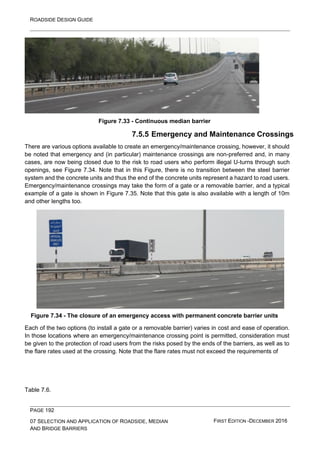
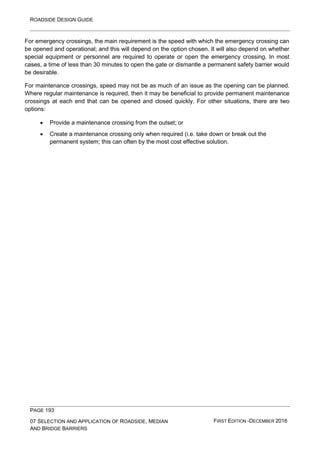
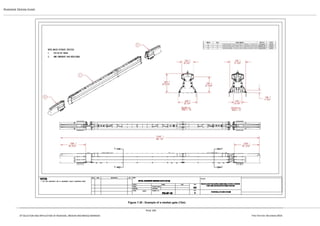
![ROADSIDE DESIGN GUIDE
PAGE 195
07 SELECTION AND APPLICATION OF ROADSIDE,
MEDIAN AND BRIDGE BARRIERS
FIRST EDITION-DECEMBER 2016
7.5.6 Glare Screens
Headlight glare may be defined as a sensation experienced when a person’s vision is interrupted by
a light source that has a much higher intensity than the surrounding area. It is frequently cited as a
major contributing factor in night time crashes that occur on unlighted highways [5]. By definition, glare
screens are most often installed on median barriers, and an example of this can be seen in Figure
7.36.
Figure 7.36 – The use of glare screens in the median
The magnitude and severity of headlight glare depends on various combinations of a wide variety of
factors, including:
• Headlight systems, which includes the headlight configuration, mounting height, and output
intensity;
• Roadway features, which include the roadway alignment, geometrics, and pavement
reflectivity;
• Transmission media, which includes the atmosphere and physical features through which
the light must pass, such as windshields and eyeglasses; and
• Human variables, which include driver’s age, visual ability, and fatigue.
Depending on the severity and effect glare has on a driver, it may be classified as discomfort or
disability glare, defined as follows:
• Discomfort glare does not necessarily impair the vision. However, it frequently causes drivers
to become tense and apprehensive, which increases the level of fatigue and may lead to
driver error. This type of glare is common and usually occurs where median or outer separator
widths are greater than approximately 10m.
• Disability glare definitively impairs a driver’s vision, frequently causing temporary blindness;
consequently, it should be addressed whenever practical. Disability glare occurs usually
where median or outer separator widths are less than approximately 10 m in width or on
horizontal curves.](https://image.slidesharecdn.com/documento50-1-120-5152borrador-240214213429-246eea16/85/Documento-50-1-120-51-52-borrador-pdf-196-320.jpg)
![ROADSIDE DESIGN GUIDE
PAGE 197
07 SELECTION AND APPLICATION OF ROADSIDE,
MEDIAN AND BRIDGE BARRIERS
FIRST EDITION-DECEMBER 2016
design cut-off angle should be increased to allow for the effect of curvature on headlight direction:
Cut-off Angle (in degrees) = 20 + 1746.8
R
where: R = radius of horizontal curve of the road, in metres;
• Glare screens may reduce the available horizontal sight distance. For curves to the left, the
designer will need to check the middle ordinate to determine if adequate stopping sight
distance will be available;
• When determining the necessary glare screen height, the designer may ignore the effect of
sag vertical curvature;
• The upper and lower elevations of the glare screen must be such that light does not shine
over or under the barrier. The height of glare screens may be established by examining the
following factors:
o Height of driver’s eye in relation to the pavement (1080 mm for passenger vehicles
and 2.3 m for large trucks);
o Height of the headlights of various size vehicles in relation to the pavement;
o Changes in elevation across the entire roadway width including the median.
• The preceding steps address the design of glare screen. However, the calculation of detailed
height requirements does not imply that the height of glare screen should vary repeatedly
from location to location along a road scheme. The height of glare screen used should
encompass the needs of the entire road scheme, or road scheme segment.
• Prior to affixing a glare screen to the top of a proprietary system, the manufacturer/promoter
should be consulted to ascertain whether the addition of the glare screen will detrimentally
affect the dynamic performance of the barrier system.
7.6 Additional Application Criteria for Bridge Barriers
Many of the general barrier application criterion identified previously in Section 7.3 can be equally
applied to bridge barrier systems. However, this Section builds upon these requirements and identifies
specific areas for consideration and modification to deal with the specific hazards and alignment
issues which may arise from locating barriers on bridges. In particular, this Section addresses the
issues of:
• Material type of bridges;
• Hardware attachments to bridges;
• Additional lateral placement considerations;
• Heights of bridge parapets;
• Fixation to bridge decks.
Bridge rails generally need to be designed to provide higher levels of containment compared to other
longitudinal barriers due to the higher risk and likely consequences of an impact on a bridge structure.
High risk situations include bridges over other roads, deep water and railways, and for high
overpasses. Bridge rails in these situations need to provide greater resistance against the possibility
of penetration or the chances that a vehicle will roll over the top of the barrier. Vehicles with greater
mass or higher centre of gravity are particularly at risk [7].](https://image.slidesharecdn.com/documento50-1-120-5152borrador-240214213429-246eea16/85/Documento-50-1-120-51-52-borrador-pdf-198-320.jpg)
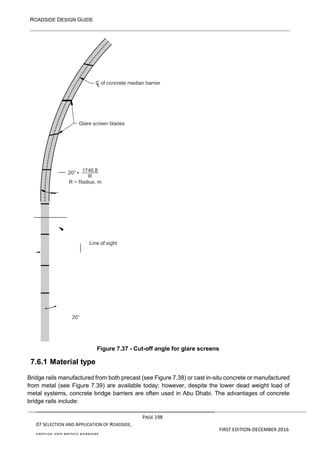

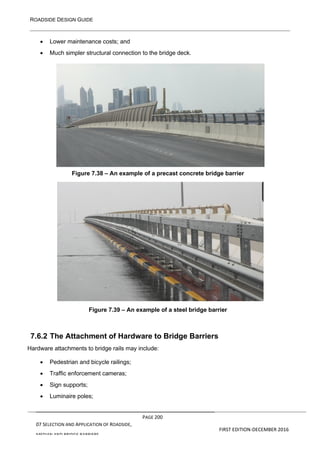
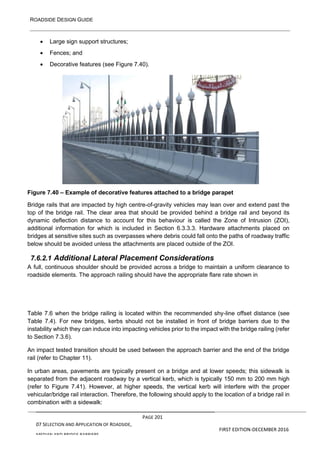
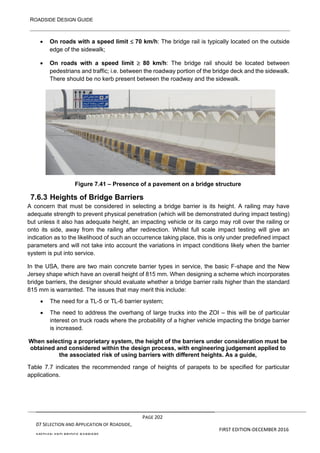
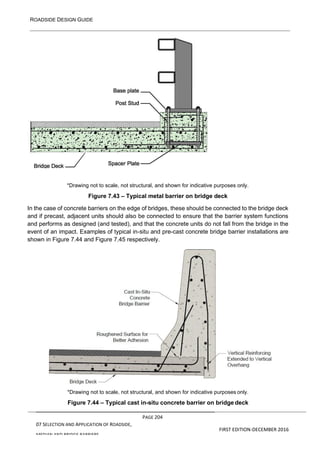
![ROADSIDE DESIGN GUIDE
PAGE 208
07 SELECTION AND APPLICATION OF ROADSIDE,
MEDIAN AND BRIDGE BARRIERS
FIRST EDITION-DECEMBER 2016
In some cases, existing bridge barriers currently installed do not meet the requirements of the testing
standards NCHRP350 or MASH. In such cases, it may not be practical, or cost effective to completely
replace the barrier system installed. Instead, it may be more appropriate to apply a retrofit solution to
the location.
Retrofit designs refer to changes, modifications, and additions to existing bridge railings that elevate
these railings to acceptable performance levels. These designs may:
• Eliminate snagging potential;
• Increase the strength of the railing;
• Provide an acceptable transition from the approach rail to the bridge rail itself;
• Provide longitudinal continuity to the system; and
• Reduce or eliminate undesirable effects of kerbs or narrow walkways in front of the bridge
rail.
A number of specific retrofit concepts that can be adapted to numerous types of obsolete designs
have been developed and tested within the USA [5]. A number of these designs are in place within
the Abu Dhabi road network and hence, these approaches may be implemented where justified.
These solutions relate to:
• Concrete retrofit (safety shape or vertical);
• W-beam/thrie-beam retrofits; and
• Metal post-and-beam retrofits.
7.7.4.1 Concrete retrofit (safety shape or vertical)
If an existing substandard bridge barrier is located on a bridge, one retrofit technique is to construct
a concrete barrier in front of the bridge barrier (if there is sufficient space). Details of this retrofit
solution are given in Figure 7.46.
This design is most effective when the existing railing can remain in place and does not require
extensive modifications. The concrete safety shape commonly used for new construction often can
be added to an existing substandard bridge railing as an economical retrofit design:
• If the structure can carry the additional dead load; and
• If the existing railing configuration can meet the anchorage and impact forces needed for the
retrofit barrier.
Although a vertical-faced retrofit can cause relatively high deceleration forces for high-angle impacts,
its addition to the top of an existing kerb creates an effective barrier. A protruding kerb that may
contribute to vehicular vaulting in shallow angle impacts should not be installed in front of the concrete
shape as this may cause considerable wheel and suspension system damage.
7.7.4.2 Continuation of Approach Roadside Barrier Beam
One potential retrofit improvement consists of rebuilding the approach roadside barrier to current
standards, providing an acceptable transition section and continuing the metal beam rail element
across the structure to provide railing continuity. Where kerbs are present on the bridge, the retrofit
railing can be blocked out to minimize the possibility of a vehicle ramping over the bridge railing.](https://image.slidesharecdn.com/documento50-1-120-5152borrador-240214213429-246eea16/85/Documento-50-1-120-51-52-borrador-pdf-209-320.jpg)
![ROADSIDE DESIGN GUIDE
PAGE 209
07 SELECTION AND APPLICATION OF ROADSIDE,
MEDIAN AND BRIDGE BARRIERS
FIRST EDITION-DECEMBER 2016
Carrying an approach roadside barrier across the structure is an inexpensive, short-term solution to
inadequate bridge railings. This treatment can be particularly effective on low-speed roadways. It can
also significantly improve the impact performance of an obsolete railing, although it may not bring an
existing bridge railing into full compliance with applicable crash test requirements. Continuous metal-
beam rails across a structure also eliminate one of the major problems of a bridge-rail/transition-rail
design - adequate anchorage to prevent the approach rail from pulling out when struck. When the
approach barrier is extended across the bridge, the only transition design elements that remain critical
are gradual stiffening and elimination of a snagging potential.
Figure 7.46 – Installation of a reinforced concrete block in front of an existing (substandard)
rail [5]
7.7.4.3 Metal post-and-beam retrofits
A metal post-and-beam retrofit railing mounted at the kerb edge may be appropriate to use on an
existing structure with a raised kerb or walkway.
The crash test specimen for the post attachment to the kerb or bridge deck can be a yielding design
that eliminates bridge deck damage in high-angle, high-speed impacts. Metal rail elements should
line up with the face of the kerb and the elements should be spaced to minimize the likelihood of
vehicle intrusion and subsequent snagging on the posts.
This design has the advantage that it separates motor vehicles from pedestrians who are using the
sidewalk on a bridge. In many cases, the existing bridge railing can be used or converted to a
pedestrian railing.](https://image.slidesharecdn.com/documento50-1-120-5152borrador-240214213429-246eea16/85/Documento-50-1-120-51-52-borrador-pdf-210-320.jpg)
![ROADSIDE DESIGN GUIDE
PAGE 213
07 SELECTION AND APPLICATION OF ROADSIDE,
MEDIAN AND BRIDGE BARRIERS
FIRST EDITION-DECEMBER 2016
7.8.5 Summary and Conclusions on Upgrades to Barriers
When planning upgrades to roadside, median and bridge barriers, the structural and functional
inadequacies should be considered in relation to the:
• Nature and extent of barrier deficiency;
• Crash history;
• The results of any retesting of the product, or similar products; and
• The cost-effectiveness of recommended improvements.
7.9 References
[1] Austroads, Guide to Road Design Part 6: Roadside Design, Safety and Barriers, Sydney,
NSW: Austroads, 2010.
[2] V. Hock, R. Lampo, S. Johnston and J. Myers, “Corrosion Mitigation and Materials Selection
Guide for Military Construction in a Severely Corrosive Environment,” US Army Corps of
Engineers, Construction Engineering Research Laboratory, 1988.
[3] NCHRP, “NCHRP Report 350, Recommended Procedures for the Safety Performance
Evaluation of Highway Features,” Transportation Research Board, National Research
Council, Washington DC, 1993.
[4] Vicroads, “The use of Wire Rope Safety Barrier (WRSB), RDN 06-02 C,” Vicroads, Victoria,
2015.
[5] AASHTO, Roadside Design Guide, 4th Edition, Washington D.C.: American Association of
State Highway and Transportation Officials, 2011.
[6] Alberta Infrastructure and Transportation, “Roadside Design Guide,” 2007.
[7] AASHTO, “Manual for Assessing Safety Hardware,” Ammerican Association of State
Highway and Transportation Officials, Washington DC, 2009.
[8] British Standards, “BS7669-3: Vehicle Restraint Systems - Part 3: Guide to the Installation,
Inspection and Repair of Safety Fences,” BSI, 1994.
[9] R. Setchell, “Eastern Daily Press,” [Online]. Available:
http://www.edp24.co.uk/polopoly_fs/1.867564!/image/1569740063.jpg_gen/derivatives/land
scape_490/1569740063.jpg. [Accessed 5 5 2016].
[10] J. W. Hutchinson, “The Significance and Nature of Vehicle Encroachments on Medians of
Divided Highways,,” in Highway Engineering Series No 8, Urbana, IL, University of Illinois,
1962.](https://image.slidesharecdn.com/documento50-1-120-5152borrador-240214213429-246eea16/85/Documento-50-1-120-51-52-borrador-pdf-214-320.jpg)
![ROADSIDE DESIGN GUIDE
PAGE 213
08 Motorcyclist Protection Systems First Edition-December 2016
8 MOTORCYCLIST PROTECTION SYSTEMS
8.1 Introduction
Motorcyclists impacting roadside barriers has been raised by motorcyclists’ groups throughout the
world, and studied in road safety research for more than a decade.
The problem is largely based on the fact that a vast majority of the vehicle restraint systems installed
along the roads today are not primarily designed with motorcyclists in mind. As such, these barriers
are not specifically designed to stop errant riders from reaching the hazards behind, and may
themselves pose a risk to motorcyclists due to exposed posts, sharp edges and corners.
Motorcycle to barrier impacts are infrequent, but high severity accidents. According to 2012 UK data,
motorcycles (2.86 fatal accidents per billion vehicle mile) were approximately 48 times more likely to
become involved in a fatal barrier accident than cars (0.06 fatal accidents per billion vehicle mile) [1].
In 2005, motorcycle crashes were found to be the leading source of fatalities in guardrail crashes in
the USA. In terms of fatalities per registered vehicle, motorcycle riders were dramatically
overrepresented in the number of fatalities resulting from guardrail impacts. Motorcycles comprised
only 2% of the vehicle fleet, but accounted for 42% of all fatalities resulting from guardrail collisions.
From 2000 to 2005, approximately one in eight motorcyclists who struck a guardrail were fatally
injured – a fatality risk over 80 times higher than for car occupants involved in a collision with a
guardrail [2].
In order to reduce risk of injury to a motorcyclist when impacting a safety barrier, a number of
Motorcyclist Protection Systems (MPS) have been developed throughout Europe. This has led to the
further development of a European Technical Specification for the testing of such devices (TS1317-
8:2012). Details of TS1317 are given in Section 8.4 of this chapter. At the time of writing of this
document, there was no standardised crash test methodology available according to the American
guidelines NCHRP-350 or MASH. The TS1317-8 is currently the only standardised way of impact
testing the MPS and therefore it is the chosen way of assessing MPS for this design guide.
However, the installation of an MPS onto an existing barrier system will result in additional cost, and
a careful evaluation has to be made in order to ensure that the use of public funding for the installation
of such systems is best utilised to achieve the highest benefit to cost ratio among many possible
alternative safety measures. Consideration is also given to the effect that the addition of the MPS may
have on the performance of the barrier when impacted by other roads users (car drivers for example).
This Chapter provides information on the types of MPS available on the market today and the
performance assessment of these through the European testing standard TS1317-8:2012.
Recommendations on the locations where these systems may be required are also presented. Finally
guidance on the selection and application of MPS is given.](https://image.slidesharecdn.com/documento50-1-120-5152borrador-240214213429-246eea16/85/Documento-50-1-120-51-52-borrador-pdf-215-320.jpg)
![ROADSIDE DESIGN GUIDE
PAGE 214
08 Motorcyclist Protection Systems First Edition-December 2016
8.2 Road Safety Barriers from Motorcyclists’ Point of View
The majority of the roadside safety barrier systems in use today are designed to bring passenger cars
and/or heavy vehicles to a controlled and safe stop. However, when struck by errant motorcyclists,
these systems may fail to provide protection, and could contribute towards serious or fatal injuries.
Research shows that there are two dominant types of motorcycle to barrier accidents [1]. In the first
type, motorcyclists hit the barrier while sliding on the ground, having fallen from their motorcycle. In
this type of accident, the impact mainly occurs with the lower section of the barrier. In the second type,
motorcyclists hit the barrier at an upright position while they are still on the motorbike. In this type of
accident, the impact mainly occurs with the upper section of the barrier.
A steel guardrail, as shown in Figure 8.1, does not provide the necessary protection for a motorcyclist,
as errant riders who are sliding on the ground, can easily go between the posts and under the rail to
reach the hazard behind the barrier. Hitting the barrier itself is not an acceptable option either, as the
exposed barrier posts constitute the leading cause of injury in motorcycle to barrier accidents [3].
Figure 8.1 – A W-beam barrier from a motorcyclist’s perspective [4]
The type of barrier post can have an important effect on the outcome of a motorcyclist-to-barrier
impact. I-beam posts, such as the IPE posts (I-beam posts manufactured according to European
standard EN10025), as shown in Figure 8.2, are known to be the most aggressive design from a
motorcyclist safety perspective, due to sharp edges and corners, which can cause significant injuries.
Sigma, Z or C profile barrier posts, as shown in Figure 8.2, are less aggressive alternatives, with no
exposed edges on the impact side. However, even these posts are not completely safe for errant
riders impacting them.
For riders who hit the barrier at an upright position, the sharp corners located at the top of the posts
also pose a significant danger. The Norwegian Public Roads Administration’s Handbook 231
[5] has identified the top of the posts as being particularly hazardous for motorcyclists if they become
dismounted from their motorcycle during an impact and fall on top of these; a view shared by Gibson
and Benetatos [6] and Duncan et al [7].](https://image.slidesharecdn.com/documento50-1-120-5152borrador-240214213429-246eea16/85/Documento-50-1-120-51-52-borrador-pdf-216-320.jpg)
![ROADSIDE DESIGN GUIDE
PAGE 215
08 Motorcyclist Protection Systems First Edition-December 2016
Figure 8.2 – Types of barrier posts from a motorcyclist’s perspective
Wire rope is another common barrier type which poses similar dangers to errant motorcyclists as the
W-beam systems do. Contrary to popular belief among motorcyclists, research shows that it is the
exposed posts which pose the biggest danger, not the wire ropes [1]. For example a study carried out
in the USA by Daniello and Gabler found that there was no significant difference in the percentage of
killed or seriously injured (KSI) for riders involved in motorcycle collisions with W- beam (40.1% KSI)
and cable barriers (40.4% KSI) [8]. Duncan et al. have stated that there is no substantial evidence to
show that wire rope barriers pose a greater risk to motorcyclists than the objects from which they are
designed to shield the road user, such as trees, posts, or oncoming traffic [7]. Duncan et al also added
that there is no evidence of the “cheese cutter effect” during injury events.
Figure 8.3 – Wire rope barrier from a motorcyclist’s perspective
Concrete barriers, unlike the steel alternatives, do not feature any sharp edges or corners which may
cause injuries to motorcyclists. Especially for low angle impacts, an errant rider can simply slide along
or over the barrier without getting caught in any sharp features. This characteristic makes concrete a
more motorcyclist friendly choice over steel; especially for median applications, where the angles of
impact are more likely to be narrow. Also, unlike steel systems, concrete barriers do not let errant
riders to pass through and reach the hazard located behind.](https://image.slidesharecdn.com/documento50-1-120-5152borrador-240214213429-246eea16/85/Documento-50-1-120-51-52-borrador-pdf-217-320.jpg)
![ROADSIDE DESIGN GUIDE
PAGE 216
08 Motorcyclist Protection Systems First Edition-December 2016
Figure 8.4 – Concrete barrier from a motorcyclist’s perspective
A study in the USA by Gabler, using 2005 Fatality Analysis Reporting System data, found that the
fatality risk in motorcycle to guardrail collisions (12.4%) is almost 1.5 times higher than the fatality risk
in a motorcycle to concrete barrier collision (7.9%) [8]. However, concrete barriers are not perfectly
motorcycle-friendly either. In 2007, the Spanish Motorcyclists Association “Association Mutua
Motera”, carried out a full-scale crash test for a “New Jersey” profile concrete barrier [9], as shown in
Figure 8.5 (see Section 8.4 for impact testing of MPS). The results of the test have shown a head
injury criteria value of more than 1.5 times the acceptable limit (Head Injury Criterion
i.e. HIC is the index representing the head injury risk and it is calculated by using the accelerations
acting on the head of the dummy, which are recorded during the test [10]). This shows that concrete
barriers, although more desirable than steel systems from a motorcyclist safety perspective, are not
as safe as dedicated motorcyclist protection systems.
Figure 8.5 – Impact test of a new jersey profile concrete barrier [9]](https://image.slidesharecdn.com/documento50-1-120-5152borrador-240214213429-246eea16/85/Documento-50-1-120-51-52-borrador-pdf-218-320.jpg)
![ROADSIDE DESIGN GUIDE
PAGE 217
08 Motorcyclist Protection Systems First Edition-December 2016
8.3 Types of Motorcyclist Protection Systems
There are currently more than thirty different MPS designs available on the market today [1] and these
can be categorized into one of three main categories: continuous MPS, discontinuous MPS and
barriers with motorcyclist protection incorporated in their design.
8.3.1 Continuous Motorcyclist Protection Systems (CMPS)
CMPS are the most common type currently being manufactured and promoted around the world. In
this type of MPS, a secondary protective element is fitted underneath the main longitudinal of the
barrier system, as shown in Figure 8.6.
Figure 8.6 – Example of a continuous MPS, Bike Guard from Highway Care Ltd. [11]
This type of system provides continuous protection of the posts, to errant motorcyclists impacting the
barrier while sliding along the ground, having fallen from their motorcycles. However, these systems
do not provide any protection from the top of the barrier and are therefore less effective for motorcycle
impacts in upright position.
CMPS available on the market today come in many different designs and materials, including metal,
as shown in Figure 8.6, plastic, as shown in Figure 8.7, and composite materials, as shown in Figure
8.8. From a performance perspective, it is not possible to say if one material is safer than the others.
The designer/engineer should asses the performance of individual systems through impact test
results (see Section 8.4), regardless of the material type. However, from a durability perspective,
some materials may be a better fit for the environmental conditions in Abu Dhabi, i.e. high
temperatures and humidity. For this reason, the designer/engineer should assess each system on a
product by product basis.
Figure 8.7 – Example of a plastic CMPS, DR46 from SNOLINE [12]](https://image.slidesharecdn.com/documento50-1-120-5152borrador-240214213429-246eea16/85/Documento-50-1-120-51-52-borrador-pdf-219-320.jpg)
![ROADSIDE DESIGN GUIDE
PAGE 218
08 Motorcyclist Protection Systems First Edition-December 2016
Figure 8.8 – Example of a composite CMPS, BASYC [13]
Installation requirements of CMPS vary from one system to another. Some CMPS are connected
directly to the barrier posts, as shown in Figure 8.7, some are connected directly on to the main beam,
as shown in Figure 8.6. Some systems are designed to be connected to the posts through simple
cable ties, as shown in Figure 8.7, while others my require special equipment for the installation, as
shown in Figure 8.8. The ease of installation, depends on the requirements of the specific system.
The designer/engineer should refer to the manufacturers specifications and installation manual to
assess the ease of installation for each indivdual system.
*Profile is not to scale and is shown for indicative purposes only.
Figure 8.9 – Example of a typical CMPS profile
Most CMPS are designed to be installed on to more than one type of barrier system. For example, it
is possible to install the Bike Guard and the DR-46 systems, as shown in Figure 8.6 and Figure
8.7 respectively, on to various types of guardrail, including w-beam and open box beam systems.
However, the added MPS may cause a difference in the impact performance of the barrier, on to
which it is attached. For this reason, the MPS and the barrier should be tested together, according to
MASH or NCHRP-350, to prove the acceptable performance of a specific combination (see Section
8.4).](https://image.slidesharecdn.com/documento50-1-120-5152borrador-240214213429-246eea16/85/Documento-50-1-120-51-52-borrador-pdf-220-320.jpg)
![ROADSIDE DESIGN GUIDE
PAGE 219
08 Motorcyclist Protection Systems First Edition-December 2016
The main advantage of these systems is that they can be fitted easily under the existing barrier
installations, without the need of replacing them. A disadvantage of these systems is that they can be
problematic at the areas prone to sand accumulation, as they wouldn’t allow the sand to flow under
the system. For this reason they ideally should not be installed in areas of potential sand
accumulation. Another potential disadvantage is the installation limitations at very sharp horizontal
curves. The minimum radius of curvature, which the system can be installed at, changes from one
design to another.
8.3.2 Discontinuous Motorcyclist Protection Systems (DMPS)
The DMPS focus only on the most aggressive element of a barrier system, the post. These are
discontinuous systems where each post is covered individually, as shown in Figure 8.10.
Figure 8.10 – Example of a discontinuous MPS application on a W-beam barrier, Motoprotec
from Motoprotec Security Systems [14]
Similar to CMPS, these systems only provide protection for errant riders sliding along the ground.
They generally do not provide protection for from the top of the barrier and are therefore less effective
for motorcycle impacts in upright position.
DMPS available on the market today also come in different designs and materials, including plastic,
foam and other composite materials. The designer/engineer should asses the performance of
individual systems through impact test results (See Section 8.4), regardless of the material type.
However, from a durability perspective, some materials may be a better fit for the environmental
conditions in Abu Dhabi, i.e. high temperatures and humidity. For this reason, the designer/engineer
should assess each system on a product by product basis. Most DMPS are also designed to be
installed on to more than one type of barrier system, such as the W-beam shown in Figure 8.10 and
the wire rope systems shown in Figure 8.11. The applicability is often based on the profile of the
barrier posts, as shown in Figure 8.2, and changes from one design to another.](https://image.slidesharecdn.com/documento50-1-120-5152borrador-240214213429-246eea16/85/Documento-50-1-120-51-52-borrador-pdf-221-320.jpg)
![ROADSIDE DESIGN GUIDE
PAGE 220
08 Motorcyclist Protection Systems First Edition-December 2016
Figure 8.11 – Example of discontinuous MPS application on a wire rope barrier in South
Australia [15]
DMPS, similar to CMPS, are relatively easy to install systems. Unlike some DMPS designs, CMPS
are not limited by the minimum horizontal curvature of the road. It can be installed at even the sharpest
curves. DMPS designs do not completely obstruct the lower section of the barrier and therefore allow
the windblown sand to freely pass through. This makes it a better alternative at areas prone to sand
accumulation.
8.3.3 Barriers with Motorcyclist Protection Incorporated in Design
This tested proprietary system is a barrier with motorcyclist protection incorporated in their
fundamental design. As shown in Figure 8.12, these systems do not feature any exposed posts,
corners or sharp edges. In addition to providing protection for sliding riders, unlike other alternatives
they also provide protection for the riders impacting the barrier in an upright position.
Figure 8.12 – Example of a barrier with motorcyclist protection incorporated in its design,
CUSTOM from CSM SpA
They are currently the least frequent MPS type on the market and are likely to be more expensive and
more time consuming to install than the other alternatives, as they would require a complete
replacement of the existing barrier. However, the additional level of safety provided may justify their
application. Similar to CMPS, these systems are not recommended in areas of potential sand
accumulation as they wouldn’t allow the sand to blow through.](https://image.slidesharecdn.com/documento50-1-120-5152borrador-240214213429-246eea16/85/Documento-50-1-120-51-52-borrador-pdf-222-320.jpg)
![ROADSIDE DESIGN GUIDE
PAGE 221
08 Motorcyclist Protection Systems First Edition-December 2016
8.4 Performance Assessment of Motorcyclist Protection Systems
Currently the common standardized way of assessing the performance of a MPS is the European
Technical Specification TS1317-8 “Motorcycle road restraint systems which reduce the impact
severity of motorcyclist collisions with safety barriers” [10]. TS1317-8 succeeds and is a combination
of both the Spanish Test Standard UNE-135900 and Test Protocol of the French test house LIER.
NCHRP350 and MASH do not include any methods for the impact performance assessment of MPS.
Therefore TS1317-8 is the recommended guidance of the MPS performance assessment for Abu
Dhabi.
The recommended procedure is to test a MPS first according to TS1317-8 to assess its impact
performance for motorcyclists. Since TS1317-8 tests are only carried out with test dummies sliding
on the ground, they do not contradict with MASH and NCHRP350 methodologies. If the MPS shows
satisfactory performance from a motorcyclist safety perspective, then the combination of the MPS and
the barrier, to which it will be attached, should be tested as one system, according to MASH or
NCHRP350. This secondary level of testing is required to demonstrate that the addition of MPS does
not adversely affect the performance of the barrier during impacts with other vehicles.
TS1317-8 specifies requirements for the impact performance of systems designed for the reduction
of impact severity for motorcyclists. Currently TS1317-8 considers only the scenario of a rider
impacting a barrier whilst sliding along the ground, having fallen from their motorcycle. Other incident
scenarios, such as riders impacting the barrier while still on their motorcycle are not yet considered in
TS1317-8. The systems reviewed by TS1317-8 are those fitted to barriers, or barriers that have
inherent rider protection or risk reduction capability.
8.4.1 TS1317-8 Test Types
The full-scale impact tests in TS1317-8 consist of launching a Hybrid III Test Dummy with a modified
shoulder at a given speed against a barrier with an MPS installed. At the moment of impact, the
dummy is sliding with its back and legs in contact with ground in a stable way, as shown in Figure
8.13 . The dummy is equipped with a helmet and dressed in motorcyclist safety clothes in accordance
with the requirements specified in the technical specification.
Figure 8.13 – Example of an EN1317-8 test configuration [10]
During the test, accelerations, forces and moments acting on the head and neck are measured with
instrumentation inside the dummy. High and normal speed cameras are used to capture test](https://image.slidesharecdn.com/documento50-1-120-5152borrador-240214213429-246eea16/85/Documento-50-1-120-51-52-borrador-pdf-223-320.jpg)
![ROADSIDE DESIGN GUIDE
PAGE 222
08 Motorcyclist Protection Systems First Edition-December 2016
footage that describes the behaviour of the MPS, barrier and dummy. Main performance indicators of
a TS1317-8 test are Speed and Severity Level classification.
8.5 Selection Criteria
Once the decision for the installation of a MPS is made, following criteria should be used in deciding
the type of MPS to be installed.
8.5.1 Compatibility with the Existing Barrier
It is not possible to install every MPS on to every barrier system available in the market. The chosen
MPS should be compatible with the existing barrier.
Compatibility should also be assessed from a performance perspective. Adding an MPS to an existing
barrier can have some adverse effects during an impact with a car. This concern was supported by
tests carried out in BAst, Germany [18]. The testing indicated that there would be an increased
probability of a car climbing up the barrier due to the addition of the lower secondary rail, although the
results of the testing were still deemed to meet the requirements of the European Barrier Test
Standard EN1317-1&2. This is why a MPS ideally should not be installed on the road, without testing
the combination of barrier + MPS as a single system through MASH or NCHRP350. If the combination
passes the tests, then there would be significantly less worry for a vehicle to climb over the barrier.
It should be noted that different MPS-barrier combinations can result in different impact
characteristics. Therefore, it is important to test the complete systems both to a MPS testing standard
(TS1317-8) & a barrier testing standard (MASH or NCHRP-350 for Abu Dhabi) before installation.
In all cases, the compatibility of an MPS with a barrier system should be checked with the
manufacturer/promoter of the system, prior to installation. This may result in a different MPS and/or
barrier being selected for a particular application.
8.5.2 Areas of Potential Sand Accumulation
As explained in Section 8.3.1, continuous motorcyclist protection systems can cause problems in
areas of blowing sand. These systems do not allow the free movement of sand and therefore may
cause accumulation under the barrier. Consideration should be given for the selection of an
appropriate MPS in such areas. From a motorcyclist’s point of view, ideally, the designer/engineer
should try to eliminate the risk by removing or relocating the hazards, in such areas. If this is not
possible, then a barrier design, which would allow the free movement of the sand, can be considered.
This is likely to be a WRSB system, due to their better performance in letting the sand to flow
underneath. If this is the case, then the posts of the WRSB should be shielded with an appropriate
MPS, such as the example shown in Figure 8.11.
8.6 Application Criteria
8.6.1 Common Locations Where a Motorcyclist Protection System may
be required
Motorcycle to barrier accidents are rare but high severity incidents. Due to their rarity, covering the
whole network with MPS is often not feasible from a cost effectiveness perspective. However, due](https://image.slidesharecdn.com/documento50-1-120-5152borrador-240214213429-246eea16/85/Documento-50-1-120-51-52-borrador-pdf-224-320.jpg)
![ROADSIDE DESIGN GUIDE
PAGE 223
08 Motorcyclist Protection Systems First Edition-December 2016
to the high severity of these incidents, well targeted MPS installations are likely to provide high
cost/benefit ratio. For this reason it is important to identify the most common locations of motorcycle
to barrier incidents. Once identified, these locations can then be evaluated for the installation of a
MPS.
Following are the common locations of motorcycle to barrier accidents, based on international best
practice, which should be evaluated for the installation of a MPS:
8.6.1.1 Sharp Bends on Single Carriageways
On single carriageways, the most common locations for motorcycle-to-barrier incidents are sharp
bends, especially the ones with a horizontal curve radius less than 200m, as shown in Figure 8.14.
These locations are even more susceptible to motorcycle-to-barrier incidents if one or more of the
contributing characteristics, which are presented in Section 8.6.1.3, exist.
Figure 8.14 – Example of a sharp bend on a single carriageway [4]
On single carriageways, the following areas should be prioritised for the evaluation of a MPS
installation:
• Left hand bends with a curve radius of 200m or less – in such cases the rightside barrier
provision should be prioritised for assessment;
• Right hand bends with a curve radius of 200m or less – in such cases the leftside barrier
provision should be prioritised for assessment.
8.6.1.2 Vicinity of Interchanges on Dual Carriageways
Research shows that on high speed dual carriageway roads, such as freeways and expressways,
motorcycle-to-barrier accidents occur most commonly at the vicinity of the interchanges [1], such as
the one shown in Figure 8.15.
Motorcycle-to-barrier accidents also occur on uninterrupted straight (horizontal curve radius
>2000m) sections of dual carriageways. However, due to the relatively low number of incidents
compared to the very long stretch of dual carriageways on the network, it is not feasible to prioritise
these sections for MPS installation.
On an interchange, the following areas should be prioritised for the evaluation of a MPS
installation:](https://image.slidesharecdn.com/documento50-1-120-5152borrador-240214213429-246eea16/85/Documento-50-1-120-51-52-borrador-pdf-225-320.jpg)
![ROADSIDE DESIGN GUIDE
PAGE 224
08 Motorcyclist Protection Systems First Edition-December 2016
On Ramps/Slip Roads:
• On left hand bends with a curve radius of 200m or less – in such cases the rightside barrier
provision should be prioritised for assessment;
• On right hand bends with a curve radius of 200m or less – in such cases the leftside barrier
provision should be prioritised for assessment.
Figure 8.15 – Areas to be considered for MPS installation on an interchange [16]
8.6.1.3 Additional Road Characteristics for the use of a Motorcyclist
Protection System
Enhanced prioritisation should also be given to areas where one or more of the following
characteristics exist:
a) Locations with a known history of motorcycle-to-barrier accidents;
b) Routes regularly travelled by motorcyclists/where the percentage of motorcyclist traffic is
high;
c) Locations where the barrier system is located close to the edge of the carriageway;
d) Inadequate geometric design, such as reverse and/or insufficient super-elevation, as shown
in Figure 8.16;
Areas to be considered
for a MPS installation](https://image.slidesharecdn.com/documento50-1-120-5152borrador-240214213429-246eea16/85/Documento-50-1-120-51-52-borrador-pdf-226-320.jpg)
![ROADSIDE DESIGN GUIDE
PAGE 225
08 Motorcyclist Protection Systems First Edition-December 2016
Figure 8.16 – Examples of reverse/inadequate super-elevation [17]
e) Consecutive curves with changing direction and horizontal curve radii, such as mountain
terrain, as shown in Figure 8.17, A).;
• This is a physically challenging combination for the riders. It is easier to make an error
and miss the correct line during the successive direction changes;
f) Sharp horizontal curves located at the end of long straights, without a sufficient transition
spiral, as shown in Figure 8.17, B);
• The long straight gives enough distance for reaching higher speeds, while judging the
brake point before the sharp curve can be tricky for riders. This combination is also
against rider expectations;
g) Consecutive curves in the same direction, with decreasing radius, as shown in Figure 8.17,
C);
• It is very hard to judge and keep the correct cornering line in this combination as the
correct line changes suddenly in the middle of the corner. This design is also against
rider expectations;
Figure 8.17 - High risk horizontal road alignment combinations for motorcyclists [17]
h) Locations with poor sight distance;
i) Locations likely to experience sand accumulation and skidding;
j) Locations where other hazards to motorcyclists exist, subject to engineering judgment.
8.6.2 Assessment of the Need for a Motorcyclist Protection System
Once an area of potential motorcycle-to-barrier incidents is identified, the following treatment options
should be evaluated; listed in order of decreasing level of desirability from a road safety perspective.
1) Investigate the methods that would decrease the probability of a motorcyclist leaving the
carriageway (e.g. improving road surface, improved signage or better visibility);](https://image.slidesharecdn.com/documento50-1-120-5152borrador-240214213429-246eea16/85/Documento-50-1-120-51-52-borrador-pdf-227-320.jpg)
![ROADSIDE DESIGN GUIDE
PAGE 227
08 Motorcyclist Protection Systems First Edition-December 2016
a motorcyclist when impacting a safety barrier, a number of Motorcyclist Protection Systems (MPS)
have been developed.
MPS available on the market can be grouped into three categories:
• Continuous MPS;
• Discontinuous MPS;
• Barriers with MPS incorporated in design.
Performance of a MPS can be assessed through the European Technical Specification TS1317-8.
Main performance indicators of a TS1317-8 test are Speed and Severity Level classification.
The need for a MPS should be assessed for road sections with a higher risk of a motorcycle-to- barrier
incident. Locations to prioritise for an assessment are:
• Areas with a history of motorcycle-to-barrier accidents;
• Sharp bends in single carriageways;
• Vicinity of Interchanges on dual carriageways, with a special focus on ramps.
Once an area for possible motorcycle-to-barrier accidents is identified, it should be evaluated for a
MPS installation. A MPS is only recommended if the barrier cannot be removed.
Once the decision to install a MPS is made, the type should be selected according to:
• Compatibility with the existing barrier;
• Potential risk of sand accumulation.
The chosen MPS should be compatible with the existing barrier. Adding a MPS to an existing barrier
can have some adverse effects during an impact with a car. This is why, ideally, a MPS should not be
installed on the road, without testing the combination of barrier + MPS as a single system through
MASH or NCHRP350.
CMPS can cause problems with sand accumulation and therefore should not be used in areas prone
to blowing sand.
MPS should be inspected in line with the manufacturer’s installation and maintenance manual. The
majority of the available MPS are designed to remain functional after an impact by an errant
motorcyclist sliding on the ground.
Some MPS are made of materials, which may be more sensitive to heat than others. If such a system
is chosen for installation, the effect of the high temperatures and humidity observed in Abu Dhabi
should be checked during inspection.
8.9 References
[1] C. Erginbas and G. Williams, “Motorcyclists and Barriers on the Highways Agency Road
Network,” TRL (Unpublished), 2015.
[2] H. C. Gabler, “THE RISK OF FATALITY IN MOTORCYCLE CRASHES WITH ROADSIDE
BARRIERS,” Virginia Tech, United States, 2007.](https://image.slidesharecdn.com/documento50-1-120-5152borrador-240214213429-246eea16/85/Documento-50-1-120-51-52-borrador-pdf-229-320.jpg)
![ROADSIDE DESIGN GUIDE
PAGE 228
08 Motorcyclist Protection Systems First Edition-December 2016
[3] M. Mcdonald, “Motorcyclists and Roadside Safety Hardware,” in A2A04 Summer Meeting,
2002.
[4] FEMA, “New Standards for Road Restraint Systems for Motorcyclists - Designing Safer
Roadsides for Motorcyclists,” Federation of European Motorcyclists' Associations, 2012.
[5] Norwegian Public Roads Administration, “MC Safety Design and Operation of Roads and
Traffic Systems,” Directorate of Public Roads, Norway, 2004.
[6] T. Gibson and E. Benetatos, “Motorcycles and Crash Barriers,” NSW Motorcycle Council, New
South Wales, 2000.
[7] C. Duncan, B. Corben and N. &. T. C. Truedsson, “Motorcycle and Safety Barrier Crash-
Testing: Feasibility Study,” Accident Research Centre, Monash University, 2000.
[8] A. Daniello and H. C. Gabler, “Effect of Barrier Type on Injury Severity in Motorcycle-to-Barrier
Collisions in North Carolina, Texas, and New Jersey,” Transportation Research Record:
Journal of the Transportation Research Board, p. pp. 144–151, 2011.
[9] J. C. Toribio, “Barreras rígidas de hormigón Comportamiento ante el impacto de motoristas
(Rigid Concrete Barriers, Behaviour on the Impact of Motorcyclists),” Asociacion Mutua Motera
, pp. 62-65, 2008.
[10] CEN, CEN/TS 1317-8, Road Restraint Systems - Part 8: Motorcycle Road Restraint Systems
Which Reduce the Impact Severity of Motorcyclist Collisions with Safety Barriers, Brussels:
CEN, European Committee for Standardization, 2012.
[11] EuroRAP, “Barriers to change: designing safe roads for motorcyclists,” EuroRAP,
Basingstoke, 2008.
[12] SNOLINE, “www.snoline.com,” [Online]. Available: http://www.snoline.com/dr46-1. [Accessed
2015 09 15].
[13] BASYC Systemas de Seguridad Vial, [Online]. Available: http://www.basyc.eu/. [Accessed
2015 09 15].
[14] World Highways, “www.worldhighways.com,” [Online]. Available:
http://www.worldhighways.com/categories/road-markings-barriers-workzone-
protection/features/crash-cushion-design/. [Accessed 15 09 2015].
[15] Governmen of South Australia Depratment of Planning, Transport and Infrastructure,
“www.dpti.sa.gov.au,” [Online]. Available:
http://www.dpti.sa.gov.au/towardszerotogether/safer_roads/building_safer_roads. [Accessed
15 09 2015].
[16] Abu Dhabi Department of Transport, Road Geometric Design Manual, Abu Dhabi: Abu Dhabi](https://image.slidesharecdn.com/documento50-1-120-5152borrador-240214213429-246eea16/85/Documento-50-1-120-51-52-borrador-pdf-230-320.jpg)
![ROADSIDE DESIGN GUIDE
PAGE 229
08 Motorcyclist Protection Systems First Edition-December 2016
Department of Transport, 2014.
[17] FGSV, “Merkblatt zur Verbesserung der Verkehrssicherheit auf Motorradstrecken (Leaflet to
Improve Road Safety on Motorcycle Roads),” Forschungsgesellschaft für Straßen und
Verkehrswesen, 2007.
[18] BAST, “Einsatzkriterien für Schutzeinrichtungen mit geringerem Verletzungsrisiko für
Motorradfahrer. Bundesanstalt für Strassenwesen,” BAST, 2004.](https://image.slidesharecdn.com/documento50-1-120-5152borrador-240214213429-246eea16/85/Documento-50-1-120-51-52-borrador-pdf-231-320.jpg)
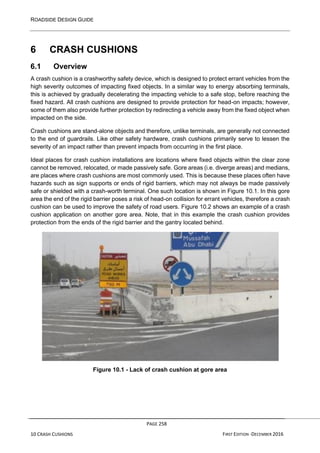
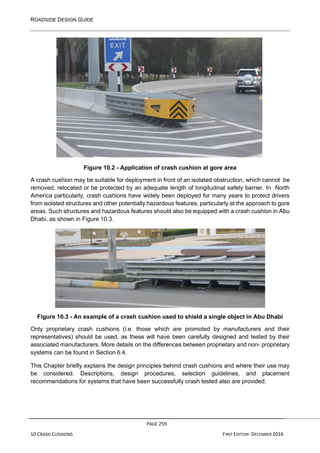
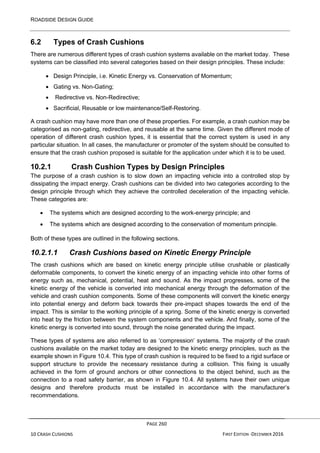
![ROADSIDE DESIGN GUIDE
PAGE 261
10 CRASH CUSHIONS FIRST EDITION -DECEMBER 2016
Figure 10.4 – Example of a crash cushion based on the Kinetic Energy Principle
10.2.1.2 Crash Cushions based on Conservation of Momentum
Principle
The crash cushions which are based on the conservation of momentum principle (sometimes
referred to as the ‘inertial’ type) utilise materials of expendable mass, such as sand, into which the
kinetic impact energy of the vehicle can be transferred during the collision. The material of
expendable mass is often kept in containers such as drums or buckets, as shown in Figure 10.5. As
the impacting vehicle collides with each container, the expandable mass located inside the container
is shifted and dispersed around the crash by the transfer of momentum from the vehicle to the mass.
Usual practice is to provide an increasing amount of mass within each row of containers, and / or
increase the number of containers from the impact face of the system towards the back. The net
effect of this layout is a gradual increase in the amount of mass within the system and therefore a
gradual decrease of speed for the impacting vehicle.
Figure 10.5 – Example of a crash cushion based on the Conservation of Momentum
Principle [1]
Historically, this type of system was mainly used in the United States. However, over the years, with
the development of numerous crash cushions which are based on the kinetic energy principle, the
use of these systems has declined. This is mainly due to the following disadvantages of these types
of systems:
• They occupy considerably more space than other available crash cushions;
• They are sacrificial by design, i.e. they are usually not functional after an initial impact (see
Section 10.2.4);](https://image.slidesharecdn.com/documento50-1-120-5152borrador-240214213429-246eea16/85/Documento-50-1-120-51-52-borrador-pdf-235-320.jpg)
![ROADSIDE DESIGN GUIDE
PAGE 262
10 CRASH CUSHIONS FIRST EDITION -DECEMBER 2016
• The dispersion of sand upon impact can create a safety and maintenance problem;
• If not sealed properly, the amount of sand within each container can increase due to the
drifting sands and sand storms observed in Abu Dhabi. This can affect the impact behaviour
of the system.
However, these systems do have the following advantages:
• They do not require to be fixed to a rigid surface or support structure, as they are designed
to be free-standing;
• This is the only type of crash cushion the design of which can be determined analytically.
10.2.2 Gating vs. Non Gating Crash Cushions
In a similar way to terminals, crash cushions can also be classified as either being ‘gating’ or ‘non-
gating’, as shown in Figure 10.6.
Gating crash cushions are designed to allow vehicles impacting near the beginning or nose of the
system to safely pass through the unit and travel behind the cushion, as shown in Figure 10.6.
As crash cushions (unlike terminals) are often installed close to the hazards from which they are
protecting road users, gating crash cushions are not preferred. Vehicles that pass through a gating
treatment are directed into the area behind the end treatment. It is therefore necessary to ensure
that this run-out area should:
• Contain no fixed hazards (e.g. poles and trees);
• Be traversable, with a lateral slope of 4:1 or flatter:
• Extended parallel to the barrier/terminal at least for a distance of 18 m beyond the point of
need for the barrier/terminal;
• Be at least 6 m wide [2].
If a runout area cannot be provided or would be smaller than the required dimension, a non-gating
system should be used.
Non-gating crash cushions, when impacted on either end by a vehicle, will not allow the vehicle to
pass through or over it, but instead contain or redirect the vehicle along the travelled way. Depending
on their characteristics, non-gating crash cushions can further be categorised as redirective or non-
redirective (see Section 10.2.3).
10.2.3 Redirective vs. Non-Redirective Crash Cushions
Further to the classification of being gating or non-gating, a crash cushion can also be classified as
being either ‘redirective’ or ‘non-redirective’, as shown in Figure 10.7.
‘Redirective’ crash cushions have been designed so that when impacted by a vehicle on the side
they will redirect the vehicle along the travelled way (in the direction that it was originally travelling).
The classification of a crash cushion as redirective or non-redirective is based on the performance
of the system during side impacts. On the other hand, the classification of gating or non-gating is
based on the performance during impacts with near the beginning or nose of the system.](https://image.slidesharecdn.com/documento50-1-120-5152borrador-240214213429-246eea16/85/Documento-50-1-120-51-52-borrador-pdf-236-320.jpg)
![ROADSIDE DESIGN GUIDE
PAGE 263
10 CRASH CUSHIONS FIRST EDITION -DECEMBER 2016
Therefore, it is possible for a redirective system to be either gating or non-gating. Such systems are
preferred in all locations as they also offer positive performance for side impacts.
Figure 10.6 - Gating and non-gating crash cushions
‘Non-Redirective’ crash cushions are designed so that when impacted by a vehicle on their side,
they will either allow the vehicle to pass through or contain the vehicle within the system, as shown
in Figure 10.7. These systems are designed to safely accommodate most impacts with the front of
the crash cushion, but they do not have the capability to redirect vehicles impacting near the rear.
As a result, most non-redirective cushions are designed to be wider than the hazard to be shielded
and are typically used farther from traffic where the risk of high-energy impacts near the rear of the
cushion is lower [3]. The non-redirective systems are predominantly the ones which are designed
according to the conservation of momentum principle, i.e. the barrel and sand systems, and therefore
they are predominantly gating systems. This is also recognised by NCHRP-350 and MASH, which
do not describe any impact tests which are applicable to non-redirective non-gating systems (see
Section 10.3.1).
Traffic Flow
Traffic Flow
Traffic Flow
Traffic Flow](https://image.slidesharecdn.com/documento50-1-120-5152borrador-240214213429-246eea16/85/Documento-50-1-120-51-52-borrador-pdf-237-320.jpg)
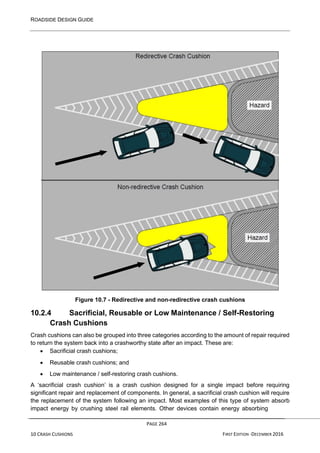
![ROADSIDE DESIGN GUIDE
PAGE 265
10 CRASH CUSHIONS FIRST EDITION -DECEMBER 2016
elements which are designed to permanently deform on impact, gradually decelerating the impacting
vehicle and bringing any impacting vehicle to a controlled stop.
This may include components such as plastic cartridges containing foam, sand or water, as indicated
in Figure 10.8. Major components of sacrificial crash cushions are destroyed by impacts, but it should
be noted that other parts may still be reusable.
Figure 10.8 - Examples of energy absorbing cartridges in crash cushions [1], [4]
A ‘reusable crash cushion’ is a crash cushion system for which some of the major components have
been designed to be reusable after an impact. However, some of the components will need to be
replaced after an impact to ensure that the crash cushion is maintained to produce the original level
of performance in a subsequent impact. In locations where designers expect to have frequent
impacts these devices are likely to have a great cost/benefit ratio, and are therefore more
appropriate.
The category of ‘Low Maintenance / Self-restoring Crash Cushions’ contains those crash cushion
systems that suffer very little, if any, damage upon impact and which are designed to be easily pulled
back into their full operating condition, an example of which is given in Figure 10.9. Alternatively,
they can partially rebound after an impact and may only need an inspection to ensure that no parts
have been damaged or misaligned. As with any crash cushion system, inspections should be
undertaken in line with the manufacturer’s requirements, as detailed within their Installation,
Inspection and Maintenance manual.
Figure 10.9 - Example of a self-restoring crash cushion](https://image.slidesharecdn.com/documento50-1-120-5152borrador-240214213429-246eea16/85/Documento-50-1-120-51-52-borrador-pdf-239-320.jpg)
![ROADSIDE DESIGN GUIDE
PAGE 266
10 CRASH CUSHIONS FIRST EDITION -DECEMBER 2016
There are relatively high levels of cost associated with the initial purchase and installation of such
crash cushion systems. But there are subsequent low levels of repair and maintenance. This means
that these types of crash cushions should be installed in high-speed, high-traffic volume ramps or
medians (where there is an anticipated high frequency of high severity incidents) to reduce the risk
to road users and the exposure of maintenance workers to the traffic (during repairs).
For all crash cushion systems it is essential that all of the components and fixings for the crash
cushion are checked for damage following an impact, and if necessary appropriate repairs are made
to ensure that the crash cushion is restored to full working order.
Requirements for the inspection and repair of crash cushions should be provided by the
manufacturer of the proprietary system within their Installation, Inspection and Maintenance manual.
Where there are any questions or doubts regarding damage to a component, this should be checked
with the manufacturer of the system. If in any further doubt, the component should be replaced. All
replacement parts should be provided by the manufacturer (or their representatives).
6.3 NCHRP350 and MASH Performance Classifications
All crash cushions shall have demonstrated compliance with the American recommendations in
either NCHRP Report 350 [5] or MASH [3] and additional local conditions for the Abu Dhabi Road
Network. Evidence of this shall be presented and approved by the Overseeing Organization prior to
the use of these systems. Only systems approved by the Overseeing Organization shall be used.
After January 1, 2011, newly-tested crash cushions must be evaluated in accordance with MASH.
However, crash cushions that were accepted before the adoption of MASH by using criteria
contained in NCHRP Report 350 may remain in place and may continue to be manufactured and
installed.
In order to meet the requirements of NCHRP350, or MASH, the crash cushion must demonstrate
that it can successfully decelerate (and for redirective, non-gating crash cushions, redirect) the
impacting vehicle without the unsafe detachment of components. During the impact testing event,
the impacting vehicle should maintain an upright orientation, whilst meeting the requirements of two
severity indices; OIV and ORA. More details regarding these severity indices can be found in Chapter
6, Section 6.3.3.4.
10.3.1 Test Types
NCHRP Report 350 and MASH contain recommended procedures for evaluating the performance
and test procedures for crash cushions. The testing of a crash cushion requires the successful
completion of a series of full-scale impact tests. Table 10.1 and Table 10.2 show the parameters for
the most commonly available impact test level (TL-3). Each test configuration is described in terms
of the type and mass of the impacting vehicle, impact point, speed and angle of impact.
As can be seen from Table 10.1, according to NCHP350 for re-directive crash cushions, some test
types are only recommended for gating systems, some are only recommended for non-gating
systems and some are recommended for both. According to MASH however, all the test
configurations for redirective crash cushions listed in Table 10.2 are recommended for both gating
and non-gating systems; with the only difference being the evaluation criteria of the test outcome.
The non-gating systems are expected to contain or redirect the vehicle or bring the vehicle to a
controlled stop, whereas the performance of gating systems are considered acceptable in case of](https://image.slidesharecdn.com/documento50-1-120-5152borrador-240214213429-246eea16/85/Documento-50-1-120-51-52-borrador-pdf-240-320.jpg)
![ROADSIDE DESIGN GUIDE
PAGE 267
10 CRASH CUSHIONS FIRST EDITION -DECEMBER 2016
redirection, controlled penetration or controlled stopping of the test vehicle. For non-redirective crash
cushions however, both NCHRP350 and MASH specify tests which are only applicable for gating
systems. There are no tests described for non-redirective and non-gating systems. This is because
a system is unlikely to be both non-redirective and non-gating at the same time.
Table 10.1 - Test requirements for TL-3, NCHRP350 [5]
Test
Level
Feature Type
Impact Conditions
Impact Point
Vehicle
Impact
Speed
(km/h)
Impact
Angle
(°)
TL-3
Redirective
Crash
Cushions
G/NG 820kg Car 100 0 Head-on at ¼ vehicle width
G/NG 700kg Car 100 0 Head-on at ¼ vehicle width
G/NG 2000kg Pickup
Truck
100 0 Head on, centre
G/NG 820kg Car 100 15 on nose of cushion
G/NG 700kg Car 100 15 on nose of cushion
G/NG 2000kg Pickup
Truck
100 15 on nose of cushion
G 820kg Car 100 15 at the critical impact point
G 700kg Car 100 15 at the critical impact point
G 2000kg Pickup
Truck
100 20 at the critical impact point
NG 820kg Car 100 15 at the critical impact point
NG 700kg Car 100 15 at the critical impact point
NG 2000kg Pickup
Truck
100 20 at the critical impact point
NG 2000kg Pickup
Truck
100 20 at the critical impact point
G/NG 2000kg Pickup
Truck
100 20 at ½ cushion length
Non-Redirective
Crash
Cushions
G 820kg Car 100 0 at ¼ vehicle width
G 700kg Car 100 0 at ¼ vehicle width
G 2000P 100 0 Head on, centre
G 820kg Car 100 15 on nose of cushion
G 700kg Car 100 15 on nose of cushion
G 2000kg Pickup
Truck
100 15 on nose of cushion
G 2000kg Pickup
Truck
100 20 at ½ cushion length
Notes:
G/NG – Applicable for gating and non-gating crash cushions](https://image.slidesharecdn.com/documento50-1-120-5152borrador-240214213429-246eea16/85/Documento-50-1-120-51-52-borrador-pdf-241-320.jpg)

![ROADSIDE DESIGN GUIDE
PAGE 269
10 CRASH CUSHIONS FIRST EDITION -DECEMBER 2016
Table 10.2 - Test requirements for TL-3, MASH [3]
Test
Level
Feature Type
Impact Conditions
Impact Point
Vehicle
Impact
Speed
(km/h)
Impact
Angle
(°)
TL-3
Redirective
Crash
Cushions
G/NG 1100kg Car 100 0 Head-on at ¼ vehicle width
G/NG 2270kg Pickup
Truck
100 0 Head on, centre
G/NG 1100kg Car 100 5/15 on the nose of the cushion
G/NG 2270kg Pickup
Truck
100 5/15 on the nose of the cushion
G/NG 1100kg Car 100 15 at the critical impact point
G/NG 2270kg Pickup
Truck
100 25 at the critical impact point
G/NG 2270kg Pickup
Truck
100 25 at the critical impact point
G/NG 2270kg Pickup
Truck
100 25 at the critical impact point
G/NG 1500kg Car 100 0 Head on, centre
Non-Redirective
Crash
Cushions
G 1100 kg Car 100 0 Head-on at ¼ vehicle width
G 2270kg Pickup
Truck
100 0 Head on, centre
G 1100 kg Car 100 5/15 on nose of cushion
G 2270 kg Pickup
Truck
100 5/15 on nose of cushion
G 2270 kg Pickup
Truck
100 20 at critical impact point
G 1500kg Car 100 0 Head on, centre
Notes:
G/NG – Applicable for gating and non-gating crash cushions
G – Applicable for gating crash cushions only
NG – Applicable for non-gating crash cushions only
Table 10.1 and Table 10.2 also present the impact point for each test configuration. It can be seen
that some of the tests are carried out at the critical impact point. For crash cushions, the critical
impact point is described as the point where the behaviour of the system changes from redirecting
the impacting vehicle to either capturing the vehicle (for non-gating systems) or allowing it to gate
through the system (for gating systems) [3]. The critical impact point is often first estimated through
computer simulations and then identified through a series of full scale crash tests described in
NCHRP350 and MASH.
All test levels include the testing of cars and light duty commercial vehicles up to the size of a pickup
truck. The pickup truck is similar to many of the four-wheel-drive vehicles currently using the road
network within Abu Dhabi and hence the reliance on the NCHRP350 and MASH test methods. These
test methods do not include tests involving larger vehicles such as single unit trucks and semitrailers.](https://image.slidesharecdn.com/documento50-1-120-5152borrador-240214213429-246eea16/85/Documento-50-1-120-51-52-borrador-pdf-243-320.jpg)
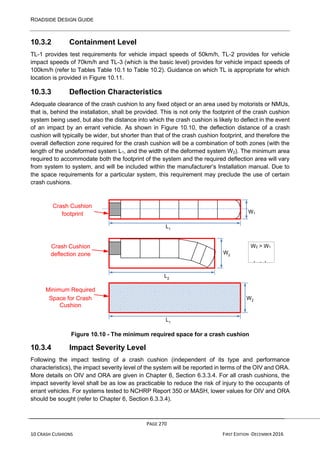
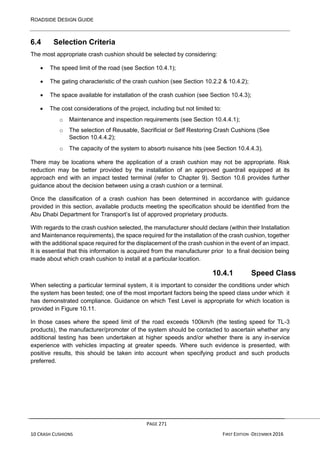
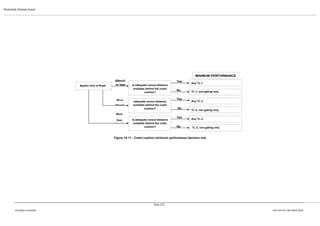
![ROADSIDE DESIGN GUIDE
PAGE 274
10 CRASH CUSHIONS FIRST EDITION -DECEMBER 2016
capability should reduce or eliminate the maintenance effort for minor repairs or partial replacement
of a system.
10.4.4.2 Selection of Reusable, Sacrificial or Self-restoring Crash
Cushions
The expected crash frequency is an important factor to consider when selecting the type of crash
cushion to be installed at a site. A higher frequency of impacts will increase the life-time costs, as
each impact will generate a new repair cost. The repair cost will change dramatically for sacrificial,
reusable and self-restoring systems. Therefore, the frequency of accidents becomes an important
factor when selecting between these systems. The Annual Daily Traffic (ADT) has been shown to
be a good indicator for expected impact frequency. The higher the ADT, the more impacts with the
crash cushion is expected. The proximity of the crash cushion to the edge of the travelled way will
also affect the number of impacts, as more impacts are expected for installations located closer to
the traffic. Furthermore, the location of the crash cushion will affect the costs associated with lane
closures for repairs. Systems which are close to the road can necessitate lane closures, whereas
this may be avoided for locations where the crash cushion is further away from the edge of the
travelled way. Figure 10.13 provides a decision tree for the crash cushion type selection, based on
these considerations.
Due to the low initial cost, but greater level of repair required (in the event of an impact), sacrificial
crash cushions should only be used in areas where the risk of impact is low. It should be noted
however, that whilst many of the components of a sacrificial crash cushion will be permanently
deformed in an impact (and will require replacement), due to the testing requirements of NCHRP350
and MASH, such systems will afford the same level of risk reduction as equivalent reusable crash
cushions.
Sacrificial crash cushions are generally recommended for areas with an ADT of less than 25,000,
with a low history or expectation of impacts occurring during the lifetime of the crash cushion and in
locations which are greater than 3m from the travelled way and/or outside of the clear zone (refer to
Figure 10.13) [6].
Reusable crash cushions are generally recommended for areas with an ADT of less than 25,000,
which have a history or expectation of one or fewer impacts each year and which are greater than
3m from the travelled way. They are also suited for locations where there is an unlimited repair time
(Refer to Figure 10.13) [6].
Self-restoring crash cushions are generally recommended for areas with an ADT of 25,000 or more,
with a history or expectation of multiple impacts each year and locations within 3m of the travelled
way. They are also suited to sites requiring night repairs and/or with repair time limitations [6].
10.4.4.3 Capacity to Absorb Nuisance Hits
Crash cushions, similar to terminals, are susceptible to nuisance crashes, i.e. small, low speed
impacts. It is preferable if the crash cushion can withstand a number of nuisance crashes and
continue to perform satisfactorily before requiring any repair. Crash cushions which can withstand
nuisance crashes better are likely to lead to less repair costs, and this helps their cost- effectiveness
through the lifetime of the installation.](https://image.slidesharecdn.com/documento50-1-120-5152borrador-240214213429-246eea16/85/Documento-50-1-120-51-52-borrador-pdf-249-320.jpg)
![ROADSIDE DESIGN GUIDE
PAGE 275
10 CRASH CUSHIONS FIRST EDITION -DECEMBER 2016
Figure 10.13 - Crash cushion type decision tree [6]
Less than
25,000
Low
History or
expectation of
impacts
Location greater than 3m
away from the travelled way
and/or outside clear zoneIs
Yes
Yes
Low Maintenance and/or Self
Restoring Crash Cushion
More than
or equal to
25,000
Low Maintenance and/or Self
Restoring Crash Cushion
Location greater than 3m
away from the travelled way
and/or outside clear zone
Reusable Crash Cushion
One or fewer
each year
Low Maintenance and/or Self
Restoring Crash Cushion
Average Daily Traffic
Sacrificial Crash Cushion
TYPE of CRASH CUSHION](https://image.slidesharecdn.com/documento50-1-120-5152borrador-240214213429-246eea16/85/Documento-50-1-120-51-52-borrador-pdf-250-320.jpg)
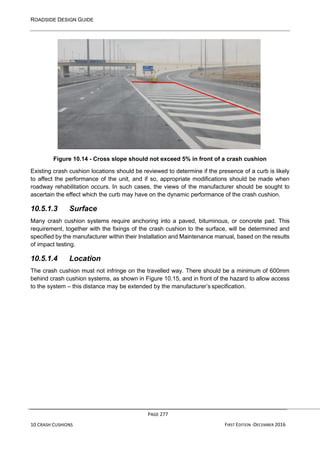
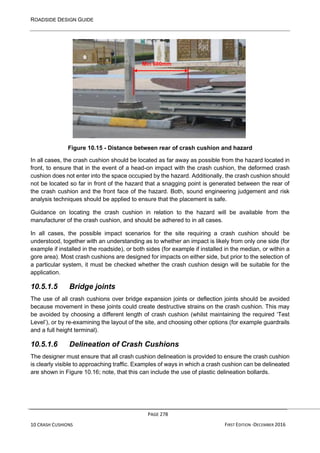
![ROADSIDE DESIGN GUIDE
PAGE 279
10 CRASH CUSHIONS FIRST EDITION -DECEMBER 2016
Figure 10.16 - Examples of crash cushion delineation
10.5.2 The use of Crash Cushions in Gore Areas
As can be seen from many of the figures within this Chapter, one of the main applications for crash
cushions in the Emirate of Abu Dhabi is to protect road users from the hazard presented by the end
of safety barriers at nosings and gore areas. It is recommended that the required space for crash
cushion installation for these locations should be considered from the preliminary design stage. This
should be done to prevent any compatibility issues between the selected crash cushion and the final
design, caused by the lack of required space.
Figure 10.17 and
Table 10.3 give recommendations for the area which should be made available for crash cushion
installation. Although it depicts a gore area, the same approach could be applied to other types of
objects from which road users will need to be shielded. Note that the dimensions shown in
Table 10.3 are not definitive and are provided for guidance only. The manufacturer should always
be consulted to ascertain whether there are any specifications specific to their product, prior to the
finalisation of the scheme design.
Figure 10.17 - Guidelines for the provision of crash cushions at gore areas [6]](https://image.slidesharecdn.com/documento50-1-120-5152borrador-240214213429-246eea16/85/Documento-50-1-120-51-52-borrador-pdf-254-320.jpg)
![ROADSIDE DESIGN GUIDE
PAGE 280
10 CRASH CUSHIONS FIRST EDITION -DECEMBER 2016
Table 10.3 - Dimensions for the provision of crash cushions in gore areas [6]
Design
Speed
on
Main
Line
(km/h)
Dimensions for Crash Cushion, Reserve Area (in metres)
Preferred
Minimum
Unrestricted Conditions Restricted Conditions
N L F N L F N L F
50 3.5 5 1.5 2.5 3.5 1 2 2.5 0.5
80 3.5 10 1.5 2.5 7.5 1 2 5 0.5
110 3.5 17 1.5 2.5 13.5 1 2 8.5 0.5
130 3.5 21 1.5 2.5 17 1 2 11 0.5
N = for preliminary design purposes, an assumed width of space necessary for placement of crash cushions
L = for preliminary design purposes, an assumed length of space necessary for placement of crash cushions
F = for preliminary design purposes, an assumed maximum width of a fixed object that will need to be shielded with a
crash cushion
As can be seen from
Table 10.3, the dimensions are given for three different scenarios. These scenarios are:
• Preferred: These are the preferred dimensions to be provided, if other concerns such as
cost, available space, etc. are not an issue. This is the optimal solution;
• Minimum for Unrestricted Conditions: These are the minimum recommended
dimensions to be provided, if the concern of cost is not an issue;
• Minimum for Restricted Conditions: These are the minimum recommended dimensions
to be provided, if the cost of providing more space cannot be justified.
6.6 The Decision to use Crash Cushions or Energy Absorbing
Terminals
This Chapter has discussed the use of crash cushions and given examples of where their use will
be to the benefit of road safety. Chapter 9 has also considered the provision of energy absorbing
terminals. In any respect, both types of device are very similar in both their function, their mode of
operation, and the resulting levels of safety afforded to road users. There will be times, when the
designer/engineer will need to choose between a crash cushion or a terminal (or two terminals). This
decision will often have to be made based on the size and location of the hazard, the space available
for installation and the cost associated with each system.
Terminals will generally be the system of choice for locations where the traffic is found only on one
side of the device, such as the roadsides. Generally, for one sided installations, terminals will be
cheaper than crash cushions and the required space for installation will be less, although this would
ultimately depend on the individual systems.](https://image.slidesharecdn.com/documento50-1-120-5152borrador-240214213429-246eea16/85/Documento-50-1-120-51-52-borrador-pdf-255-320.jpg)
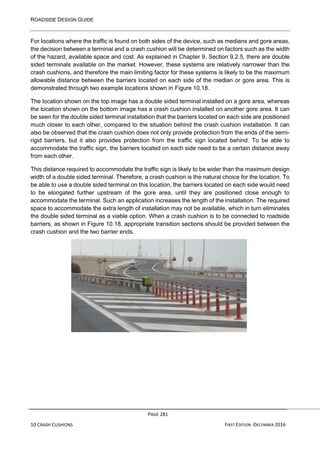
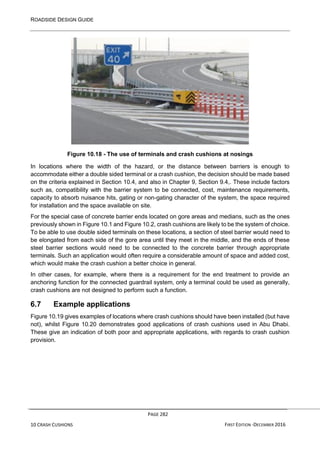
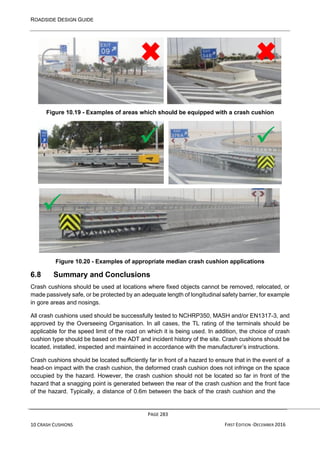
![ROADSIDE DESIGN GUIDE
PAGE 284
10 CRASH CUSHIONS FIRST EDITION -DECEMBER 2016
front face of the hazards will meet both of these criteria; however, the distance required will vary
from product to product. Hence, the manufacturer’s installation manual should be consulted for
details relating to the specific requirements for the crash cushion being installed.
Adequate clearance of the crash cushion from any fixed object or an area used by motorists or NMUs
(that is, behind the installation) shall be maintained and not compromised. This should take into
account the area required for the footprint of the crash cushion, and the area into which the crash
cushion will deflect in the event of an impact. In some situations, this may preclude the use of certain
crash cushions.
6.9 References
[1] Roads & Transport Authority, Roadside Design Guide for Dubai, First Edition, Dubai: RTA,
2008.
[2] Austroads, Guide to Road Design Part 6: Roadside Design, Safety and Barriers, Sydney, NSW:
Austroads, 2010.
[3] AASHTO, Manual for Assesing Safety Hardware (MASH), Washington D.C.: American
Association of State Highway and Transportation Officials, 2009.
[4] Laura Metaal Road Safety, “TAU Permanent redirective crash cushion,” [Online]. Available:
http://laurametaal.nl/en/content/guard-rail-double-sided/guard-rail-double-sided/guard-rail-
double-sided/guard-rail-double-6. [Accessed 10 09 2015].
[5] NCHRP, “NCHRP Report 350, Recommended Procedures for the Safety Performance
Evaluation of Highway Features,” Transportation Research Board, National Research Council,
Washington DC, 1993.
[6] AASHTO, Roadside Design Guide, 4th Edition, Washington D.C.: American Association of State
Highway and Transportation Officials, 2011.](https://image.slidesharecdn.com/documento50-1-120-5152borrador-240214213429-246eea16/85/Documento-50-1-120-51-52-borrador-pdf-259-320.jpg)
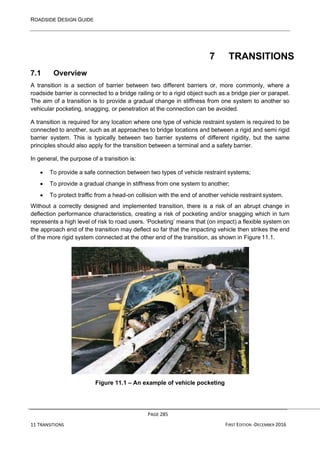
![ROADSIDE DESIGN GUIDE
PAGE 287
11 TRANSITIONS FIRST EDITION -DECEMBER 2016
7.3 NCHRP350 and MASH Performance Classifications
All transitions shall have demonstrated compliance with the American recommendations in either
NCHRP 350 [1] or MASH [2] and additional local conditions for the Abu Dhabi Road Network.
Evidence of this shall be presented and approved by the Abu Dhabi Department of Municipal Affairs
and Transport prior to the use of these systems. Only systems approved by the Abu Dhabi
Department of Municipal Affairs and Transport shall be used.
In all cases, and due to the high number of transitions which could exist between systems,
acceptance of a transition can be based on one or more of the following methods (in order of
preference):
• Full scale impact testing to the requirements of NCHRP350 or MASH (refer to Section
11.4);
• Virtual testing to the requirements of the European Technical Report TR16303-4;
• Good engineering judgement based on the design rules within Section 11.6.
However, it is emphasised that in all cases, transitions should be approved by the Abu Dhabi
Department of Municipal Affairs and Transport prior to specification and installation.
Virtual testing (more commonly known as computer simulation) can be used to demonstrate the
anticipated dynamic performance of a transition, however the development, use and interpretation
of computer simulation is a specialised subject. As a result, European standardisation groups have
developed a Technical Report (TR16303-4) which gives guidance for the conduct of those working
with virtual testing. The TR identifies minimum requirements for the models which are used for the
simulation, and provides details on how these should be validated so that the result of the virtual
testing can be relied upon.
Whilst vehicle restraint systems used within Abu Dhabi should be successfully tested to the
requirements of NCHRP350 and MASH, for completeness, reference is also made to the European
Standard for the testing of road restraint systems, EN1317 in Chapter 6, Section 6.3.4 and Appendix
A.
7.4 Test Types
NCHRP Report 350 and MASH contain recommended procedures for the testing of transitions.
Testing of a transition requires the successful completion of a series of full-scale impact tests, the
parameters for which are shown in Table 11.1.
As shown in Table 11.1, all transition testing should be conducted at the critical impact point (CIP).
For transitions, the CIP is described as the point that maximizes the risk of test failure [2]. The CIP
is often estimated by the test house through computer simulations or use of specialist software such
as The Barrier VII [3]. Further information about the identification of CIP can be found in NCHRP 350
and MASH.
The following sections describe transition performance characteristics in further detail:](https://image.slidesharecdn.com/documento50-1-120-5152borrador-240214213429-246eea16/85/Documento-50-1-120-51-52-borrador-pdf-262-320.jpg)
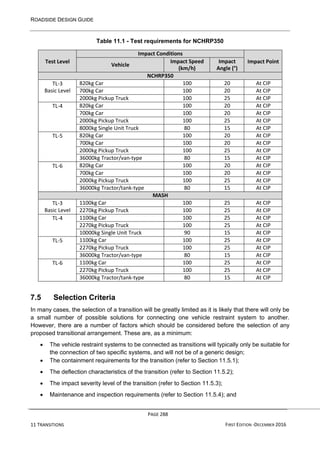
![ROADSIDE DESIGN GUIDE
PAGE 290
11 TRANSITIONS FIRST EDITION -DECEMBER 2016
If there is insufficient space available, consideration should be given to the use of a different
transition and thus, different vehicle restraint systems at either end of the transition.
Furthermore, the dynamic deflection (see Section 6.3.3.2) of a transition should not exceed the size
of the larger dynamic deflection of the two connected systems [4]. This is to prevent pocketing. The
dynamic deflection of a transition should be between the dynamic deflections of the two systems it
connects.
11.5.3 Impact Severity Level Requirements
Following the impact testing of a transition (independent of its type and performance characteristics),
the impact severity level of the system will be reported in terms of the OIV and ORA. These provide
a method of ranking the severity of the impact with the transition, and give an indicative guide as to
the level of injury which might be expected from an impact with an errant vehicle (assuming all of the
impact parameters are the same as those under which the system was tested). Further explanation
of the severity indices can be located within Chapter 6, Section 6.3.3.4.
For transitions, the impact severity level shall be as low as practicable to reduce the risk of injury to
the occupants of errant vehicles. For systems tested to NCHRP Report 350 or MASH, lower values
for OIV and ORA should be preferred, as shown in Table 3 of Section 7.2.3.
11.5.4 Maintenance and Inspection Requirements
All transitions should be maintained and inspected in line with the manufacturer’s recommendations.
These should be contained within the documentation supplied by the transition, and are likely to
reflect the requirements for the connected vehicle restraint systems. Any non- proprietary transitions
should be inspected every two years as a minimum.
11.5.5 Cost Considerations
As with all roadside safety systems, cost considerations should not just include the initial cost of
purchasing the crash cushion, but should also include the costs for installation, maintenance, repair
or replacement.
Unlike other barrier elements however, the number of alternative systems available for an acceptable
installation will be limited for transitions. There are many different types of roadside and bridge
barriers available on the market today. Each combination of these systems requires a unique
transition. The costs of developing a transition is considered high compared to the number of
potential applications. This means high development costs for low sales figures for the
manufacturers. Therefore, the cost considerations are less likely to be the decisive factor for the
transition selection, as there are often no alternatives available.
7.6 Application Criteria
The design of a transition between two connected vehicle restraint systems will require engineering
judgement, experience and knowledge of the vehicle restraint systems to be connected.](https://image.slidesharecdn.com/documento50-1-120-5152borrador-240214213429-246eea16/85/Documento-50-1-120-51-52-borrador-pdf-265-320.jpg)
![ROADSIDE DESIGN GUIDE
PAGE 291
11 TRANSITIONS FIRST EDITION -DECEMBER 2016
There are no specific rules which should be followed in the design of new transitions, however, there
are a number of factors and International best practice which should be considered and incorporated
within the design process. These specific points are highlighted below:
1. The general rule for transitions is that where practicable, vehicle restraint systems must be
physically connected together, and the transition used to complete this connection should be
designed so as to provide a gradual change in stiffness, height, profile and/or containment
from one barrier to another. This is the fundamental approach to be taken within the design
of a transition.
2. A more rigid roadside barrier transition can be provided through reducing post spacing (see
Figure 11.2); by using posts with a larger cross section or posts which go further into the
ground; and/or by using stronger or an increased number of rail elements. The use of a wider
rail system such as thrie beam may also be used. Such methods are frequently used by the
designers of proprietary products to decrease the deflection characteristics of their products.
However, as an example, within the UK, the 1.7 m length of a standard post is increased to
1.95 m if additional stiffness is required. The use of reduced post spacing on the approach
to a more rigid barrier system can be seen within Figure 11.2.
3. Transitions should be designed to minimise the likelihood of snagging by an errant vehicle
and one from the opposing lane on a two-way facility. ‘Snagging’ means that a vehicle
impacts a flexible barrier system, which deflects to such an extent that the vehicle then
impacts the approach end of the connected barrier system. This may result in very rapid
deceleration of the errant vehicle, greatly increasing the risk to the occupants of the errant
vehicle.
4. In addition to the risk posed by the end of a barrier, a vehicle’s wheels may also become
snagged on the posts of the connected system. The snagging of a vehicle may be mitigated
through the use of block-outs between the rail and the posts of the barrier system, or through
the addition of a secondary rail underneath the main containment rail(s), known as a ‘rubbing
rail’. An example of such a rubbing rail is shown in Figure 11.2.
5. The face of the approach rail transition should be smooth. Projections from the face of the
barrier should be avoided wherever possible, and in any case limited to 25mm [5], as shown
in Figure 11.3.](https://image.slidesharecdn.com/documento50-1-120-5152borrador-240214213429-246eea16/85/Documento-50-1-120-51-52-borrador-pdf-266-320.jpg)
![ROADSIDE DESIGN GUIDE
PAGE 292
11 TRANSITIONS FIRST EDITION -DECEMBER 2016
Figure 11.2 – An example of reduced post spacing and a rubbing rail
Direction of Traffic
Traffic face of Barrier A
Figure 11.3 – Projections on the face of a transition
6. To ensure that significant changes in deflection do not occur within a short distance, the
transition section should be sufficiently long. Generally, the transition length should be 10 to
12 times the difference in the lateral deflection of the two systems being connected by the
transition [6]. For example, if the deflection of Barrier A is 2.3 m, and the deflection of
connected Barrier B is 1.2 m, the transition should be between 11-13 m in length.
7. A transition such as that shown in Figure 11.4 is unacceptable for a number of reasons,
including the protrusion greater than 25 mm at the base of the transition, and the lack of a
gradual change in stiffness from the concrete barrier, to the steel beam, and back to the
concrete barrier. A more acceptable transition is that shown in Figure 11.5, where there is a
much better and controlled increase in stiffness, and a lack of protrusions due to the
alignment and design of the transition.
Figure 11.4 – An unacceptably short transition
Max 25 mm
Traffic face of Barrier B](https://image.slidesharecdn.com/documento50-1-120-5152borrador-240214213429-246eea16/85/Documento-50-1-120-51-52-borrador-pdf-267-320.jpg)
![ROADSIDE DESIGN GUIDE
PAGE 293
11 TRANSITIONS FIRST EDITION -DECEMBER 2016
Figure 11.5 – Transitional design with increasing stiffness
8. The effect of impacting the departure end of the downstream barrier, and the resulting
deflection should be assessed using a risk based approach, examining the likely effect of
impacts along the length of the transition, and the probability and severity of any resulting
injury. Figure 11.6 shows a number of examples where an impact on the departure end of
the upstream barrier will result in the barrier deflecting and redirecting the errant vehicle onto
the approach end of the downstream barrier. Such details are unacceptable, and the two
connected systems should work together to contain and redirect an errant vehicle.
Figure 11.6 – Unacceptable transition details
9. The transition should be designed so that the height of the transition increases smoothly and
continuously from the lower system to the higher one. An example of such an arrangement
can be seen in Figure 11.7. International experience has shown that any steps or slopes
should not be greater than 8% [7].
Approach end of
downstream barrier
Departure end of
upstream barrier
Approach end of
downstream barrier
Departure end of
upstream barrier](https://image.slidesharecdn.com/documento50-1-120-5152borrador-240214213429-246eea16/85/Documento-50-1-120-51-52-borrador-pdf-268-320.jpg)
![ROADSIDE DESIGN GUIDE
PAGE 294
11 TRANSITIONS FIRST EDITION -DECEMBER 2016
Figure 11.7 – An example of changes in connected barrier height
10. Drainage features (e.g. curbs, raised inlets, curb inlets, ditches) in front of the barrier in the
transition area may initiate vehicle instability that can, in some instances, adversely affect the
crashworthiness of the transition. The slope between the edge of the travelled lane and the
barrier should be no steeper than 1V:10H [6].
11.6.1 Connections
The strength of each connection between two different barriers should not be less than the strength
of the joint between consecutive beams in the lower containment barrier (typically the lap joint of a
TL-3 barrier). This can be demonstrated by testing or by calculations. Tests and calculations should
include combined longitudinal and bending forces if they both exist in a vehicle impact.
Experience from within the UK has shown that as a general rule, any connection between TL-1, TL-
2 or TL-3 barriers should be capable of transmitting a tensile force of 330kN [8]. Furthermore, any
connection between a TL-4, TL-5 or TL-6 barriers should be capable of transmitting a tensile force
of 500kN [8]. Connections which are not capable of transmitting such forces are likely to break in the
event of an impact, and these tensile force restrictions will provide designers with proven in-service
and in-testing guidance for the design of connections.
It must also be ensured that at each end of a transition there is a physical connection to another
vehicle restraint system, or a terminal. It is not acceptable to leave unprotected end of systems,
neither on the approach or departure end of the transition (as shown in Figure 11.8). The
arrangement shown in Figure 11.8 is unacceptable for a number of reasons, notably that the two
systems are not connected together. There is a risk of an errant vehicle impacting the ramped end
of the concrete barrier, and launching, possibly into the column located behind the concrete barrier.
There is also no increase in stiffness or anchorage at the end of the steel guardrail and hence, any
impact close to the departure end of the steel barrier is likely to deflect the steel barrier such that an
errant vehicle could impact the ramped concrete end with the centreline of the vehicle. An
arrangement such as that shown in Figure 11.16a should have been installed at this location – this
would include the removal of the ramped concrete end, a physical and sufficiently robust connection
(capable of transmitting a tensile force of 330kN) of the steel guardrail into the](https://image.slidesharecdn.com/documento50-1-120-5152borrador-240214213429-246eea16/85/Documento-50-1-120-51-52-borrador-pdf-269-320.jpg)
![ROADSIDE DESIGN GUIDE
PAGE 295
11 TRANSITIONS FIRST EDITION -DECEMBER 2016
concrete, and a closing of the post spacing just prior to the concrete barrier to increase the barrier’s
stiffness.
Figure 11.8 – Example of a poor transition (unconnected barrier systems)
11.6.2 Specific Transitional Arrangements
There are a number of transitional arrangements that require additional consideration and
engineering judgement to be applied to ensure they can be dealt with in an appropriate way. These
are explained in the following sections.
11.6.2.1 Safety Barrier to Bridge Parapet Transitions
Within the design of a transition, any exposed ends of bridge parapet systems should be flared
backwards, away from the traffic face of the parapet at an angle of 45° [9] as shown in Figure 11.9,
unless the rail is close to the main rail of the connecting barrier system. It should be noted that, where
practical, instead of flaring back rails, it is preferable to transition all rails so as not to leave any
exposed rail ends.
Figure 11.9 – An example of a flared back top parapet rail
11.6.2.2 Wire Rope Safety Barrier to Semi-rigid Barrier
When it comes to the provision of a transition between a WRSB and a w-beam barrier, there are
different approaches utilised internationally. The first type of approach is to install both the WRSB
and the W-beam side by side for a distance, as shown in Figure 11.10. This is the type of transition](https://image.slidesharecdn.com/documento50-1-120-5152borrador-240214213429-246eea16/85/Documento-50-1-120-51-52-borrador-pdf-270-320.jpg)
![ROADSIDE DESIGN GUIDE
PAGE 296
11 TRANSITIONS FIRST EDITION -DECEMBER 2016
which is recommended by the New Zealand Transport Agency [10]. In this application, the length of
overlap depends on the individual lengths of the WRSB and W-beam transitions. This is because
the end point of the W-beam terminal must align with (as shown in Figure 11.10) or overlap the point
of redirection of the WRSB system (i.e. the point where the WRSB terminal ends and standard
section of WRSB begins). The idea is to provide a standard section of at least one of the barrier
types along the whole transition and to keep the re-directional capabilities throughout the whole
arrangement. It should be noted that the W-beam terminal to be used for this type of transition is a
full height, parallel and an energy absorbing system. It is recommended that the offset between the
front face of the W-beam and the centreline of the WRSB should be 825mm at the upstream end of
W-beam, as shown in Figure 11.10. This offset comprises:
• 225mm (450/2, nominal WRSB footing);
• 100mm clearance; and
• 500mm semi-rigid barrier timber or I-section posts, and blockout [10].
*Figure is not to scale and shown for indicative purposes only.
Figure 11.10 – Example of a WRSB to W-beam transition by overlapping installation
The second type of application is to install the WRSB and the W-beam side by side with enough
distance to ensure that they will perform completely independently from each other during an impact.
This is also the type of arrangement which is recommended for transitions between WRSB and
concrete barriers, and therefore it is explained in further detail in Section 11.6.2.3. This is the type of
transition arrangement which requires the largest amount of space and therefore may not be
applicable at all locations.
The final type of transition arrangement features a section where the WRSB is physically connected
on to the W-beam, as shown in Figure 11.11. This type of arrangement was originally developed by
the South Dakota Department of Transportation to provide a transition between the strong post W-
beam and low-tension WRSB systems [11]. In 1998, this system was tested in accordance with
NCHRP 350 [1] and successfully met the evaluation criteria of TL-3. However, over the following
years the low-tension WRSB system became a less preferred option with the emergence of the high-
tension proprietary WRSB systems. Over the years several manufacturers of the high-tension
proprietary systems have introduced modified versions of the South Dakota design to fit the needs
of their individual systems. Several of these designs were technically assessed and approved for
use in the USA by the FHWA [11].](https://image.slidesharecdn.com/documento50-1-120-5152borrador-240214213429-246eea16/85/Documento-50-1-120-51-52-borrador-pdf-271-320.jpg)
![ROADSIDE DESIGN GUIDE
PAGE 299
11 TRANSITIONS FIRST EDITION -DECEMBER 2016
11.6.2.3 Wire Rope Safety Barrier to Concrete Barrier
Due to the very flexible nature of wire rope, and the very rigid nature of concrete barriers, these
systems should not be connected directly to each other. Concrete and WRSB are rarely connected
to each other and therefore the number of available designs are limited. The international best
practice to combat this problem consists of untested design recommendations [12], [10]. The
recommended application is to overlap a section of concrete barrier and WRSB, in a configuration
where the distance between the two systems at any point is less than the dynamic deflection (see
Chapter 6, Section 6.3.3.2) of the WRSB. This configuration is shown in Figure 11.12.
*Figure is not to scale and shown for indicative purposes only.
Figure 11.12 - An example of a transition between wire rope barrier and a concrete barrier
In the figure the distance ‘A’ represents the minimum acceptable distance between the concrete
barrier and WRSB. This value should be less than the dynamic deflection of the WRSB. This is to
ensure that enough space is provided behind the WRSB, so in the event of an impact from Approach
1, the barrier would not deflect all the way into the concrete barrier. This prevents a secondary impact
with the concrete barrier. As explained in Chapter 6, Section 6.5.1, the dynamic deflection will change
greatly from one WRSB system to another. Therefore, this value should be provided by the
manufacturer.
The distance ‘B’, shown in Figure 11.12, should also be less than the dynamic deflection of the
WRSB system. This is to ensure that in the event of an impact from the Approach 2, the WRSB does
not deflect into the opposing travelled way. This way a secondary impact with oncoming vehicles is
prevented. As shown in the figure, the measurement for ‘B’ should be made between the edge of
the travelled way and the first point on WRSB, which can be reached by an errant vehicle coming
from Approach 2. The angle of approach can be taken as the impact test angle corresponding to the
test level of the specific WRSB. For example, for a TL-3 WRSB, the approach angle can be taken
as 25° to represent the highest angle, to which the system was tested. The impact angles for different
test levels are provided in Chapter 6, Section 6.3.3. Finally, the flare rate of the WRSB should be
within the appropriate limits. More information on flare rates can be found in Chapter 7, Section 7.4.2.](https://image.slidesharecdn.com/documento50-1-120-5152borrador-240214213429-246eea16/85/Documento-50-1-120-51-52-borrador-pdf-274-320.jpg)
![ROADSIDE DESIGN GUIDE
PAGE 300
11 TRANSITIONS FIRST EDITION -DECEMBER 2016
11.6.2.4 Steel Barrier Approaches to Concrete Barriers
Connections between semi-rigid steel barriers and rigid concrete barriers are particular areas of
concern as they present the potential for a high risk of pocketing and resulting injury. It is for this
reason that the Abu Dhabi Department of Municipal Affairs and Transport has developed a standard
detail for such transitions, as shown in Figure 11.14.
Full details of this transition can be found within Drawing Number R-24 of the Abu Dhabi Standard
Drawings Manual [13]. This is a well-designed transition as there is a gradual increase in post
spacing (and therefore barrier stiffness) on the approach to the rigid barrier system (shown in red),
and a clear connection (capable of withstanding a 330kN loading) into the concrete barrier (shown
in orange). The plan view shows that there is also continuity in the alignment of the barriers through
the transition (shown in green) and no excessive protrusions within the design. However, the
transition could be further improved as the differences in profile between the steel and concrete
systems introduces an exposed step at the end of the concrete barrier which would still prove to be
an area of injury risk for the occupants of an errant vehicle. This area is highlighted on Figure 11.13.
This could be overcome by introducing an additional (rubbing) rail below the main rail and/or by
connecting the barrier into a vertically faced concrete barrier. Both of these approaches have been
implemented within the design shown in Figure 11.2 and will greatly reduce the risk to road users.
The drawing in Figure 10.13 also makes it clear that this transition is only valid for connecting
concrete and semi-rigid guardrail type designs.
Figure 11.13 – Exposed step of concrete barrier](https://image.slidesharecdn.com/documento50-1-120-5152borrador-240214213429-246eea16/85/Documento-50-1-120-51-52-borrador-pdf-275-320.jpg)
![ROADSIDE DESIGN GUIDE
PAGE 301
11 TRANSITIONS FIRST EDITION -DECEMBER 2016
Figure 11.14 - The Abu Dhabi Department of Municipal Affairs and Transport standard detail for transition from guardrail to rigid concrete barrier [13], Refer to latest version.](https://image.slidesharecdn.com/documento50-1-120-5152borrador-240214213429-246eea16/85/Documento-50-1-120-51-52-borrador-pdf-276-320.jpg)
![ROADSIDE DESIGN GUIDE
PAGE 304
11 TRANSITIONS FIRST EDITION -DECEMBER 2016
gradual change in stiffness, height, cross-sectional shape and/or containment from one barrier to
another.
In general, the rigidity of the W-beam systems can be increased by reducing the post spacing, by
using posts with a larger cross section, and/or by using stronger or an increased number of rail
elements.
Transitions should be designed to minimise the probability of snagging by an errant vehicle and one
from the opposing lane on a two-way facility. The snagging of a vehicle may be mitigated through
the use of block-outs between the rail and the posts of the barrier system, or through the addition of
a secondary rail underneath the main containment rail(s), known as a ‘rubbing rail’.
To ensure that significant changes in deflection do not occur within a short distance, the transition
section needs sufficient length.
The transition should be designed so that the height of the transition increases seamlessly from the
lower system to the higher one. The face of the approach rail transition should be smooth.
Drainage features in front of the barrier in the transition area may initiate vehicle instability that can,
in some instances, adversely affect the crashworthiness of the transition. The slope between the
edge of the travelled lane and the barrier should be no steeper than 1V:10H.
In all cases, and due to the high number of transitions which could exist between systems,
acceptance of a transition should be based on one or more of the following methods (in order of
preference):
• Selection of proprietary transition systems which have had full scale impact testing to the
requirements of NCHRP350 or MASH (see Clause 11.3);
• Virtual testing to the requirements of the European Technical Report TR16303-4;
• Good engineering judgement based on the design rules within Section 11.6.
However, it is emphasised that in all cases, transitions should be approved by the Abu Dhabi
Department of Municipal Affairs and Transport prior to specification and installation.
7.8 References
[1] NCHRP, “NCHRP Report 350, Recommended Procedures for the Safety Performance
Evaluation of Highway Features,” Transportation Research Board, National Research Council,
Washington DC, 1993.
[2] AASHTO, Manual for Assesing Safety Hardware (MASH), Washington D.C.: American
Association of State Highway and Transportation Officials, 2009.
[3] H. E. Ross, H. S. Perera, D. L. Sicking and R. P. Bligh, “National Cooperative Highway Research
Program, Report 318: Roadside Safety Design for Small Vehicles,” Transportation Research
Board, Washington, D.C., 1989.
[4] CEN, “EN 1317 Road Restraint Systems - Part 4: Performance classes, impact test acceptance
criteria and test methods for terminals and transitions of safety barriers,” European Committee
for Standardization, Brussels, 2002.](https://image.slidesharecdn.com/documento50-1-120-5152borrador-240214213429-246eea16/85/Documento-50-1-120-51-52-borrador-pdf-279-320.jpg)
![ROADSIDE DESIGN GUIDE
PAGE 305
11 TRANSITIONS FIRST EDITION -DECEMBER 2016
[5] Alberta Infrastructure and Transportation, Roadside Design Guide, Alberta Infrastructure and
Transportation, November 2007.
[6] AASHTO, Roadside Design Guide, 4th Edition, Washington D.C.: American Association of State
Highway and Transportation Officials, 2011.
[7] CEN, “EN 1317 Road Restraint Systems- Part 4 - Draft Ammendments,” Unpublished Draft -
Eurpoean Committee for Standardization, Brussels, 2014.
[8] BSI, “BS6779-1, Highway parapets for bridges and other structures - Part 1: Specification for
vehicle containment parapets of metal construction,” British Standards Institution, London, 1998.
[9] TD19/06 Design Manual for Roads and Bridges, Volume 2 Highway Structures: Design, Section
2 Special Structures, Part 8, The Highways Agency, Transport Scotland, Welsh Assembly
Government, The Department for Regional Development Northern Ireland, 2006.
[10] NZ Transport Agency, “Technical Memorandum, Road Safety Hardware Series, TM-2013, Wire
Rope Safety Barrier Transitions,” New Zealand Transport Agency, Nov 2014.
[11] FHWA, “Memorandum on the Cable Barrier Transitions to W-Beam Guardrail,” US Department
of Transportation, Federal Highway Administration, Washington DC, 2006.
[12] Austroads, Guide to Road Design Part 6: Roadside Design, Safety and Barriers, Sydney, NSW:
Austroads, 2010.
[13] Abu Dhabi DoT, Standard Drawings for Road Projects - Part 3: Road Structures, Abu Dhabi:
Abu Dhabi Department of Transport, 2014.](https://image.slidesharecdn.com/documento50-1-120-5152borrador-240214213429-246eea16/85/Documento-50-1-120-51-52-borrador-pdf-280-320.jpg)
![ROADSIDE DESIGN GUIDE
PAGE 306
12 ECONOMIC ASSESSMENT FIRST EDITION -DECEMBER 2016
8 ECONOMIC ASSESSMENT
8.1 Introduction
Although the number of fatalities from roadside crashes is decreasing every year in the Emirate of
Abu Dhabi, roadside crashes account for a significant portion of the total fatal highway crashes.
Approximately 15 percent are the result of a single vehicle run-off-the-road crash. These casualties
represent a significant loss for the country’s economy and an immeasurable emotional loss for the
families of people who are involved with the incidents.
A significant proportion of these roadside casualties may be prevented by good engineering and
design practices, which would improve the level of safety and decrease the severity of accidents.
From this perspective, well targeted roadside safety improvements can generally be seen as highly
beneficial investments. However, the funds allocated to safety treatments are usually limited and
there are often more than one treatment options applicable to a site. Furthermore, every roadside is
different and the costs and benefits of a certain safety treatment would change from one site to
another. Therefore, the engineer/designer should evaluate the potential safety treatments through
economic assessment on a site-by-site basis so that the highest amount of benefits can be gained
from a limited amount of funds.
There are several methods developed around the world for comprehensive economic assessment
of roadside safety treatments; such as Road Safety Analysis Program (RSAP) [1] in USA, Highway
Safety Manual (HSM) [2] methodology in USA, Road Restraint Risk Analysis Program (RRRAP) [3]
in UK, SAVERS Tool [4] in Europe and the Austroads methods [5] in Australia. These methods all
provide useful ways through which a designer/engineer can carry out economic analysis. However,
almost all of these methods are developed to cater for their respective local conditions, by using
local data. For example, the accident prediction models, which constitute the basis of all these
models, are often developed or calibrated by using local accident, traffic and road geometry data.
Therefore, they may not be as reliable when applied to the local conditions in other regions, including
the Emirate of Abu Dhabi. Furthermore, comprehensive economic analysis often requires a large
amount and variety of data, which currently is not available for every type of road in Abu Dhabi.
Therefore, the designer/engineer may not always have enough data to be able to use the
methodologies mentioned above.
Due to these limitations, this chapter provides a general guidance on roadside safety economic
assessment process, which can help designers/engineers, who only have access to a limited amount
of data. However, designer/engineer can also use the presented methodology to carry out more
detailed economic analyses, if there is enough data to support it. References are also made to the
international methods mentioned above, for those who want to explore further on the related topics.
In the future, as more data become available, the Abu Dhabi Department of Transport may introduce
more comprehensive economic analysis requirements.](https://image.slidesharecdn.com/documento50-1-120-5152borrador-240214213429-246eea16/85/Documento-50-1-120-51-52-borrador-pdf-281-320.jpg)
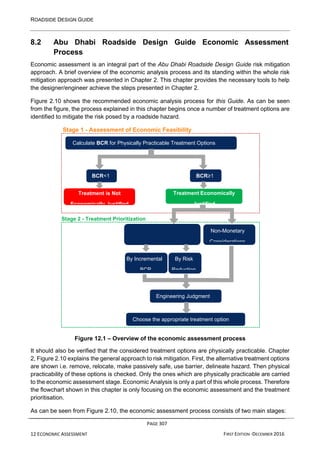
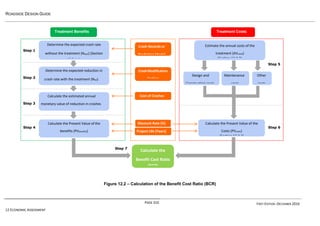
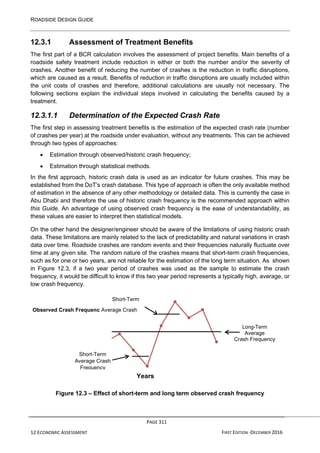
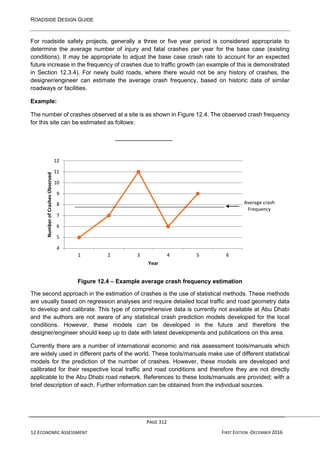
![ROADSIDE DESIGN GUIDE
PAGE 313
12 ECONOMIC ASSESSMENT FIRST EDITION -DECEMBER 2016
• AASHTO - Highway Safety Manual (HSM) [2]: The AASHTO HSM is a three volume
manual, which arguably provides the most comprehensive guidance on quantitative safety
analyses, among the resources available today. Part C of HSM provides a comprehensive
guide to prediction of crashes through development of Safety Performance Functions (SPFs).
SPFs are statistical base models, which are used to estimate the average crash frequency
for a facility type with specified base conditions. Once the SPFs are developed, the predicted
crashes for the base case are then adjusted for specific road characteristics through the use
of Crash Modification Factors (CMFs). The final step of the HSM prediction methods is the
calibration of the estimated crashes for local conditions through the use of a Calibration
Factor.
• Road Safety Analysis Program (RSAP) [1]: The RSAP is a computer program for
performing benefit-cost analysis on roadside design alternatives. The RSAP was originally
developed under NCHRP Project 22-9 and distributed with the 2002 edition of the AASHTO
Roadside Design Guide [6]. The RSAP encroachment module uses a two-step process to
estimate crash frequency. The first step involves estimating a base or average encroachment
rate based on highway type and then multiplying the encroachment rate with the traffic
volume to estimate encroachment frequency. The next step is to adjust the base
encroachment frequency to account for specific highway characteristics that affect
encroachment rates.
• Austroads Guide to Road Design – Part 6 [5]: Part 6 of the Austroads Guide to Road
Design: Roadside Design, Safety and Barriers include a crash frequency prediction model in
Section 4.6. The Austroads prediction model is very similar to the RSAP approach and the
reference is made to the RSAP base encroachment model as one of the recommended
resources. Similar to the RSAP method, the base encroachment rate is then adjusted through
several factors to predict the number of crashes on a specific road configuration. The
adjustment factors used in this model are developed to cater for the local conditions in
Australia.
• Road Restraint Risk Analysis Program (RRRAP) [3]: The RRRAP is roadside risk
assessment software developed as part of the UK design standard Design Manual for Roads
and Bridges (DMRB). The crash frequency prediction module used in RRRAP is similar to a
SPF as described in the HSM. The RRRAP is developed for the UK roads having a speed
limit of 50mph or greater and ADT of 5000 or greater.
• Selection of Appropriate Vehicle Restraint Systems (SAVeRS) [4]: SAVeRS was a cross
border funded research project for the Conference of European Directors of Roads. The final
result of the SAVeRS project was an Excel based barrier selection tool. This tool included a
run-off-road crash prediction module, which was developed and calibrated for Austria, Great
Britain, UK, Ireland, Italy and Sweden, using HSM methodology. The final tool of the SAVeRS
Project can be found at www.saversproject.com.](https://image.slidesharecdn.com/documento50-1-120-5152borrador-240214213429-246eea16/85/Documento-50-1-120-51-52-borrador-pdf-288-320.jpg)
![ROADSIDE DESIGN GUIDE
PAGE 315
12 ECONOMIC ASSESSMENT FIRST EDITION -DECEMBER 2016
literature for many different types of treatments. Ideally, if available, the CMFs which are developed
with local data, for local conditions should be used. However, currently there are no CMFs developed
specifically for Abu Dhabi. In the future, as more data become available, research studies may
develop CMFs, which are specific to Abu Dhabi. Therefore, the engineer/designer should be
responsible of keeping their knowledge up to date. In the absence of local alternatives, internationally
developed CMFs may be used. However, when using these CMFs, the designer/engineer should
refer to the source research and understand the conditions under which the CMFs were estimated.
Some CMFs are developed for a particular type of crash, for example only run-off-road crashes,
while others may relate to all crashes recorded at a site. Similarly, some CMFs are developed to
predict certain types of incident severity, such as fatal crashes, injury crashes, property-damage only
crashes, whilst others are developed for all crashes, without the detail of severity. Sometimes
multiple CMFs may be available for the same treatment, from different research studies. In such a
case the designer/engineer should analyse and choose the one which suits the site under evaluation.
There are new CMFs being developed every day. The designer/engineer should check for new
research for updated and better fitting CMFs. A good resource for finding up to date CMFs is the
website: Crash Modification Factors Clearinghouse [7], which is funded by the U.S. Department of
Transport Federal Highway Administration and maintained by the University of North Carolina
Highways Safety Center. This website is a regularly updated online database of published CMFs,
including the CMFs from the HSM. It includes a search function, through which the designer/engineer
can find specific CMFs for many different types of safety treatments. References are also made to
each individual research, for more detailed information on each of the CMFs published on the
website.
Another good resource for CMFs is the Austroads Research Report – Improving Roadside Safety
[8]. This report provides a comprehensive literature review into the available roadside safety related
CMFs. There are many useful CMFs identified and presented within this report.
Table 12.1 presents a list of CMFs, which are selected from the international literature available. The
table does not contain every single published CMF to date and it is provided for guidance only. It is
the responsibility of the designer/engineer to understand the limitations by referring to the source
research. If they become available in the future, the designer/engineer should prefer CMFs which
are developed for local conditions.](https://image.slidesharecdn.com/documento50-1-120-5152borrador-240214213429-246eea16/85/Documento-50-1-120-51-52-borrador-pdf-290-320.jpg)
![ROADSIDE DESIGN GUIDE
PAGE 316
12 ECONOMIC ASSESSMENT FIRST EDITION -DECEMBER 2016
Table 12.1 – Example roadside safety related CMFs from the literature
Type of Treatment CMF
Severity
Level
Crash
Type
Source
Hazard Removal, Relocation, Modification
Clear Zone Related
Remove or relocate fixed
hazards outside of clear
zone
0.29
Fatal
&
Injury
Run-off-
road
[9]
Relocate hazard (utility pole) -
increase in lateral offset by
1.5m
0.67 Injury
Run-off-
road
crashes
into utility
poles
[10]
On two-lane rural
roads, increase
roadside recovery
distance by:
1.5m 0.87
All Crashes*
Run-off-
road
[11]
2.4m 0.79
3.0m 0.75
4.6m 0.65
Reducing the number of hazards
Reduce
number
of poles
per
km
from 38 to 25 per
km
0.75
All Crashes*
All Crashes [11]
from 25 to 13 per
km
0.75
from 38 to 13 per
km
0.5
Traversable Side Slopes
On
Rural
two-
lane
roads
Flatten
Side Slope
from
1V:2H
to 1V:4H 0.90
All Crashes* Single
Vehicl
e
[2]
to 1V:5H 0.85
to 1V:6H 0.79
to 1V:7H 0.73
Flatten
Side Slope
from
1V:3H
to 1V:4H 0.92
to 1V:5H 0.86
to 1V:6H 0.81
to 1V:7H 0.74
Flatten
Side Slope
from
1V:4H
to 1V:5H 0.94
to 1V:6H 0.88
to 1V:7H 0.81
Flatten
Side Slope
from
1V:5H
to 1V:6H 0.94
to 1V:7H 0.86
Flatten
Side Slope
from
1V:6H
to 1V:7H 0.92](https://image.slidesharecdn.com/documento50-1-120-5152borrador-240214213429-246eea16/85/Documento-50-1-120-51-52-borrador-pdf-291-320.jpg)
![ROADSIDE DESIGN GUIDE
PAGE 317
12 ECONOMIC ASSESSMENT FIRST EDITION -DECEMBER 2016
On
Rural
multilan
e
highway
s
Change
Side Slope
from
1V:7H
1V:7H or
flatter 1.00
All Crashes*
All Crashes [2]
to 1V:6H 1.05
to 1V:5H 1.09
to 1V:4H 1.12
to 1V:2H
or steeper 1.18
* All Crashes include Fatal, Injury and Property Damage Only](https://image.slidesharecdn.com/documento50-1-120-5152borrador-240214213429-246eea16/85/Documento-50-1-120-51-52-borrador-pdf-292-320.jpg)
![ROADSIDE DESIGN GUIDE
PAGE 318
12 ECONOMIC ASSESSMENT FIRST EDITION -DECEMBER 2016
Table 12.1 - Example roadside safety related CMFs from the literature (continued)
Type of Treatment CMF
Severity
Level
Crash
Type
Source
Hazard Removal, Relocation, Modification
Drainage Structures
Lengthen or extend culvert further
away from the road 0.56
All
Crashes* All
Crashes
[12]
Widen and flatten culvert outlets 0.00
Fatal
&
Injury
All
Crashes
[13]
Passively Safe Poles
Replace rigid pole with passively
safe poles (slip-base, impact
absorbing, etc.)
0.6
All
Crashes*
Run-off
Road
Crashes
on
Straight
[14]
0.4 Fatal All
Crashes
[9]
0.7 Injury All
Crashes
[9]
Move utility services
underground
0.6
All
Crashes* All
Crashes
[12]
Remove lighting poles in urban
area
0.6 Injury All
Crashes
[15]
Hazard Shielding
Roadside & Median Barriers
New semi-rigid roadside
barrier installation
0.7
All
Crashes*
Run-off-
road
[16]
0.44 Fatal
0.77 Injury
0.74 Fatal
&
Injury
0.66
Propert
y
Damag
e Only
Semi-rigid roadside barrier
installation on inside of
curves
0.72
Fatal
&
Injury
All
Crash
Types
[9]](https://image.slidesharecdn.com/documento50-1-120-5152borrador-240214213429-246eea16/85/Documento-50-1-120-51-52-borrador-pdf-293-320.jpg)
![ROADSIDE DESIGN GUIDE
PAGE 319
12 ECONOMIC ASSESSMENT FIRST EDITION -DECEMBER 2016
Semi-rigid roadside barrier
installation on outside of
curves
0.37
Fatal
&
Injury
All
Crash
Types
[9]
Changing barrier along
embankment to less
rigid type
0.68 Injury Run-off-
road
[2]
0.59 Fatal
* All Crashes include Fatal, Injury and Property Damage Only](https://image.slidesharecdn.com/documento50-1-120-5152borrador-240214213429-246eea16/85/Documento-50-1-120-51-52-borrador-pdf-294-320.jpg)
![ROADSIDE DESIGN GUIDE
PAGE 320
12 ECONOMIC ASSESSMENT FIRST EDITION -DECEMBER 2016
Table 12.1 - Example roadside safety related CMFs from the literature (continued)
Type of Treatment CMF
Severity
Level
Crash
Type
Source
Hazard Shielding
Roadside & Median Barriers (continued)
Installation of continuous
flexible barrier on
roadsides ad in medians
on a
rural
freewa
y
0.21 Injury
Run-
off-
road
and
cross-
median
head-
on
[17]
0.13
Seriou
s
Injury
on an
urban
freewa
y
0.14 Injury
0.17
Seriou
s
Injury
For ADT of
20,000 to
60,000 on
multilan
e
divided
highway
s
Install any type of
median barrier
0.57 Fatal
All Crashes [2]
0.7 Injury
1.24
All
Crashes*
Install steel median
barrier
0.65 Injury
Install cable median
barrier
0.71 Injury
Crash Cushions
Install Crash Cushion
0.31 Fatal
Fixed
object
Impact
s
[18]
0.31 Injury
0.54
Propert
y
Damag
e Only
* All Crashes include Fatal, Injury and Property Damage Only
Example:
The expected average crash frequency without treatment (Nwot) with a fixed object at a roadside
is estimated to be 4 injury crashes per year. It is planned to install a crash cushion in front of the
hazardous object to decrease the frequency of injurious accidents. Using
Table 12.1, a CMF=0.31 is chosen to estimate the decrease in injury accidents with fixed object
impacts, caused by a crash cushion installation.
Using Equation 12.3,
Nwt = Nwot× CMF](https://image.slidesharecdn.com/documento50-1-120-5152borrador-240214213429-246eea16/85/Documento-50-1-120-51-52-borrador-pdf-295-320.jpg)

![ROADSIDE DESIGN GUIDE
PAGE 322
12 ECONOMIC ASSESSMENT FIRST EDITION -DECEMBER 2016
Therefore, the reduction in injury crash frequency, due to the installation of a crash cushion is
estimated as: 4.0 − 1.24 = 2.76 injury crashes per year. In other words a 69% reduction in the number
of accidents with an injurious outcome is expected.
12.3.1.3 Conversion of Benefits into a Monetary Value
Once the reduction in the annual crash frequency due to a treatment is estimated, these values
should then be converted into a monetary value. This can be achieved by multiplying the estimated
reduction in the crash frequency with the average societal cost of crashes as shown in Equation
12.5.
Equation 12.5
Where:
y = Year in the service life of the treatment
AVbenefits(y) = Annual Monetary Value of Benefits for year y
Cc = Average Societal Cost of a Crash
Nwt (y)= Expected Average Crash Frequency at the site for year y with treatment
Nwot (y) = Expected Average Crash Frequency at the site for year y without treatment
As can be seen from Equation 12.5, in order to calculate the monetary benefits of a treatment,
average societal crash costs (Cc) are required. Table 12.2 provides the average crash costs by
severity for Abu Dhabi. This table is only provided as an example. The designer/engineer should
always justify the reasoning behind the selected crash costs for a specific project.
Table 12.2 –Average societal costs of crashes [19]
Accident Type by Severity Per Crash (AED)
Fatal 2,596,212
Serious Injury 1,044,122
Moderate Injury 111,262
Minor Injury 49,508
Weighted Average for All Injuries including Fatal 460,413
Property Damage Only (PDO) 10,418
As can be seen from Table 12.2, the average societal costs may be available for individual types of
accidents by severity. Therefore Equation 12.5, in theory, can be applied to calculate the AVbenefits for
crash types of different severity. However, CMFs and the expected crash frequency estimations do
not always differentiate between fatal, serious and slight injury accidents. As a result, it is usually not
possible to estimate the number of expected crashes individually for different types of severity. For
this reason the usual practice is to establish an average societal cost that is representative of a
combined fatal/injury crash. This can be achieved by weighting the average crash costs by the
number of crashes in each type of severity. This is done for the 2009 values](https://image.slidesharecdn.com/documento50-1-120-5152borrador-240214213429-246eea16/85/Documento-50-1-120-51-52-borrador-pdf-297-320.jpg)
![ROADSIDE DESIGN GUIDE
PAGE 325
12 ECONOMIC ASSESSMENT FIRST EDITION -DECEMBER 2016
• Treatment Option 2: Replace the rigid lighting columns with a passively safe alternative
design;
• Treatment Option 3: Shield the rigid lighting columns with a semi-rigid barrier;
The Facts:
The roadway agency has analysed the crash history along the road under evaluation and decided
the following frequency is a good estimation of the expected casualty crashes (fatal/injury) with rigid
lighting poles, if the roadside is left in its current condition:
• Nwot = 0.4 casualty crashes per year.
A 2% annual increase in the crash frequency is also estimated, as a result of the expected future
increase in traffic volume in the area.
Following a literature review, the following CMFs were identified as suitable for the proposed
treatment options (see Table 12.1):
CMF1 = 0.29, “Remove or relocate fixed hazards outside of clear zone, for fatal & injury, run-off-
road crashes [9]”
• CMF2 = 0.60 “Replace rigid pole with passively safe poles (slip-base, impact absorbing,
etc.), for fatal & injury, Run-off Road Crashes on Straight [14]”
• CMF3 = 0.74 “New semi-rigid roadside barrier installation, for fatal & injury, run-off-road
crashes [16]”
The roadway agency finds the societal crash costs shown in Table 12.2 acceptable. The agency
decided to conservatively estimate the economic benefits of countermeasures. Therefore, they are
using the average injury crash cost (i.e. the weighted average of all severities including fatal) as the
crash cost value (Cc) representative of the predicted fatal and injury crashes.
• Cc= AED460,413
The discount rate (i) is accepted as the following:
• i = 4.0%
The evaluation period (Ep) is selected as the following:
• Ep= 10 years – Please note that 10 years is chosen, to keep the length of calculations and
the space required for this example at a reasonable limit. In reality, the design life of the
treatment is likely to be chosen as the analysis period.
The costs of each treatment option are estimated as follows:
• Treatment Option 1: An initial construction cost of AED 166,800, with negligible annual
costs in the following years.
• Treatment Option 2: An initial construction and equipment cost of AED 150,000, with an
annual repair and maintenance cost of AED 6,255 in the following years.](https://image.slidesharecdn.com/documento50-1-120-5152borrador-240214213429-246eea16/85/Documento-50-1-120-51-52-borrador-pdf-300-320.jpg)
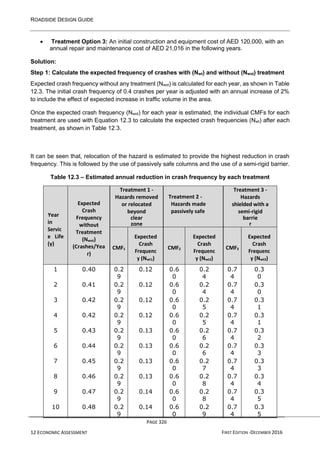

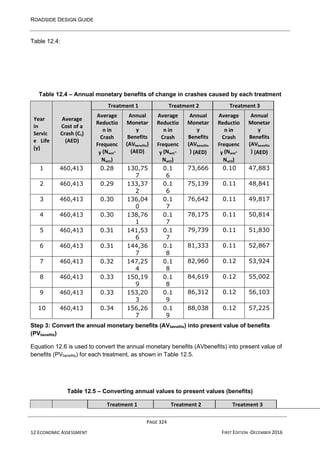
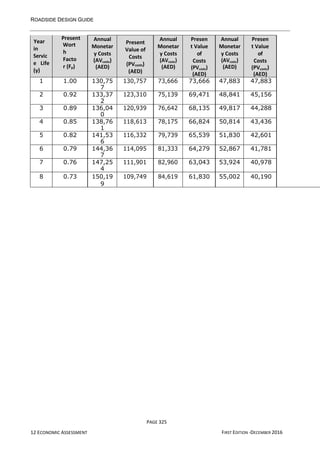
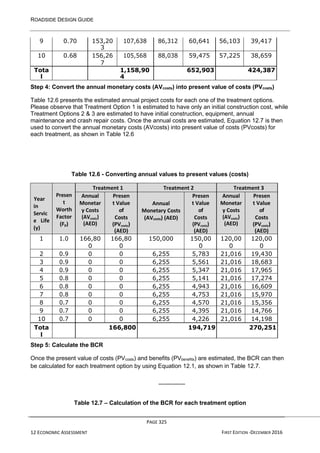
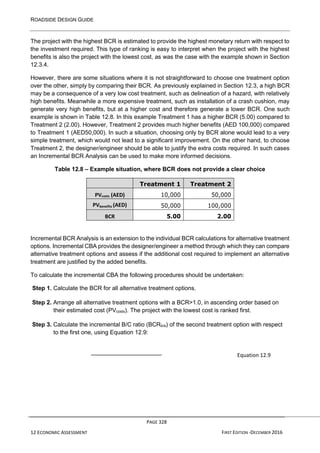
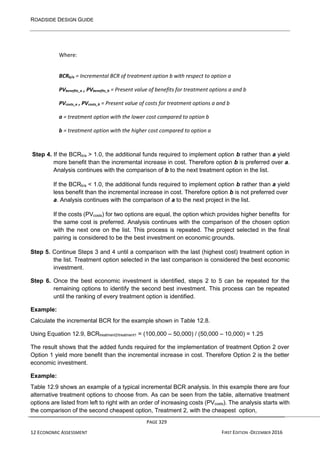
![ROADSIDE DESIGN GUIDE
PAGE 331
12 ECONOMIC ASSESSMENT FIRST EDITION -DECEMBER 2016
decisions are done through the software RRRAP [3]. The RRRAP calculates the risk for each
treatment option and expresses the risk in equivalent fatalities per 100million vehicle km travelled. If
the risk after a treatment is expected to be above a certain value (this value is currently not public
information), the level of risk and therefore the treatment option is considered unacceptable [20].
Similarly the road authority or the designer/engineer may choose to rank the alternative treatment
options from a number of different risk reduction measures. These measures include:
• Monetary value of treatment benefits;
• Total number of crashes reduced;
• Number of fatal and incapacitating injury accidents reduced;
• Number of fatal and injury crashes reduced.
As an outcome of a ranking procedure, the project list is ranked high to low on any one of the above
measures. At this point the road authority or the designer/engineer may choose to set a certain level
of risk reduction as a minimum and eliminate any treatment options which do not provide the
minimum desired level of risk reduction. Many simple improvement decisions, especially those
involving only a few sites and a limited number of project alternatives for each site can be made by
reviewing rankings based on two or more of these criteria.
Example:
Table 12.10Table 12.10 presents an example scenario which demonstrates how the amount of risk
reduction provided can affect the final decision, in treatment selection. According to this scenario,
the road authority has a set goal of decreasing the frequency of injury accidents by 50% within the
next 10 years. A problematic site is chosen for safety improvements. There are three alternative
treatment options identified to decrease the frequency of injury crashes observed at the site.
Table 12.10, the first treatment option is estimated to provide a 35% reduction, while treatment
options 2 and 3 are estimated to provide 60% and 70% reduction respectively. In-line with their
casualty reduction targets, the road authority does not consider a 35% reduction high enough.
Therefore treatment option 1 is discarded. An incremental BCR is calculated between options 2 and
3 as follows:
BCRtreatment3/treatment2 = (350,000 – 300,000) / (190,000 – 150,000) = 1.25
As the BCR is larger than 1.0, the treatment option 3 is chosen over treatment 2.
Table 12.10 – Example of ranking by risk reduction
Treatment
Option 1
Treatment
Option 2
Treatment
Option 3
% Reduction in Crashes 35% 60% 70%
PVcosts (AED) 14,000 150,000 190,000
PVbenefits (AED) 175,000 300,000 350,000
BCR 12.5 2.0 1.8](https://image.slidesharecdn.com/documento50-1-120-5152borrador-240214213429-246eea16/85/Documento-50-1-120-51-52-borrador-pdf-311-320.jpg)
![ROADSIDE DESIGN GUIDE
PAGE 334
12 ECONOMIC ASSESSMENT FIRST EDITION -DECEMBER 2016
8.6 References
[1] K. K. Mak and D. L. Sicking, “NCHRP 492 - Roadside Safety Analysis Program (RSAP)
Engineer's Manual,” Transportation Research Board, Washington, D.C., 2003.
[2] AASHTO, Highway Safety Manual, 1st Edition, Washington D.C.: American Association of
Highway and Transportation Officials, 2010.
[3] TD19/06 Design Manual for Roads and Bridges, Volume2 Highway Structures: Design, Section
2 Special Structures, Part 8, The Highways Agency, Transport Scotland, Welsh Assembly
Government, The Department for Regional Development Norther Ireland, 2006.
[4] CEDR, “SAVERS (Selection of Appropriate Vehicle Restraint Systems),” Conference of
European Directors of Roads, 2015.
[5] Austroads, Guide to Road Design Part 6: Roadside Design, Safety and Barriers, Sydney, NSW:
Austroads, 2010.
[6] AASHTO, Roadside Design Guide, Washington D.C.: American Association of Highway and
Transportation Officials, 2002.
[7] University of North Carolina Highway Safety Research Center, “Crash Modification Factors
Clearinghouse,” U.S. Department of Transport Federal Highway Administration, [Online].
Available: http://www.cmfclearinghouse.org/. [Accessed 26 10 2015].
[8] C. Jurewicz, L. Steinmetz, C. Phillips, G. Veith and J. McLean, “Improving Roadside Safety,
Stage 4 - Interim Report (AP-R436-14),” Austroads, Sydney, Australia, 2014.
[9] A. Gan, J. Shen and A. Rodriguez, “Update of Florida crash reduction factors and
countermeasures to improve the development of district safety improvement projects: final
report,” Florida Department of Transportation, Tallahassee, FL, USA, 2005.
[10] C. V. Zageer, “SETTING PRIORITIES FOR REDUCING UTILITY POLE CRASHES,”
Transportation Research Circular, no. E-C030, pp. 9-31, 2001-4.
[11] C. Zegeer, J. Hummer, D. Reinfurt, L. Herf and W. Hunter, “Safety cost-effectiveness of
incremental changes in cross-section design: informational guide, report FHWA/RD-87/094,”
Federal Highway Administration, Washington, DC, USA, 1987.
[12] Federal Highway Administration, Toolbox of countermeasures and their potential effectiveness
for roadway departure crashes, Washington, DC, USA: FHWA, 2008.
[13] B. Corben and S. Newstead, Evaluation of the 1992-1996 Transport Accident Commission
funded accident blackspot treatment program in Victoria, report 182, Melbourne, Vic.: Monash
University Accident Research Centre, 2001.
[14] Roads and Traffic Authority, Accident reduction guide Part 1: accident investigation and
prevention, report TD2004/RS01, Sydney, NSW: RTA, 2004.
[15] VicRoads, ‘Road safety program: guidelines for the selection of projects under the road
conditions sub-program (incorporating accident blackspot projects, mass action projects,](https://image.slidesharecdn.com/documento50-1-120-5152borrador-240214213429-246eea16/85/Documento-50-1-120-51-52-borrador-pdf-314-320.jpg)
![ROADSIDE DESIGN GUIDE
PAGE 335
12 ECONOMIC ASSESSMENT FIRST EDITION -DECEMBER 2016
railway level crossing projects)’, Kew, Vic: VicRoads, 1990.
[16] Arizona Department of Transportation, Traffic engineering policies, guides and procedures:
section 231: benefit/cost ratio economic analysis, Phoenix, AZ, USA: Arizona DOT, 2009.
[17] N. Candappa, A. D’Elia, B. Corben and S. Newstead, Evaluation of the effectiveness of flexible
barriers along Victorian roads: final report, report 291, Clayton, Vic: Monash University Accident
Research Centre, 2009.
[18] R. Elvik, A. Hoye, T. Vaa and M. Sorensen, The handbook of road safety measures, 2nd edition,
Bingley, UK: Emerald, 2009.
[19] Abu Dhabi Department of Transport, Summary of Crash and Injury Costs, 2009.
[20] Mouchel Parkman, “Guidance on the use of the Road Restraint Risk Assessment Process
(RRRAP) associated with TD 19/06,” Mar 2011. [Online]. Available:
http://www.standardsforhighways.co.uk/tech_info/rrrap.htm. [Accessed 20 October 2015].](https://image.slidesharecdn.com/documento50-1-120-5152borrador-240214213429-246eea16/85/Documento-50-1-120-51-52-borrador-pdf-315-320.jpg)
![ROADSIDE DESIGN GUIDE
PAGE 336
13 URBAN ROADSIEDDESIGN FIRST EDITION -DECEMBER 2016
9.2 Hazards on the Sidewalk
With constrained space next to the roadside the sidewalk becomes a natural location for many
features that have the potential to present hazards to road users. These include poles for road signs
and signals; utility poles and cabinets; bus stops and shelters; refuse bins; public seating and cycle
parking. Where streets are significantly used for shopping or cafes there may be advertising boards
and stalls/kiosks for street vendors. There may also be pedestrian guard railings, and trees.
It is important to distinguish between hazards to errant vehicles encroaching on to the sidewalk, and
hazards to pedestrians on the sidewalk. In the latter case the main risk is from errant vehicles,
although consideration also needs to be given to the risks (including trips and falls) to pedestrians,
and the obstruction caused by poorly designed features on the sidewalk. Strategies to minimise risk
of conflict between motor vehicles and pedestrians are detailed in Section 13.4.
From the perspective of vehicles travelling along the carriageway, the following hazards are
presented by features on the sidewalk [1]:
• Collision in the event that the vehicle leaves the carriageway;
• Reduced sightlines;
• Adverse impacts on lane position, including encroachment into adjacent or opposing lanes
if drivers feel it necessary to increase their passing distance;
• The risk of contact with protruding parts of the vehicle (e.g. mirrors) and the overhang of
long vehicles.
It is recommended that a minimum clear-zone of 0.5m should be provided (0.9m at intersections) to
avoid the problems listed above. Ideally, this should be 1.2m from the curb [1]; research undertaken
in the United States in 2008 showed that 80% of crashes in an urban environment involved an object
with lateral offset equal to or less than 1.2m [2]. The clear-zone value of 0.5m should be considered
the minimum standard and where space constraints permit the value of 1.2m should be used,
especially at a number of potential high risk zones as detailed in Section 13.3.2.
In most urban environments breakaway designs are not necessary, they should generally be used
for structures less than 1.8m from the curb on roads with a posted speed limit of 80km/h or above,
which will be limited to urban Expressways and Freeways. However, the use of breakaway designs
can still be considered for lower speed roads if necessary, especially in higher risk zones. There are
exceptions to the use of breakaway designs, for example except for bus shelters or locations with
very high pedestrian flows (the risk to pedestrians arises chiefly from the errant vehicle rather than
anything they might hit, and with the exception of crash barriers, the majority of features that might
be installed in the footway are not intended to stop stray vehicles and would not be effective in doing
so even if designed not to break).
For roadside furniture, the following examples generally are not considered a roadside hazard in the
urban environment at operating speeds less than 60km/h:
• Street furniture such as pedestrian railing, bollards, bins, benches;
• Furniture not within the roadside clear zone; and
• Furniture located behind a roadside barrier.](https://image.slidesharecdn.com/documento50-1-120-5152borrador-240214213429-246eea16/85/Documento-50-1-120-51-52-borrador-pdf-317-320.jpg)
![ROADSIDE DESIGN GUIDE
PAGE 338
13 URBAN ROADSIEDDESIGN FIRST EDITION -DECEMBER 2016
13.3.2.1 On Horizontal Curves
Hazards next to curved sections of road should be regarded as presenting greater risks. Vehicles
are more likely to leave the carriageway on the outside of curves and there is a greater likelihood of
encroachment by overhanging long vehicles. It is therefore recommended that greater clearance
distances are provided at such high risk locations.
It is recommended that at least 1.8m lateral clearance is provided from the face of the curb on the
outside of a curve whilst maintaining 1.2m offset elsewhere. Where there is no vertical curb provision
then this clearance should be increased to 3.6m [1]. Figure 13.1 shows an example of a curbed
curve.
A further consideration is to ensure that the drivers’ line of sight is maintained around the curve. As
such a clear zone should also be maintained on the inside of the curve, albeit over a shorter distance,
as shown in Figure 13.1 [1]. Obstructions on the inside of a horizontal curve, which continue for a
considerable length and interfere with the line of sight on a continuous basis, can include roadside
barriers, walls and buildings. However, in general, obstructions such as traffic signs and utility poles
are not considered for this purpose.
Figure 13.1 – Lateral offset for objects at horizontal curves on curbed facilities [1]
13.3.2.2 At Merge Locations
Lane merge locations, which in urban areas include places such as the ends of bus stop bays,
present an increased risk of conflict between vehicles on the road, and hence of vehicles leaving the
road, especially if they fail to merge and continue in their previous path to avoid a crash.
It is recommended that a 3.7m clear zone is maintained in the vicinity of the taper point, as shown
in Figure 13.2. Research shows that longitudinal placement of objects within approximately 3.1m of
the taper point, increases the frequency of roadside crashes in this location [1]. For this reason it is
recommended that the clear zone should be extended at least 3.1m beyond the taper point as shown
in Figure 13.2.](https://image.slidesharecdn.com/documento50-1-120-5152borrador-240214213429-246eea16/85/Documento-50-1-120-51-52-borrador-pdf-319-320.jpg)
![ROADSIDE DESIGN GUIDE
PAGE 339
13 URBAN ROADSIEDDESIGN FIRST EDITION -DECEMBER 2016
Figure 13.2 – Lateral offset at merge locations [1]
13.3.2.3 At Driveways
The risk of roadside crashes is increased at driveways, for several reasons. As at any intersection
there is greater risk of conflict between vehicles entering or leaving the driveway and those on the
main carriageway. There is also a loss of delineation of the edge of the carriageway where there is
no white line, which is common in urban areas, increasing the risk that drivers will misjudge the
boundary of the road, leading to increased risk of collision with objects on the far side of the driveway.
Furthermore, at driveways there is no curb to provide redirection of errant vehicles. For these
reasons increased clearance zones are recommended on the far side of the driveway, a lateral offset
of 3.0 to 4.6m should be provided [1]. Furthermore, visibility triangles for vehicles exiting the driveway
should be clear of obstructions; these should be relocated, removed or lowered. The offset distance
will vary along with the extent of the visibility triangle depending on the design or operating speed of
the major road, as specified in the relevant design standards. The lateral offsets at driveways are
shown in Figure 13.3.
Figure 13.3 – Lateral offset at driveways [1]](https://image.slidesharecdn.com/documento50-1-120-5152borrador-240214213429-246eea16/85/Documento-50-1-120-51-52-borrador-pdf-320-320.jpg)
![ROADSIDE DESIGN GUIDE
PAGE 340
13 URBAN ROADSIEDDESIGN FIRST EDITION -DECEMBER 2016
13.3.2.4 At Intersections
Crashes disproportionately occur at intersections, where there is greater potential for conflicting
manoeuvres, as well as a greater concentration of roadside infrastructure, such as signposts, traffic
signal poles and cabinets, lighting; and potentially traffic islands and bollards. The risk of errant
vehicles leaving the carriageway is increased by the presence of dropped curbs at pedestrian
crossings. Furthermore, there is a risk that turning vehicles will not follow the intended turning path
and will encroach into the sidewalk area, with greater risk of collision with roadside objects.
Design approaches for managing these risks are described below.
• Objects on the inside of turning movements should be as far as possible from the curb. It is
recommended that a clearance zone of 1.8m (with a minimum of 0.9m) is provided [1];
• Where there are dropped curbs for pedestrian crossings, objects should not be positioned
in the path that an errant vehicle would follow if directed up the access ramp [1];
• Traffic islands should be clearly visible to drivers while not encroaching in their path, and
should conform to the appropriate design guidance [3].
Similar to driveways in Section 13.3.2.3, adequate sight distance should be available for a driver to
perceive potential conflicts and to perform the actions needed to negotiate the intersection safely. A
visibility triangle is determined that allows a driver approaching an intersection to observe the actions
of vehicles on the crossing leg(s). This involves establishing the needed sight triangle by determining
the legs of the triangle on the two crossing roadways. Within this clear sight triangle, any object that
would obstruct the driver’s view should be removed, lowered or lateral offset increased. The
obstructions can include buildings, parked or turning vehicles, trees, hedges, plantings, signs, fences
and retaining walls.
Figure 13.4 provides details for constructing and measuring visibility triangle and the subsequent
offset requirements. The lateral offset will vary depending on the design or operating speed of the
major road and the intersection layout, as specified in the relevant design standards.
Figure 13.4 – Clear sight viewing triangle for viewing traffic approaching from the left [3]](https://image.slidesharecdn.com/documento50-1-120-5152borrador-240214213429-246eea16/85/Documento-50-1-120-51-52-borrador-pdf-321-320.jpg)
![ROADSIDE DESIGN GUIDE
PAGE 341
13 URBAN ROADSIEDDESIGN FIRST EDITION -DECEMBER 2016
13.3.2.5 Roundabouts
Special consideration should be applied to roundabouts with regard to the lateral offset of objects.
Similar to horizontal curves, there is an increased likelihood of encroachment by overhanging long
vehicles. It is therefore recommended that greater clearance distances are provided these locations.
Furthermore, the position of objects relative to the curbs at a roundabout is influenced by speed and
possible errant vehicles. In particular, give care to the placement of objects along the exit leg of the
roundabout to consider potential paths of errant vehicles and within the central island on the entry
legs.
It is recommended that at least 1.2m lateral clearance is provided from the face of the curb on the
outside of a roundabout through the circulatory carriageway. Where possible objects should not be
placed alongside the exit leg through the exit radius, but where necessary the clearance of 1.2m
should be maintained. On entry to the roundabout any poles or other furniture in the direct path of a
potential errant vehicle should be of breakaway or frangible design.
9.4 Pedestrian Facilities
Pedestrian facilities include:
• Sidewalk/pathways;
• Pedestrian crossing locations;
• Pedestrian crossing design (type of crossing);
• Dropped curbs (curb ramps).
Sidewalks and pedestrian facilities generally do not pose a hazard to motorists. The safety concern
for locating these facilities adjacent to the road is the risk to the pedestrians using the facilities.
Guidance for the use of sidewalks on urban streets is in the Abu Dhabi Road Geometric Design
Manual [3].
Table 13.1 describes common strategies for eliminating or minimizing motor vehicle–pedestrian
crashes at roadside locations.
The approach taken to design should take into account the local context and function of the road or
street. For higher speed roads, such as urban freeways, the ‘movement’ function dominates, and
the focus would be on physically separating pedestrians from the traffic flow. For a shopping or
residential street in an urban centre the ‘place’ function dominates, and the focus would be on
reducing traffic speed and flow, giving space to pedestrians and facilitating freedom of movement.
An additional feature of the roadside environment is a pedestrian buffer area (often referred to as a
buffer strip). As shown in Figure 13.5, the pedestrian buffer is a physical distance separating the
sidewalk and the vehicle travelled way. Buffer areas often accommodate on-street parking, transit
stops, street lighting, planting areas for landscape materials, and common street features. Buffer
strips may be either planted or paved, and they are encouraged for use between urban roadways
and their companion sidewalks.](https://image.slidesharecdn.com/documento50-1-120-5152borrador-240214213429-246eea16/85/Documento-50-1-120-51-52-borrador-pdf-322-320.jpg)
![ROADSIDE DESIGN GUIDE
PAGE 342
13 URBAN ROADSIEDDESIGN FIRST EDITION -DECEMBER 2016
Table 13.1 - Design strategies to protect pedestrians in motor vehicle crashes [1]
Purpose Strategy
Reduce motor vehicle–pedestrian crash
likelihood at roadside locations
• Provide continuous pedestrian facilities
• Provide safe crossing facilities that are
conveniently located for desire lines
• Install pedestrian refuge medians or
channelized islands
• Offset pedestrian locations away from
travelled way with pedestrian buffers
• Physically separate pedestrians from
travelled way at high-risk locations
• Improve sight distance by removing objects
that obscure driver or pedestrian visibility
Reduce severity of motor vehicle–pedestrian
crashes at roadside locations
• Reduce roadway design speed, operating
speed, or both in high pedestrian volume
locations
Figure 13.5 – Example of a pedestrian buffer area
Guidance on recommended clearance distances between pedestrians and vehicular traffic has been
issued in the Roadside Design Guide for Dubai, reproduced, but amended to suit Abu Dhabi
requirements, in Table 13.2.](https://image.slidesharecdn.com/documento50-1-120-5152borrador-240214213429-246eea16/85/Documento-50-1-120-51-52-borrador-pdf-323-320.jpg)
![ROADSIDE DESIGN GUIDE
PAGE 343
13 URBAN ROADSIEDDESIGN FIRST EDITION -DECEMBER 2016
Table 13.2 - Clearances between pedestrians and vehicular traffic [4]
Road class
Desirabl
e
Clearanc
e
Minimu
m
Clearanc
e
Absolute
Minimum
Clearance
Comments
Freeway
Equal to or
greater than
the clear
zone width
(see Ch.
3)
Equal to
the clear
zone width
(see Ch. 3)
Where it is absolutely
necessary to provide
for pedestrians within
the right-of-way the
clearance may only be
reduced if
appropriate vehicle
restraint systems are
installed.
As a general rule pedestrians
should not have access to
the right-of-way. However, if
a sidewalk or walkway is
required, pedestrians are to
be excluded from access to
the roadway by means of a
suitable barrier.
Expressway
Equal to or
greater than
the clear
zone width
(see Ch.
3)
Equal to
the clear
zone width
(see Ch. 3)
Where it is absolutely
necessary to provide
for pedestrians within
the right-of-way, the
clearance may only be
reduced if
appropriate vehicle
restraint systems are
installed.
Pedestrians are in general to
be excluded from
expressways by suitable
barrier and fencing or grade
separation. Where access is
required connecting
walkways should be provided
with vehicle restraint system
separation.
Arterial
Roads
Equal to or
greater than
the clear
zone width
(see Ch. 3)
Speed limit
≥80 km/h:
2.0m
Speed limit
<80 km/h:
1.2m
Speed limit ≥ 80
km/h: 1.2m
Speed limit < 80
km/h: 0.5m
If curbside parking is
permitted, the sidewalk may
extend to the back of the
curb. On high speed roads (≥
80 km/h) the provision of
suitable barriers should be
considered if pedestrian
activity is high and minimum
clearance cannot be
achieved.
Collector
Roads
Equal to or
greater than
the clear
zone width
(see Ch.
3).
Sidewalk can be immediately
adjacent to curb
Often there will be a
parking lane which provides
separation between
pedestrians and moving
vehicles.
Local Roads Sidewalk can be immediately adjacent to curb
Generally there will be a
parking lane which provides
separation between
pedestrians and moving
vehicles.](https://image.slidesharecdn.com/documento50-1-120-5152borrador-240214213429-246eea16/85/Documento-50-1-120-51-52-borrador-pdf-324-320.jpg)
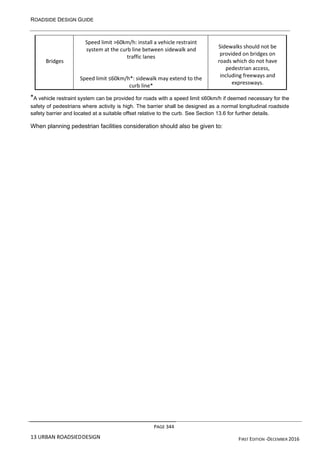
![ROADSIDE DESIGN GUIDE
PAGE 345
13 URBAN ROADSIEDDESIGN FIRST EDITION -DECEMBER 2016
• Comfort and security- surface quality, ensuring satisfactory lighting, ensuring that routes are
overlooked and do not provide places of concealment;
• Capacity- considering flows and the effective width of the sidewalk when obstacles are taken
into account. The recommended widths for sidewalks and determining levels of comfort are
detailed in the Abu Dhabi Road Geometric Design Manual [3]. The manual details the four
primary zones that constitute the pedestrian realm, which are illustrated in Figure 13.6 and
the required widths for each of the realm elements for various contexts are detailed in Table
13.3;
• The needs of people with impaired vision or mobility, in particular in relation to surface quality,
avoidance of trip hazards and obstacles, dropped curbs at crossings, and provision of tactile
surfaces in line with the appropriate standards. The Abu Dhabi Urban Street Design Manual
[5] provides guidance on the use and provision of tactile surface treatments whilst Figure
13.7 shows typical tactile provision at curb ramps;
• The presence of children, particularly near schools and play areas;
• Sight lines to the traffic lanes, especially at crossings;
• Bus stops, including access from sidewalk where not adjacent to the road, and providing a
comfortable and secure waiting area that does not congest the sidewalk.
Figure 13.6: Pedestrian realm elements [5]](https://image.slidesharecdn.com/documento50-1-120-5152borrador-240214213429-246eea16/85/Documento-50-1-120-51-52-borrador-pdf-326-320.jpg)
![ROADSIDE DESIGN GUIDE
PAGE 346
13 URBAN ROADSIEDDESIGN FIRST EDITION -DECEMBER 2016
Table 13.3: Width for pedestrian realm zones [3]
Street Family Frontage Through Furnishing Cycle Track Edge*
Min Max Min Max Min Max Min Max Min Max
City Context
Boulevard 0.5 1.5 2.8 4.0 1.2 3.5 1.5 2.5 0.2 2.0
Avenue 0.5 1.5 2.4 4.0 1.0 3.0 1.5 2.5 0.2 2.0
Street 0.5 1.5 2.4 3.0 1.0 2.4 1.5 2.5 0.2 2.0
Access lane n/a n/a 1.8 2.5 n/a n/a n/a n/a 0.2 1.5
Town Context
Boulevard 0.5 1.5 2.4 3.5 1.2 3.0 1.5 2.5 0.2 2.0
Avenue 0.5 1.5 2.0 3.0 1.0 2.4 1.5 2.5 0.2 2.0
Street 0.5 1.5 2.0 2.4 1.0 2.0 1.5 2.5 0.2 2.0
Access lane n/a n/a 1.8 2.5 n/a n/a n/a n/a 0.2 1.5
Commercial Context
Boulevard 0.5 1.5 2.4 3.5 1.2 3.0 1.5 2.5 0.2 2.0
Avenue 0.5 1.5 2.0 3.0 1.0 2.4 1.5 2.5 0.2 2.0
Street 0.5 1.5 2.0 2.4 1.0 2.0 1.5 2.5 0.2 2.0
Access lane n/a n/a 1.8 2.5 n/a n/a n/a n/a 0.2 1.5
Residential Context
Boulevard 0.5 1.0 1.8 3.5 1.2 2.0 1.5 2.5 0.2 2.0
Avenue 0.5 1.0 1.8 3.0 1.2 2.0 1.5 2.5 0.2 2.0
Street n/a n/a 1.8 3.4 n/a n/a 1.5 2.5 0.2 2.0
Access lane n/a n/a 1.8 3.4 n/a n/a n/a n/a 0.2 1.5
Industrial Context
Boulevard 0.3 0.5 2.0 3.6 1.2 2.4 1.5 2.5 0.2 2.0
Avenue 0.3 0.5 2.0 3.4 1.0 2.4 1.5 2.5 0.2 2.0
Street 0.3 0.5 2.0 3.0 1.0 1.5 1.5 2.5 0.2 2.0
Access lane n/a n/a 1.8 2.5 n/a n/a n/a n/a 0.2 1.5
* Edge zone must be a minimum of 1.5 m where there is on-street parking or a cycle track. It may only go
down to 0.2 m when sufficient room is available for signing, lighting, and utilities within an adjacent
Furnishings zone.
Figure 13.7 – Typical curb ramp and tactile strip configuration [3]
The provision of safe and convenient crossing facilities in the right location is essential for
managing crashes in the roadway. Crossing facilities need to follow desire lines as closely as](https://image.slidesharecdn.com/documento50-1-120-5152borrador-240214213429-246eea16/85/Documento-50-1-120-51-52-borrador-pdf-327-320.jpg)
![ROADSIDE DESIGN GUIDE
PAGE 347
13 URBAN ROADSIEDDESIGN FIRST EDITION -DECEMBER 2016
possible, and to be part of legible routes, so that pedestrians make use of them naturally when
following the most obvious route to where they are going. If use of a formal crossing facility involves
a long detour, or takes a route that is not readily discernible, then pedestrians will be more likely to
attempt to cross the traffic flow at a place of their own choosing, which may lead to increased risk of
collisions. If suitably located the use of formal crossing points can be further reinforced through good
design of the sidewalk environment: ensuring that crossing points are visible and easily identified,
are clear of obstructions, use dropped curbs to improve comfort. Typical details of a raised crossing
is provided in Figure 13.8
Figure 13.8: Typical raised crosswalk (avenue) [3]
9.5 Bicycle Facilities
This Section gives a brief overview on bicycle facilities. For more detailed information please refer
to “Abu Dhabi Road Geometric Design Manual [3]”, “Abu Dhabi Urban Planning Council Urban](https://image.slidesharecdn.com/documento50-1-120-5152borrador-240214213429-246eea16/85/Documento-50-1-120-51-52-borrador-pdf-328-320.jpg)
![ROADSIDE DESIGN GUIDE
PAGE 348
13 URBAN ROADSIEDDESIGN FIRST EDITION -DECEMBER 2016
Street Design Manual [5]”, “Abu Dhabi Walking and Cycling Master Plan [6]” and “AASHTO Guide
for Development of Bicycle Facilities [7]”.
There is a wide range of type of facilities intended for use by cyclists, with many different examples
found across the world. Provision ranges widely in the extent to which cyclists are separated from
other traffic, with examples including:
• Sharing the roadway with other vehicles with no specific facilities, sometimes assisted by
speed reduction measures such as traffic calming;
• Sharing wide outside vehicle lanes;
• Shared use of bus lanes;
• Cycle lanes within the carriageway;
• Physical separation within the carriageway;
• Fully segregated off-carriageway cycle tracks, as shown in Figure 13.9;
• Off-road cycle tracks separate from the road network, which may be shared with
pedestrians.
Figure 13.9 – A fully segregated off-carriageway cycle track
The most appropriate form of facility for a particular location will need to take account of a range of
local factors, including traffic flow and speeds, cycle demand, and the space available. A street
categorisation can be used as the basis for suggesting which forms of infrastructure could be most
appropriate, as shown in Table 13.4, which is based on an example from Transport for London
London Cycle Design Standards [8].
The more the ‘movement’ function for a street dominates, the greater the traffic speed and flow that
would be expected, and hence the greater degree of separation that would be considered
appropriate. In locations with a ‘higher place’ function, such as a Souk, a scheme design might focus
on how cycling can help to bring people to the space, and then to spend time there, whilst at the
same time how motorised traffic is calmed to reduce speeds and make the place more inviting.
Where the vehicle through-movement is dominant and the place is ‘low’, the design for cycling](https://image.slidesharecdn.com/documento50-1-120-5152borrador-240214213429-246eea16/85/Documento-50-1-120-51-52-borrador-pdf-329-320.jpg)
![ROADSIDE DESIGN GUIDE
PAGE 349
13 URBAN ROADSIEDDESIGN FIRST EDITION -DECEMBER 2016
should address both capacity and safety issues including managing conflict with other vehicle types
and pedestrians, cycle priority and the minimization or avoidance of delay.
In Table 13.4 the types of cycling intervention are categorised according to the ‘degree of separation’
they offer between cyclists and motor vehicles. Where the street has a higher movement function,
improved level of service for cyclists can be achieved by greater user separation and by traffic
calming measures.
Table 13.4 - Indicative range of cycling provision by type of street [8]
High movement
low place
Medium movement
medium place
Low movement
high place
Degree of separation Principal
Arterials
Minor
Arterials
Collector
/
Local
Street
Principal
Arterials
Minor
Arterials
Collector
/
Local
Street
City
Center
Commercial
boulevard
Souk
/
Park
Full segregation
(e.g. cycle track, segregated lane)
Dedicated on carriageway lanes
(markings or ‘light’ separation)
Shared on-carriageway lanes
(bus lanes, wide vehicle lanes)
Sharing with other vehicles
(shared with normal traffic lane)
It is very important to recognise that a disproportionate number of cycle crashes take place at
intersections, where they are most likely to come into conflict with motorised vehicles. This is also
the case even where cycle tracks are otherwise segregated from traffic, as cyclists often lose priority
at intersections and find themselves positioned on the inside of turning vehicles when segregation
ends.
Although outside the scope of this Guide, cycle-friendly intersection design is therefore fundamental
to the development of safe cycle route networks. From the perspective of roadside design, the
position of junctions and crossings needs to be taken into account, including the detail of how cyclists
re-join the carriageway, sightlines to the vehicle carriageway the location of dropped curbs and the
position of street furniture and other features.
Further design considerations:
• Cycle tracks are commonly provided at the roadside close to trip attractors (e.g. shops, public
transport interchanges), but can cause obstruction and represent a hazard. Where practical
their installation should respect the clear zone advice set out in this document;](https://image.slidesharecdn.com/documento50-1-120-5152borrador-240214213429-246eea16/85/Documento-50-1-120-51-52-borrador-pdf-330-320.jpg)
![ROADSIDE DESIGN GUIDE
PAGE 350
13 URBAN ROADSIEDDESIGN FIRST EDITION -DECEMBER 2016
• Separate signposts might be provided for cyclists, these should be treated in the same way
as other features in terms of respecting clearance distances and avoiding causing obstruction
to cyclists or pedestrians;
• Where cycle tracks are provided outside the main vehicle carriageway this space should also
be kept clear of obstructions, and where possible a clear zone of 0.5m [5] maintained to
reduce the risk of injury to cyclists in the event of an off-road fall, or conflict with pedestrian;
• Wide shoulders and bicycle lanes provide an additional clear area adjacent to the travelled
way, so these features provide a secondary safety benefit for motorists and can be included
as part of the clear zone. These bicycle facilities also will improve the resulting sight distance
for motor vehicle drivers at intersecting driveways and streets;
• The minimum lateral clearance of 0.5m shall be used for objects adjacent to segregated cycle
track or shared path, however 1.0m is desirable to ensure enough clearance is present taking
into account extent of handlebars past the edge of the path, especially through curves where
cyclists may lean further outside the edge.
The Abu Dhabi Urban Planning Council Urban Street Design Manual [5] provides a number of
diagrams detailing the design of cycle facilities in the urban environment, including at intersections.
Reference should be made to this document, and other design standards, when considering bicycle
scheme designs. An example of typical cycle facility design is reproduced in Figure 13.10 and this
shows the use of a ‘buffer zone’ between pedestrian and cyclists where a segregated track is
provided, this reduces the potential for conflict and provides protection to pedestrians. All cycle tracks
should be free of obstructions with a minimum lateral clearance to obstructions of at least 0.5m.
Figure 13.10 – Typical bicycle facilities [5]
Bicycle parking racks are often made of solid materials that do not break-away and are secured to
the ground to prevent theft. The non-yielding nature of this street furniture item has the potential to
increase injury severity if a run-off crash were to occur. Table 13.5 describes common strategies for
eliminating or minimizing motor vehicle–bicycle crashes at roadside locations and improving bicycle
safety.](https://image.slidesharecdn.com/documento50-1-120-5152borrador-240214213429-246eea16/85/Documento-50-1-120-51-52-borrador-pdf-331-320.jpg)
![ROADSIDE DESIGN GUIDE
PAGE 351
13 URBAN ROADSIEDDESIGN FIRST EDITION -DECEMBER 2016
Table 13.5 - Design strategies for bicycles [1]
Purpose Strategy
Reduce likelihood of an crash • Use wider curb lanes.
• Provide segregated facilities with clear buffer
zones.
• Increase operational offsets.
• Highlight bicycle paths with coloured
pavement, especially at intersections.
• Provide advanced stop lines at signalised
intersections to allow cyclists to move ‘first’
and reduce potential for conflict.
• Provide colour contrasting material at
potential conflict zones to highlight likelihood
of encountering other users.
Reduce severity of an crash • Locate bicycle racks away from the edge of the
curb to reduce chance of vehicle strikes.
9.6 Roadside Safety Barriers in Urban Areas
13.6.1 Determining use of roadside safety barriers
Pedestrians or bicyclists may require shielding by a roadside safety barrier (vehicle restraint system)
where they are considered to be exposed to a higher than normal risk of being struck by an errant
vehicle. Where a pedestrian/bicyclist facility either exists or is proposed for an existing site that has
run-off-road crash history, an assessment of pedestrian, bicyclist, and bystander exposure should
be undertaken so that crash reductions for alternative treatments can be considered (Section13.3).
In the evaluation, the designer should consider the combination of factors that would require
shielding of the facility including the:
• Number and type of path users (e.g. whether large numbers of people congregate in or
pass through the area, the presence of young school children);
• Factors that make the site more hazardous than other sites along the road (e.g. road
geometry and characteristics that would increase the risk of run-off-road events);
• Type of traffic that may cause a run-off-road event to be particularly severe (e.g. high
numbers of heavy vehicles);
• Situations where a roadside barrier may be appropriate are:
• Intermediate and high-speed roads where a path is within the clear zone;
• Heavily trafficked shared-use paths separated by less than 4 m from an adjacent heavily
trafficked lane, especially if the geometry is substandard (see also section 13.4);](https://image.slidesharecdn.com/documento50-1-120-5152borrador-240214213429-246eea16/85/Documento-50-1-120-51-52-borrador-pdf-332-320.jpg)
![ROADSIDE DESIGN GUIDE
PAGE 352
13 URBAN ROADSIEDDESIGN FIRST EDITION -DECEMBER 2016
• Sites where there is expected to be large numbers of bystanders congregated adjacent to
the road beyond the clear zone (e.g. schoolyard, sporting facilities) and the consequences
of a crash are expected to be high.
Placing a roadside safety barrier in a pedestrian environment imposes compromises and trade-offs
between vehicle occupant safety and pedestrian/bicyclist safety. Evaluation of the trade-offs
between vehicular and pedestrian/safety should include factors contributing to the relative risk for
each user class. These include exposure of individuals and expected severity of each crash
category. To evaluate the expected severity of any crashes, consider the operating speed of the
roadway facility, the treatment under consideration, and the nature of any particular traffic barrier.
As discussed previously, analysis of speeds should refer to the off-peak, when speeds are likely to
be higher, and the most severe crashes are likely to occur.
Where there is a need to provide a roadside safety barrier between a path and roadway traffic, it is
important that the rear of the barrier is not a hazard for pedestrians and bicyclists. Designers should
ensure that:
• The barrier should be kept as far from pedestrians and cyclists as possible, with good
clearance provided between the rear of the barrier and the path;
• No sharp edges, burrs or other potential hazards (e.g. protruding bolts) exist;
• Where sufficient clearance cannot be provided, bicyclists are protected from “snagging” on
posts by the provision of suitably designed rub rails;
• Where sufficient clearance cannot be achieved, consideration is given to the need to increase
the height of the barrier either to prevent errant bicyclists from falling over the barrier and into
a traffic lane or to discourage pedestrians from jumping over the barrier to cross the road at
an unsafe location.
Where the objective is to prevent cyclists and pedestrians from encroaching onto a traffic lane from
an adjacent sidewalk or cycles track rather than to protect path users from errant vehicles, or errant
vehicles from roadside hazards, then a pedestrian fence should be adequate, see Section 13.7.5.
Where bridges are present in urban areas these usually include a sidewalk, but space for separation
is limited, so bridge roadside barriers are often used to protect pedestrians. At lower speeds, the
sidewalk is separated from the adjacent roadway by a vertical curb, which is typically 150 mm to 200
mm high. However, at higher speeds, the vertical curb will interfere with the proper vehicular/bridge
safety barrier interaction. Therefore, the following will apply to the location of a bridge safety barrier
in combination with a sidewalk:
11. Speed 70 km/h. The bridge rail is typically located on the outside edge of the sidewalk;
12. Speed 80 km/h. Place the bridge rail between pedestrians and traffic; i.e. between the
roadway portion of the bridge deck and the sidewalk. For the 815-mm concrete barrier rail,
the rail must have a metal handrail on the top of the barrier to reach the required 1050mm
height for a pedestrian rail. A 1250mm pedestrian or 1400mm bicycle rail [9] is then used at
the outside edge of the sidewalk. For this arrangement, the roadway and sidewalk portions
of the bridge deck are at the same elevation.
For further details on the provision at bridges please refer to Chapter 7 of this manual.](https://image.slidesharecdn.com/documento50-1-120-5152borrador-240214213429-246eea16/85/Documento-50-1-120-51-52-borrador-pdf-333-320.jpg)
![ROADSIDE DESIGN GUIDE
PAGE 354
13 URBAN ROADSIEDDESIGN FIRST EDITION -DECEMBER 2016
9.7 Common Urban Roadside Features
13.7.1 Curbs
13.7.1.1 High Upstand Curbs
Roads in urban areas will commonly have upstand curbs to separate pedestrians from the main
carriageway. The curb is also usually adjacent to a gutter so has a role in drainage. Curbs in urban
areas are usually 150mm (6”), but a lower 100mm (4”) curb will often suffice if drainage is the primary
function. Typical curb design for an upstand curb is provided in Figure 13.11.
Figure 13.11 – Typical details of an upstand curb [3]
While curbs will deter drivers from encroaching into the pedestrian space, they have only limited
effectiveness in redirecting errant vehicles, particularly at speeds greater than 40km/h. Larger SUV
style vehicles will more easily mount the curb than smaller cars, so the prevalence of these vehicle
types needs to be taken into account. Because of the limited redirectional capability, the guidance
on clear zones in Section 13.2 should be followed as far as possible. Traffic speed needs to be taken
into account, therefore, where the speed is 70km/h or less, fixed objects should be located as far
from the roadway as practical, but in no case closer than 500mm from the face of the curb. Curbs
should not be used on facilities where the design speed is 70km/h or greater [3]. Where sidewalks
are adjacent to the curb (i.e. there is no buffer area), locate all appurtenances behind the sidewalk.
When a vehicle mounts the curb it will travel approximately 2.5m before its suspension returns to its
normal state. This increases the risk of it vaulting any barriers it might hit, so vehicle restraint system
should be installed either immediately adjacent to the curb or at least 2.5m away [1].
13.7.1.2 Vehicle Barrier Curbs
Vehicle barrier curbs, or treif kerbs as they are often referred, can be used on urban roads with a
speed limit ≤60km/h to prevent vehicles mounting the curb [4]. This type of curb has high profile
(typically 280mm or greater) and has proven effective at redirecting vehicles at speeds up to 60km/h
at impact angles up to five degrees. At speeds greater than this the curbs effectiveness of redirecting
is reduced and in turn acts as hazard to errant vehicles by providing an overturning opportunity so
should not be used on roads with a speed limit >60km/h [4]. Figure 13.12 provides typical details of
a vehicle barrier curbs.
This type of curb should predominately be used in areas of high pedestrian use to provide additional
protection from any possible errant vehicles. However, in providing this type of curb it](https://image.slidesharecdn.com/documento50-1-120-5152borrador-240214213429-246eea16/85/Documento-50-1-120-51-52-borrador-pdf-335-320.jpg)
![ROADSIDE DESIGN GUIDE
PAGE 355
13 URBAN ROADSIEDDESIGN FIRST EDITION -DECEMBER 2016
needs to be understood that the curb height is an impediment to pedestrians in crossing the road
and the following considerations should be taken into account:
• If implemented provide the curb on both sides of the road, and the median if present, to
ensure pedestrians do not become ‘stranded’ in the road. This may occur if one side of the
road has standard upstand curbs;
• If used in the vicinity of pedestrian crossing care should be taken at the dropped curb location
to ensure the gradient of the drop is not excessive and impede use. Transition to upstand
kerbs and then to dropped curbs may be required.
Figure 13.12 – Typical details of vehicle barrier curbs [3]
13.7.2 Shoulders & Sidewalks
Where space permits, urban roads may have a paved shoulder between the traffic lanes and the
curb. They increase separation of traffic from the curb and any sidewalk present, so their width
should be counted as part of the clear-zone. Shoulders have the advantage of reducing the likelihood
of errant vehicles leaving the road, however they have the disadvantage of encouraging higher
speeds, because of the perceived greater road width that results. The decision to include a shoulder,
and the width provided, should therefore take into account considerations of the purpose of the road
or street, the overall urban design objectives, and hence the traffic speeds that are appropriate to
provide for in the design.
13.7.3 Traffic Islands & Medians
Traffic movements are often separated by features such as traffic islands and median strips. Clearly
these, and any additional objects, such as lighting columns or signposts, placed within them, present
a hazard to errant vehicles. The guidance on clearance zones and lateral offsets given earlier in this
Chapter should therefore be applied to these features.
Specific design considerations for medians and islands are [1]:
• Widening the median will help reduce the likelihood of errant vehicles colliding with any
objects placed within it;
• The severity of crashes can be reduced by ensuring that only breakable items are located in
medians or islands, or by shielding rigid objects with vehicle barrier curbs (trief curbs) on low
speed roads. On an urban freeway or expressway vehicle restraint systems should be
implemented if an appropriate clear zone cannot be achieved.](https://image.slidesharecdn.com/documento50-1-120-5152borrador-240214213429-246eea16/85/Documento-50-1-120-51-52-borrador-pdf-336-320.jpg)
![ROADSIDE DESIGN GUIDE
PAGE 356
13 URBAN ROADSIEDDESIGN FIRST EDITION -DECEMBER 2016
13.7.4 Gateways
Gateway treatments are a combination of features used to create a sense of arrival to place and can
take many forms. They are used at the perimeter of a local area to inform road users they are
entering a slow speed environment and that they can expect to encounter localized features intended
to induce a traffic calming effect. Gateways are used to emphasize the change in character of the
road environment and its use.
Gateways can take many forms and use structures or features such as lighting units, raised planting,
trees, walls and public art features, to illustrate the approach to a gateway. Many of these features
could be considered hazardous roadside features. The operating speed on approach to a gateway
is a key design consideration in determining what features can be used and subsequently how far
they must be set back from the road.
• Where approach speeds are high (>70km/h) then clear-zone guidance as detailed in Chapter
3 of this Guide shall be applied;
• In low speed locations fixed features can be used and placed closer to the road, but must
maintain the 0.5m minimum lateral clearance, with greater clearance provided where site
conditions allow;
• The use of speed reduction signs, both upright and pavement markings, tactile road
pavement surfaces and other gateway treatments will aid in reducing speed and the
likelihood of run-off crashes [1].
An example gateway design incorporating audio tactile pavement surface treatment, pavement
marking speed limit reinforcement, reduced width running lanes and accompanying mature trees is
detailed in Figure 13.13.
Figure 13.13 – Example gateway layout
13.7.5 Pedestrian Fencing
A high proportion of pedestrian casualties occur from crashes when pedestrians are crossing the
road away from formal crossing points. While, as discussed in Section 13.4, the starting point for
resolving this problem is to ensure satisfactory provision of safe crossing places, pedestrian fencing
(or restraint systems as they are often referred) have a role in discouraging crossing away from
formal crossings at high risk locations, for example mid-block crossing on major streets. Furthermore
pedestrian fencing should be used for the following purposes:
• Assist in directing pedestrians to formal and safe crossing locations;](https://image.slidesharecdn.com/documento50-1-120-5152borrador-240214213429-246eea16/85/Documento-50-1-120-51-52-borrador-pdf-337-320.jpg)
![ROADSIDE DESIGN GUIDE
PAGE 357
13 URBAN ROADSIEDDESIGN FIRST EDITION -DECEMBER 2016
• Prevent pedestrians entering the road and conflicting with vehicular traffic where pedestrian
activity is high;
• To exclude pedestrians from high volume and speed roads, urban freeways and
expressways with speed limit >80km/h.
Figure 13.14 details a typical use of pedestrian fencing to prevent pedestrians crossing a busy three
lane main street by installing the fencing between the service road and main road. In this instance
the fencing will direct pedestrians along the sidewalk to the next formal crossing location.
Figure 13.14 – Example pedestrian fencing restricting crossing over a main street
In addition to their use in preventing pedestrians from crossing at high risk locations, pedestrian
fencing has a role at particular locations where pedestrian flows need to be managed, or
encroachment by groups of pedestrians discouraged. Examples include [3]:
• Outside schools;
• At busy bus stops to keep queuing passengers away from the roadway;
• Where off-road pedestrian or cycle routes join routes adjacent to the carriageway, and
there is a risk of vulnerable road users over-running into the traffic.
On high speed roads pedestrian fencing can be installed in tandem with road safety barrier within
the median and edge of the road to discourage pedestrians crossing these roads.
There are number of types of pedestrian fencing that can be used to contain and direct pedestrians.
The principle design considerations include [3]:
• Fencing should be constructed from vertical members, as far as it is practical, to restrict the
ease at which people can climb the fence;
• Rigid horizontal members should be avoided to limit the potential for fence components to
spear through a vehicle;
• Fencing located in a clear zone must not be hazardous to vehicle occupants or pedestrians.
The fencing should not be designed to resist penetration by a vehicle;
• All fencing shall have a lateral offset of 0.5m minimum from the curb, but where space
allows this should be increased. If a large area is left between the road and the fencing](https://image.slidesharecdn.com/documento50-1-120-5152borrador-240214213429-246eea16/85/Documento-50-1-120-51-52-borrador-pdf-338-320.jpg)
![ROADSIDE DESIGN GUIDE
PAGE 358
13 URBAN ROADSIEDDESIGN FIRST EDITION -DECEMBER 2016
then landscaping or pedestrian deterrent surface treatment should be used in the space so
it is not attractive for pedestrian use.
A major downside to pedestrian fencing is their visual impact on the streescape. A range of
construction materials can be used to improve their appearance, and hedges can also be used to
this effect. Fencing can also present an additional crashes risk themselves- cyclists and powered
two wheeler users in particular. Fencing at intersections can result in cyclists being trapped if caught
on the inside of turning vehicles. There is also evidence that the presence of fencing can encourage
drivers to increase their speed, because they perceive the risk of crash with pedestrians to be
reduced [10].
With these disadvantages the use of fencing is inappropriate on streets with an important ‘place’
function, for example where there are shops, cafes and public spaces. Restricting the movements
of pedestrians too much in such areas would be detrimental to the intended uses of the street,
including the viability of businesses. Consideration should therefore be given to measures to reduce
the speed of the traffic so as to reduce the risk to vulnerable roads users, and also to improve the
quality of the environment.
13.7.6 Anti-glare Screens
Anti-glare screens are provided to eliminate light from oncoming vehicle headlights. They must be
designed in such a way that light directed towards the driver at oblique angles (12° to 20°) is reduced
whilst relatively maintaining an open vision (around 70°) in the sideways direction [9].
The height to effectively screen headlight glare from all types of vehicles on level ground is 2.0m [9].
The screens can be either standalone systems or mounted on top of safety barriers.
There are a number of types of anti-glare systems that can be used. The principle design
considerations and roadside design guidance include [9]:
• Standalone anti-glare screens (not mounted on barrier systems) used on roads with a speed
limit >80km/h located in a clear zone must not be hazardous to vehicle occupants in a run-
off crash and must not resist vehicle penetration;
• Standalone anti-glare screens (not mounted on barrier systems) used on roads with a speed
limit ≤60km/h shall have a minimum lateral clearance of 0.5m. Where space permits this
should be widened to 1.2m. If a large area is left between the road and the screen then
landscaping or pedestrian deterrent surface treatment should be used in the spaces so it is
not attractive for pedestrian use, as the height of the screen may mask some pedestrians
and encourage use close to the carriageway where the risk of strikes from passing vehicles
is heightened;
• Where mounted upon safety barriers it is essential that the anti-glare screen and its fittings
do not detrimentally effect the operational safety requirements of the barrier system;
• Anti-glare screening may lose its effectiveness where there are severe undulations of the
highway alignment, particularly where there are high proportions of large goods vehicle
traffic. In such instances increased height screens may be appropriate;
• Where the highway alignment contains tight left-hand curves the anti-glare screens may
restrict sight distance leading to potential greater risks. In such instances the screen provision
will need to be reviewed to ensure appropriate sight distances are maintained throughout;](https://image.slidesharecdn.com/documento50-1-120-5152borrador-240214213429-246eea16/85/Documento-50-1-120-51-52-borrador-pdf-339-320.jpg)
![ROADSIDE DESIGN GUIDE
PAGE 359
13 URBAN ROADSIEDDESIGN FIRST EDITION -DECEMBER 2016
• Anti-glare screens can be particularly effective alongside major streets where service roads
are present and when during the hours of darkness opposing headlamps on the nearside
cause confusion.
13.7.7 Street Furniture
Street furniture includes items provided for the use and comfort of people using the space adjacent
to the road, or interchanging with public transport, or to improve the aesthetic appeal of the
streetscape. Examples include:
• Seating for public use;
• Litter (rubbish) bins;
• Public art;
• Public telephones;
• Planters;
• Bicycle parking;
• Bus shelters;
• Street vendor kiosks and stalls.
Some of these might be temporary, placed there by owners of the frontages, and may be difficult for
the highway authority to influence. Where their design and installation can be controlled the advice
set out in Section 13.2 should be followed, ensuring satisfactory clearance zones and the use (where
applicable) of breakable construction.
The main impacts of street furniture will be on the pedestrian space, so consideration should be
given to the issues discussed in section 13.4, in particular on ensuring adequate usable width for the
observed pedestrian flows is maintained, avoiding creating trip hazards and obstacles, especially for
those with impaired vision or mobility, and ensuring satisfactory sight lines to the vehicle lanes,
especially at crossing points. Where practical, street furniture should be provided as far from the
carriageway as possible, preferably within a service strip outside of the through zone of the
pedestrian area. Furthermore, street furniture should be placed so it does not restrict sight distance
for all road users including cyclists and pedestrians at dedicated crossing locations [1].
13.7.8 Utility Poles
Because of the constrained space next to urban roads, and limited rights-of-way for utility companies,
utility poles are commonly installed alongside the carriageway. These present very significant
hazards for errant vehicles, and can also obstruct the sidewalk and any off-carriageway cycle track.
Some poles have steel guy wires to provide additional support, which present additional hazards, as
vehicles can strike them and they can be hard to see trip hazards for pedestrians, especially with
impaired vision. Unlike signposts, utility poles are not suited to breakable construction. While utilities
can sometimes be relocated underground, this is very expensive so roadside poles cannot usually
be removed completely. The risk they present can be managed however, through [1]:
• Avoiding locations with high crash risks;
• Positioning them as far as possible from the vehicle lanes;](https://image.slidesharecdn.com/documento50-1-120-5152borrador-240214213429-246eea16/85/Documento-50-1-120-51-52-borrador-pdf-340-320.jpg)
![ROADSIDE DESIGN GUIDE
PAGE 360
13 URBAN ROADSIEDDESIGN FIRST EDITION -DECEMBER 2016
• Avoiding access points and junctions where sight lines can be restricted, and turning vehicles
may be more likely to encroach;
• Placing them on the inside of turns in the road, as errant vehicles will more usually leave the
road on the outside of curves.
Risks can also be reduced by locating poles where they would be protected by another feature, such
as a roadside barrier. Utility poles are also often used for street lighting and for traffic a sign, which
helps to reduce street clutter and avoids the additional risk that would otherwise arise from the
signposts and lighting columns that would otherwise be needed.
13.7.9 Lighting & Visibility
Roadside lighting in urban areas must serve two purposes- illuminating both the carriageway and
the adjacent pedestrian sidewalk. Adequate pedestrian lighting is necessary for comfort and security,
as well as safety by ensuring they are visible to drivers. This imposes different requirements for the
distribution of light from street lighting columns, which will need to be shorter (i.e. 10m) and more
closely spaced than in a purely highway environment (where 25m columns can be used). However,
this increases the number of lighting poles that need to be installed next to the carriageway. Locating
them on the side of the sidewalk furthest from the carriageway will reduce the risk that errant vehicles
will collide with them, while offering the advantage that light will fall onto the sidewalk.
When considering lighting design and provision the illumination levels of pedestrian crossings are of
great importance, particular zebra crossings. In these instances pedestrians should be sufficiently
backlit by adjacent lighting units to ensure their visibility to approaching vehicles.
More detailed guidance is provided in the Abu Dhabi Road Lighting Manual [11].
Because of the potential hazard, the general approach to lighting standards is to use breakaway
supports wherever possible. All new lighting standards located within the clear zone of a roadway
where no pedestrian facilities exist will be placed on breakaway supports, unless they are located
behind or on a barrier or protected by crash cushions in gore areas, which are necessary for other
roadside safety reasons. Poles outside the clear zone on these roadways should also be breakaway
where there is a possibility of being struck by errant vehicles.
On roadways where pedestrian facilities exist, review the volume of pedestrian traffic to determine if
a breakaway support will present a greater potential hazard to the pedestrian traffic than a non-
breakaway support will to the vehicular traffic. Examples of locations where the hazard potential to
pedestrian traffic may be greater include:
• Parking lots;
• Tourist attractions;
• School zones;
• Central business districts and local residential neighbourhoods where the posted speed
limited is 50 km/h or less.
In these locations, non-breakaway supports may be a better choice. Other locations that typically
require the use of non-breakaway bases, regardless of the pedestrian traffic volume, are rest areas
and combined light and traffic signal poles.](https://image.slidesharecdn.com/documento50-1-120-5152borrador-240214213429-246eea16/85/Documento-50-1-120-51-52-borrador-pdf-341-320.jpg)
![ROADSIDE DESIGN GUIDE
PAGE 361
13 URBAN ROADSIEDDESIGN FIRST EDITION -DECEMBER 2016
13.7.10 Sign Posts
In urban areas there can be a lot of constraints on where signposts can be located. Sign posts at the
roadside present a hazard to errant vehicles, but can also cause obstructions to pedestrians if
located on the sidewalk. Similar considerations apply to traffic signal poles, where there is even less
choice of location. In both cases poles must be placed in a location that minimizes pedestrian
conflicts and does not reduce the sidewalk width below minimum. Clearly, if the opportunity is taken
to fix signs to existing posts, for example lighting columns, where this is practicable, then street
clutter and the number of hazards at the roadside can be minimised.
As is generally the case for sign posts next to the highway, breakaway construction is usually
recommended (see Chapter 5) for posts with diameter greater than 89mm. The greatest risk to
pedestrians arises from the errant vehicles themselves rather than anything they might strike, and
sign posts are not designed to stop stray vehicles. However, there are some locations, especially
where large numbers of pedestrians congregate, where a different conclusion might be reached.
To assess whether this is the case on roadways where pedestrian facilities exist, the process and
the examples of hazardous locations is same as that detailed in Section 13.7.9.
13.7.11 Landscaping, trees and shrubs
Landscaping forms an important part of the streetscape in terms of providing high quality and
attractive areas, improving the user environment and subsequently encouraging greater use and
time spent in an area. Furthermore, mature trees can provide an essential part in providing shade to
lower ambient temperatures.
However, large mature trees and other forms of landscaping including raised planters and decorative
rocks can be hazardous to errant vehicles. Landscaping can also have a detrimental effect on
sightlines
Trees with a mature trunk size greater than 100mm in diameter are classified as fixed roadside
objects. When introduced (or expected to grow to and above this size) these should be located in
conformance with the clear zone standards specified in Chapter 3 or road safety barrier provided on
Urban Expressways and Freeways where there high operational and 85th
percentile speeds. The
clear zone standards must also be applied to other landscaping that are likely to be hazardous to an
errant vehicle on higher speed urban roads.
On lower speed roads with a posted speed limit of 60km/h or less, the use of safety barrier is not
required and a minimum lateral clearance of 1.0m shall be applied to allow for vehicle overhang and
clearance of high vehicles. However, greater distance should be considered for the following reasons
[1]:
• Use of the adjacent lane, for example if parking is permitted a greater distance shall be
employed to allow easy access and egress;
• The provision of a suitable border area to take into account watering, root damage and
maintenance requirements so as not to impact on adjacent travel lanes.
In some cases vehicle barrier curbs is an option to shield landscaping that is within the clear zone in
urban areas. This is especially the case where there is a known run-off crash history or potential high
risk zones as detailed in Section 13.3.2. See section 13.7.1 for details on curb use.](https://image.slidesharecdn.com/documento50-1-120-5152borrador-240214213429-246eea16/85/Documento-50-1-120-51-52-borrador-pdf-342-320.jpg)
![ROADSIDE DESIGN GUIDE
PAGE 362
13 URBAN ROADSIEDDESIGN FIRST EDITION -DECEMBER 2016
Sight distance standards specified in the Road Geometric Design Manual for Abu Dhabi [3] must be
adhered to in the design process and future growth and required maintenance regimes are
determined and established. Critical locations include intersections, driveways, pedestrian crossings
and median openings. However, points that must be considered are [1]:
• Landscaping shall allow full visibility for all users at driveways and intersections. Any
landscaping within the required visibility sight distance shall be removed, relocated or
lowered;
• Landscaping of very small traffic islands should be discouraged to reduce maintenance costs,
closure of traffic lanes and safety of maintenance personnel.
9.8 Summary & Conclusions
Urban areas are very diverse, with a wide range of traffic speeds and flows, road widths and
geometry, road user types and street environments. Pedestrians and cyclists will occur in much
greater numbers, with dedicated infrastructure of their own, needing both to travel along links and
also to cross them. In many locations, especially residential areas and town centres, the road
environment is part of a public space, used for social purposes and interactions, not merely as a
transport facility. It is therefore helpful to the design process to assess a location in terms of its
‘movement’ and ‘place’ function, as this has implications for the relative priority given to traffic
capacity and provision for pedestrians and cyclists, and for the vehicle speeds that are considered
appropriate.
Due to varied nature of the urban environment space is more constrained that means there is often
less space available for separating vehicles from pedestrians and cyclists and in providing clearance
zones and in meeting the requirements for sightlines detailed elsewhere in this Guide and therefore
need to be modified.
This Chapter has provided the details of the minimum lateral clearance of roadside object of 0.5m,
with a desirable extended 1.2m clearance where there are no space constraints, and widened even
further in high risk areas such as curves and intersections. These distances must be adhered to for
all urban design schemes.
In certain circumstances roadside and median safety barrier can be used in low speed urban
environments where there is a specific need to counter known run-off crash locations, where there
is increased chance of conflict (curves) and where high numbers of pedestrian are expected. Each
site will need to be assessed individually to ascertain the suitability of providing the barrier
considering the possible trade-offs. Roadside and median safety barriers should be used on high
speed urban Expressways and Freeways where adequate clearance zone treatments cannot be
applied.
Pedestrian and cycle facility requirements have also been provided relating to the placement of street
furniture and other hazards. Where possible, separation and segregation of users should be applied
to provide protection and reduce conflict. The through zones of these facilities should be clear of
objects, preferably with the use of a service strip. The minimum lateral clearance for pedestrians and
cyclists to objects should be the minimum 0.5m and preferably widened for cycle tracks and paths
to 1.0m.
This Chapter has also provided guidance on the introduction and design considerations for a number
of roadside objects and possible treatments that are affected by clearance zones or items within the
extent of clearance zones. Each site where schemes are designed are likely to vary to](https://image.slidesharecdn.com/documento50-1-120-5152borrador-240214213429-246eea16/85/Documento-50-1-120-51-52-borrador-pdf-343-320.jpg)