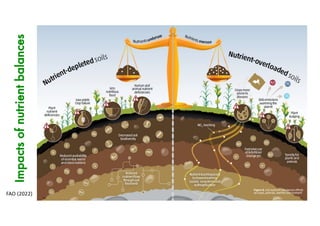
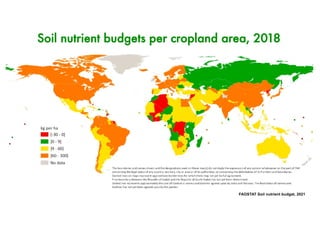
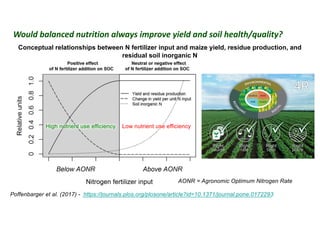
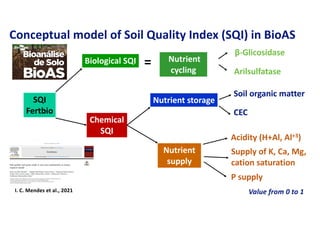
Nutrient Balance and Soil Quality
in Agroecosystems
Fernando O. García
fgarcia1957@gmail.com
@garciaf_nutri
Concepción, 21 March 2023
Why nutrient balance and
soil quality/health?
• Soils are involved in most of SDGs
• One Health: soil + plants + animals +
humans + environment (Lal, 2021)
• Soils and human health: food
production, C sequestration,
detoxification, water and nutrient
retention, biodiversity (Brevik et al.,
2020).
Outline
•Introduction: Some definitions and scope
•Field crop systems of South America
•Soil quality/health status, threats and challenges
•Nutrient balances at different countries/regions
•Management to maintain/improve soil health and
nutrient balances
What is Soil Quality/Health?
“the ability of the soil to sustain
the productivity, diversity, and
environmental services of
terrestrial ecosystems”
Intergovernmental Technical Panel on Soils
(ITPS, 2020)
Soil fertility
• … is the ability of a soil to sustain the
growth of plants by providing essential
nutrients and favorable chemical, physical
and biological characteristics as a habitat
for their growth (FAO, 2019)
FAO (2019,2022)
Indicators of nutrient use efficiency
(Dobermann, 2007; Norton et al., 2015)
Indice Estimation
Typical levels for N
(maize or wheat)
Agronomic efficiency (AE) (Y-Y0)/F
10-30
kg grain/kg nutrient
Recovery efficiency (RE) (U-U0)/F
30-50%
∆ kg nutrient uptake/kg applied nutrient
Partial Productivity Factor
(PPF)
Y/F
40-80
kg grain/kg nutrient
Partial Nutrient Balance
(PNB)
R/F
>1.00 = Deficit
<1.00 = Excess
kg grain nutrient /kg nutrient
Y= yield, F = fertilization, R = removal, U= uptake
scale and objective use of the index … always an output/input ratio
Impacts
of
nutrient
balances
FAO (2022)
Pampas
Cerrados
Amazonas
South central
Brazil
Great Chaco
Central valleys
of Chile
WRB, FAO (2014)
Andes
(highlands
and valleys)
Volcanic soils of
southern Chile
Main soil health challenges
• Wind and water erosion
• Soil organic matter (SOM)
depletion
• Nutrient losses
• Soil compaction
• Salinization
• Biodiversity losses
• Contamination
South America soils and agroecosystems
Erosion - Ecuador
M. Ramos
Erosion
Alto Paraná, Paraguay
K. Moriya, 2011
Uruguay
Argentina
Río de la
Plata
Océano
Atlántico
Eutrophication
Rio de la Plata
L. Carrasco, 2015
Expansion into fragile ecosystems
Carmen de Patagones, Argentina
D. Iurman, INTA Ascasubi, 2009
Expansion into fragile ecosystems
“Chaqueos” at Bolivia
F. Garcia
Salinization
Santa Cruz, Bolivia
M. S. Viera, 2014
Compaction
G. Cordone y G. Gerster
INTA Casilda y Roldán, 2005
Soil nutrient budgets per cropland area, 2018
FAOSTAT Soil nutrient budget, 2021
0.0
1.0
2.0
3.0
4.0
5.0
Argentina Bolivia Brasil Paraguay Uruguay Australia Canada EE.UU.
Relación
Remoción/Aplicación
(BPN)
N P K
Removal to Application Ratio (PNB) for N, P, and K at Argentina, Bolivia,
Brazil, Paraguay and Uruguay, and comparison with other countries
Elaborated from Fertilizar AC and Minagro (2017-19), FAOSTAT, ANAPO, da Cunha et al. (2018), Causarano (2017),
update 2020 from Mancassola and Casanova (2015), Edis et al. (2012), NuGIS-IPNI (2012)
Removal
to
Application
Ratio
(PNB)
Application > Removal
Removal > Application
US
Adapted from EU Nitrogen Expert Panel (2015)
NUE 90% = PPF 80 kg grain/kg N
Maximum excess 80 kg N
NUE 60% = PPF 50 kg grain/kg N
NUE 30% = PPF 25 kg grain/kg N
“Ideal”
Contamination risk
Soil degradation risk
… how are Nitrogen Use Efficiencies (NUE) in maize …
Partial Productivity Factor of N (PPF-N) = Yield / N rate
Argentina
Brasil
Bolivia
Paraguay
Uruguay
Chile
Perú
México
N rate (kg/ha)
Maize
yield
(kg/ha)
NUE30 NUE60 NUE90
Pillars of sustainable soil management for improved soil health
Rotations + No-tillage + Cover crops + Balanced nutrition
Studdert et al., 1997; Studdert and Echeverria, 2000; Ernst and Siri-Prieto, 2009; Novelli et al., 2013; Sá et al., 2014, 2017; Nunes
et al., 2020; Carvalho et al., 2021; Gabbarini et al., 2021; Nicoloso and Rice, 2021; Rui et al., 2022; Mikha and Marake, 2022;
Pires et al., 2023
Soil organic carbon as the comprehensive soil health/quality indicator
Rotations/cropping intensity
• Crop diversity
• Pasture/crop rotations
• Santa Fe system, agriculture/livestock integration
No-tillage
• Minimum disturbance
• Reduce erosion
• Soil C increases and stratification
• Improved soil microbial biomass and activity
Cover crops
• Root and microbial diversity
• Improved soil structure
• N fixation
• Reduce erosion
• Weed control
Balanced nutrition
• Improved yields
• Improved soil carbon
• Improved soil microbial biomass and activity
Rotations + Balanced nutrition
Long-term experiment at INIA La Estanzuela (Uruguay)
Agricultural diversification and intensification lead to 30% higher crop
yields and 19% greater SOC
Cont ag
Cont ag Fert
33% Ag 66% Past
Cont ag Cont ag
Fert
33% Ag
66% Past
Soil
Organic
Carbon
(g/kg)
Accumulated
grain
yield
(Mg/ha)
Grahmann et al., 2020
Sá, et al., Land Degradation and Development, 2015
Sequestered C = 0.423 + 0.165 C
R² = 0.83
p = 0.0006
0.0
0.5
1.0
1.5
2.0
2.5
3.0
3.5
0.0 2.0 4.0 6.0 8.0 10.0 12.0 14.0 16.0
Annual
C
gain
(Mg
ha
-1
)
Annual C input (Mg ha-1)
Carbon restoration by no-till cropping systems in oxisolls of Brazil
Sá et a. (2015)
Cropping intensity + No-tillage
Brachiaria and other cover crops
Santa Cruz, Bolivia
” … NT cropping systems with
high C input have a large
potential to
reverse the process of soil
degradation and SOC decline.”
Nutrition network CREA Southern Santa Fe (2000-19) – García et al. (2022, 2023)
Balanced NPS nutrition contributes 15% to 47% to
crop yields in the central Pampas of Argentina
Bulk density tend to decrease under
balanced NPS nutrition
Improving nutrient balances: Effects on yields and soil health in long-term experiments
41%
51%
29%
15%
40%
47%
27%
15%
9%
9%
14%
6%
10%
26%
12%
7%
25%
25%
6%
3%
Maize
Wheat
DC
Soybean
FS
Soybean
Relative response (%)
N P S NPS NPS+Micros
1
1.1
1.2
1.3
1.4
1.5
2003 2012 2021
Bulk
density
(g
cm
-3
)
Reference Check NPS
1
1.1
1.2
1.3
1.4
1.5
2003 2012 2021
Bulk
density
(g
cm
-3
)
Reference Check NPS
Balducchi - Teodelina, Santa Fe
La Blanca - A. Ledesma, Córdoba
Conceptual relationships between N fertilizer input and maize yield, residue production, and
residual soil inorganic N
Poffenbarger et al. (2017) - https://journals.plos.org/plosone/article?id=10.1371/journal.pone.0172293
Would balanced nutrition always improve yield and soil health/quality?
High nutrient use efficiency Low nutrient use efficiency
AONR = Agronomic Optimum Nitrogen Rate
Improving soil health through a systemic and integral
approach to soil fertility…
üDecoupling ag production from externalities
Adapted from Moraes Sá and Rice
Oats
Oats
Soybean Soybean
Wheat
Corn
Crop
Residues
Continuous
C Flux
Organic
compounds
MBC e MBN;
humic
compounds
Active Pool Slow
Pool Passive
Pool
Bulk Density;
SOC and N
pools
Soil carbon pool
C; DpH;
CTC; P e
K
physical, chemical and
biological properties
Intensification and Diversification
Soil
Organic
Carbon
Microbial
Activity
Nutrient
Cycling
Soil
Structure
Soil
Biodiversity
Water
Erosion
&
Availability
Gaseous
Emissions
Plant Growth
Yield
Environmental
Services
Sustainability
Rice (2018)
Conceptual model of Soil Quality Index (SQI) in BioAS
SQI
Fertbio
Soil organic matter
CEC
Acidity (H+Al, Al+3)
Supply of K, Ca, Mg,
cation saturation
β-Glicosidase
Arilsulfatase
Nutrient
cycling
Nutrient storage
Nutrient
supply
Biological SQI =
Chemical
SQI
Value from 0 to 1
P supply
I. C. Mendes et al., 2021
Thank you!
Fernando O. García
fgarcia1957@gmail.com
@garciaf_nutri

DOC-20230401-WA0001..pdf

  • 1.
    Nutrient Balance andSoil Quality in Agroecosystems Fernando O. García fgarcia1957@gmail.com @garciaf_nutri Concepción, 21 March 2023
  • 2.
    Why nutrient balanceand soil quality/health? • Soils are involved in most of SDGs • One Health: soil + plants + animals + humans + environment (Lal, 2021) • Soils and human health: food production, C sequestration, detoxification, water and nutrient retention, biodiversity (Brevik et al., 2020).
  • 3.
    Outline •Introduction: Some definitionsand scope •Field crop systems of South America •Soil quality/health status, threats and challenges •Nutrient balances at different countries/regions •Management to maintain/improve soil health and nutrient balances
  • 4.
    What is SoilQuality/Health? “the ability of the soil to sustain the productivity, diversity, and environmental services of terrestrial ecosystems” Intergovernmental Technical Panel on Soils (ITPS, 2020)
  • 5.
    Soil fertility • …is the ability of a soil to sustain the growth of plants by providing essential nutrients and favorable chemical, physical and biological characteristics as a habitat for their growth (FAO, 2019) FAO (2019,2022)
  • 6.
    Indicators of nutrientuse efficiency (Dobermann, 2007; Norton et al., 2015) Indice Estimation Typical levels for N (maize or wheat) Agronomic efficiency (AE) (Y-Y0)/F 10-30 kg grain/kg nutrient Recovery efficiency (RE) (U-U0)/F 30-50% ∆ kg nutrient uptake/kg applied nutrient Partial Productivity Factor (PPF) Y/F 40-80 kg grain/kg nutrient Partial Nutrient Balance (PNB) R/F >1.00 = Deficit <1.00 = Excess kg grain nutrient /kg nutrient Y= yield, F = fertilization, R = removal, U= uptake scale and objective use of the index … always an output/input ratio
  • 7.
  • 8.
    Pampas Cerrados Amazonas South central Brazil Great Chaco Centralvalleys of Chile WRB, FAO (2014) Andes (highlands and valleys) Volcanic soils of southern Chile Main soil health challenges • Wind and water erosion • Soil organic matter (SOM) depletion • Nutrient losses • Soil compaction • Salinization • Biodiversity losses • Contamination South America soils and agroecosystems Erosion - Ecuador M. Ramos Erosion Alto Paraná, Paraguay K. Moriya, 2011 Uruguay Argentina Río de la Plata Océano Atlántico Eutrophication Rio de la Plata L. Carrasco, 2015 Expansion into fragile ecosystems Carmen de Patagones, Argentina D. Iurman, INTA Ascasubi, 2009 Expansion into fragile ecosystems “Chaqueos” at Bolivia F. Garcia Salinization Santa Cruz, Bolivia M. S. Viera, 2014 Compaction G. Cordone y G. Gerster INTA Casilda y Roldán, 2005
  • 9.
    Soil nutrient budgetsper cropland area, 2018 FAOSTAT Soil nutrient budget, 2021
  • 10.
    0.0 1.0 2.0 3.0 4.0 5.0 Argentina Bolivia BrasilParaguay Uruguay Australia Canada EE.UU. Relación Remoción/Aplicación (BPN) N P K Removal to Application Ratio (PNB) for N, P, and K at Argentina, Bolivia, Brazil, Paraguay and Uruguay, and comparison with other countries Elaborated from Fertilizar AC and Minagro (2017-19), FAOSTAT, ANAPO, da Cunha et al. (2018), Causarano (2017), update 2020 from Mancassola and Casanova (2015), Edis et al. (2012), NuGIS-IPNI (2012) Removal to Application Ratio (PNB) Application > Removal Removal > Application US
  • 11.
    Adapted from EUNitrogen Expert Panel (2015) NUE 90% = PPF 80 kg grain/kg N Maximum excess 80 kg N NUE 60% = PPF 50 kg grain/kg N NUE 30% = PPF 25 kg grain/kg N “Ideal” Contamination risk Soil degradation risk … how are Nitrogen Use Efficiencies (NUE) in maize … Partial Productivity Factor of N (PPF-N) = Yield / N rate Argentina Brasil Bolivia Paraguay Uruguay Chile Perú México N rate (kg/ha) Maize yield (kg/ha) NUE30 NUE60 NUE90
  • 12.
    Pillars of sustainablesoil management for improved soil health Rotations + No-tillage + Cover crops + Balanced nutrition Studdert et al., 1997; Studdert and Echeverria, 2000; Ernst and Siri-Prieto, 2009; Novelli et al., 2013; Sá et al., 2014, 2017; Nunes et al., 2020; Carvalho et al., 2021; Gabbarini et al., 2021; Nicoloso and Rice, 2021; Rui et al., 2022; Mikha and Marake, 2022; Pires et al., 2023 Soil organic carbon as the comprehensive soil health/quality indicator Rotations/cropping intensity • Crop diversity • Pasture/crop rotations • Santa Fe system, agriculture/livestock integration No-tillage • Minimum disturbance • Reduce erosion • Soil C increases and stratification • Improved soil microbial biomass and activity Cover crops • Root and microbial diversity • Improved soil structure • N fixation • Reduce erosion • Weed control Balanced nutrition • Improved yields • Improved soil carbon • Improved soil microbial biomass and activity
  • 13.
    Rotations + Balancednutrition Long-term experiment at INIA La Estanzuela (Uruguay) Agricultural diversification and intensification lead to 30% higher crop yields and 19% greater SOC Cont ag Cont ag Fert 33% Ag 66% Past Cont ag Cont ag Fert 33% Ag 66% Past Soil Organic Carbon (g/kg) Accumulated grain yield (Mg/ha) Grahmann et al., 2020
  • 14.
    Sá, et al.,Land Degradation and Development, 2015 Sequestered C = 0.423 + 0.165 C R² = 0.83 p = 0.0006 0.0 0.5 1.0 1.5 2.0 2.5 3.0 3.5 0.0 2.0 4.0 6.0 8.0 10.0 12.0 14.0 16.0 Annual C gain (Mg ha -1 ) Annual C input (Mg ha-1) Carbon restoration by no-till cropping systems in oxisolls of Brazil Sá et a. (2015) Cropping intensity + No-tillage Brachiaria and other cover crops Santa Cruz, Bolivia ” … NT cropping systems with high C input have a large potential to reverse the process of soil degradation and SOC decline.”
  • 15.
    Nutrition network CREASouthern Santa Fe (2000-19) – García et al. (2022, 2023) Balanced NPS nutrition contributes 15% to 47% to crop yields in the central Pampas of Argentina Bulk density tend to decrease under balanced NPS nutrition Improving nutrient balances: Effects on yields and soil health in long-term experiments 41% 51% 29% 15% 40% 47% 27% 15% 9% 9% 14% 6% 10% 26% 12% 7% 25% 25% 6% 3% Maize Wheat DC Soybean FS Soybean Relative response (%) N P S NPS NPS+Micros 1 1.1 1.2 1.3 1.4 1.5 2003 2012 2021 Bulk density (g cm -3 ) Reference Check NPS 1 1.1 1.2 1.3 1.4 1.5 2003 2012 2021 Bulk density (g cm -3 ) Reference Check NPS Balducchi - Teodelina, Santa Fe La Blanca - A. Ledesma, Córdoba
  • 16.
    Conceptual relationships betweenN fertilizer input and maize yield, residue production, and residual soil inorganic N Poffenbarger et al. (2017) - https://journals.plos.org/plosone/article?id=10.1371/journal.pone.0172293 Would balanced nutrition always improve yield and soil health/quality? High nutrient use efficiency Low nutrient use efficiency AONR = Agronomic Optimum Nitrogen Rate
  • 17.
    Improving soil healththrough a systemic and integral approach to soil fertility… üDecoupling ag production from externalities Adapted from Moraes Sá and Rice Oats Oats Soybean Soybean Wheat Corn Crop Residues Continuous C Flux Organic compounds MBC e MBN; humic compounds Active Pool Slow Pool Passive Pool Bulk Density; SOC and N pools Soil carbon pool C; DpH; CTC; P e K physical, chemical and biological properties Intensification and Diversification Soil Organic Carbon Microbial Activity Nutrient Cycling Soil Structure Soil Biodiversity Water Erosion & Availability Gaseous Emissions Plant Growth Yield Environmental Services Sustainability Rice (2018)
  • 18.
    Conceptual model ofSoil Quality Index (SQI) in BioAS SQI Fertbio Soil organic matter CEC Acidity (H+Al, Al+3) Supply of K, Ca, Mg, cation saturation β-Glicosidase Arilsulfatase Nutrient cycling Nutrient storage Nutrient supply Biological SQI = Chemical SQI Value from 0 to 1 P supply I. C. Mendes et al., 2021
  • 19.
    Thank you! Fernando O.García fgarcia1957@gmail.com @garciaf_nutri