The document serves as a guide for preparing a presentation for a doctoral project proposal defense, detailing the structure, timing, and content requirements. It emphasizes the importance of summarizing project chapters, defining methodologies, and presenting clinical questions clearly, while suggesting best practices for slide design and oral presentation delivery. Additionally, it outlines various training methods and their effectiveness, advising trainers to first determine learning objectives before selecting appropriate instructional techniques.


![effects manifest themselves in measurable behavioral changes.
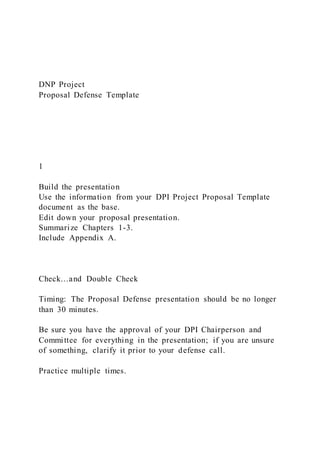
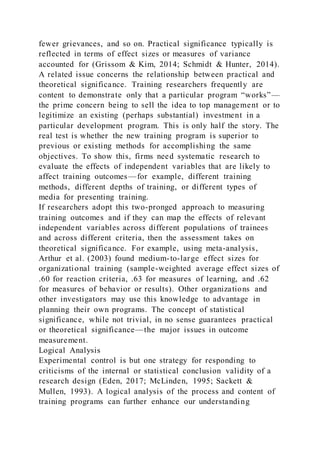
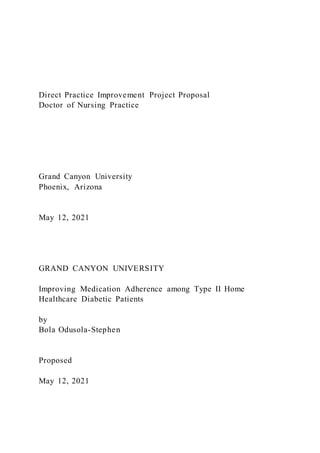
A large-scale meta-analysis reported an average interval of 133
days (almost 4.5 months) for the collection of outcome
measures in behavioral terms (Arthur et al., 2003). To detect the
changes, we need carefully developed techniques for systematic
observation and measurement. Examples include scripted, job-
related scenarios that use empirically derived scoring weights
(Ostroff, 1991), behaviorally anchored rating scales, self-
reports (supplemented by reports of subordinates, peers, and
supervisors), critical incidents, or comparisons of trained
behaviors with behaviors that were not trained (Frese, Beimel,
& Schoenborn, 2003).Strategies for Measuring Training
Outcomes in Terms of Financial Impact
There continue to be calls for establishing the return on
investment (ROI) for training, particularly as training activities
continue to be outsourced and as new forms of technology-
delivered instruction are marketed as cost effective (Association
for Talent Development, 2016; LinkedIn Learning, 2017). Let’s
begin by examining what ROI is.
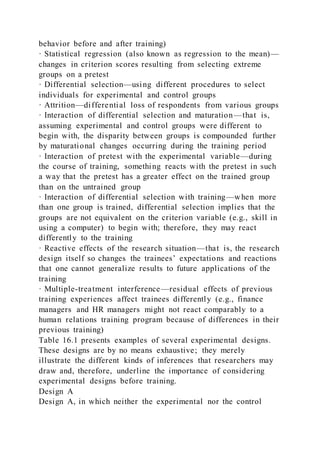
ROI relates program profits to invested capital. It does so in
terms of a ratio in which the numerator expresses some measure
of profit related to a project, and the denominator represents the
initial investment in a program (Cascio, Boudreau, & Fink, in
press). Suppose, for example, an organization invests $80,000
to design and deliver a wellness program. The program provides
a total annual savings of $240,000 in terms of reduced sick days
and improved health. The ROI is therefore [($240,000 –
$80,000)/$80,000] × 100%, or 200%. Its net benefit per dollar
spent is therefore 2:1. At a broader level, ROI has both
advantages and disadvantages. Its major advantage is that it is
simple and widely accepted. It blends in one number all the
major ingredients of profitability, and it can be compared with
other investment opportunities. On the other hand, it suffers
from two major disadvantages. One, although the logic of ROI
analysis appears straightforward, there is much subjectivity in
determining the inflow of returns produced by an investment,](https://image.slidesharecdn.com/dnpprojectproposaldefensetemplate1buil-220922000134-df0699ea/85/DNP-Project-Proposal-Defense-Template1Buil-23-320.jpg)


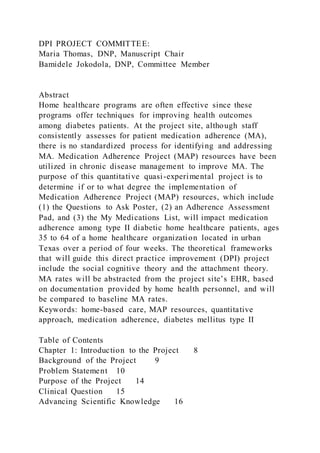
![Organizations both before and after the team-development
workshops. This instrument measures organizational functioning
in terms of general management, leadership, coordination,
three-way communications, peer relations, and satisfaction.
Since subordinates had no knowledge of the team-development
workshops and therefore no ego involvement in them, this
design represents the most internally valid test of the
hypothesis. Moreover, since an average of 86% of the
subordinates drawn from the experimental-group units
completed the posttraining questionnaires, as did an average of
81% of those representing control groups, Eden could rule out
the effect of attrition as a threat to the internal validity of the
experiment. Rejection of the null hypothesis would imply that
the effects of the team-development effort really did affect the
rest of the organization.
To summarize: Comparison of the command team’s before-and-
after perceptions tests whether the workshop influenced the
team; comparison of the subordinates’ before-and-after
perceptions tests whether team development affected the
organization. In all, 147 command-team members and 600
subordinates completed usable questionnaires.
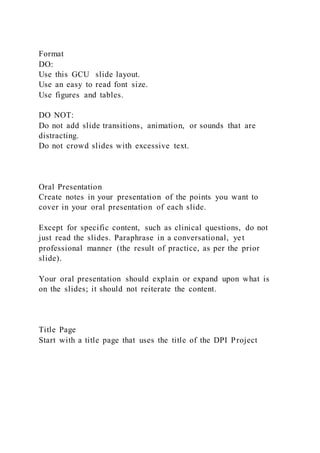
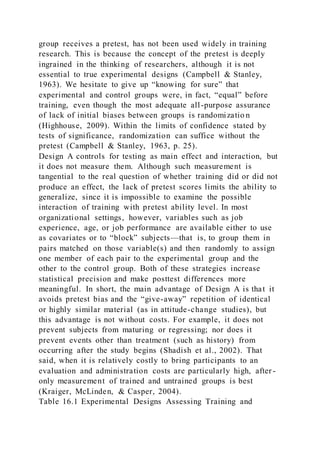
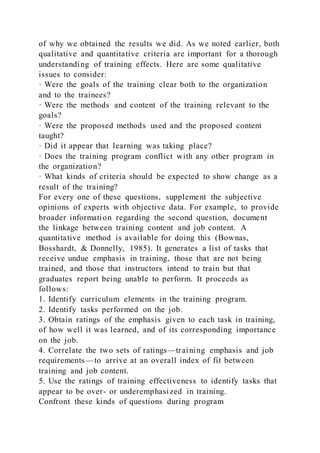
Results
Here’s the surprise: Only the weakest test of the hypothesis, the
postworkshop reactions of participants, indicated that the
training was effective. Neither of the two before-and-after
comparisons detected any effects, either on the team or on the
organization. Eden (1985) concluded:
The safest conclusion is that the intervention had no impact.
This disconfirmation by the true experimental designs bares the
frivolity of self-reported after-only perceptions of change. Rosy
testimonials by [trainees] may be self-serving, and their validity
is therefore suspect. (p. 98)
Quasi-Experimental Designs
In field settings, there often are major obstacles to conducting
true experiments. True experiments require the manipulation of](https://image.slidesharecdn.com/dnpprojectproposaldefensetemplate1buil-220922000134-df0699ea/85/DNP-Project-Proposal-Defense-Template1Buil-42-320.jpg)
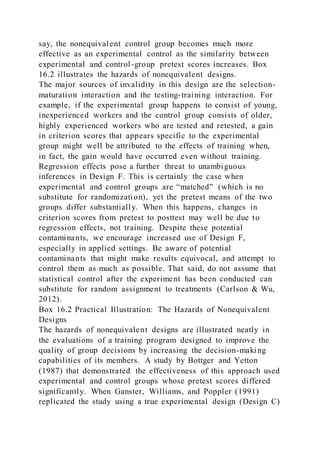

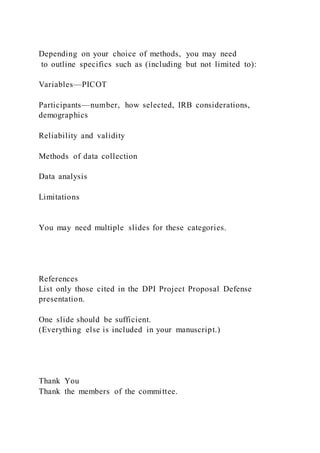
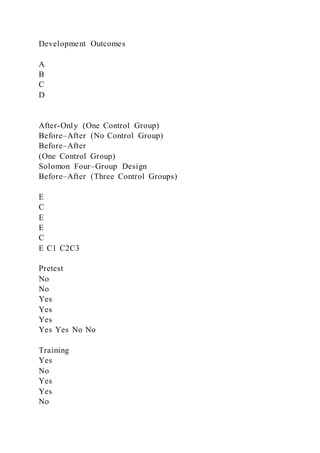
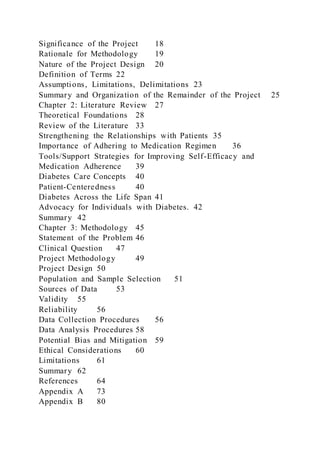
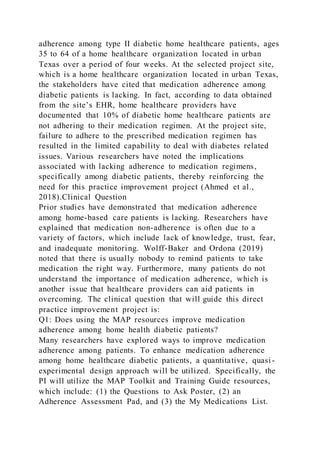
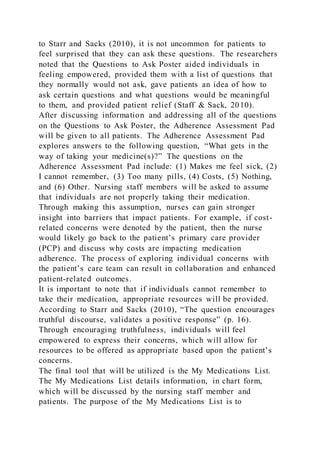
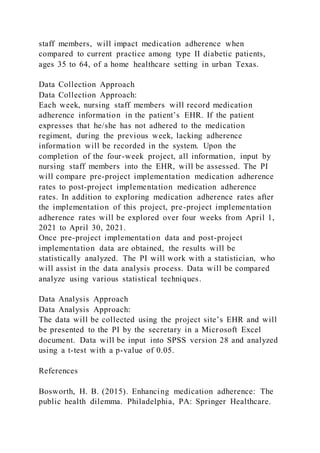
![then training, and then a posttest at time 2. At the same
chronological time (time 2), Group II receives a pretest,
training, and then a posttest at time 3. At time 2, therefore, an
experimental and a control group have, in effect, been created.
One can obtain even more information (and with quasi-
experimental designs, it is always wise to collect as much data
as possible or to demonstrate the effect of training in several
different ways) if it is possible to measure Group I again at time
3 and to give Group II a pretest at time 1. This controls the
effects of history. Moreover, the time 3 data for Groups I and II
and the posttests for all groups trained subsequently provide
information as to how the training program is interacting with
other organizational events to produce changes in the criterion
measure.
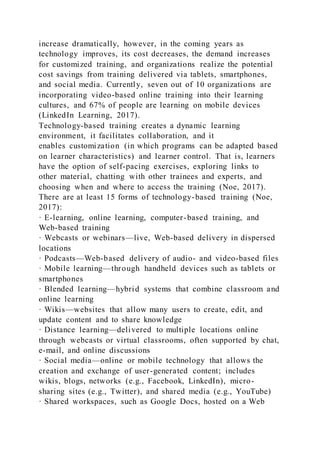
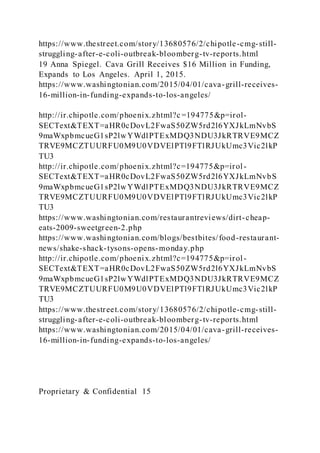
Several cross-sectional comparisons are possible with the cycle
design:
· Group I posttest scores at time 2 can be compared with Group
II pretest scores at time 2.
· Gains made in training for Group I (time 2 posttest scores) can
be compared with gains in training for Group II (time 3 posttest
scores).
· Group II posttest scores at time 3 can be compared with Group
I posttest scores at time 3 (i.e., gains in training versus gains
[or no gains] during the no-training period).
This design controls history and test–retest effects but not
differences in selection. One way to control for possible
differences in selection, however, is to split one of the groups
(assuming it is large enough) into two equated samples, one
measured both before and after training and the other measured
only after training:
Time 2
Time 3
Time 4
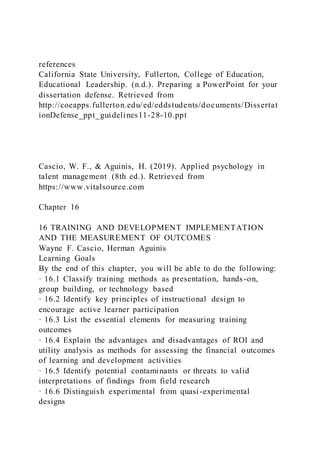
Group IIa
Measure](https://image.slidesharecdn.com/dnpprojectproposaldefensetemplate1buil-220922000134-df0699ea/85/DNP-Project-Proposal-Defense-Template1Buil-48-320.jpg)
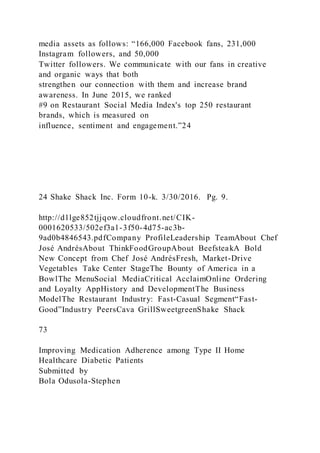
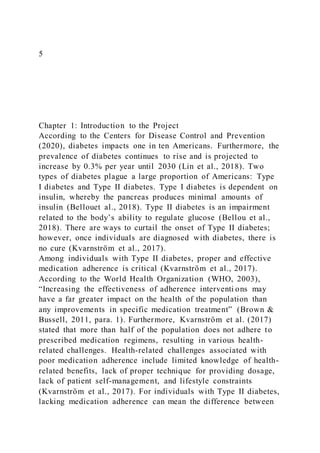
![Train
Measure
Group IIb
—
Train
Measure
Comparison of the posttest scores of two carefully equated
groups (Groups IIa and IIb) is more precise than a similar
comparison of posttest scores of two unequated groups (Groups
I and II).
A final deficiency in the cycle design is the lack of adequate
control for the effects of maturation. This is not a serious
limitation if the training program is teaching specialized skills
or competencies, but it is a plausible rival hypothesis when the
objective of the training program is to change attitudes.
Campbell and Stanley (1963) expressed aptly the logic of these
makeshift designs:
[O]ne starts out with an inadequate design and then adds
specific features to control for one or another of the recurrent
sources of invalidity. The result is often an inelegant
accumulation of precautionary checks, which lacks the intrinsic
symmetry of the “true” experimental designs, but nonetheless
approaches experimentation. (p. 57)
Other quasi-experimental designs (cf. Grant & Wall, 2009;
Kerlinger & Lee, 2000; Shadish et al., 2002) are appropriate in
specialized situations, but the ones we have discussed seem well
suited to the types of problems that applied researchers are
likely to encounter.
Statistical, Practical, and Theoretical Significance
As in selection, the problem
of statistical versus practical significance is relevant for the
assessment of training outcomes. Demonstrations of statistically
significant change scores may mean little in a practical sense.
From a practical perspective, researchers must show that the
effects of training do make a difference to organizational
goals—in terms of lowered production costs, increased sales,](https://image.slidesharecdn.com/dnpprojectproposaldefensetemplate1buil-220922000134-df0699ea/85/DNP-Project-Proposal-Defense-Template1Buil-49-320.jpg)


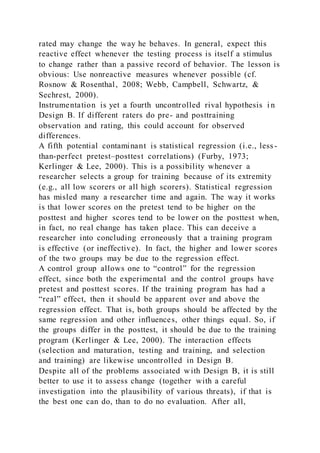
![During the onset of this project, once home healthcare nursing
staff members have attended the educational training session,
the project will be implemented. Nursing staff members will
first provide patients with the Questions to Ask Poster. The
purpose of offering this poster to patients is to address the six
questions about medication, thereby improving patients'
knowledge regarding their medication regimen and reasons for
the regimen prescribed.
After addressing the six critical questions on the Questions to
Ask Poster, patients will be provided with the Adherence
Assessment Pad. The purpose of the Adherence Assessment Pad
is to explore barriers that impact one’s adherence to the
prescribed medication regimen. There are several factors, listed
on the pad, that affect one’s medication adherence (e.g., [1]
Makes me feel sick, [2] I cannot remember, [3] Too many pills,
[4] Costs, [5] Nothing, and [6] Other). To further understand
what might be preventing patients from adhering to their
medication regimen, this resource is necessary to utilize.
Once barriers associated with medication adherence are
identified, the nursing staff member will provide patients with
the My Medications List. This list is essential to give the
patients, as it allows providers and patients to converse about a
schedule for taking one’s medication and details, in a sheet,
when medication must be taken. According to Starr and Sacks
(2010), “Filling out the Medication List may seem time-
consuming. However, your initial investment will pay off, as
patients better understand their regimens and adherence
increases” (p. 17). In addition to the time-consuming nature of
filling out the My Medications List, nursing staff members and
patients might feel overwhelmed during this first session.
However, it is important to note that subsequent nurse-patient
home healthcare meetings will seem less intense after the first
session because the My Medications List is the only MAP
resource that will be consistently reviewed over the four weeks.
To evaluate the impact of the intervention, the PI will compare
pre-project implementation medication non-adherence rates to](https://image.slidesharecdn.com/dnpprojectproposaldefensetemplate1buil-220922000134-df0699ea/85/DNP-Project-Proposal-Defense-Template1Buil-88-320.jpg)


![adherence is a critical issue that deserves a higher level of
attention. Understanding medication adherence-related barriers,
addressing those barriers, and inspiring patients to change their
actions/beliefs is an important step in improving health among
patients.
At the selected project site, healthcare workers, who work
directly with diabetic patients, believe it is critical to ensure
medication adherence. Patients present with unique health-
related challenges, thereby reinforcing the importance of
minimizing health-related threats. Lacking medication
adherence can mean the difference between life and death
(Rathish et al., 2019). Adherence to antiretroviral therapy is
considered a predictor of effective clinical outcomes among
diabetic patients, which is one of the reasons why medication
adherence is essential.
Medication adherence. The term medication adherence refers to
the art of taking medication as prescribed by a patient’s
healthcare practitioners (Ahmed et al., 2018). Healthcare
practitioners must ensure that the prescriptions that are
provided to patients are suitable to the patient’s unique
condition(s). Ahmed et al. (2018) stated that the quality of
healthcare can be influenced by the ability of the body to
respond to treatment. It is important to conduct physical
assessments of patients so high-quality care is offered.
While medication adherence is important, there is a plethora of
literature available that expresses the prevalence of medication
non-adherence among patients. Various factors continue to
impact medication adherence, which includes, but are not
limited to, fear, costs, misunderstanding, too many medications,
lack of symptoms, mistrust, worry, and depression (American
Medical Association [AMA], 2020). To prevent medication non-
adherence, providers can seek to understand the needs of
patients and provide them with resources that can aid in
overcoming non-adherence.
Enhancing medication adherence. To handle the issue of
medication adherence among the diabetic patients who have had](https://image.slidesharecdn.com/dnpprojectproposaldefensetemplate1buil-220922000134-df0699ea/85/DNP-Project-Proposal-Defense-Template1Buil-97-320.jpg)
![be identified as one of the reasons why patients may opt to not
adhere to medications in fear that they will experience the side
effects and be greatly inconvenienced, there is the need for
HCPs to offer the relevant data regarding the common types of
side effects when they are in the prescription process.
There have been issues of people and patients dying or
experiencing very negative and disturbing side effects when it
comes to them taking the medication prescribed by their
doctors. These cases have always been used as examples to
explain the reason why people have been reluctant to take
medications for prolonged periods. When an individual has a
critical illness, it is not uncommon that he/she needs to take the
prescribed medication for a long period, as this can result in
improved medication efficiency. Lacking understanding of
medication-related details has caused patients to withdraw from
their prescribed medication regimen, which is due to lacking
knowledge and prolonged side effect issues that are associated
with their medication (Institute of Medicine [IOM], 2016). For
example, when offering metformin, to enable adherence to the
drug there is a need to inform patients that are suffering from
diarrhea during their time of prescription to anticipate that the
loose bowel issues will be over in about a week if the dr ug is
continued. It is also vital to offer brief explanations about
medication side effects and benefits due to time limitations. If a
patient cannot have additional time with his/her provider, then
other members of the health care team should aid in answering
their questions and provide additional education. Education can
be in the form of printed handouts, websites, or a teaching
module that should be readily available for use with the
identified patient.
In summary, among Americans, the level of medication
illiteracy is assumed to be high. This significantly contributes
to the difficulties faced by patients when they are required to
follow instructions. There is a need for practitioners to take
time and educate patients on the right measures to take.
Educated patients will have a better understanding of the](https://image.slidesharecdn.com/dnpprojectproposaldefensetemplate1buil-220922000134-df0699ea/85/DNP-Project-Proposal-Defense-Template1Buil-101-320.jpg)


![encourage medication adherence among patients. The nursing
staff provider and patients will discuss all of the categori es in
the chart, which include: (1) Name and Doses of My Medicine,
(2) This Medication is for My Diabetes, (3) When Do I Take
and How Much [options include: morning, noon, evening, and
bedtime], and (4) I Will Remember to Take My Medicine _____
[note: the blank will be filled in]. It can be time-consuming to
fill out this list, but it’s important to note that likely, once the
patient and the provider work on the list together, patients will
buy into the chart requirements and, therefore, improve their
medication adherence. After filling out this chart, unless
modifications are needed, subsequent visits will not require the
chart to be filled out again.
In addition to the aforementioned instruments that will be
utilized, it is important to note that information from the project
site’s EHR will be collected. As mentioned above, pre-and post-
project implementation data will be collected and analyze to
determine the impact of the MAP intervention. Specifically, the
PI will examine medication adherence rates from April 1, 2021
to April 30, 2021 to determine adherence rates before the
project was implemented and four weeks after the project’s
implementation. Validity
There are various types of validity which include face validity,
content validity, criterion validity, and discriminant validity. In
terms of the MAP toolkit, the resources that are utilized, at face
value, explore the topic of interest. For example, the researchers
noted the instrument had strong validity in terms of attaining
detailed feedback from participants regarding their lacking
adherence to their prescribed medication regimen. The
statements that were asked of participants, using the MAP
resources, had good face validity and seek to encourage
adherence to one’s medication regimen.
It is important to note that from 2007 to 2009, the MAP project
was developed and included a group of professionals from the
Fund for Public Health in New York and the New York City
Department of Public Health and Mental Hygiene. The](https://image.slidesharecdn.com/dnpprojectproposaldefensetemplate1buil-220922000134-df0699ea/85/DNP-Project-Proposal-Defense-Template1Buil-114-320.jpg)


![by this letter, please contact me by (phone or email preference
of site granting permission).
Sincerely,
________________________________________
Bamidele Jokodola MSNEd, RN (Administrator)
Date
Office: (281) 498-6203 Cell: (281) 685-7280
Email: [email protected]
Bamidele Jokodola MSNEd, RN
Nations Pioneer Health Services, Inc.
Pioneer School of Health](https://image.slidesharecdn.com/dnpprojectproposaldefensetemplate1buil-220922000134-df0699ea/85/DNP-Project-Proposal-Defense-Template1Buil-137-320.jpg)


![[removed]THIS IEP INCLUDES FORMCHECKBOX Transitions.docx](https://cdn.slidesharecdn.com/ss_thumbnails/removedthisiepincludesformcheckboxtransitions-221119165454-f38db72b-thumbnail.jpg?width=640&height=640&fit=bounds)


