Download as PDF, PPTX

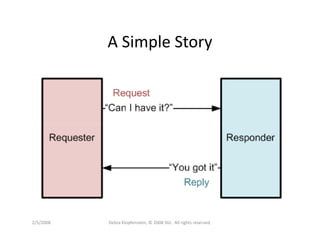
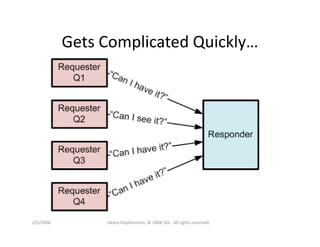
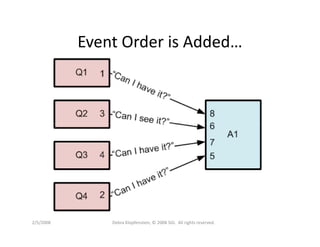
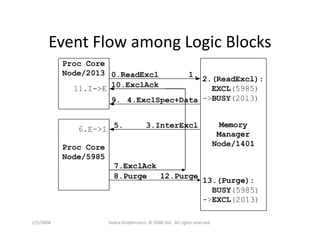

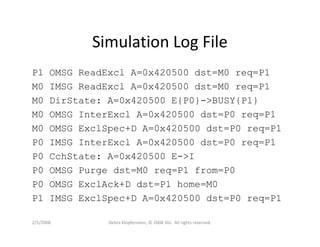
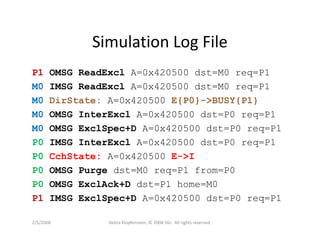
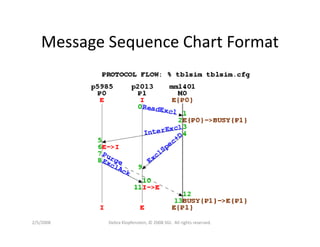
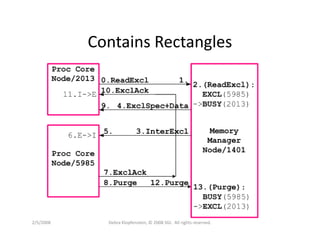
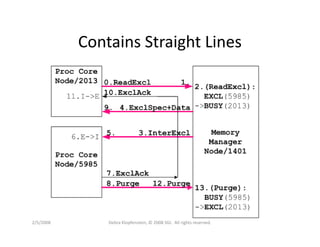
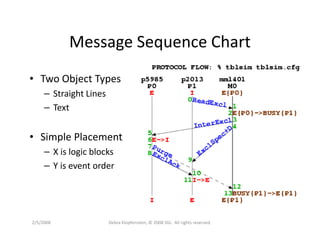
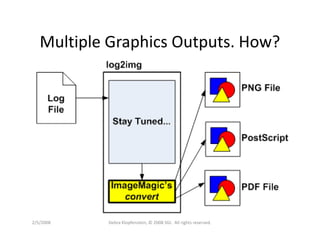
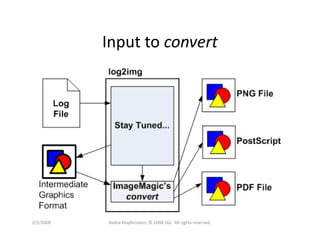
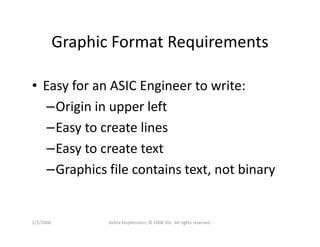
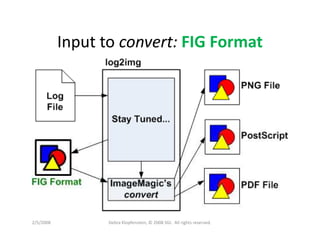
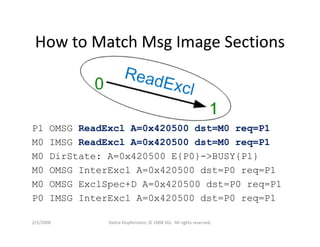
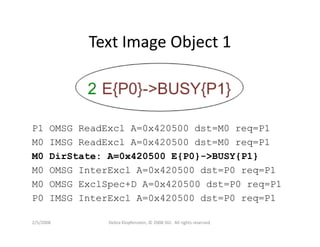
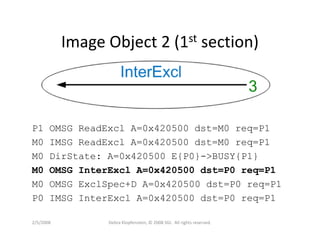
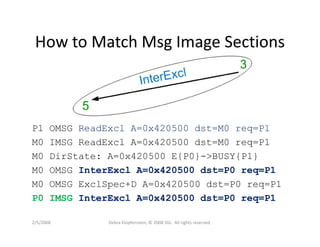
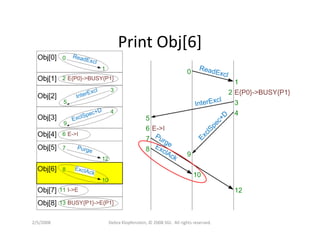
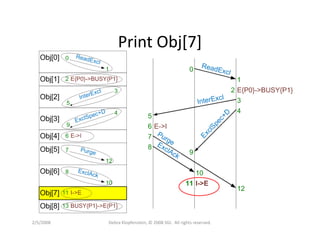
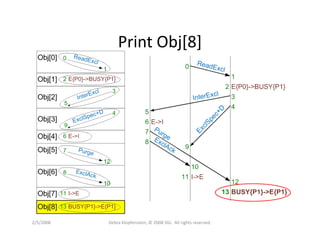
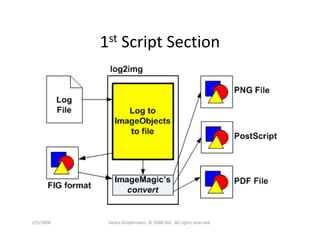
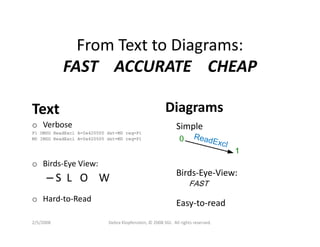
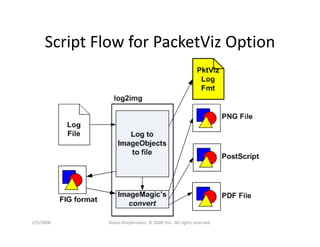
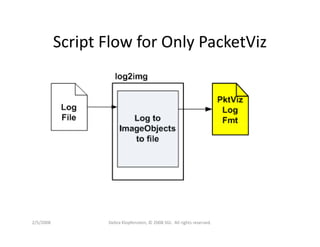
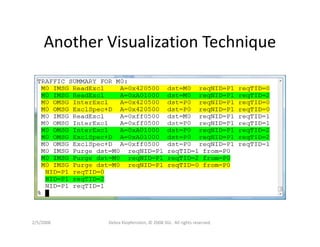
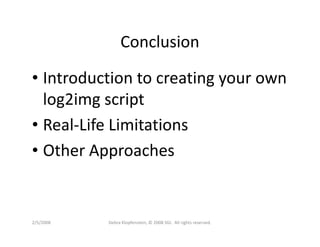
The document discusses methods for automatically generating message sequence charts without incurring software costs, aiming for speed and accuracy in visualizing event flows. It outlines a systematic approach to creating diagrams that simplify complex information through graphical representations while highlighting the input formats and structures required. Additionally, it reviews the benefits of graphical representations over textual logs for understanding and debugging processes.