This document discusses two new methodological innovations - SenseMaker and structural topic modelling - that could help bridge the gap between grassroots experiences and development research. It reviews literature on bottom-up development and traditional qualitative techniques. The document then outlines how SenseMaker and structural topic modelling were used in a research project in Kyrgyzstan to derive a development agenda from participant voices. Insights from each method are analyzed and their complementarity discussed.
![edge (Lynam & Fletcher, 2015). In contrast to quantitative text
analysis which generally posits a “bag of words” assumption,
under which the semantic structure of text is stripped out by the
model, “[n]arrative is a vital human activity which structures
experience and gives it meaning”; it “is a way of knowing” that
“assist[s] humans to make life experiences meaningful”. (Kramp,
2004, pp. 104, 107) In bridging the gap described at the start of
this essay between the outlooks and mindsets of researchers and
policymakers and people in developing communities, the utility of
narrative experience captured by SenseMaker® for development
research is well worth exploring.
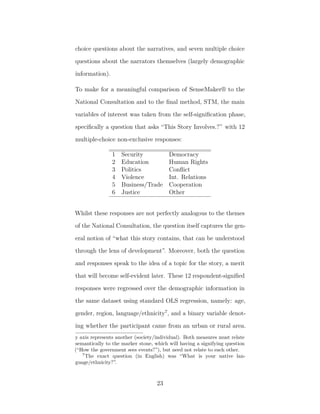
Having supplied a short story in their own terms, respondents
then complete a short series of interactive “signifers”, (this phase
is predetermined by the researcher) which commonly come in
three forms:
1. Placing a marker on triads or dyads, providing ternary
data or a polarity measure of where the story places on
two/three research relevant dimensions.
2. Answering a series of multiple choice questions with regards
the story itself. (E.g. “In this story who had the power to
influence events?”)
3. Answering a series of multiple choice questions about
the respondent. (Often common demographic informa-
tion, e.g. age, gender, ethnicity). As is apparent, by pre-
specifying a set of responses, this second phase represents a
17](https://image.slidesharecdn.com/8299f9f7-c903-4264-9292-732c0f02a843-160905132111/85/dissertation_master-18-320.jpg)
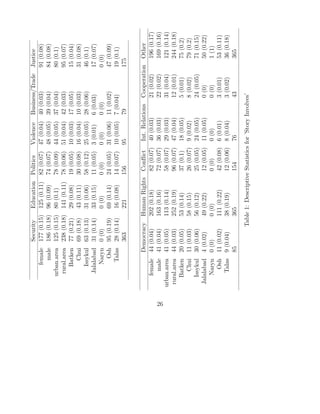
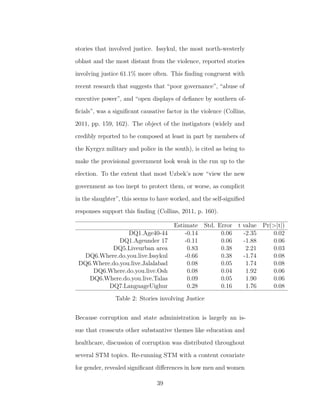
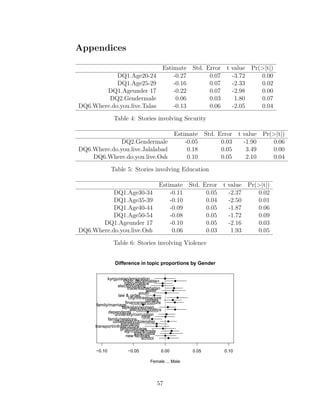
![discussed their interactions with the state. “polic[e]” was the
most probable word in the topic labelled “law and order” as dis-
cussed by men, but was only 19th among women. On inspection
of the most representative stories, men were more inclined to
discuss instances of violence and corruption by state officials,
whereas women focused more often on the apparent absence or
impotence of the state in improving their lives. Both genders
were inclined to discuss theft in equal measure, but having ob-
served the prevalence of the word “cattl[e]” of men’s stories but
not women’s, exploration of topics containing this word using
KWIC demonstrated that theft was just one aspect of a broad
range of phenomena relating to economic loss discussed by men,
property disputes (land and livestock) being chief among them.
The same treatment of the word “rude” (20th most probable
among women) revealed unpleasant interactions with state offi-
cials of many different types (doctors, police, customs officers) -
though in fairness “rude” often related to stories in which private
citizens were the antagonists.
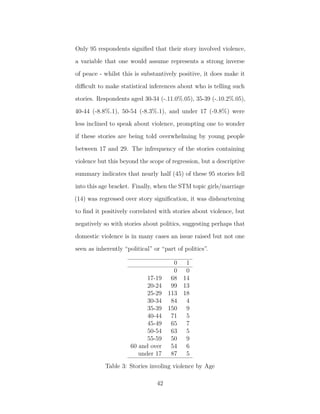
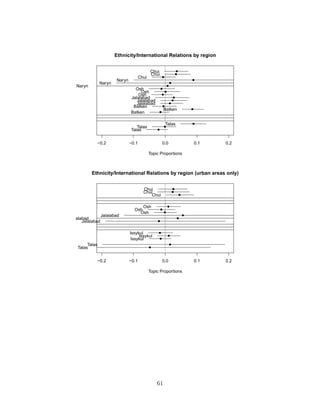
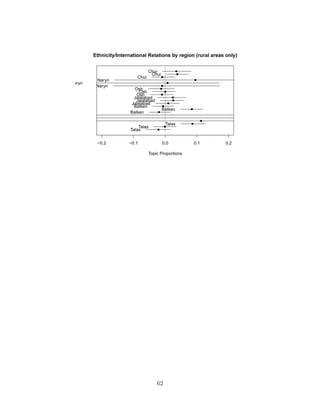
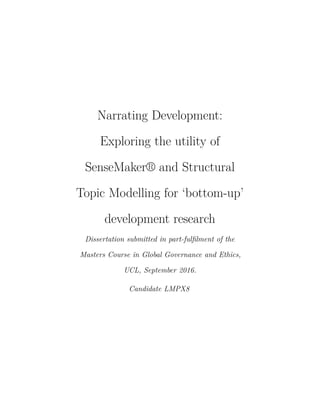
Ethnicity, Difference and Social Cohesion
As composite issue area, the insights of the National Consulta-
tion are drawn from three related themes: Peace and Stability;
and Values10
. With respect to the former, most respondents ex-
pressed a belief that there exists a “need to improve interethnic
10
The theme “Inequalities” might have suited this issue area well also,
but it composed a very small section of the report and would not have been
a particularly fruitful inclusion.
40](https://image.slidesharecdn.com/8299f9f7-c903-4264-9292-732c0f02a843-160905132111/85/dissertation_master-41-320.jpg)