A Project on
AnInvestigation on Strength of Lap Joints Using Different
Adhesives and Surface Texture Patterns
Guided By :
Prof. A. S. Bharule
Dept. of Mechanical Engg.
SSGMCE, Shegaon
Presented By:
Dipak A. Shegokar
ME II year Mechanical Engg.
(AMMSD)
SSGMCE, Shegaon
Advantages
• The adherentsare not affected by heat
• Uniform stress distribution
• Ability to join different materials
• Possibility to join very thin adherents
• Gas proof and liquid tight joints
• No contact corrosion
• Good damping properties
5.
Disadvantages
• Limited stabilityto heat
• High strength adhesives are often brittle
• Long term use may alter the properties
• Cleaning and surface preparation of the adherents is
necessary in many cases
• Specific clamping devices are often required to fix the
joint
6.
Applications
• Useful inautomobile industry for attaching brake lining
to shoes automatic transmission bands, stiffeners,
attaching windshield of cars and attaching names logos
on cars panels.
• To locate bearing and gears on the shafts.
• Find applications in the fabrication of railway coaches,
boats, refrigerators, storage tanks.
Aim and Objective
•Finding the best configuration of the pattern and
area of contact for the particular adhesive.
• Finding the effect of adhesive thickness, overlap
area and surface texture patterns on strength of
adhesive joint.
• Finding the contribution of each parameter in
improvising the strength of adhesive joint.
9.
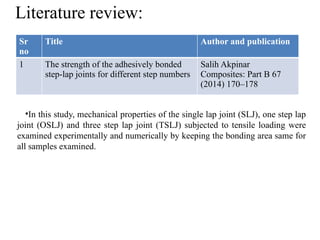
Literature review:
Sr
no
Title Authorand publication
1 The strength of the adhesively bonded
step-lap joints for different step numbers
Salih Akpinar
Composites: Part B 67
(2014) 170–178
•In this study, mechanical properties of the single lap joint (SLJ), one step lap
joint (OSLJ) and three step lap joint (TSLJ) subjected to tensile loading were
examined experimentally and numerically by keeping the bonding area same for
all samples examined.
10.
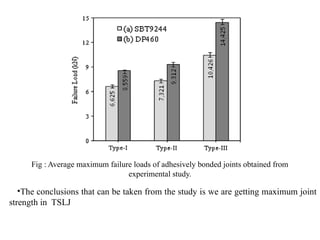
Fig : Averagemaximum failure loads of adhesively bonded joints obtained from
experimental study.
•The conclusions that can be taken from the study is we are getting maximum joint
strength in TSLJ
11.
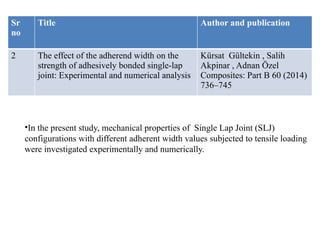
Sr
no
Title Author andpublication
2 The effect of the adherend width on the
strength of adhesively bonded single-lap
joint: Experimental and numerical analysis
Kürsat Gültekin , Salih
Akpinar , Adnan Özel
Composites: Part B 60 (2014)
736–745
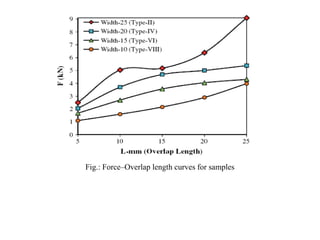
•In the present study, mechanical properties of Single Lap Joint (SLJ)
configurations with different adherent width values subjected to tensile loading
were investigated experimentally and numerically.
Sr no TitleAuthor and publication
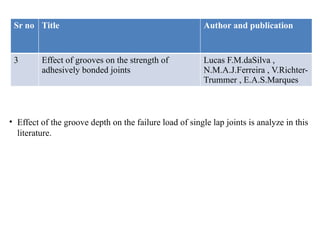
3 Effect of grooves on the strength of
adhesively bonded joints
Lucas F.M.daSilva ,
N.M.A.J.Ferreira , V.Richter-
Trummer , E.A.S.Marques
• Effect of the groove depth on the failure load of single lap joints is analyze in this
literature.
14.
Sr no TitleAuthor and publication
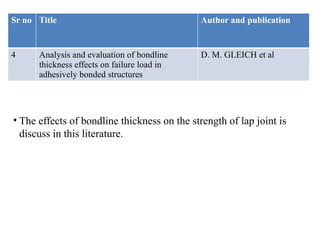
4 Analysis and evaluation of bondline
thickness effects on failure load in
adhesively bonded structures
D. M. GLEICH et al
• The effects of bondline thickness on the strength of lap joint is
discuss in this literature.
15.
Sr no TitleAuthor and publication
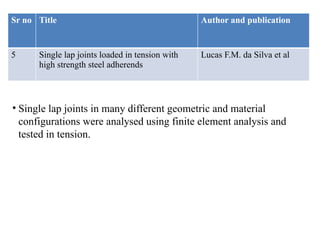
5 Single lap joints loaded in tension with
high strength steel adherends
Lucas F.M. da Silva et al
• Single lap joints in many different geometric and material
configurations were analysed using finite element analysis and
tested in tension.
16.
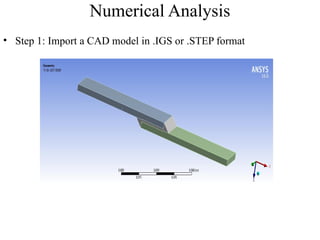
Methodology
• Carrying outliterature survey on strength of adhesive joint and factors
which affect the same.
• Study the mechanical properties of adherent and adhesives
• Prepare CAD model of adhesive joint with different surface texture patterns
• First stage- numerical analysis using FEA software for best surface texture
pattern selection.
• Statistical analysis using Taguchi technique.
• Second stage- numerical analysis using FEA software for finding results of
trials according to Taguchi analysis.
• TAGUCHI and ANOVA analysis of second stage numerical analysis result.
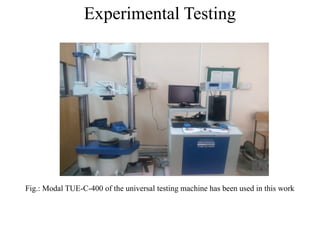
• Do the experimentation on universal testing machine to validate the
numerical analysis results.
17.
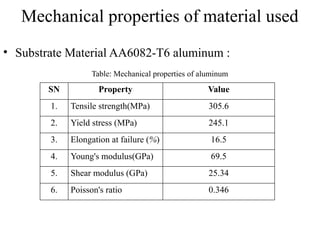
Mechanical properties ofmaterial used
• Substrate Material AA6082-T6 aluminum :
SN Property Value
1. Tensile strength(MPa) 305.6
2. Yield stress (MPa) 245.1
3. Elongation at failure (%) 16.5
4. Young's modulus(GPa) 69.5
5. Shear modulus (GPa) 25.34
6. Poisson's ratio 0.346
Table: Mechanical properties of aluminum
18.
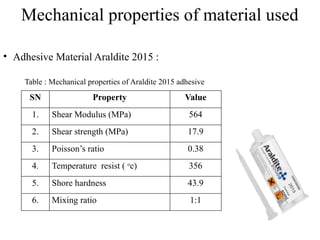
Mechanical properties ofmaterial used
• Adhesive Material Araldite 2015 :
Table : Mechanical properties of Araldite 2015 adhesive
SN Property Value
1. Shear Modulus (MPa) 564
2. Shear strength (MPa) 17.9
3. Poisson’s ratio 0.38
4. Temperature resist ( o
c) 356
5. Shore hardness 43.9
6. Mixing ratio 1:1
19.
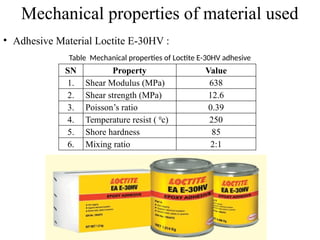
Mechanical properties ofmaterial used
• Adhesive Material Loctite E-30HV :
Table Mechanical properties of Loctite E-30HV adhesive
SN Property Value
1. Shear Modulus (MPa) 638
2. Shear strength (MPa) 12.6
3. Poisson’s ratio 0.39
4. Temperature resist ( 0
c) 250
5. Shore hardness 85
6. Mixing ratio 2:1
20.
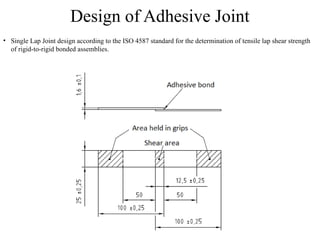
Design of AdhesiveJoint
• Single Lap Joint design according to the ISO 4587 standard for the determination of tensile lap shear strength
of rigid-to-rigid bonded assemblies.
21.
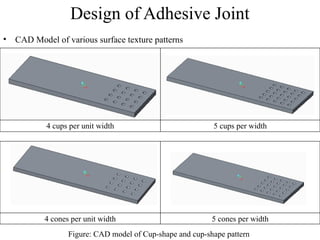
Design of AdhesiveJoint
• CAD Model of various surface texture patterns
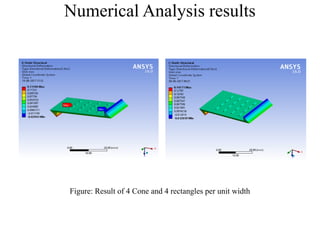
4 cups per unit width 5 cups per width
Figure: CAD model of Cup-shape and cup-shape pattern
4 cones per unit width 5 cones per width
22.
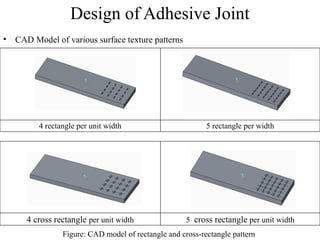
Design of AdhesiveJoint
• CAD Model of various surface texture patterns
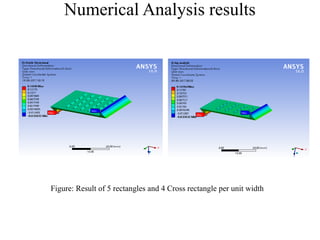
4 rectangle per unit width 5 rectangle per width
Figure: CAD model of rectangle and cross-rectangle pattern
4 cross rectangle per unit width 5 cross rectangle per unit width
23.
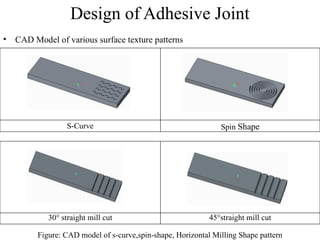
Design of AdhesiveJoint
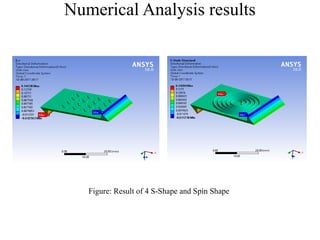
• CAD Model of various surface texture patterns
S-Curve Spin Shape
Figure: CAD model of s-curve,spin-shape, Horizontal Milling Shape pattern
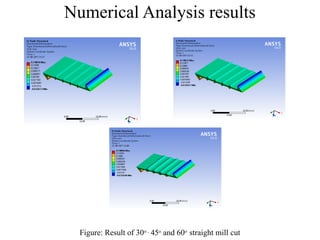
30° straight mill cut 45°straight mill cut
24.
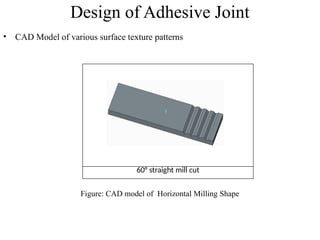
Design of AdhesiveJoint
• CAD Model of various surface texture patterns
60° straight mill cut
Figure: CAD model of Horizontal Milling Shape
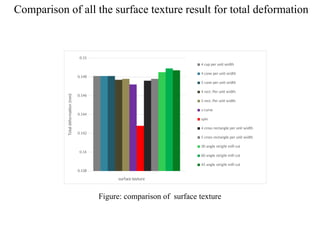
Comparison of allthe surface texture result for total deformation
0.138
0.14
0.142
0.144
0.146
0.148
0.15
4 cup per unit width
4 cone per unit width
5 cone per unit width
4 rect. Per unit width
5 rect. Per unit width
s-curve
spin
4 cross rectangle per unit width
5 cross rectangle per unit width
30 angle stright mill cut
60 angle stright mill cut
45 angle stright mill cut
surface texture
Total
deformation
(mm)
Figure: comparison of surface texture
34.
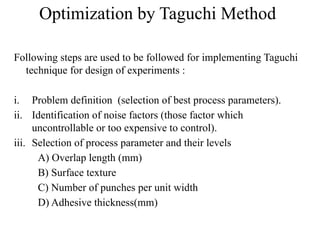
Optimization by TaguchiMethod
Following steps are used to be followed for implementing Taguchi
technique for design of experiments :
i. Problem definition (selection of best process parameters).
ii. Identification of noise factors (those factor which
uncontrollable or too expensive to control).
iii. Selection of process parameter and their levels
A) Overlap length (mm)
B) Surface texture
C) Number of punches per unit width
D) Adhesive thickness(mm)
35.
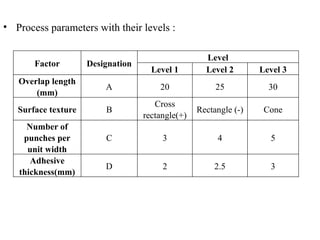
• Process parameterswith their levels :
Factor Designation
Level
Level 1 Level 2 Level 3
Overlap length
(mm)
A 20 25 30
Surface texture B
Cross
rectangle(+)
Rectangle (-) Cone
Number of
punches per
unit width
C 3 4 5
Adhesive
thickness(mm)
D 2 2.5 3
36.
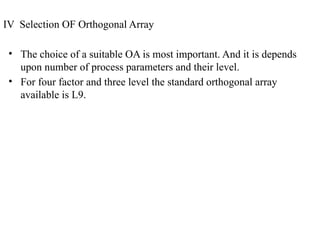
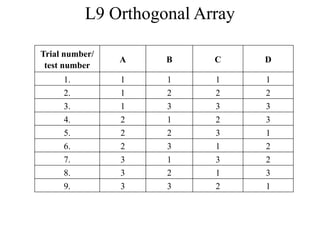
IV Selection OFOrthogonal Array
• The choice of a suitable OA is most important. And it is depends
upon number of process parameters and their level.
• For four factor and three level the standard orthogonal array
available is L9.
37.
L9 Orthogonal Array
Trialnumber/
test number
A B C D
1. 1 1 1 1
2. 1 2 2 2
3. 1 3 3 3
4. 2 1 2 3
5. 2 2 3 1
6. 2 3 1 2
7. 3 1 3 2
8. 3 2 1 3
9. 3 3 2 1
38.
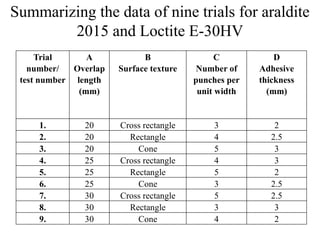
Summarizing the dataof nine trials for araldite
2015 and Loctite E-30HV
Trial
number/
test number
A
Overlap
length
(mm)
B
Surface texture
C
Number of
punches per
unit width
D
Adhesive
thickness
(mm)
1. 20 Cross rectangle 3 2
2. 20 Rectangle 4 2.5
3. 20 Cone 5 3
4. 25 Cross rectangle 4 3
5. 25 Rectangle 5 2
6. 25 Cone 3 2.5
7. 30 Cross rectangle 5 2.5
8. 30 Rectangle 3 3
9. 30 Cone 4 2
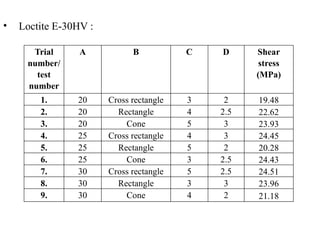
39.
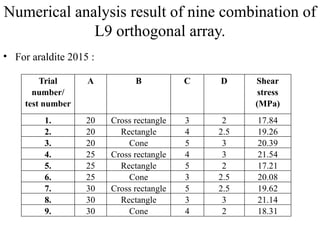
Numerical analysis resultof nine combination of
L9 orthogonal array.
• For araldite 2015 :
Trial
number/
test number
A B C D Shear
stress
(MPa)
1. 20 Cross rectangle 3 2 17.84
2. 20 Rectangle 4 2.5 19.26
3. 20 Cone 5 3 20.39
4. 25 Cross rectangle 4 3 21.54
5. 25 Rectangle 5 2 17.21
6. 25 Cone 3 2.5 20.08
7. 30 Cross rectangle 5 2.5 19.62
8. 30 Rectangle 3 3 21.14
9. 30 Cone 4 2 18.31
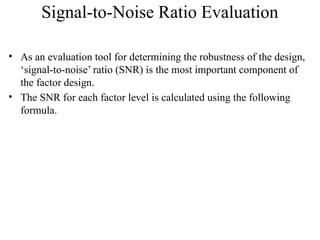
Signal-to-Noise Ratio Evaluation
•As an evaluation tool for determining the robustness of the design,
‘signal-to-noise’ ratio (SNR) is the most important component of
the factor design.
• The SNR for each factor level is calculated using the following
formula.
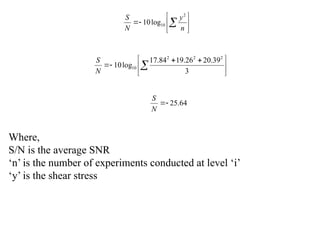
42.
Where,
S/N is theaverage SNR
‘n’ is the number of experiments conducted at level ‘i’
‘y’ is the shear stress
n
y
N
S 2
10
log
10
3
39
.
20
26
.
19
84
.
17
log
10
2
2
2
10
N
S
64
.
25
N
S
43.
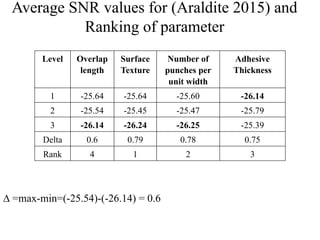
Average SNR valuesfor (Araldite 2015) and
Ranking of parameter
Level Overlap
length
Surface
Texture
Number of
punches per
unit width
Adhesive
Thickness
1 -25.64 -25.64 -25.60 -26.14
2 -25.54 -25.45 -25.47 -25.79
3 -26.14 -26.24 -26.25 -25.39
Delta 0.6 0.79 0.78 0.75
Rank 4 1 2 3
∆ =max-min=(-25.54)-(-26.14) = 0.6
44.
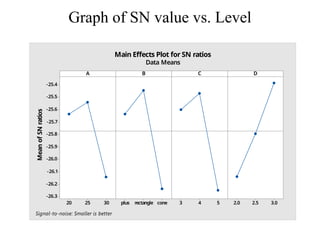
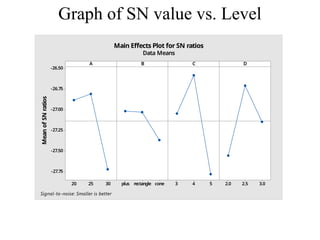
Graph of SNvalue vs. Level
30
25
20
-25.4
-25.5
-25.6
-25.7
-25.8
-25.9
-26.0
-26.1
-26.2
-26.3
cone
rectangle
plus 5
4
3 3.0
2.5
2.0
A
Mean
of
SN
ratios
B C D
Main Effects Plot for SN ratios
Data Means
Signal-to-noise: Smaller is better
45.
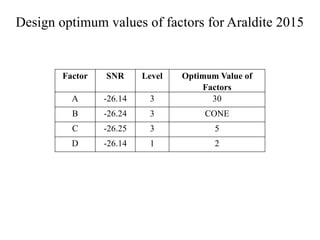
Design optimum valuesof factors for Araldite 2015
Factor SNR Level Optimum Value of
Factors
A -26.14 3 30
B -26.24 3 CONE
C -26.25 3 5
D -26.14 1 2
46.
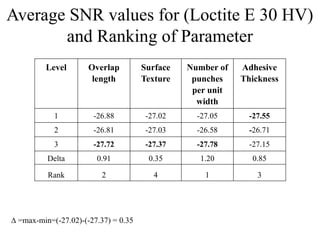
Average SNR valuesfor (Loctite E 30 HV)
and Ranking of Parameter
Level Overlap
length
Surface
Texture
Number of
punches
per unit
width
Adhesive
Thickness
1 -26.88 -27.02 -27.05 -27.55
2 -26.81 -27.03 -26.58 -26.71
3 -27.72 -27.37 -27.78 -27.15
Delta 0.91 0.35 1.20 0.85
Rank 2 4 1 3
∆ =max-min=(-27.02)-(-27.37) = 0.35
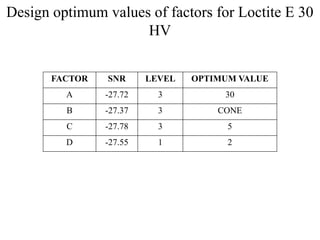
Design optimum valuesof factors for Loctite E 30
HV
FACTOR SNR LEVEL OPTIMUM VALUE
A -27.72 3 30
B -27.37 3 CONE
C -27.78 3 5
D -27.55 1 2
49.
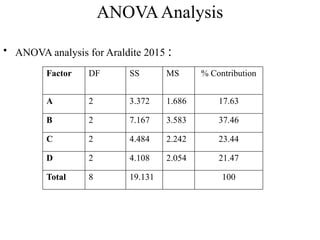
ANOVAAnalysis
• ANOVA analysisfor Araldite 2015 :
Factor DF SS MS % Contribution
A 2 3.372 1.686 17.63
B 2 7.167 3.583 37.46
C 2 4.484 2.242 23.44
D 2 4.108 2.054 21.47
Total 8 19.131 100
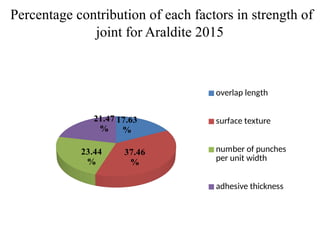
50.
Percentage contribution ofeach factors in strength of
joint for Araldite 2015
17.63
%
37.46
%
23.44
%
21.47
%
overlap length
surface texture
number of punches
per unit width
adhesive thickness
51.
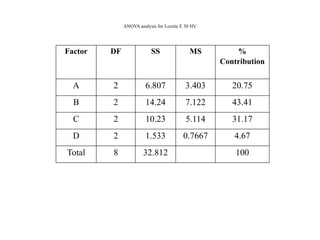
ANOVA analysis forLoctite E 30 HV
Factor DF SS MS %
Contribution
A 2 6.807 3.403 20.75
B 2 14.24 7.122 43.41
C 2 10.23 5.114 31.17
D 2 1.533 0.7667 4.67
Total 8 32.812 100
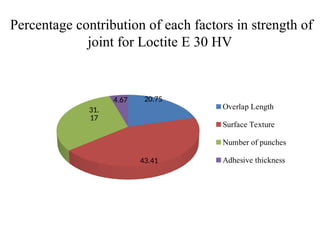
52.
Percentage contribution ofeach factors in strength of
joint for Loctite E 30 HV
20.75
43.41
31.
17
4.67
Overlap Length
Surface Texture
Number of punches
Adhesive thickness
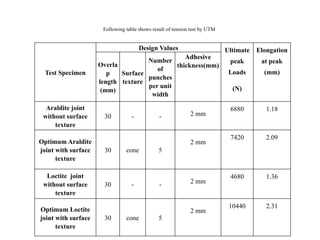
53.
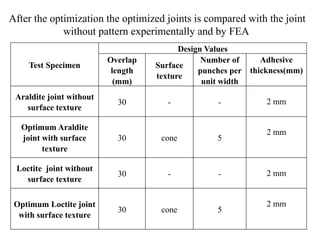
After the optimizationthe optimized joints is compared with the joint
without pattern experimentally and by FEA
Test Specimen
Design Values
Overlap
length
(mm)
Surface
texture
Number of
punches per
unit width
Adhesive
thickness(mm)
Araldite joint without
surface texture
30 - - 2 mm
Optimum Araldite
joint with surface
texture
30 cone 5
2 mm
Loctite joint without
surface texture
30 - - 2 mm
Optimum Loctite joint
with surface texture
30 cone 5
2 mm
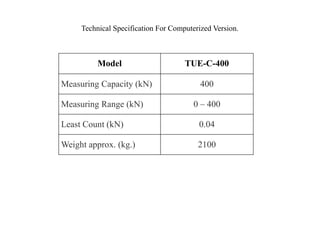
Technical Specification ForComputerized Version.
Model TUE-C-400
Measuring Capacity (kN) 400
Measuring Range (kN) 0 – 400
Least Count (kN) 0.04
Weight approx. (kg.) 2100
56.
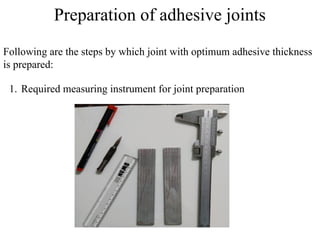
Preparation of adhesivejoints
1. Required measuring instrument for joint preparation
Following are the steps by which joint with optimum adhesive thickness
is prepared:
57.
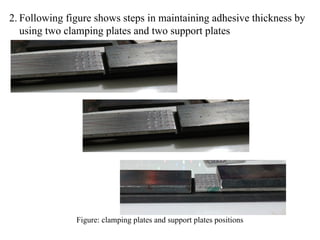
2. Following figureshows steps in maintaining adhesive thickness by
using two clamping plates and two support plates
Figure: clamping plates and support plates positions
58.
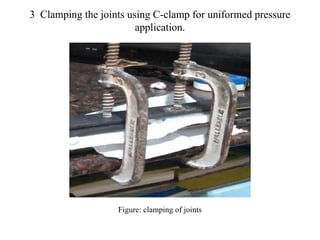
3 Clamping thejoints using C-clamp for uniformed pressure
application.
Figure: clamping of joints
59.
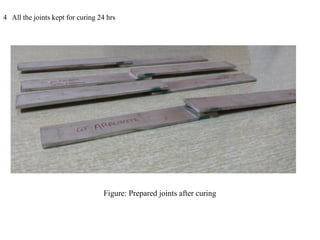
4 All thejoints kept for curing 24 hrs
Figure: Prepared joints after curing
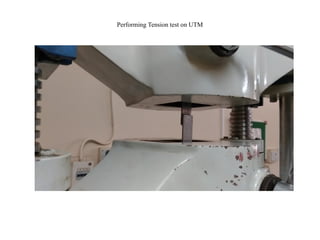
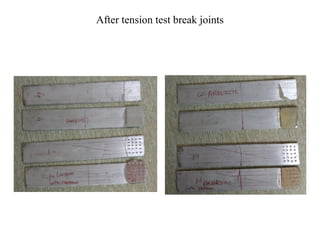
Following table showsresult of tension test by UTM
Test Specimen
Design Values Ultimate
peak
Loads
(N)
Elongation
at peak
(mm)
Overla
p
length
(mm)
Surface
texture
Number
of
punches
per unit
width
Adhesive
thickness(mm)
Araldite joint
without surface
texture
30 - - 2 mm
6880 1.18
Optimum Araldite
joint with surface
texture
30 cone 5
2 mm
7420 2.09
Loctite joint
without surface
texture
30 - - 2 mm
4680 1.36
Optimum Loctite
joint with surface
texture
30 cone 5
2 mm
10440 2.31
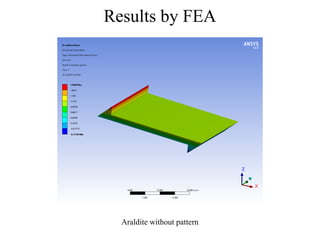
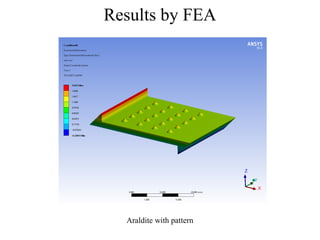
63.
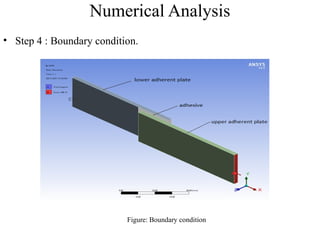
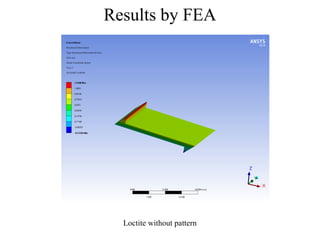
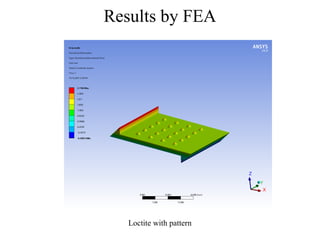
FEAAnalysis
• To validatethe results apply the ultimate peak load along the x
axis. And one end fixed supported. And there corresponding
deformation is measure.
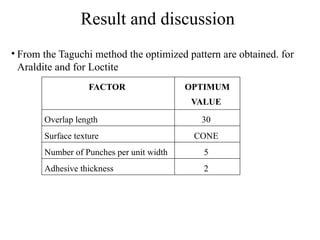
Result and discussion
•From the Taguchi method the optimized pattern are obtained. for
Araldite and for Loctite
FACTOR OPTIMUM
VALUE
Overlap length 30
Surface texture CONE
Number of Punches per unit width 5
Adhesive thickness 2
69.
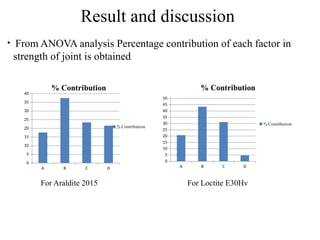
Result and discussion
•From ANOVA analysis Percentage contribution of each factor in
strength of joint is obtained
A B C D
0
5
10
15
20
25
30
35
40
% Contribution
% Contribution
For Araldite 2015 For Loctite E30Hv
A B C D
0
5
10
15
20
25
30
35
40
45
50
% Contribution
% Contribution
70.
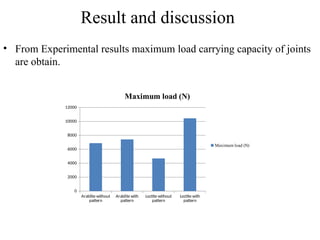
Result and discussion
•From Experimental results maximum load carrying capacity of joints
are obtain.
Araldite without
pattern
Araldite with
pattern
Loctite without
pattern
Loctite with
pattern
0
2000
4000
6000
8000
10000
12000
Maximum load (N)
Maximum load (N)
71.
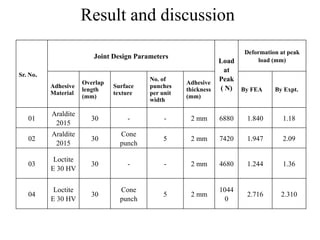
Result and discussion
Sr.No.
Joint Design Parameters
Load
at
Peak
( N)
Deformation at peak
load (mm)
Adhesive
Material
Overlap
length
(mm)
Surface
texture
No. of
punches
per unit
width
Adhesive
thickness
(mm)
By FEA By Expt.
01
Araldite
2015
30 - - 2 mm 6880 1.840 1.18
02
Araldite
2015
30
Cone
punch
5 2 mm 7420 1.947 2.09
03
Loctite
E 30 HV
30 - - 2 mm 4680 1.244 1.36
04
Loctite
E 30 HV
30
Cone
punch
5 2 mm
1044
0
2.716 2.310
72.
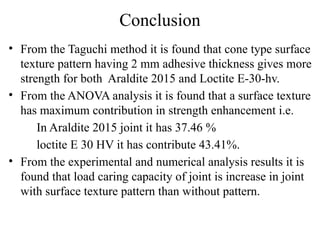
Conclusion
• From theTaguchi method it is found that cone type surface
texture pattern having 2 mm adhesive thickness gives more
strength for both Araldite 2015 and Loctite E-30-hv.
• From the ANOVA analysis it is found that a surface texture
has maximum contribution in strength enhancement i.e.
In Araldite 2015 joint it has 37.46 %
loctite E 30 HV it has contribute 43.41%.
• From the experimental and numerical analysis results it is
found that load caring capacity of joint is increase in joint
with surface texture pattern than without pattern.
73.
References:
1. Ranjit. K.Roy, “A Primer on the Taguchi Method”, society of Manufacturing
Engineers, Dearborn Michigan, 1990.
2. Shiuh-Chuan Her, “Stress analysis of adhesively-bonded lap joints”, Composite
Structures 47 (1999) 673-678.
3. D. M. GLEICH, M. J. L. VAN TOOREN and A. BEUKERS “Analysis and evaluation
of bondline thickness effects on failure load in adhesively bonded structures” J.
Adhesion Sci. Technol., Vol. 15, No. 9, pp. 1091–1101 (2001) .
4. Lucas F.M. da Silva, T.N.S.S. Rodrigues, M.A.V. Figueiredo, M.F.S.F. de Moura and
J.A.G. Chousal, “Effect of adhesive type and thickness on the lap shear strength”. 25
Jan 2007.
5. E.A.S. Marques and Lucas F.M. da silva, “Joint strength optimization of adhesively
bonded patches”. 03 Dec 2008.
6. Lucas F.M. da Silva, G.W. Critchlow and M.A.V. Figureiredo, “Parametric study of
adhesively bonded single lap joint by the Taguchi Method”. Journal of adhesion
science and technology, PP. 1477-1494 (2008).
7. L.D.R. Grant, R.D.Adams, Lucas F.M. da Silva, “Experimental and numerical analysis
of single-lap joints for the automotive industry”. Adhesion and adhesive 29 (2009)
405-413.
8. Lucas F.M. da silva. R.J.C.Carbas, G.W. Critchlow, M.A.V. Figueiredo, K. Brown,
“Effect of material, geometry, surface treatment and environment on the shear strength
of single lap joint”, Internation journal adhesion and adhesives 29 (2009) PP. 621-632.
74.
9. C. Borsellino,G.D. Bella, V.F. Ruisi, “Adhesive joining of aluminum AA6082:
The effects of resin and surface treatment”. International journal of adhesion &
adhesive 29 (2009) 36-44
10.Mariana D. Banea and Lucas F. M da Silva, “Mechanical characterization of
flexible adhesives”. The journal of adhesion. PP. 261 – 285 PP. 2009.
11.Lucas F.M. da Silva, N.M.A.J. Ferreira, V.Richter-Trummer, E.A.S. Marques,
“Effect of grooves on the strength of adhesively bonded joints” International
Journal of Adhesion & Adhesives 30 (2010) 735–743.
12.Christian Wedding, Steven T. Woodward, Michel Marre, Jens Nellesen, Verena
Psyk, A. Erman Tekkaya, “Influence of grooves charcteristics on strength of
form fit joints”. Journal of materials Proceedings Technology 211 925- 935
(2011).
13.Chang W.V., Wang JS, “ Enhancement of adhesive joint strength by surface
texturing”. J. Appl Polym Sci 26:1759-1776 (2011).
75.
14.Locuas Papadakis, VassosVassiliou, Michalis Menicou, Manuel Schiel,
“Adhesive bonding on painted car bodies in automotive production lines;
Alternatives and cost analysis”. 4 July, 2012.
15.E.F. Karachalios, R.D.Adams, Lucas F.M.da Silva, “Single lap joints loaded
in tension with high strength steel adherends” International Journal of
Adhesion & Adhesives 43 (2013) 81–95.
16.Kürsat Gültekin , Salih Akpinar, Adnan Özel “The effect of the adherend
width on the strength of adhesively bonded single-lap joint: Experimental and
numerical analysis” Composites: Part B 60 (2014) 736–745.
17.Salih Akpinar “The strength of the adhesively bonded step-lap joints for
different step Number” Composites: Part B 67 (2014) 170–178.
18.Babak Haghpanah, Shihung Chiu, Ashkan Vaziri “Adhesively bonded lap
joints with extreme interface geometry” International Journal of Adhesion &
Adhesives 48(2014)130–138
76.
PUBLICATIONS
[1] Dipak Shegokar,Prof. Ajay Bharule, “An Investigation on Strength of Lap Joints Using
Different Adhesives and Surface Texture Patterns”, International Journal of Scientific
Research in Science, Engineering and Technology (IJSRSET). ISSN: 2395-1990 Online
ISSN : 2394-4099. Volume 3, Issue 8, Dec 2017 Page No.- 835-844.
[2] Dipak Shegokar, Prof. Ajay Bharule, “Design parameter optimization to enhance strength
of adhesively bonded single lap joint using Taguchi methodology”, International Journal
for Scientific Research and development.vol. 5,Issue 12, 2018, ISSN(online): 2321-0613.

![PUBLICATIONS
[1] Dipak Shegokar, Prof. Ajay Bharule, “An Investigation on Strength of Lap Joints Using
Different Adhesives and Surface Texture Patterns”, International Journal of Scientific
Research in Science, Engineering and Technology (IJSRSET). ISSN: 2395-1990 Online
ISSN : 2394-4099. Volume 3, Issue 8, Dec 2017 Page No.- 835-844.
[2] Dipak Shegokar, Prof. Ajay Bharule, “Design parameter optimization to enhance strength
of adhesively bonded single lap joint using Taguchi methodology”, International Journal
for Scientific Research and development.vol. 5,Issue 12, 2018, ISSN(online): 2321-0613.](https://image.slidesharecdn.com/dipakpresentationfinal18052018-250812115946-a5390d81/85/Dipak-Presentation-final-18-05-2018-pptx-76-320.jpg)


