1. A system to assess the stability of airborne nanoparticle
agglomerates under aerodynamic shear
Yaobo Ding a
, Michael Riediker a,b,n
a
Institute for Work and Health (IST), Universities of Lausanne and Geneva, Route de la Corniche 2, CH-1066 Epalinges, Switzerland
b
SAFENANO, IOM Singapore, Singapore 048622, Singapore
a r t i c l e i n f o
Article history:
Received 13 February 2015
Received in revised form
29 May 2015
Accepted 8 June 2015
Available online 16 June 2015
Keywords:
Nanoparticle
Deagglomeration
Aerosol
Stability
Occupational exposure
a b s t r a c t
Stability of airborne nanoparticle agglomerates is important for occupational exposure
and risk assessment in determining particle size distribution of nanomaterials. In this
study, we developed an integrated method to test the stability of aerosols created using
different types of nanomaterials. An aerosolization method, that resembles an industrial
fluidized bed process, was used to aerosolize dry nanopowders. We produced aerosols
with stable particle number concentrations and size distributions, which was important
for the characterization of the aerosols' properties. Next, in order to test their potential for
deagglomeration, a critical orifice was used to apply a range of shear forces to them. The
mean particle size of tested aerosols became smaller, whereas the total number of
particles generated grew. The fraction of particles in the lower size range increased, and
the fraction in the upper size range decreased. The reproducibility and repeatability of the
results were good. Transmission electron microscopy imaging showed that most of the
nanoparticles were still agglomerated after passing through the orifice. However, primary
particle geometry was very different. These results are encouraging for the use of our
system for routine tests of the deagglomeration potential of nanomaterials. Furthermore,
the particle concentrations and small quantities of raw materials used suggested that our
system might also be able to serve as an alternative method to test dustiness in existing
processes.
& 2015 The Authors. Published by Elsevier Ltd. This is an open access article under the CC
BY license (http://creativecommons.org/licenses/by/4.0/).
1. Introduction
Increasing number of products based on nanotechnology are leading to an increasing potential for human exposure to
nanomaterials in the workplace. Workers can be exposed to nanoparticles during manufacturing processes, use of products,
transport, storage or waste treatment (Curwin & Bertke, 2011; Koivisto et al., 2012; Kuhlbusch & Fissan, 2006). The
inhalation of nanomaterials poses potential health risks (Bourdon et al., 2013; Paur et al., 2011). Particle sizes and their state
of agglomeration determine where they deposit in the lung structure (Rissler et al., 2012; Zhang & Kleinstreuer, 2011). The
size of agglomerates may also influence toxicological mechanisms (Noël et al., 2012). Furthermore, nanoparticles deposited
in lungs could by-pass their defense system and enter the circulatory system, which could adversely affect the
Contents lists available at ScienceDirect
journal homepage: www.elsevier.com/locate/jaerosci
Journal of Aerosol Science
http://dx.doi.org/10.1016/j.jaerosci.2015.06.001
0021-8502/& 2015 The Authors. Published by Elsevier Ltd. This is an open access article under the CC BY license
(http://creativecommons.org/licenses/by/4.0/).
n
Corresponding author at: Institute for Work and Health (IST), Universities of Lausanne and Geneva, Route de la Corniche 2, CH-1066 Epalinges,
Switzerland. Tel.: þ41 21 314 74 53; fax: þ41 21 314 74 30.
E-mail address: Michael.Riediker@alumni.ethz.ch (M. Riediker).
Journal of Aerosol Science 88 (2015) 98–108
2. cardiovascular system (Geiser & Kreyling, 2010; Oberdoerster et al., 2004). Information on the particle size distributions of
nanomaterials is, therefore, important for assessing the deposition and likelihood of translocation across biological barriers.
The stability of nanomaterial agglomerates is another important material parameter in modeling nanomaterial release
and associated human exposure. Most of the industrially important nanomaterials are initially produced in the form of
powders. These powders can easily enter the airborne phase as single particles, aggregates, or agglomerates. The size of the
agglomerates, however, is often outside the nano-range and can reach from several hundred nanometers to micrometers in
diameter (Gomez, Irusta, Balas, Navascues, & Santamaria, 2014). The mechanisms of particle agglomeration, as summarized
by Schneider and Jensen (2009), include physical interlock (rough surface, entangled surface shapes, or chain-like, branched
structure), electric forces (Van der Waal, conductive/non-conductive), magnetic forces (ferromagnetic, induced magnetic)
and soft bridging (sticky surface, liquid film, organic functional groups). Previous studies reported that the deagglomeration
of such submicron clusters is dependent on the energy present in the process from which they are released and the
turbulence of their transport in the air (Islam & Cleary, 2012; Yang, Chan, & Chan, 2014). Such processes have also been
shown to release primary particles or smaller, nano-sized agglomerates (Froeschke, Kohler, Weber, & Kasper, 2003;
Stahlmecke et al., 2009).
Agglomeration strength can be studied directly, by measuring the binding force between individual particles, or
indirectly, by triggering deagglomeration using external forces such as impaction or shear. Binding energy between primary
particles was studied using atomic force microscopy (Blum & Blum, 2009). In the inertial impaction method, nanoparticle
(NP) agglomerates collided with a substrate at high velocities (Froeschke et al., 2003). By subsequently analyzing
transmission electron microscopy (TEM) images of the agglomerates, their degree of fragmentation was determined as a
function of their impact velocity. The aerosol generation methods in their study included spark discharge generation and
flame synthesis. For silver NPs, the degree of fragmentation increased as collision velocity increased, but decreased with
smaller primary particle size. Another fragmentation method is the application of shear-forces in the air by forcing the
agglomerate aerosol through a critical orifice. Originally, this effect was described for micrometer-sized particles (Fonda
et al., 1999). Compact particles were effectively separated from each other in the turbulent airflow conditions created by a
large drop in pressure. A recent study described the deagglomeration of nano-sized agglomerates (Stahlmecke et al., 2009).
The overpressure used to create different shear forces stayed below or equal to 140 kPa. The mean particle size of the
materials tested decreased as the overpressure was increased; this was interpreted as deagglomeration.
Two key components are needed to investigate the stability of NP aerosols with regards to changes in their size and
numbers: an aerosolization system, and a means of applying energy to the airborne particles so as to test their stability, as
described above. Ideally, the aerosolization system should be able to produce an aerosol with stable particle concentration
and size distribution for a reasonably long time. Furthermore, it should only require the use of small amounts of material so
that even expensive, novel materials can be tested. Different aerosolization methods exist, such as the continuous drop
method (Bach & Schmidt, 2008), the rotating drum method (Breum, 1999; Schneider & Jensen, 2008), the vortex shaker
method (Morgeneyer, Le Bihan, Ustache, & Aguerre-Chariol, 2013), the magnetic stirrer setup (Stahlmecke et al., 2009) and
the stirred fluidization system (Saleh et al., 2014). These systems can produce different particle number concentrations by
controlling such experimental parameters as the feed rate, rotation speed, or shaking frequency. However, these setups also
have some disadvantages. Aerosol stability is a key problem, as the few published time-series graphs for these systems
attest (Morgeneyer et al., 2013). Furthermore, the amount of material needed for the continuous drop method (500 g), the
rotating drum method (35 cm3
) (CEN, 2013) and the stirred fluidization method (200 g) makes these tests too expensive to
be conducted for some nanomaterials. Recently, a modified rotating drum method based on a downscaled version of EN
15051 was developed, which uses much less powder (6 g) per test (Schneider & Jensen, 2008). Other aerosolization systems
which employs relatively lower amount of raw material include the Venturi dustiness testing device (Evans, Turkevich,
Roettgers, Deye, & Baron, 2013) and the low-mass dustiness tester that simulates the powder falling process
(O'Shaughnessy, Kang, & Ellickson, 2011). The powder quantities used in these two methods are 10 mg and 15 mg. Finally,
the friction in the magnetic stirrer setup can create static charges during aerosolization that have the potential to alter an
aerosol's state of agglomeration.
To overcome the shortcomings of the traditional systems, we turned to the fluidized bed system—an aerosolization
concept commonly used in modern powder technology and known for its simple, easily controlled operational
characteristics (Ahmed Mahmoud, Nakazato, Nakajima, Nakagawa, & Kato, 2004). Until now, fluidized bed systems were
used mostly with powders composed of micrometer-sized particles. In the present study, a process closely based on the
fluidized bed concept was established to create stable aerosols from nanopowders. An orifice-based approach was then used
to study the deagglomeration potential of airborne nanomaterials using a wide range of air turbulence levels induced by the
pressure drop across the critical orifice. Different types of materials were tested to investigate the influence of such
characteristics as their composition, surface coating, primary particle size, and shape.
2. Material and methods
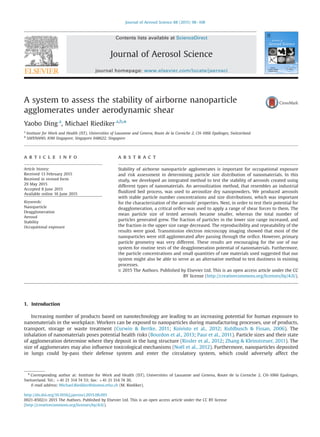
An integrated system was developed, composed of an aerosolization device, transport tubing, a deagglomeration orifice,
and a measurement chamber (Fig. 1). A special glass funnel was used to activate dry powders. The relatively thick funnel
wall (2–3 mm) was designed to resist pressure differences of up to 400 kPa. Before the start of the test, the funnel was filled
with dry powder via the top opening. An airflow is then passed through a nozzle (2.1 mm diameter) at the bottom of the
Y. Ding, M. Riediker / Journal of Aerosol Science 88 (2015) 98–108 99
3. funnel to aerosolize the material and create a single-jet fluidized bed by which aerosols are carried towards the top of the
funnel. Nozzles of different diameters can be used to modify the formation of the air jet. During the aerosolization process,
the powder accelerates through the center of the lower part of the funnel and then flows back down along the wall. The rate
of airflow is between 0.3 and 1.0 L/min, which creates air speeds from 1.44 to 4.81 m/s at the bottom opening. This airflow
generates turbulent movements in the powder and ensures a vigorous aerosolization process. In the top part of the funnel,
the airflow becomes laminar, with a Reynolds number from 7.4 (0.3 L/min) to 24.7 (1.0 L/min). In this laminar flow, particles
with a settling velocity lower than the vertical upward airflow velocity will eventually escape the funnel through the top
opening. The aerodynamic cut-off diameters, calculated for particles made of different materials, ranged from 2 to 5 μm,
with the airflows 0.3–1.0 L/min. The calculations were based on the densities of the bulk materials; thus the actual
diameters of the particle agglomerates emitted would be slightly larger when effective densities and shape are taken into
account. The particles emitted are subsequently transported along carbon-doped conductive tubing (Milian S.A.) into a
mixing chamber and are then diluted with particle-free air to adjust the total volume of airflow. Conditioned air, with
different relative humidity, can also be added to the aerosol flow during this phase, in order to study how humidity
influences aerosol stability.
The air from the aerosolization system is guided to the deagglomeration orifice, through which the aerosols flow into the
measurement chamber. An orifice of 400 μm diameter was used to apply shear forces to the particles. The orifice used in the
present study features a transition zone in which the airflow gradually accelerates and concentrates toward the center. Due
to the restriction of the orifice, upstream pressure is higher than downstream pressure. Once upstream pressure exceeds
twice downstream pressure, the system reaches a condition of choked flow during which the volumic flow rate cannot be
increased, even if the upstream pressure is increased. Under this condition, the air velocity at the orifice equals that of
sound. In the present study, the pressure in the measurement chamber was kept at one atmosphere by a one-way valve for
the overflow of air that was not used by the measurement devices. The pressure difference across the orifice is controlled by
managing the upstream pressure. The turbulence level of the airflow inside the critical orifice, which can be indicated by the
Reynolds number (Re), increases as upstream pressure increases (Hinds, 1982, 2–41). Such a turbulent airflow can already
trigger some deagglomeration of loosely bonded agglomerates. Even larger stress is experienced by the aerosol particles
when they exit the critical orifice at high velocities, where the turbulent movements and drag forces induced as they
encounter the surrounding still air cause further fragmentation of the agglomerates, as reported by Ammar, Dehbi, & Reeks
(2012) who had studied these processes in a system consisting of a transporting tube and an expansion zone with micro-
sized TiO2 aerosol particles.
The number-size distribution of the aerosols in the measurement chamber was assessed using a scanning mobility
particle sizer (SMPS, GRIMM, 11.1–1083.3 nm); set to fast mode, each scan takes about 3.5 min. The sampling flow rate was
set to 0.3 L/min. An optical particle counter (OPC, GRIMM, 0.25–32 μm) was also used to characterize large particles. The
spectrometer scanned once every second and the sampling rate was 1 L/min. Particle morphology was assessed by collecting
particles, using a mini-sampler (ECOMESURE, Janvry, France), directly onto TEM grids (200 mesh, copper, Formvar/Carbon)
coated with a thin carbon film. The sampling rate was set at 0.3 L/min. Sampling time was 5–15 min, depending on the
aerosol particle number concentration. The TEM grids were subsequently analyzed using a transmission electron
microscope (TEM, CM100, H.T. 80 kV, Philips, Eindhoven, Netherlands).
The system's total length of transport tubing was kept as short as possible to avoid particle loss. The tube connecting the
funnel to the mixing chamber and on to the measurement chamber was about 1 m, and the horizontal portion of the tube
Fig. 1. Schematic diagram of the test system with magnification of the aerosolization device (left part) and the critical orifice (bottom part).
Y. Ding, M. Riediker / Journal of Aerosol Science 88 (2015) 98–108100
4. was less than 50 cm. The SMPS and the OPC/mini-sampler tubes were each 1 m long. The tubes' inner diameter was 6 mm.
The airflow rates used in the tests were 5 L/min or less. The flow Re number at the maximum flow rate was 1172.6,
indicating a laminar flow process. Under laminar flow conditions, particle penetration efficiency under gravitational settling
calculated for 5 μm, 1 μm, and 0.1 μm diameter SiO2 particles are 94%, 99.7%, and 99.9%, respectively (Kulkarni, Baron, &
Willeke, 2011, 6–49, 6–50). For small SiO2 particles, the penetration rates under diffusion loss are 90.9%, 96.1%, 98.7%, and
99.4%, for 10 nm, 20 nm, 50 nm, and 100 nm NPs, respectively (Hinds, 1982). These results are very similar for other
materials of a variety of densities.
Our experiments used upstream pressure conditions of 100, 200, 300, and 400 kPa in order to apply different shear force
levels to the aerosols. A pressure of 100 kPa was used as the reference condition, and the critical orifice was not installed. At
this pressure, the aerosol passed through a normal tube outlet into the measurement chamber. Airflow rates of 0.3–1.0 L/min
were used to activate the different dry nano-powders in order to achieve similar aerosolization levels under the reference
condition pressure. At high pressures, the volumic flow rate was increased to maintain a constant level of aerosolization. The
dilution flow rate was precisely tuned to achieve the required upstream pressure. Prior to tests, filtered clean air (relative
humidityo10%) was used to flush the system until the background particle concentration in the measurement chamber was
below 10 p/cm3
(SMPS). Each test used 250710 mg of powder. The materials tested are listed in Table 1. All the powders were
provided by the European Commission's Joint Research Centre in Ispra, Italy, except for SiO2 ΙΙ, which is a commercially
available product (AEROSIL R974). Particles of ZnO ΙΙ were coated with a layer of triethoxycaprylylsilane; all other powders
were uncoated. The powders were stored in sealed glass bottles before use. Powder weights were measured using an
analytical balance (type AL-311, 70.1 mg, American Weigh Scales, Inc.) placed inside a ventilation hood. In the aerosolization
process, the activation flow was increased gradually to produce a smooth fluidized bed formation. Dilution flow was
introduced subsequently. Immediately after the flows were set, the SMPS and OPC were started simultaneously to monitor the
state of the aerosol. Once the particle number and size in the measurement chamber reached a steady state (normally
after 30 min aerosolization), the mini-sampler's pump was started in order to collect airborne samples onto the TEM grids.
In this steady state, 10 readings were taken from SMPS scans and from the OPC to calculate averages. A complete test
usually lasted 1.5–2 h.
In order to analyze any changes in size distribution in the aerosols, the relative number size distributions were calculated
from the raw SMPS data. This allowed an easier comparison of size spectra with different particle concentration levels.
Particle number fractions in different size ranges were calculated to quantify the changes in particle diameter. Particle
generation rates under varied pressure conditions were also compared. Analysis of variance (ANOVA) was performed, using
Stata software (Stata CorpLP, Texas, USA), to compare the particle size distributions obtained under different pressure
conditions.
3. Results and discussion
3.1. Aerosolization
Firstly, we tested our system's capacity to create and maintain aerosols with stable size distributions and number
concentrations over some time. Figure 2 (left) shows the evolution through time of total particle number concentration and
the individual size channels during a single aerosolization experiment of hydrophobic SiO2 ΙΙ powder at atmospheric
pressure (without using the critical orifice). Airborne particles were detected as soon as the airflow began. The particle
number concentration increased gradually at first and then became relatively stable. The same pattern applied to the
particle number concentration in each individual size channel. Figure 2 (right) shows that the particle number and size
distribution did not change significantly once the aerosol entered a steady state. During this period, the variation in the
geometric mean size was within 72%. The steady state lasted 0.5–2 h, depending on the type of material and the amount of
powder used, and 10 consecutive SMPS scans were selected from this period to calculate the average size and number
concentrations. The results show that the system managed to deliver a stable aerosolization process. This stability allows a
correct assessment of mean particle sizes from a series of continuous scans, even when the instruments used had relatively
long scanning periods, such as the SMPS.
Table 1
Physical and chemical properties of the tested powders.
Material Ref. Composition Primary size (nm) Surface coating Surface area (m2
/g) Crystal structure
SiO2 Ι NM200 96.5% SiO2 20 Hydrophilic 230 Amorphous
SiO2 ΙΙ R974 Z99.8% SiO2 12 Hydrophobic 170720 Precipitated
ZnO Ι NM110 4 99% ZnO 42 Uncoated 13 Zincite (52%)/amorphous (48%)
ZnO ΙΙ NM111 96%–99% ZnO 34 Triethoxycaprylylsilane 16 Zincite (34%)/amorphous (66%)
Ce(IV)O2 Ι NM211 90%–100% CeO2 10 Uncoated 66 Precipitated
Ce(IV)O2 ΙΙ NM212 99.5% CeO2 33 Uncoated 28 Precipitated
Y. Ding, M. Riediker / Journal of Aerosol Science 88 (2015) 98–108 101
5. The minimal flow rates required to activate the different types of powders in our experiments ranged from 0.3 L/min to
0.5 L/min. To understand the potential influence of the aerosolization flow rate on the particle concentration and size
distribution generated, an additional series of tests was conducted using a larger range of airflow rates to aerosolize the
powders at atmospheric pressure. Flow rates were increased step by step, and each step lasted 1 h. A constant dilution flow
was maintained throughout the test to help stabilize the aerosol generated. Figure 3 (left) shows the evolution of
hydrophobic SiO2 ΙΙ particle numbers under six different aerosolization flow rates. Higher flow rates generated more
particles. Particle concentrations reached steady state conditions under all six flow rates. The mode sizes measured from the
lowest to highest flows were 142.1 nm, 132.8 nm, 129.7 nm, 116.8 nm, 115.6 nm, and 133.8 nm, respectively, with an average
size of 128.5 nm and 10.4 nm (8%) standard deviation. At the highest flow rate, an additional side maximum appeared in the
particle size distribution in the micrometer size range. The higher flow rate seemed to cause particles with higher settling
velocity to exit the funnel into the rest of the system, whereas under low flow rate conditions, these micron-sized particles
are effectively kept back. This phenomenon is also shown in Fig. 3 (right), which compares relative size–number
distributions normalized to the total particle number. The shapes of the size distribution spectra were otherwise very
similar. These experiments suggested that the system was capable of generating very consistent aerosols at different flow
rates, as long as the flow was kept well below the speed that would cause large particles to escape the upper part of the
funnel. Within the flow range used in these experiments (0.3–0.9 L/min), particle size distributions were robust, allowing a
comparison of data from different tests.
The particle number concentrations generated from the tested materials were compared to those of similar studies, as
shown in Fig. 4. These systems include the standard rotating drum method (Tsai et al., 2009), the continuous drop method
(Dahmann & Monz, 2011), the modified rotating drum method (Schneider & Jensen, 2008), and the vortex shaker method
(Morgeneyer et al., 2013; Ogura, Sakurai, & Gamo, 2009). Lower and upper concentration limits under different
experimental parameters in these studies were identified. Different testing conditions were employed in these systems,
such as amount of powder used, total airflow and dilution rate and volumes of the different compartments. A comparison of
the concentrations obtained for different substances in a given system provides a relative ranking of dustiness. By
coincidence, many of these systems show also similar absolute number concentrations for equal substances tested. In all test
systems, silica generated high particle number concentrations, followed by cerium oxide, and zinc oxide powders. The same
pattern was observed using our system. These results suggest that our approach may also be useful for doing dustiness
testing, in particular if only small quantities of novel and costly nanomaterials can be made available for testing purposes.
Fig. 2. Left: evolution of particle numbers during the aerosolization process (SMPS, black curve, total number of particles; all curves below are particle
numbers in individual size channels). Right: overlay of the particle number size distribution in the steady state.
Fig. 3. Left: 3D representation of the particle number-size distribution at different airflow rates. Right: comparison of relative number concentrations at
the same flow rates.
Y. Ding, M. Riediker / Journal of Aerosol Science 88 (2015) 98–108102
6. 3.2. Deagglomeration tests
3.2.1. Influence of pressure modifications on mean particle size
The introduction of different pressure conditions had immediate effects on the geometric mean size of the aerosols. The
results are shown in Fig. 5 for different materials. Firstly, significant reductions in mean particle size were observed for most
of the materials tested as pressures increased. The exception was type II SiO2 with a hydrophobic surface coating. In contrast,
all other aerosols, including type I hydrophilic SiO2, showed a drop of 25–40% in their original mean sizes. Secondly,
deviations were seen between the same materials with different surface coatings or original primary particle sizes: the two
types of SiO2 aerosol exhibited almost a three-fold difference in mean particle size, as the blue curves show. After testing,
the deviation still existed. For the two types of Ce(IV)O2, the difference in particle size was smaller but still distinguishable.
Averagely 25% difference was recorded between this two materials for the four pressure condition. In comparison, the two
ZnO powders generated similar results whether they were coated or uncoated. Thirdly, the effects of the three highest
pressures were similar or, in other words, the effect became smaller as the pressure rose. This is shown in the graph by the
flatter slopes between 200 and 400 kPa.
Theoretically, the drag force that a moving particle experiences from the surrounding air is proportional to its diameter,
meaning smaller particles experience less resistance. This might explain the ineffectiveness of the critical orifice on the
hydrophobic SiO2 aerosols and the reduced effects of the highest pressures on the other materials. Moreover, smaller
agglomerates are more likely to be composed of tightly packed primary particles, in comparison to large ones that are
loosely bonded internally. Hence, it is more difficult to break smaller agglomerates up into smaller particles. The deviation in
mean particle size for the same types of material can be due to different primary particle diameters/shapes, surface areas,
and coating types. For example, the CeO2 and SiO2 aerosols composed of larger-sized primary particles had larger
agglomerate sizes. The two types of ZnO had similar primary particle diameters and their agglomerate sizes are also closely
comparable. Additionally, the coating type seemed to contribute to the size difference of the SiO2 aerosols. In the
experiments, the hydrophilic powder was much fluffier than its hydrophobic counterpart. It was also more difficult to
aerosolize and sometimes required a higher flow rate in order to achieve stable aerosolization. Obvious differences in the
appearances of the ZnO powders were not observed, however. The agglomerate size of different materials was also
influenced by their elemental composition, as this determines the Hamaker constant in van der Waals interaction (Hamaker,
1937). In summary, these results suggest that different nanomaterials have different lower particle or particle aggregate size
limits below which they tend not to deagglomerate further under normal conditions where extreme energy processes are
not present.
Fig. 5. Influence of pressure on geometric mean diameter for different materials (data from the SMPS).
Fig. 4. Comparison of our particle number concentrations (black bars) with those of other aerosolization systems (gray bars), PHI – hydrophilic, PHO –
hydrophobic.
Y. Ding, M. Riediker / Journal of Aerosol Science 88 (2015) 98–108 103
7. 3.2.2. Influence of pressure modifications on particle number size distribution
Following the changes in GMD seen in the aerosols, the number size distribution spectra were compared in order to
reveal the potential effects on different size ranges, as shown in Fig. 6 (left) for ZnO I (uncoated) as an example. The mode
size was largely shifted to the smaller size range. The particle number fractions in the upper size range decreased, and those
in the lower size range increased (shown by the zoom-in windows). Furthermore, the variation in the particle fraction in
each size channel was reduced, as indicated by the shortened error bars. The only exception was hydrophobic SiO2 aerosol
which did not experience any noticeable change in the mode size. For other materials with different surface coatings (results
not shown), the same patterns of reduced mean particle size and enhanced stability were registered. However, the
difference in effect between the three highest pressure levels were not obvious, despite using the ANOVA method to
statistically evaluate the significance of those pressure changes on the size spectra. The results were positive for all the
materials when comparing the reference and overpressure conditions. The effects of pressure over a wider range of sizes
based on the data from the optical particle counter (OPC) were also compared. Generally, the particle number fraction in the
lower end of the size range increased as pressure increased. For aerosols with relatively larger particle sizes, such as
hydrophilic SiO2, the OPC provided a good size resolution for presenting potential modifications.
In a similar study (Stahlmecke et al., 2009), the reduction in mean particle size was also observed when pressures up to
240 kPa are applied in the critical orifice. However, in their study, the aerosols had larger mean sizes both before and after
testing, as well as broader spectra resulting from a different aerosolization process. Another recent study investigated
deagglomeration of micronized lactose particles by using nozzles with different diameters (Sosnowski, Giżyńska, & Żywczyk,
2014). The greatest reduction in mean particle size was from 5.6 μm to 3.2 μm. In comparison, the present study worked
with smaller particles under higher pressures. These conditions allowed the study of NP behavior in a lower size range and
their airborne stability within extreme energy processes.
As the different shear forces applied produced similar results, more closely defined pressure steps were tested in order to
understand the point where effects started. The results for coated ZnO II are shown in Fig. 6 (right). It shows the same
general pattern of size reduction as pressure rises. At 120 kPa, a well-distributed size spectrum with a narrow peak was
already created, as the red curve shows. With continuously increasing pressures, the peak lowered and moved gradually to
the left. The particle number fraction below 100 nm continued to grow during this process. Results suggested that the
critical orifice can already start to affect certain materials at low-shear force levels, indicating their loosely bonded
agglomerate structure (see section on morphological characterization).
3.2.3. Influence of pressure modifications on particle number concentration
The consequences of pressure increases on particle generation rates are shown in Fig. 7. This rate corresponds to the
aerosol concentration divided by the total airflow. Particle generation is greatly enhanced under higher pressure conditions.
The influences of pressure varied across different types of material. The two ZnO powders and the type II CeO2 showed the
most significant increases, with 70- to 80-fold increases under the three highest pressures. Type I SiO2 showed only minor
augmentation (about six-fold). The generation rates of the ZnO powders under the reference pressure were below 250 units
on the graph. The increases in ZnO particle numbers corresponded well to the reductions in their mean particle size and
fitted with the idea that the deagglomeration of larger particles might have been due to external forces. The result suggested
that potential particle loss in the critical orifice is negligible for the tested powders. Chen et al. investigated the particle loss
mechanism inside a critical orifice (Chen et al., 2007) and found that this process mainly occurred downstream of the orifice.
They attributed this to large turbulence in the air stream in that region. However, in their study, the critical orifice exit led
into another tube, while in our system the critical orifice led directly into the wide measurement chamber. Thus particle
losses were minimized by the open space after the orifice.
Fig. 6. Comparison of particle size distribution under different pressure conditions (from SMPS), left: ZnO I tested at 100–400 kPa and right: ZnO II at 100–
200 kPa.
Y. Ding, M. Riediker / Journal of Aerosol Science 88 (2015) 98–108104
8. 3.2.4. Influence of pressure modifications on particle number fractions in different size ranges
The influences of the pressure modifications on the particle number fractions of the different materials were also
calculated (see Fig. 8) by grouping the particles into three size ranges: o100 nm, 100–350 nm, and 4350 nm. The 100 nm
cut-off represents the diameter of nanoparticles according to the definition of nanoparticles. The aerodynamic behavior of
particles changes to being mostly influenced by either inertia or Brownian motion at a size of approximately 350 nm.
Particle numbers in each of the three size ranges were summed and subsequently normalized to the total particle number.
At elevated pressures, most of the materials showed increased particle number fractions in the o100 nm size range. The
results seemed to be powder-dependent. The two ZnO powders showed a seven-fold change in their particle number
fractions, from 2% to 14% under the highest pressure. The two CeO2 powders showed a three- to five-fold increase. In
contrast, SiO2 aerosols were not much affected. In the 4350 nm size range, the particle number fractions were reduced
under higher pressures. The values were three to five times lower for ZnO and CeO2, but for SiO2 particles only a slight
reduction of number counts was seen. For the 100–350 nm size range, most of the materials showed little change in the
Fig. 8. Comparison of pressure influences on particle number fractions for different materials (from SMPS, 10.8–1083.1 nm).
Fig. 7. Particle generation rates for different materials under increasing pressures.
Y. Ding, M. Riediker / Journal of Aerosol Science 88 (2015) 98–108 105
9. number fraction except for the type I hydrophilic SiO2, which saw an increase in numbers. These modifications in particle
number fractions suggested that it was mostly the larger agglomerates which broke up into NPs.
3.2.5. Repeatability and reproducibility
Replicate tests were conducted under different shear force conditions for all the materials tested in order to examine the
reproducibility of the results. For any single aerosolization, the absolute particle number concentration at steady state could
vary by up to several-fold under the same experimental conditions. However, the relative number concentrations
(normalized to total particle number) were highly reproducible. The size distribution spectra, measured in replicate tests,
overlap tightly. The variations of the mean particle size were within 5% under different pressure conditions. The p values
obtained in the statistical analysis (ANOVA for geometric mean sizes in replicate tests) were 0.522, 0.141, and 0.502 for SiO2
II under 100 kPa, CeO2 II under 300 kPa and ZnO I under 400 kPa, respectively. These results indicate that the variations in
particle concentration in the different experiments did not significantly alter the particle size distribution.
4. Morphology analysis
The airborne samples collected onto TEM-grids were assessed for primary particle shape and agglomerate structure.
Figure 9 shows the different agglomerate morphologies of the materials tested. The two types of ZnO were composed of rod-
like particles. The CeO2 II particles appeared as square blocks, whereas the CeO2 I and the two types of SiO2 particles had
round shapes with smooth edges. The ZnO agglomerates showed porous, loose structures, whereas the other two materials
showed denser agglomerations of primary particles. The comparison of TEM images confirmed that average agglomerate
sizes were smaller at higher pressure conditions, as shown in Fig. 10. The denser structure of the hydrophobic SiO2
agglomerates shown on the TEM images may also explain why the mean particle size for this material remained relatively
stable despite varied pressure conditions, whereas the porous ZnO agglomerates seemed to rapidly collapse under external
forces, which is in agreement with observed reductions in particle size and increases in particle number. Further studies are
needed to assess whether this was because of the primary particle shapes or other particle properties.
5. Conclusions
In this article, we describe a robust system for the aersolization of nanomaterial powders and the subsequent
characterization of their agglomerate sizes. We also assess how stable their agglomerates are by varying energy with
pressure drops affecting the aerosols across a critical orifice. The system allows us to create aerosols that are very stable over
time, which is important for the correct characterization of the aerosols created in this study, but which could also prove
useful for other purposes where a well-controlled aerosol environment is needed, for example in toxicological studies. The
comparison of the present study's particle concentrations with published dustiness data for similar powders suggests that
the system also has the potential to be used as a dustiness testing system requiring only small quantities of powder
Fig. 9. TEM images of airborne samples for different materials (condition: 100 kPa). Inset: 10-fold magnification compared to main image.
Y. Ding, M. Riediker / Journal of Aerosol Science 88 (2015) 98–108106
10. (200 mg/test in our setup). This could prove to be a useful alternative to the standard rotating drum method (CEN EN15051)
and the continuous drop methods, which both require relatively large amounts of powder. Using our system, the pressure
drop across the critical orifice, used to test the stability of the aerosol, can be finely controlled. The air in our system is
accelerated to sonic speed—the highest possible speed in such a system. These high levels of shear force correspond to the
range of energy input that might be expected in most industrial and laboratory processes. The reductions in particle size and
the increased particle number counts under elevated pressure-drop conditions, suggest that some of the NP agglomerates
break apart in the air. We propose the use of this system for the routine testing of nanomaterials in order to obtain a ranking
of their deagglomeration potentials. This will be useful for exposure and risk assessments on nanosafety issues. Moreover,
our system not only enables a study of the influence of environmental conditions, such as relative humidity, but also of
particles with different surface functionalities.
Acknowledgments
The authors are grateful for the financial support for this study from the EU FP7 project on Managing Risks of
Nanomaterials (MARINA) (Grant agreement no. 263215). They also wish to thank the University of Lausanne for the use of its
Electron Microscopy Facility for TEM characterizations.
References
Ahmed Mahmoud, E., Nakazato, T., Nakajima, S., Nakagawa, N., & Kato, K. (2004). Separation rate of fine powders from a circulating powder-particle
fluidized bed (CPPFB). Powder Technology, 146(1–2), 46–55, http://dx.doi.org/10.1016/j.powtec.2004.07.004.
Ammar, Y., Dehbi, A., & Reeks, M. (2012). Break-up of aerosol agglomerates in highly turbulent gas flow. Flow, Turbulence and Combustion, 89(3), 465–489,
http://dx.doi.org/10.1007/s10494-012-9398-8.
Bach, S., & Schmidt, E. (2008). Determining the dustiness of powders—a comparison of three measuring devices. Annals of Occupational Hygiene, 52(8),
717–725, http://dx.doi.org/10.1093/annhyg/men062.
Blum, J., & Blum, J. (2009). Dust agglomeration. European Astronomical Society Publications Series, 35, 195–217, http://dx.doi.org/10.1051/eas/0935011.
Bourdon, J.A., Williams, A., Kuo, B., Moffat, I., White, P.A., & Halappanavar, S., et al. (2013). Gene expression profiling to identify potentially relevant disease
outcomes and support human health risk assessment for carbon black nanoparticle exposure. Toxicology, 303(0), 83–93, http://dx.doi.org/10.1016/j.
tox.2012.10.014.
Breum, N.O. (1999). The rotating drum dustiness tester: Variability in dustiness in relation to sample mass, testing time, and surface adhesion. Annals of
Occupational Hygiene, 43(8), 557–566, http://dx.doi.org/10.1016/S0003-4878(99)00049-6.
CEN (2013). FprEN 15051 Workplace exposure: measurement of the dustiness of bulk materials; Part 1: Requirements and choice of test methods; Part 2: Rotating
drum method; Part 3: Continuous drop method. European Committee for Standardization: Brussels, Belgium.
Chen, S.-C., Tsai, C.-J., Wu, C.-H., Pui, D.Y.H., Onischuk, A.A., & Karasev, V.V. (2007). Particle loss in a critical orifice. Journal of Aerosol Science, 38(9), 935–949,
http://dx.doi.org/10.1016/j.jaerosci.2007.06.010.
Fig. 10. Comparison of airborne samples under different pressure conditions.
Y. Ding, M. Riediker / Journal of Aerosol Science 88 (2015) 98–108 107
11. Curwin, B., & Bertke, S. (2011). Exposure characterization of metal oxide nanoparticles in the workplace. Journal of Occupational and Environmental Hygiene,
8(10), 580–587, http://dx.doi.org/10.1080/15459624.2011.613348.
Dahmann, D., & Monz, C. (2011). Determination of dustiness of nanostructured materials. Gefahrstoffe - Reinhaltung der Luft, 71(11–12), 481–487.
Evans, D.E., Turkevich, L.A., Roettgers, C.T., Deye, G.J., & Baron, P.A. (2013). Dustiness of fine and nanoscale powders. Annals of Occupational Hygiene, 57(2),
261–277, http://dx.doi.org/10.1093/annhyg/mes060.
Fonda, M., Petach, M., Rogers, C.F., Huntington, J., Stratton, D., & Nishioka, K., et al. (1999). Resuspension of particles by aerodynamic deagglomeration.
Aerosol Science and Technology, 30(6), 509–529, http://dx.doi.org/10.1080/027868299304381.
Froeschke, S., Kohler, S., Weber, A.P., & Kasper, G. (2003). Impact fragmentation of nanoparticle agglomerates. Journal of Aerosol Science, 34(3), 275–287,
http://dx.doi.org/10.1016/S0021-8502(02)00185-4.
Geiser, M., & Kreyling, W. (2010). Deposition and biokinetics of inhaled nanoparticles. Particle and Fibre Toxicology, 7(1), 2.
Gomez, V., Irusta, S., Balas, F., Navascues, N., & Santamaria, J. (2014). Unintended emission of nanoparticle aerosols during common laboratory handling
operations. Journal of Hazardous Materials, 279(0), 75–84, http://dx.doi.org/10.1016/j.jhazmat.2014.06.064.
Hamaker, H.C. (1937). The London—van der Waals attraction between spherical particles. Physica, 4(10), 1058–1072, http://dx.doi.org/10.1016/S0031-8914
(37)80203-7.
Hinds, W.C. (1982). Aerosol technology: Properties, behavior, and measurement of airborne particles (2nd ed.). John Wiley & Sons: New York.
Islam, N., & Cleary, M.J. (2012). Developing an efficient and reliable dry powder inhaler for pulmonary drug delivery – A review for multidisciplinary
researchers. Medical Engineering & Physics, 34(4), 409–427, http://dx.doi.org/10.1016/j.medengphy.2011.12.025.
Kulkarni, P., Baron, P.A., & Willeke, K. (2011). Aerosol measurement: Principles, techniques, and applications (3rd ed.). John Wiley & Sons: Hoboken, New
Jersey.
Koivisto, A.J., Lyyranen, J., Auvinen, A., Vanhala, E., Hameri, K., & Tuomi, T., et al. (2012). Industrial worker exposure to airborne particles during the packing
of pigment and nanoscale titanium dioxide. Inhalation Toxicology, 24(12), 839–849, http://dx.doi.org/10.3109/08958378.2012.724474.
Kuhlbusch, T.A., & Fissan, H. (2006). Particle characteristics in the reactor and pelletizing areas of carbon black production. Journal of Occupational and
Environmental Hygiene, 3(10), 558–567, http://dx.doi.org/10.1080/15459620600912280.
Morgeneyer, M., Le Bihan, O., Ustache, A., & Aguerre-Chariol, O. (2013). Experimental study of the aerosolization of fine alumina particles from bulk by a
vortex shaker. Powder Technology, 246(0), 583–589, http://dx.doi.org/10.1016/j.powtec.2013.05.040.
Noël, A., Maghni, K., Cloutier, Y., Dion, C., Wilkinson, K.J., & Hallé, S., et al. (2012). Effects of inhaled nano-TiO2 aerosols showing two distinct agglomeration
states on rat lungs. Toxicology Letters, 214(2), 109–119, http://dx.doi.org/10.1016/j.toxlet.2012.08.019.
Oberdoerster, G., Sharp, Z., Atudorei, V., Elder, A., Gelein, R., & Kreyling, W., et al. (2004). Translocation of inhaled ultrafine particles to the brain. Inhalation
Toxicology, 16, 437–445.
Ogura, I., Sakurai, H., & Gamo, M. (2009). Dustiness testing of engineered nanomaterials. Journal of Physics: Conference Series, 170, 012003.
O’Shaughnessy, P.T., Kang, M., & Ellickson, D. (2011). A novel device for measuring respirable dustiness using low-mass powder samples. Journal of
Occupational and Environmental Hygiene, 9(3), 129–139, http://dx.doi.org/10.1080/15459624.2011.652061.
Paur, H.-R., Cassee, F.R., Teeguarden, J., Fissan, H., Diabate, S., & Aufderheide, M., et al. (2011). In-vitro cell exposure studies for the assessment of
nanoparticle toxicity in the lung—A dialog between aerosol science and biology. Journal of Aerosol Science, 42(10), 668–692, http://dx.doi.org/10.1016/j.
jaerosci.2011.06.005.
Rissler, J., Swietlicki, E., Bengtsson, A., Boman, C., Pagels, J., & Sandström, T., et al. (2012). Experimental determination of deposition of diesel exhaust
particles in the human respiratory tract. Journal of Aerosol Science, 48(0), 18–33, http://dx.doi.org/10.1016/j.jaerosci.2012.01.005.
Saleh, K., Moufarej Abou Jaoude, M.-T., Morgeneyer, M., Lefrancois, E., Le Bihan, O., & Bouillard, J. (2014). Dust generation from powders: A characterization
test based on stirred fluidization. Powder Technology, 255(0), 141–148, http://dx.doi.org/10.1016/j.powtec.2013.10.051.
Schneider, T., & Jensen, K. (2008). Combined single-drop and rotating drum dustiness test of fine to nanosize powders using a small drum. Annals of
Occupational Hygiene, 52(1), 23–34.
Schneider, T., & Jensen, K.A. (2009). Relevance of aerosol dynamics and dustiness for personal exposure to manufactured nanoparticles. Journal of
Nanoparticle Research, 11(7), 1637–1650, http://dx.doi.org/10.1007/s11051-009-9706-y.
Sosnowski, T.R., Giżyńska, K., & Żywczyk, Ł. (2014). Fluidization and break-up of powder particle aggregates during constant and pulsating flow in
converging nozzles. Colloids and Surfaces A: Physicochemical and Engineering Aspects, 441(0), 905–911, http://dx.doi.org/10.1016/j.colsurfa.2013.04.018.
Stahlmecke, B., Wagener, S., Asbach, C., Kaminski, H., Fissan, H., & Kuhlbusch, T.A.J. (2009). Investigation of airborne nanopowder agglomerate stability in an
orifice under various differential pressure conditions. Journal of Nanoparticle Research, 1625–1635.
Tsai, C., Wu, C., Leu, M., Chen, S., Huang, C., & Tsai, P., et al. (2009). Dustiness test of nanopowders using a standard rotating drum with a modified sampling
train. Journal of Nanoparticle Research, 11(1), 121–131.
Yang, M.Y., Chan, J.G.Y., & Chan, H.-K. (2014). Pulmonary drug delivery by powder aerosols. Journal of Controlled Release, 193(0), 228–240, http://dx.doi.org/
10.1016/j.jconrel.2014.04.055.
Zhang, Z., & Kleinstreuer, C. (2011). Computational analysis of airflow and nanoparticle deposition in a combined nasal–oral–tracheobronchial airway
model. Journal of Aerosol Science, 42(3), 174–194, http://dx.doi.org/10.1016/j.jaerosci.2011.01.001.
Y. Ding, M. Riediker / Journal of Aerosol Science 88 (2015) 98–108108