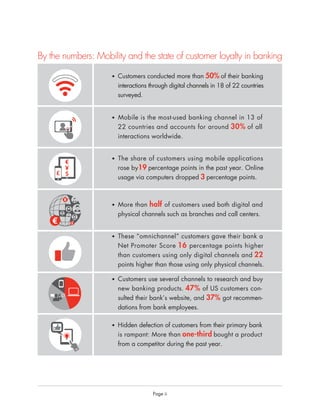
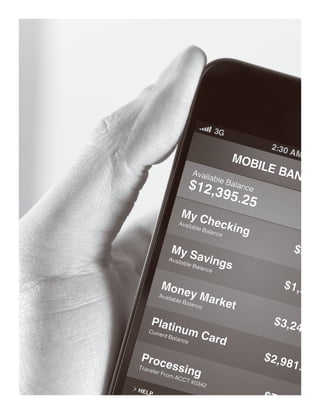
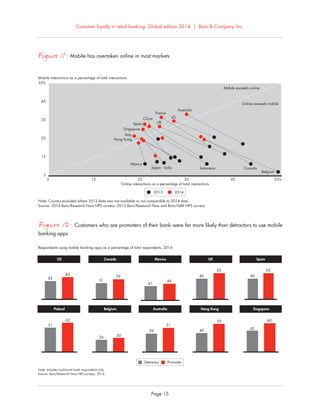
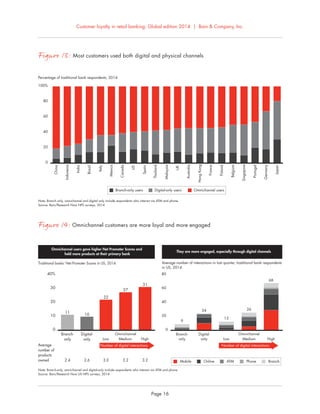
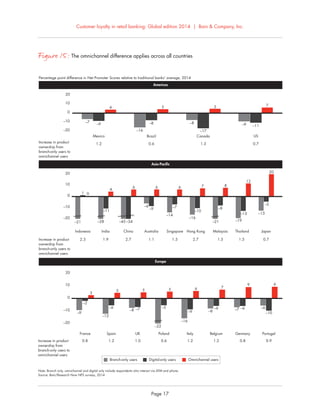
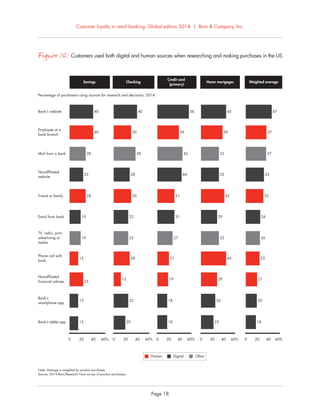
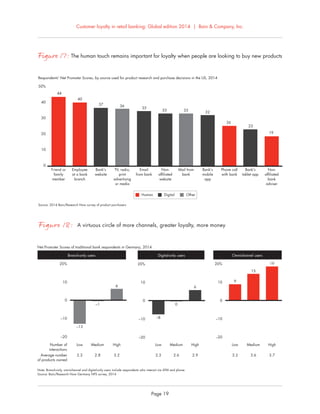
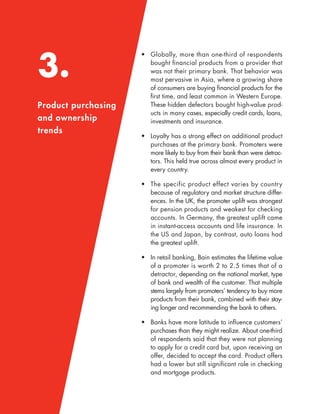
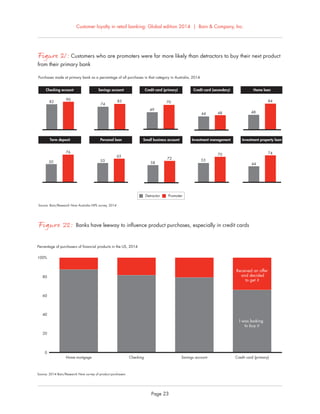
4. Page ii
• Customers conducted more than 50% of their banking
interactions through digital channels in 18 of 22 countries
surveyed.
• Mobile is the most-used banking channel in 13 of
22 countries and accounts for around 30% of all
interactions worldwide.
• The share of customers using mobile applications
rose by19 percentage points in the past year. Online
usage via computers dropped 3 percentage points.
• More than half of customers used both digital and
physical channels such as branches and call centers.
• These “omnichannel” customers gave their bank a
Net Promoter Score 16 percentage points higher
than customers using only digital channels and 22
points higher than those using only physical channels.
• Customers use several channels to research and buy
new banking products. 47% of US customers con-
sulted their bank’s website, and 37% got recommen-
dations from bank employees.
• Hidden defection of customers from their primary bank
is rampant: More than one-third bought a product
from a competitor during the past year.
By the numbers: Mobility and the state of customer loyalty in banking
5. Customer loyalty in retail banking: Global edition 2014 | Bain & Company, Inc.
Page 1
Going Digical
Banking customers now handle more of their banking interactions, on average, via smartphones and tablets than
through any other channel, this year’s report shows—and the mobile channel has become a key element in the bid
to earn customer loyalty. Increased loyalty, in turn, pays off for a bank with customers buying more products and
making more referrals, which allow the bank to capture more than its fair share of new sales.
Mobile does not stand alone, however; it must be integrated with other channels like branches and contact centers
to deliver seamless and simple customer experiences. Most banks realize that they need to reimagine their end-
to-end customer experiences across all channels to make the most of the new mobile capabilities. But they have
been struggling to integrate channels across the numerous departments of their large, complex organizations.
Still, many of the largest banks worldwide have made progress in closing the loyalty gap with the loyalty leaders,
which often are smaller, more focused and nimble banks.
JPMorgan Chase, for instance, has gained in almost every region of the US; Royal Bank of Canada made strides
during the year; and all four big banks in Australia improved their scores significantly. The banks that have begun
to pull ahead will likely accelerate their progress as they further sharpen their focus on earning loyalty. Those that
don’t pick up the pace risk falling further behind.
This year’s report, based on Bain’s survey of roughly 83,000 consumers in 22 countries, explores how people
do their banking and how banks are adapting their distribution and service channels to address customer needs
and improve the economics of the business. The research occurred online in July through November 2014, through
market research firm Research Now.
The meteoric rise of mobile
Mobile has become the dominant means for consumers to interact with their banks. Customers completed more
interactions with their banks via smartphones or tablets than through any other channel in 13 of 22 countries we
surveyed. And the share of customers using a using a bank’s mobile app rose a striking 19 percentage points
during 2014, with strong increases across all age groups in most markets.
Until recently, consumers layered digital onto other ways of interacting with their bank—for instance, using mobile
devices to check their balance more often while keeping their use of other channels the same. This year, the data
shows a meaningful decline in usage of not only branches and ATMs but even online via computers; the latter
dropped an average of 3 percentage points. (It’s possible that our survey slightly overstates growth in mobile usage,
because the survey is conducted online and survey companies have been making questionnaires easier to answer
via mobile devices. But we’re confident the trends are valid.)
Mobile does not replace other channels but fundamentally changes how consumers use them. Most customers
in most markets (60% of respondents overall) used a combination of digital and physical channels to do their
banking—what we call “omnichannel” behavior. This is critical for effective service, marketing and selling,
because customers expect to be able to hop from one channel to another.
6. Customer loyalty in retail banking: Global edition 2014 | Bain & Company, Inc.
Page 2
A virtuous circle: More channels, greater loyalty, more money
Omnichannel customers gave their bank an NPS that is 16 percentage points higher, on average, than the score customers
who rely only on digital channels gave and 22 percentage points higher than the score given by those who use only physical
channels. And NPS was even higher for omnichannel customers who had more interactions.
The payoff is higher product ownership: Omnichannel customers held an average of 1.0 more product with their
primary bank than digital-only customers and 1.3 more than branch-only customers. While the data doesn’t prove
a linear cause-and-effect relationship, it shows a virtuous circle of greater engagement across channels, greater
loyalty and increased product holdings.
For many years, interactions in person or via phone were critical for delighting or angering customers during
moments of truth, such as seeking advice. Now, leading banks are investing heavily in digital innovations designed
to become powerful “wow” factors in their own right. In Spain, NPS leader Bankinter has an early lead in infusing
its branches with useful digital technologies, such as biometric signatures for contracts, which save time, and
tablets that enable self-service.
Likewise, Citibank in the US has steadily improved its NPS over the past four years, in part by deploying practical
digital innovations. Examples include sending fraud alert texts to customers at the point of sale and deploying smart
ATMs that allow customers to open accounts or hold videoconferences with experts. Several Asian banks, meanwhile,
have pioneered personalization features. Shinhan in South Korea maintains a human touch through its use of
“smart letters,” delivered through a mobile app. These letters range from simple birthday greetings to coupons
providing higher interest rates.
Banks that pull ahead in loyalty by investing heavily in mobile to deliver a better experience will reap financial
benefits. Those banks that lag in effectively investing in the mobile advantage will miss reaping the financial
benefits and also fall further behind in their ability to invest.
The hidden defection problem—and opportunity
Accelerating the development of mobile sales capabilities will help banks address a significant but little-noticed
problem: the hidden defection of customers who go to another provider for additional products such as mortgages
and credit cards. Globally, more than one-third of customers bought a new banking product at a bank other than
their primary bank this year.
Imagine the uproar that would ensue if one-third of a bank’s customers were completely defecting each year. Yet
the defection highlighted here passes unnoticed because banks usually don’t know their customers were
shopping in the first place and seldom know that they lost the sale. Mobile banking has the potential to
either exacerbate or mitigate this problem.
Hidden defection could worsen as digital start-ups and specialist firms that are less encumbered by legacy systems
and regulations offer better, simpler solutions and make it easy for people to find them. Banks that fail to respond
risk getting saddled with the bulk of low-margin accounts, while other firms siphon off high-margin products
like credit cards and mortgages. Young firms such as Betterment, which simplifies the process of investing, or
7. Customer loyalty in retail banking: Global edition 2014 | Bain & Company, Inc.
Page 3
Kabbage, which has developed an underwriting process to instantly lend up to $100,000, stand to capture a
greater share of banks’ more profitable lines of business.
Some banks, such as JPMorgan Chase and USAA in the US, Nationwide in the UK and Hang Seng in Hong Kong,
have begun to address defection through different combinations of earning strong loyalty, fielding strong
products and improving sales capabilities. But for all banks, digital technology increasingly is critical for effective
selling. When US consumers researched or considered a new financial product like a mortgage, they typically
used at least four or five sources of information, with the most frequently used source being their bank’s
website and the least used being mobile apps. Deploying mobile apps to make it easy for customers to con-
nect to the right bank resources and employees during their shopping process, and preapproving them for the best
offer, could substantially raise the odds of winning the sale.
How is the hard part
Winning in a Digical world, by fusing the best of customer-friendly digital tools and processes with physical assets,
presents a challenge for banks, especially with their current operating model. Most banks’ operating models
are characterized by products and channels that operate in silos and by processes that require extensive signoff from
compliance, legal, finance, operations, marketing and other functions to make any change—50 people who can
say no against just one who can say yes.
Banks will need to redesign their operating model, and they can take a cue from leading retailers. Macy’s, for example,
has integrated most of its online shopping with its physical facilities, turning virtually all of its stores into omnichannel
fulfillment centers. Its iconic Herald Square store in New York is undergoing a $400 million remodeling that features
innovations such as interactive directories, digital signage, widespread use of radio-frequency identification (RFID)
tagging and a new mobile app to guide customers as they shop. Macy’s has evolved its operating model in order to
pursue this integration. The company now has a chief omnichannel officer, who reports directly to the CEO and
manages the development of strategies to closely integrate stores and online and mobile activities. He also has
responsibility for systems and technology, logistics and related operating functions.
Apple likewise recognized a need to change how it manages its online and physical stores. When Apple hired
Angela Ahrendts, the former Burberry chief executive, it gave her responsibility for both online and retail stores,
with a mission to make the customer experience seamless across channels.
Some leading banks are overcoming their organizational obstacles by taking a fresh “design, build, use” approach
to developing exceptional customer experiences. Notably, the approach enlists customers to create the experience
(see Figure 1). Here’s how it works.
1. Design for the customer’s ideal experience.
Effective digital design focuses on the customers’ priorities—buy a home, provide for a daughter’s college edu-
cation, manage cash and so on. Leading banks have found it useful to select the critical customer journeys by
ranking them according to frequency of use and emotional importance (see Figure 2). The next step is to
reimagine each journey from the customer’s perspective. Buying a home, for instance, should start at the moment
the customer considers house hunting and extend all the way through moving in.
8. Customer loyalty in retail banking: Global edition 2014 | Bain & Company, Inc.
Page 4
Journey mapping and benchmarking against banking competitors and best-in-class firms in other industries provide
a data-driven audit to identify gaps in capabilities and appeal. It should be easy and intuitive for customers to
navigate a website or a mobile app, and the presentation should feel empathetic and not clinical.
Benchmarking must be complemented by a design process that will allow a bank to stand out from the crowd.
We have found that an effective mechanism to bring key customer moments to life is a storyboard created with
the help of artists and writers. Storyboards, when combined with engaging real customers to cocreate digital tools
through rapid prototyping and hands-on testing, lead to a clear view of the next horizon for each customer journey.
2. Build with a modern development model.
Given the speed of digital innovation these days, banks can’t afford to use the traditional waterfall IT development
approach, which relies on remote release dates and thus struggles to catch up as the marketplace changes. The
trend among leading organizations, such as Capital One Labs, is toward Agile delivery models. These deliver function-
ality in many bite-sized pieces.
Just installing Agile development teams is not enough. The entire ecosystem around the team needs to be
redesigned and should include a process to ensure that the team building a particular journey has a pre-allocated
budget, resources and approvals. The Agile model should also involve relevant compliance and legal staff on the
team from the start. It should maintain regular communications with a senior executive leading the relevant line
of business. And it can employ cloud-based development environments in order to reduce cycle times.
Figure 1: Guiding principles for digital innovations
Personalized to the customer,
reflects wants and needs
Intuitive, simple and easy to use
Has human touch and clear, jargon-free
language
Available anywhere, any time and on
any device
Has everything the customer wants
Map and prioritize experiences that matter
most to customers
Engages customers and business partners
Uses rapid prototyping to test ideas Simplify processes and reinforce behaviors
Identify choke points and organize for
nimble development
BuildUse
Adopt Agile development models
Employ “test and learn” for continuous
improvement
DesignprinciplesDesignprocess
Reimagine the key end-to-end experiences
What does your digital experience look like? How do you develop your digital properties?
Source: Bain & Company
9. Customer loyalty in retail banking: Global edition 2014 | Bain & Company, Inc.
Page 5
3. Use what really works with customers and employees.
In most bank trials, new approaches tend to succeed initially through small pilots in highly managed, carefully
selected situations. But they fail to deliver the expected results in a mass rollout with all its complexity and variation.
The more effective approach, which complements Agile development, is to test and learn more broadly, based
on fast loops of customer feedback.
The test-and-learn approach relies on behavioral psychology, in which slight nuances can spell the difference
between success and failure. Insights about what works often come from frontline employees and analysis of
real customer behavior. At one Australian bank, for instance, a branch greeter charged with convincing customers
to use self-service solutions realized that asking “Do you know how to do that yourself?” made customers defensive
and thus fell flat. The more positive tone in “May I show you how to skip the line?” was much more effective.
These sorts of insights happen regularly in every bank’s branch, but this bank had a process to quickly identify
and spread the insight throughout the bank, so the entire system could benefit.
The chapters that follow explore the 2014 survey data on customer loyalty, how the right omnichannel approach
in a mobile world earns loyalty and what the untapped opportunity is in capturing new purchases of banking
products. These insights can inform the migration of transactional activities to digital channels, in order to
reduce costly and avoidable volumes entering the branch. That will allow the branch network to become leaner
and more oriented toward higher-value sales and service activities. Done right, the Digical journey can combine
higher productivity with the ultimate touchstone: strong customer advocacy.
Figure 2: Focus on the experiences that matter most to customers
0
50
100
150
5,000
10,000
75 80 85 90%
Remote
deposit capture
Dealing with
matters for
deceased
relative
Frequencyofuse
(Averagemonthlyvisits,indexed)
Priority
experiences
Emotional importance
(Percentage of detractors + percentage of promoters)
Everyday transactions
Check balance
Pay bills
Resolve a
complex
problem
Account unexpectedly
blocked
Withdraw cash
Source: Bain & Company disguised case example
10.
11. 1.
Global loyalty trends
• Customer loyalty as measured by NPS improved in
2014 from the previous year, as leading banks inten-
sified their efforts to earn loyalty and many banks
continued their recovery after the financial crisis.
• What matters most to an individual bank is how it
performs relative to its peer group. Within national
markets, NPS varied widely from bank to bank.
In Germany, for instance, top-performer DKB had
an NPS that was 74 percentage points higher
than the worst performer and 55 percentage points
above the country average. Sparda-Banken, a
credit union, had a score 12 percentage points
lower than DKB.
• Large traditional banks made meaningful improve-
ments in NPS relative to their direct or smaller
competitors in 2014. Several big banks, such as
Santander and Barclays in the UK and JPMorgan
Chase in the US, have shown sustained progress
over the past few years.
• Several factors account for the progress of these
banks, with digital innovation being one factor.
Previous surveys have shown that using mobile
banking contributed to higher loyalty scores. This
year, we found that promoters of a bank, who
score a 9 or 10 on a zero-to-10 NPS scale, were
more likely to use mobile apps than were detractors,
who score 6 or less on the same scale.
• Digital usage now accounts for the majority of
banking interactions in virtually every country, with
Australia, France, the US, Canada and Germany
leading the digital share of all interactions. The
sharpest growth came in mobile usage, which for
the first time reached about 30% of all interactions
in most countries. Mobile remains a relatively small
share of digital interactions only in Germany,
Portugal, Mexico and Japan.
12. Customer loyalty in retail banking: Global edition 2014 | Bain & Company, Inc.
Page 8
Figure 3: In most markets, there is a large gap between leaders and laggards
Canada
Primary banks’ Net Promoter Scores relative to loyalty leader, which is indexed to zero, 2014
Mexico
US: Northeast
US: Midwest
US: South
US: West
Americas
RBC, TD Canada Trust
President's Choice Financial
Banorte Santander, HSBC
PNC Bank, TD Bank, Chase Bank
Huntington
USAA
Chase Bank, Regions Bank
USAA
Union Bank, Bank of the West, Citibank
−100% −80 −60 −40 –20 0
Australia
China
Hong Kong
India
Indonesia
Japan
Malaysia
Singapore
South Korea
Asia-Pacific
China Construction Bank, Bank of
Communications, China Merchants Bank
Citibank
Maybank, Public Bank, CIMB
Citibank
Shinhan Bank
HDFC, Bank of Baroda
BCA
Shinsei Bank
ING Direct
Bendigo Bank
Belgium
France
Germany
Italy
Poland
Spain
UK
Europe
Sparda-Banken
Banca Mediolanum
Bankinter
Highest traditional bank
Highest direct bank
Lowest bank
Average
Argenta Spaarbank
La Banque Postale
DKB
ING Direct, Fineco
ING Bank
first direct
Nationwide
Notes: Country averages include all banks; highest and lowest banks include only banks where n≥200 for the Americas and Europe and n≥100 for Asia-Pacific; excludes markets
with insufficient number of banks; traditional banks include large building societies or credit unions.
Source: Bain/Research Now NPS surveys, 2014
13. Customer loyalty in retail banking: Global edition 2014 | Bain & Company, Inc.
Page 9
Figure 4: In many countries, large branch big banks have been closing the loyalty gap with direct
banks
US Canada Australia
Germany UK Italy
–20
0
20
40
60
80%
Direct
banks
Regional
banks
National
banks
–20
0
20
40
60
80%
Big Five
banks
Direct
banks
2011 ‘12 ‘13 ‘14
–20
0
20
40
60
80%
Regional/
smaller
banks
Direct
banks
2012 ‘13 ‘14
Big Four
banks
Large branch
banks
Direct
banks
‘14
0
–20
20
40
60
80%
Credit
unions
2012 ‘13
–20
0
20
40
60
80%
Building
societies
Direct
banks
2012 ‘13 ‘14
Large branch
banks
–20
0
20
40
60
80%
US Canada Australia
Direct
banks
2013 ‘14
International
banks
Large
regional
banks
National
banks
2009 ‘10 ‘11 ‘12 ‘13 ‘14
Source: Bain/Research Now NPS surveys, 2009–2014
Net Promoter Score
14.
15. 2.
Channel behavior and
its influence on loyalty
• Mobile applications have arrived at the stage of
mass appeal. Almost every country showed a
huge increase in the share of respondents using
mobile apps, with an average 19 percentage point
rise globally. Indonesia and China led in usage.
• Online usage showed declines or was flat every-
where except in Indonesia, Mexico and Japan—
an average 3 percentage point decline worldwide.
• Growth in mobile has not just cut into online usage;
it also coincided with declines in branch, ATM and
phone usage. In the US the share of respondents
using these channels dropped by 5, 3 and 5 per-
centage points, respectively, since 2012.
• Respondents under age 35 were more likely than
older customers to bank via mobile devices. But the
share of customers age 65 and older who use
mobile is a substantial 30%—and mobile usage
rose sharply among all age groups.
• Roughly 60% of customers used a combination of
digital and physical channels. These omnichannel
customers gave their primary bank an NPS that was
16 percentage points higher than the NPS of custom-
ers using only digital channels and 22 points higher
than the NPS of those using only physical channels.
They also own more products through their primary
bank than those who use only digital or only physi-
cal channels: 1.0 and 1.3 products, respectively.
• For product research and consideration, US respon-
dents most frequently turned to their bank’s web-
site, highlighting the importance of a well-
designed, intuitive site. Next, respondents turned
to bank employees. Other sources—such as direct
mail or, for credit cards, another website—had a
prominent influence for individual products. Mobile
has yet to be effectively tapped for selling.
16. Customer loyalty in retail banking: Global edition 2014 | Bain & Company, Inc.
Page 12
0
20
40
60
80%
Indonesia
77
China
73
Thailand
64
India
59
Singapore
58
Poland
58
Malaysia
54
HongKong
49
Australia
47
Mexico
45
Spain
44
US
43
Italy
42
UK
41
Brazil
39
Canada
34
Portugal
31
France
30
Belgium
27
Germany
21
Japan
19
Percentage of respondents who used mobile banking apps in last quarter
Note: 2013 data was excluded where data was not available or not comparable to 2014 data.
Sources: Bain/Research Now NPS surveys, 2014; Bain/Research Now and Bain/GMI NPS surveys, 2013
2014 Developing country 2014 Developed country 2013
Figure 5: Digital channels accounted for the majority of all interactions in most countries
0
20
40
60
80
100%
Australia
US
France
Germany
Canada
Belgium
Brazil
UK
Spain
Poland
China
Thailand
Singapore
Indonesia
Portugal
Malaysia
HongKong
Italy
India
Mexico
Japan
Percentage of total interactions in last quarter, 2014
Mobile (smartphone/tablet) Online ATM Phone Branch
Source: Bain/Research Now NPS surveys, 2014
Figure 6: Customers’ use of mobile banking applications surged by 19 percentage points worldwide
17. Customer loyalty in retail banking: Global edition 2014 | Bain & Company, Inc.
Page 13
Figure 7: In most countries, the use of online tools for routine transactions declined
0
20
40
60
80
100%
81 79 77 76
74 74 73 71 70 69 66
61
59
52
China
Indonesia
Australia
Canada
India
Belgium
Germany
Singapore
HongKong
UK
Italy
US
Portugal
France
Spain
Thailand
Brazil
Malaysia
Mexico
Japan
Poland
52
Percentage of respondents who used online tools (via computer, not mobile) for routine transactions in last quarter
Note: 2013 data was excluded where data was not available or not comparable to 2014 data.
Sources: Bain/Research Now NPS surveys, 2014; Bain/Research Now and Bain/GMI NPS surveys, 2013
88
78 77
76
68 67
2014 Developing country 2014 Developed country 2013
Figure 8: Branch visits continued their slow decline
0
20
40
60
80
100%
82 80
77 75
66 64 63
60 59 58 57 55 54 53
49 47
44
China
Indonesia
Mexico
Brazil
India
US
Italy
Spain
Canada
UK
SouthKorea
Malaysia
Thailand
Portugal
HongKong
Australia
France
Singapore
Belgium
Poland
Japan
Germany
Percentage of respondents who used branches for routine transactions in last quarter
Note: 2013 data was excluded where data was not available or not comparable to 2014 data.
Sources: Bain/Research Now NPS surveys, 2014; Bain/Research Now and Bain/GMI NPS surveys, 2013
79
68
60
33 33
2014 Developing country 2014 Developed country 2013
18. Customer loyalty in retail banking: Global edition 2014 | Bain & Company, Inc.
Page 14
Figure 9: Mobile’s rise came at the expense of online, ATM and branch usage
Canada IndiaSpain
0
20
40
60
80
100%
+15
–11
–3
0
–1
Change
(% points)
Change
(% points)
Change
(% points)
0
20
40
60
80
100%
+8
–3
–3
–1
–1
0
20
40
60
80
100%
2013 2014 2013 2014 2013 2014
+12
–4
–4
–1
–2
Mobile Online ATM Phone Branch
Sources: Bain/Research Now NPS surveys, 2014; Bain/Research Now and Bain/GMI NPS surveys, 2013
Total interactions in last quarter
Figure 10: With the rise of mobile, even online usage has started to decline
0
20
40
60
80
100%
Percentage of respondents using channel in US
Phone
Mobile
2012 2013 2014
Online
–5
–3
20
–5
2012–2014
change
(% points)
Branch
Note: Online and branch include transactions, sales and service.
Source: Bain/Research Now US NPS surveys, 2012–2014
19. Customer loyalty in retail banking: Global edition 2014 | Bain & Company, Inc.
Page 15
Figure 11: Mobile has overtaken online in most markets
5
15
25
35
45
55%
5 15 25
2013
35 45 55%
UK
Australia
US
Online interactions as a percentage of total interactions
Mobile interactions as a percentage of total interactions
Spain
France
Italy
Belgium
Hong Kong
China
Singapore
IndonesiaJapan India Canada
Mexico
Mobile exceeds online
Online exceeds mobile
2014
Note: Country excluded where 2013 data was not available or not comparable to 2014 data.
Source: 2014 Bain/Research Now NPS surveys; 2013 Bain/Research Now and Bain/GMI NPS surveys
Figure 12: Customers who are promoters of their bank were far more likely than detractors to use mobile
banking apps
US
Poland
Canada
Belgium
UK
Hong Kong
Spain
SingaporeAustralia
Mexico
Respondents using mobile banking apps as a percentage of total respondents, 2014
35
43
31
39
41
48
40
50
40
50
45
60
40
59
39
51
26 30
51
62
Detractor Promoter
Note: Includes traditional bank respondents only.
Source: Bain/Research Now NPS surveys, 2014
20. Customer loyalty in retail banking: Global edition 2014 | Bain & Company, Inc.
Page 16
Figure 13: Most customers used both digital and physical channels
Figure 14: Omnichannel customers are more loyal and more engaged
Traditional banks' Net Promoter Scores in US, 2014
11
10
Low
22
Medium
27
High
31
Branch-
only
Digital-
only
2.4 2.6 3.0 3.2 3.2
0
10
20
30
40%
Average
number of
products
owned
Omnichannel users gave higher Net Promoter Scores and
held more products at their primary bank
They are more engaged, especially through digital channels
Omnichannel
Low Medium High
Branch-
only
Digital-
only
Omnichannel
Note: Branch-only, omnichannel and digital-only include respondents who interact via ATM and phone.
Source: Bain/Research Now US NPS surveys, 2014
0
20
40
60
80
9
24
13
26
68
Average number of interactions in last quarter, traditional bank respondents
in US, 2014
Mobile Online ATM Phone Branch
Number of digital interactionsNumber of digital interactions
0
20
40
60
80
100%
China
Indonesia
India
Brazil
Italy
Mexico
Canada
US
Spain
Thailand
Malaysia
UK
Australia
HongKong
France
Poland
Belgium
Singapore
Portugal
Germany
Japan
Percentage of traditional bank respondents, 2014
Branch-only users Digital-only users Omnichannel users
Note: Branch only, omnichannel and digital only include respondents who interact via ATM and phone.
Source: Bain/Research Now NPS surveys, 2014
21. Customer loyalty in retail banking: Global edition 2014 | Bain & Company, Inc.
Page 17
Figure 15: The omnichannel difference applies across all countries
–20
–10
0
10
20
Mexico
–7
–9
4
Brazil
–16
–8
5
Canada
–8
–17
5
US
–9 –11
7
Percentage point difference in Net Promoter Scores relative to traditional banks' average, 2014
1.2 0.6 1.3 0.7Increase in product
ownership from
branch-only users to
omnichannel users
Increase in product
ownership from
branch-only users to
omnichannel users
Increase in product
ownership from
branch-only users to
omnichannel users
–20
–10
0
10
20
–21
1 0
–28
–11
4
6
–6
–9
6
–14
–7
6
–16
–10
7
–21
–8
8
–19
–13
12
–13
–5
20
Indonesia India China
–45 –34
Australia Singapore Hong Kong Malaysia Thailand Japan
2.3 1.9 2.7 1.1 1.5 2.7 1.5 1.5 0.7
Americas
Asia-Pacific
Europe
–20
–10
0
10
20
–9
–2
3
–12
–6
5
–8 –7
5
–22
–5
5
–16
–9
6
–8
–6
7
–7 –6
9
–6
–10
9
France Spain UK Poland Italy Belgium Germany Portugal
0.8 1.2 1.0 0.6 1.2 1.2 0.8 0.9
Branch-only users Digital-only users Omnichannel users
Note: Branch only, omnichannel and digital only include respondents who interact via ATM and phone.
Source: Bain/Research Now NPS surveys, 2014
22. Customer loyalty in retail banking: Global edition 2014 | Bain & Company, Inc.
Page 18
0 20 40 60%
20
25
13
28
25
25
30
28
38
30
40
0 20 40 60%
18
18
19
21
27
31
31
44
45
39
56
0 20 40 60%
Bank's tablet app 15
Bank's
smartphone app
15
Nonaffiliated
financial adviser 23
Phone call with
bank
15
TV, radio, print
advertising or
media
19
Email from bank 19
Friend or family 28
Nonaffiliated
website
23
Mail from a bank 28
Employee at a
bank branch
40
Bank's website 40
Percentage of purchasers using sources for research and decisions, 2014
0 20 40 60%
23
26
29
45
32
29
42
32
32
39
45
0 20 40 60%
18
20
21
25
26
26
32
33
37
37
47
Savings
Credit card
(primary)
Home mortgages Weighted averageChecking
Human Digital Other
Note: Average is weighted by product purchases.
Source: 2014 Bain/Research Now survey of product purchasers
Figure 16: Customers used both digital and human sources when researching and making purchases in the US
23. Customer loyalty in retail banking: Global edition 2014 | Bain & Company, Inc.
Page 19
Figure 17: The human touch remains important for loyalty when people are looking to buy new products
0
10
20
30
40
50%
Friend or
family
member
Employee
at a bank
branch
Bank's
website
TV, radio,
print
advertising
or media
Email
from bank
Non-
affiliated
website
Mail from
bank
Bank's
mobile
app
Phone call
with bank
Bank's
tablet app
Non-
affiliated
bank
adviser
Respondents' Net Promoter Scores, by source used for product research and purchase decisions in the US, 2014
Source: 2014 Bain/Research Now survey of product purchasers
Human Digital Other
44
40
37 36
35
33 33
32
26
23
19
Figure 18: A virtuous circle of more channels, greater loyalty, more money
Average number
of products owned
Number of
interactions
–20
–10
0
10
20%
–13
–1
6
Branch-only users
Low Medium High
2.3 2.8 3.2
–20
–10
0
10
20%
–8
0
6
Digital-only users
Low Medium High
2.3 2.6 2.9
–20
–10
0
10
20%
9
15
19
Omnichannel users
Net Promoter Scores of traditional bank respondents in Germany, 2014
Low Medium High
3.2 3.6 3.7
Note: Branch-only, omnichannel and digital-only users include respondents who interact via ATM and phone.
Source: Bain/Research Now Germany NPS survey, 2014
24.
25. 3.
Product purchasing
and ownership
trends
• Globally, more than one-third of respondents
bought financial products from a provider that
was not their primary bank. That behavior was
most pervasive in Asia, where a growing share
of consumers are buying financial products for the
first time, and least common in Western Europe.
These hidden defectors bought high-value prod-
ucts in many cases, especially credit cards, loans,
investments and insurance.
• Loyalty has a strong effect on additional product
purchases at the primary bank. Promoters were
more likely to buy from their bank than were detrac-
tors. This held true across almost every product in
every country.
• The specific product effect varies by country
because of regulatory and market structure differ-
ences. In the UK, the promoter uplift was strongest
for pension products and weakest for checking
accounts. In Germany, the greatest uplift came
in instant-access accounts and life insurance. In
the US and Japan, by contrast, auto loans had
the greatest uplift.
• In retail banking, Bain estimates the lifetime value
of a promoter is worth 2 to 2.5 times that of a
detractor, depending on the national market, type
of bank and wealth of the customer. That multiple
stems largely from promoters’ tendency to buy more
products from their bank, combined with their stay-
ing longer and recommending the bank to others.
• Banks have more latitude to influence customers’
purchases than they might realize. About one-third
of respondents said that they were not planning
to apply for a credit card but, upon receiving an
offer, decided to accept the card. Product offers
had a lower but still significant role in checking
and mortgage products.
26. Customer loyalty in retail banking: Global edition 2014 | Bain & Company, Inc.
Page 22
Figure 19: Hidden defection exists everywhere, especially in developing markets
Figure 20: Hidden defectors often bought high-value products, such as lending, investments and insurance
0
20
40
60
80
100%
Potugal
Thailand
Japan
Poland
HongKong
Italy
Spain
Mexico
Australia
India
SouthKorea
Canada
Malaysia
France
Singapore
Germany
US
China
UK
Belgium
Brazil
Indonesia
Percentage of products purchased at a bank other than primary bank, 2014
Source: Bain/Research Now NPS surveys, 2014
Deposit Credit card Loans Investment Insurance Other
Developing country Developed country
0
10
20
30
40
50
60
70%
Developed
country
average: 28%
Malaysia
68
China
63
HongKong
53
Thailand
51
Singapore
48
India
Indonesia
SouthKorea
40
UK
37
Mexico
32
Brazil
28
Spain
28
US
Poland
Japan
Canada
Germany
Australia
19
France
17
Portugal
17
Italy
17
Belgium
17
Percentage of respondents who purchased at a bank other than their primary bank, 2014
Developing
country
average: 47%
46
44
27
25 24 23 23
Source: Bain/Research Now NPS surveys, 2014
27. Customer loyalty in retail banking: Global edition 2014 | Bain & Company, Inc.
Page 23
Figure 21: Customers who are promoters were far more likely than detractors to buy their next product
from their primary bank
82
90
74
83
49
70
44 48 48
84
44
74
53
70
58
72
53
65
50
76
Checking account
Term deposit
Savings account
Personal loan
Credit card (secondary)
Investment management
Home loan
Investment property loanSmall business account
Credit card (primary)
Purchases made at primary bank as a percentage of all purchases in that category in Australia, 2014
Detractor Promoter
Source: Bain/Research Now Australia NPS survey, 2014
Figure 22: Banks have leeway to influence product purchases, especially in credit cards
0
20
40
60
80
100%
Percentage of purchasers of financial products in the US, 2014
Home mortgage Checking Savings account Credit card (primary)
I was looking
to buy it
Received an offer
and decided
to get it
Source: 2014 Bain/Research Now survey of product purchasers
28. Customer loyalty in retail banking: Global edition 2014 | Bain & Company, Inc.
Page 24
Further reading
• “Winning operating models that convert strategy to results,” Marcia Blenko, Eric Garton, Ludovica Mottura
and Oliver Wright, Bain Brief, December 2014.
• “Rebooting IT: Why financial institutions need a new technology model,” Mike Baxter, Steve Berez and Vishy
Padmanabhan, Bain Brief, September 2014.
• “Building the retail bank of the future,” Mike Baxter and Dirk Vater, Bain Brief, June 2014.
• “Digital-Physical mashups,” Darrell Rigby, Harvard Business Review, September 2014.
Appendix: Methodology
Bain & Company partnered with Research Now, the online global market research organization, to survey consumer
panels in Australia, Belgium, Brazil, Canada, China, France, Germany, Hong Kong, India, Indonesia, Italy, Japan,
Malaysia, Mexico, Poland, Portugal, Singapore, South Korea, Spain, Thailand, the UK and the US. The survey’s
purpose was to gauge customers’ loyalty to their principal bank and the underlying reasons customers hold the views
they do. Conducted between July and November 2014, the survey polled 82,914 consumers of national branch net-
work banks, regional banks, private banks, direct banks, community banks and credit unions in these countries.
Additionally, in Brazil, we also conducted face-to-face interviews with roughly 1,200 customers. In the Americas and
Europe, for the individual bank analysis, we included only those banks for which we received at least 200 valid responses.
In Asia, we included banks with at least 100 responses. In many instances, sample sizes exceeded these thresholds.
Survey questions
Respondents were first asked to identify their primary bank, after which they were asked the following questions to
assess their loyalty to that institution:
• On a scale of zero to 10, where zero represents “not at all likely” and 10 represents “extremely likely,” how
likely are you to recommend your primary bank to a friend or relative?
• Tell us why you gave your primary bank the score you did.
We asked what major products respondents hold with their primary bank and with other banks, and which of these
products were purchased in the past year. We also asked which channels they use to do their banking. The remaining
questions elicited demographic profile information: household income, investable assets and region of residence.
We followed up with 602 US respondents to ask more detailed questions about their purchase of specific products,
including the methods they used to research their purchases and the channel they used to purchase the product.
On the question of statistical significance, the results of our data analysis are robust both for the measurement of
bank NPS by country and for respondent NPS for each demographic category. For the Americas and Europe, the
29. NPS measured for each bank in the country and US regional rankings is statistically significant to an 80%
confidence level, with a two-tailed test of the confidence interval ranging from ±2.6% (n=1,189) to ±6.5% (n=200).
In Asia, where sample sizes were smaller, confidence intervals are wider, with a maximum of ±9.5%.
Countries classified as developed are based on the World Bank’s high-income category; the developing countries
are based on the World Bank’s middle- and low-income categories.
Acknowledgments
This report was prepared by Gerard du Toit and Maureen Burns, partners in Bain’s Financial Services practice,
and a team led by Christy de Gooyer, a practice area director, and Shilpi Goel, a project leader. Team members
are Alejandro Gonzalez, Devyani Gupta, Alexandra Reuter, Ricardo Sherwell and Abheek Talukdar. The authors
thank Bain partners in each of the countries covered in the report for their valuable input and John Campbell for
his editorial support.
Key contacts in Bain’s Global Financial Services practice
Global: Philippe De Backer in Dubai (philippe.debacker@bain.com)
Edmund Lin in Singapore (edmund.lin@bain.com)
Americas: Mike Baxter in New York (mike.baxter@bain.com)
Europe, Middle
East and Africa: Henrik Naujoks in Düsseldorf (henrik.naujoks@bain.com)
Asia-Pacific: Gary Turner in Sydney (gary.turner@bain.com)
NPS® is a registered trademark of Bain & Company, Inc., Fred Reichheld and Satmetrix Systems, Inc.
Net Promoter ScoreSM
is a trademark of Bain & Company, Inc., Fred Reichheld and Satmetrix Systems, Inc.
30. For more information, visit www.bain.com
Amsterdam • Atlanta • Bangkok • Beijing • Boston • Brussels • Buenos Aires • Chicago • Copenhagen • Dallas • Dubai • Düsseldorf • Frankfurt
Helsinki • Hong Kong • Houston • Istanbul • Jakarta • Johannesburg • Kuala Lumpur • Kyiv • London • Los Angeles • Madrid • Melbourne
Mexico City • Milan • Moscow • Mumbai • Munich • New Delhi • New York • Oslo • Palo Alto • Paris • Perth • Rio de Janeiro • Rome • San Francisco
Santiago • São Paulo • Seoul • Shanghai • Singapore • Stockholm • Sydney • Tokyo • Toronto • Warsaw • Washington, D.C. • Zurich
Shared Ambition,True Results
Bain & Company is the management consulting firm that the world’s business leaders come to when
they want results.
Bain advises clients on strategy, operations, technology, organization, private equity and mergers and acquisitions. We develop
practical, customized insights that clients act on and transfer skills that make change stick. Founded in 1973, Bain has 51 offices
in 33 countries, and our deep expertise and client roster cross every industry and economic sector. Our clients have outperformed
the stock market 4 to 1.
What sets us apart
We believe a consulting firm should be more than an adviser. So we put ourselves in our clients’ shoes, selling outcomes, not
projects. We align our incentives with our clients’ by linking our fees to their results and collaborate to unlock the full potential
of their business. Our Results Delivery®
process builds our clients’ capabilities, and our True North values mean we do the right
thing for our clients, people and communities—always.