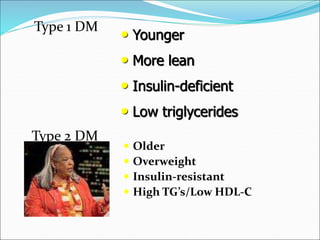
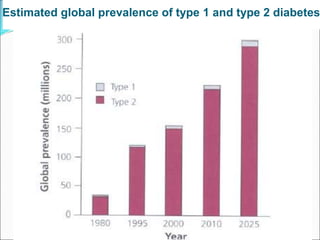
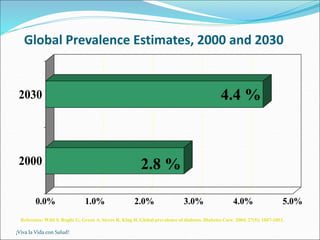
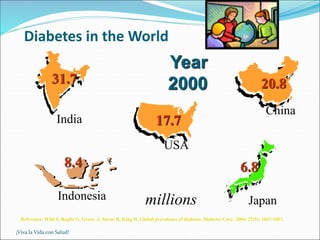
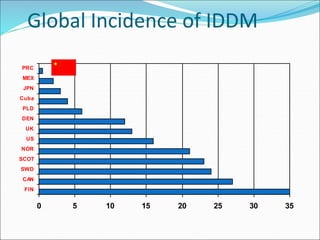
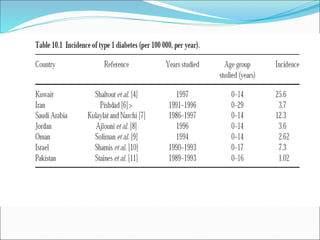
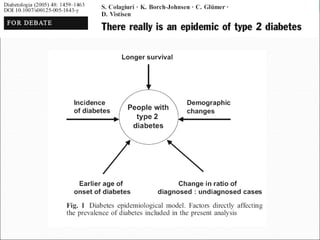
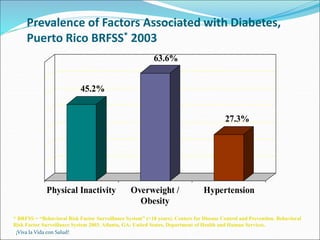
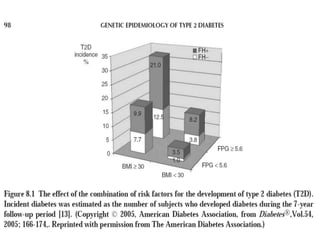
Estado Libre Asociado
de Puerto Rico
Estado Libre Asociado
de Puerto Rico
 over the past few decades, diabetes has emerged as an
important medical problem in developing regions of the
world
 In a more recent report on global diabetes estimates and
projections for the years 2000–2030,Wild et al. showed that
the worldwide prevalence of diabetes for all age groups
would increase from 2.8% in 2000 to 4.4% in 2030, with a
corresponding 114% increase in the numbers, from 171
million to 366 million. The greatest relative increases will
occur in developing regions, namely India and the Middle
Eastern Crescent
 Important contributors include an increase in the
urban population in developing countries and an
increase in the proportion of people >65 years of age
across the world
 Diabetes mellitus (DM) is a common syndrome and
caused by lack or decreased effectiveness of
endogenous insulin
 The chronic hyperglycemia of diabetes is associated
with long-term damage, dysfunction, and failure of
various organs, especially the eyes, kidneys, nerves,
heart, and blood vessels.
Classification of primary diabetes
 Type 1 (insulin-dependent (IDDM), juvenile
onset):
 Only 5–10% of those with diabetes
 May occur at any age but more common in patients
<30y.
 results from a cellular-mediated autoimmune
destruction of the β-cells of the pancreas
 Some patients, particularly children and adolescents,
may present with ketoacidosis as the first
manifestation of the disease.
 These patients are also prone to other autoimmune
disorders such as Hashimoto’s thyroiditis, vitiligo,
autoimmune hepatitis and pernicious anemia.
Type 2 (non-insulin dependent
(NIDDM), maturity onset):
 90–95% of those with diabetes
 the cause is a combination of resistance to insulin
action and an inadequate compensatory insulin
secretory response
 a degree of hyperglycemia sufficient to cause
pathologic and functional changes in various target
tissues, but without clinical symptoms, may be present
for a long period of time before diabetes is detect
Islet Cell Dysfunction and Abnormal Glucose
Homeostasis in Type 2 Diabetes
 Most patients with this form of diabetes are obese,
obesity itself causes some degree of insulin resistance
 Insulin resistance may improve with weight reduction
and/or pharmacological treatment of hyperglycemia
but is seldom restored to normal
The risk of developing this form of
diabetes increases with:
 age,
 obesity,
 and lack of physical activity.
 In women with prior GDM
 Individuals with hypertension or dyslipidemia
 Older
 Overweight
 Insulin-resistant
 High TG’s/Low HDL-C
• Younger
• More lean
• Insulin-deficient
• Low triglycerides
Type 1 DM
Type 2 DM
Gestational diabetes mellitus
(GDM)
 GDM is defined as any degree of glucose intolerance
with onset or first recognition during pregnancy.
 GDM complicates 4% of all pregnancies in the U.S.,
resulting in 135,000 cases annually
Presentation of DM
 Acute: Ketoacidosis
 Sub-acute: Weight loss, polydipsia, polyuria, lethargy,
irritability, infections (candidiasis, skin infection,
recurrent infections slow to clear), genital itching,
blurred vision, tingling in hands/feet.
 With complications: Presentation with skin changes,
peripheral neuropathy with risk of foot ulcers,
amputations, nephropathy, eye disease
 Asymptomatic: DM may be detected on routine
screening during well man/woman checks .
Adapted from Ramlo-Halsted BA, Edelman SV. Prim Care. 1999;26:771-789;
Nathan DM. N Engl J Med. 2002;347:1342-1349
Natural History of DM 2
Type 2 diabetes
Years from
diagnosis
0 5
-10 -5 10 15
Pre-diabetes
Onset Diagnosis
Insulin secretion
Insulin resistance
Postprandial glucose
Macrovascular complications
Fasting glucose
Microvascular complications
Impact of Diabetes Mellitus
Diabetes
The leading
cause of
new cases
of end
stage renal
disease
A 2- to 4-
fold
increase in
cardio-
vascular
mortality
The leading
cause of
new cases
of blindness
in working-
aged adults
The leading
cause of
nontraumatic
lower
extremity
amputations
www.hypertensiononline.org
Criteria for the Diagnosis of Diabetes
Global Prevalence of
Diabetes
Estimated global prevalence of type 1 and type 2 diabetes
¡Viva la Vida con Salud!
Global Prevalence Estimates, 2000 and 2030
0.0% 1.0% 2.0% 3.0% 4.0% 5.0%
2000
2030 4.4 %
2.8 %
Reference: Wild S, Roglic G, Green A, Sicree R, King H. Global prevalence of diabetes. Diabetes Care. 2004; 27(5): 1047-1053.
¡Viva la Vida con Salud!
Diabetes in the World
millions
India
31.7
China
20.8
USA
17.7
Indonesia
8.4
Japan
6.8
Year
2000
Reference: Wild S, Roglic G, Green A, Sicree R, King H. Global prevalence of diabetes. Diabetes Care. 2004; 27(5): 1047-1053.
¡Viva la Vida con Salud!
Diabetes in the World
millions
India
79.4
China
42.3
USA
30.3
Indonesia
21.3
Japan
8.9
Year
2010
Reference: Wild S, Roglic G, Green A, Sicree R, King H. Global prevalence of diabetes. Diabetes Care. 2004; 27(5): 1047-1053.
¡Viva la Vida con Salud!
Prevalence of Diabetes by Country
11.0
7.4 7.1 7.0
5.0
Prevalence
(%)
Puerto Rico
(2003)*
Australia
(2002)**
United
States
(2003)*
Arabia
(1999)***
Alaska
(2003)*
* > 18 years only. Centers for Disease Control and Prevention. Behavioral Risk Factor Surveillance System 1999-2003. Atlanta,
GA: United States, Department of Health and Human Services.
** Dunstan DW, Zimmet PZ, Welborn TA, Courten MP, Cameron AJ, Sicree RA, et al. The raising prevalence of diabetes and
impaired glucose tolerance. Diabetes Care. 2002; 25(5): 829-834.
*** Warsy AS, el-Hazmi MA. Diabetes mellitus, hypertension and obesity-common multifactorial disorders in Saudis. Eastern
Mediterranean Health Journal. 1999; 5(6): 1236-42.
¡Viva la Vida con Salud!
Prevalence of Diabetes in Adults
United States, BRFSS* 1998 - 2003
7.1
6.7
6.5
6.1
5.6
5.4
0.0
1.0
2.0
3.0
4.0
5.0
6.0
7.0
8.0
1998 1999 2000 2001 2002 2003
Prevalence
(Mean
%)
* BRFSS = “Behavioral Risk Factor Surveillance System” (>18 years). Centers for Disease Control and Prevention. Behavioral
Risk Factor Surveillance System 1998-2003. Atlanta, GA: United States, Department of Health and Human Services.
Global Incidence of IDDM
0 5 10 15 20 25 30 35
FIN
CAN
SWD
SCOT
NOR
US
UK
DEN
PLD
Cuba
JPN
MEX
PRC
GENETIC RISK
 There is ample evidence that type 2 diabetes has a
strong genetic component.
 Type 2 diabetes clusters in families.
 The lifetime risk of developing type 2 diabetes is
about 40% in offspring of one parent with type 2
diabetes ; the risk approaches 70% if both parents
have diabetes.
 Intriguingly, the risk in the offspring seems to be
greater if the mother rather than the father has type 2
diabetes
 a first-degree relative of a patient with type 2 diabetes
has a threefold increased risk of developing the disease
ADULT OBESITY
 Obesity and weight gain are major risk factors for type
2 diabetes, and they have been blamed for or
implicated in the rising prevalence of diabetes
worldwide.
 A community-based survey in Saudi Arabia in 1995–
2000 of people aged 30–70 years found that 36.9%
were overweight and 35.5% were obese.
 Men were more likely to be overweight and women
were more likely to be obese
CHILDHOOD OBESITY
 The sharp increase in the prevalence of overweight and
obesity worldwide is not only limited to adults, but
also extends to adolescents and children and even to
preschool children. This increase in weight led to an
increase in the incidence of type 2 diabetes in
childhood, to a point that it is becoming more
common than type 1 diabetes in a few countries, such
as in Japan and Taiwan
Dietary risk factors
 Studies utilizing a variety
of epidemiological
approaches have
implicated a range of
lifestyle-related
environmental factors in
the etiology of type 2
diabetes
CARBOHYDRATE
AND DIETARY FIBER
 refined carbohydrates, and sugars in particular, might
be involved in the etiology of type 2 diabetes
 Over 40 studies have examined the role of sugars in
the etiology of type 2 diabetes, with about half
suggesting a positive association and a comparable
number suggesting no association
 On the other hand, there is rather more support for
the suggestion that foods rich in slowly digested or
resistant starch or high in dietary fiber (nonstarch
polysaccharide) might be protective In controlled
experiments, diets high in soluble fiber-rich foods [20]
or foods with a low glycemic index are associated with
improved diurnal blood glucose profiles and long-term
overall improvement in glycemic control, as evidenced
by reduced levels of glycated hemoglobin
 Some other studies provide indirect support for this
hypothesis. Diabetes risk appears to be lower in
Seventh-Day Adventists who are vegetarians than in
those who are not strict vegetarians [22].
 The diet of vegetarians is characterized by a high
intake of dietary fiber, but differs in other ways from
that of nonvegetarians. In addition to not eating meat
and animal products, vegetarians also have less
saturated fat,more polyunsaturated fat and a diet
which differs in micronutrient composition when
compared with nonvegetarians.
DIETARY FATS
 More than 60 years ago,
Himsworth [23] suggested
that high intakes of fat
increased the risk of
diabetes in populations
and individuals.
 In the San Luis Valley
Diabetes Study, a high fat
intake was associated with
an increased risk of type 2
diabetes and impaired
glucose tolerance (IGT)
[25];
 in a follow-up, 1 to 3 years
later, fat consumption
predicted progression to type
2 diabetes in those with IGT
 On the other hand, no association was found between
fat intake and risk of type 2 diabetes in a 12-year
follow-up of women in Gothenburg, Sweden
 The type of dietary fat may also be relevant. Saturated
fatty acids were positively related to fasting and
postprandial glucose levels in normoglycemic Dutch
men, the effect being independent of energy intake
and obesity.
 In a recent Italian study, intake of butter (rich in
palmitic and myristic acids) was positively associated
with fasting glucose levels, and the use of olive oil
(high in oleic acid) was inversely associated with
fasting glucose Levels
 The ratio of polyunsaturated to saturated fatty acids in
serum phospholipids has been shown to be inversely
associated with insulin secretion and positively
associated with insulin action
PROTEIN
 There are no firm epidemiological data concerning
 the role of protein intake in the etiology of
 type 2 diabetes,
 though the fact that meat-eating
 Seventh-Day Adventists have higher rates than
 those who do not eat meat has been taken to
 suggest a possible deleterious effect of animal
 protein
 The strong positive associations
 between animal protein and saturated fatty acids
 and vegetable protein and dietary fiber mean that
 it is almost impossible to disentangle separate
 effects in epidemiological studies.
 High intakes of proteins, especially animal
 protein, appear to be associated with an increased
 risk of nephropathy in type 1 diabetes [44], so
 restriction of protein may help to delay progression
 of microalbuminuria to clinical nephropathy
OTHER DIETARY FACTORS
 Several micronutrients, most notably chromium,
 zinc, magnesium and vitamin E, have been implicated
 in the pathogenesis of type 2 diabetes
 and/or been shown to be associated with improved
 glycemic control.
 However, no epidemiological
 studies have provided convincing support for the
 role of any of these nutrients in the etiology of the
 disease. There is, perhaps, rather more support for
 the suggestion vitamin D deficiency may be important
 Vitamin D deficiency impairs insulin release,
 followed, if prolonged, by impairment of insulin
 secretion and reduction of glucose tolerance which
 progresses to irreversible diabetes.
smooking
 The role of smoking
 as a risk factor for type 2 diabetes has received
 relatively little attention. Smoking induces insulin
 resistance [51], and cigarette smokers have
 been shown to be relatively glucose intolerant and
 Dyslipidemic
 Thus, smokers might be expected to be at
 considerably increased risk of type 2 diabetes.
PHYSICAL INACTIVITY
 In cross-sectional epidemiological
 studies, type 2 diabetes rates have been shown
 to be lower amongst physically active individuals
 than amongst those not having regular physical
 activity
 The protective effect of physical
 activity against type 2 diabetes has been confirmed
 in several prospective studi
¡Viva la Vida con Salud!
Prevalence of Factors Associated with Diabetes,
Puerto Rico BRFSS* 2003
45.2%
63.6%
27.3%
Physical Inactivity Overweight /
Obesity
Hypertension
* BRFSS = “Behavioral Risk Factor Surveillance System” (>18 years). Centers for Disease Control and Prevention. Behavioral
Risk Factor Surveillance System 2003. Atlanta, GA: United States, Department of Health and Human Services.
Normal Prediabetes Diabetes Complications Death
Risk Factors for Complications
•
Uncontrolled blood pressure
•
Inadequate glycemic control
•
Hyperlipidemia
•
Smoking
•
Sedentary behavior
Preventive Care Practices
•
Foot exam
•
HbA1c testing
•
Dilated eye examination
•
Diabetes education
et al J Public Health Management Practice, 2003 (suppl). S44-51
Stages in the Evolution of Major Diabetes Surveillance Indic
Primary Prevention
•
Physical activity
•
IFG / IGT
•
Diet/nutrition
•
Body composition
Indicators of Burden:
DM prevalence and incidence
Acute complications
Amputation
ESRD
CVD
Death
The future:
inued evolution of all domains.
New generation quality of care
Community or system level
County and state level
Health service measures for PP
Treatment
 In some individuals with diabetes, adequate glycemic
control can be achieved with weight reduction,
exercise, and/or oral glucoselowering agents.
 Individuals with extensive -cell destruction and
therefore no residual insulin secretion require insulin
for survival.
NutritionalManagement
of D M
 Diets rich in monounsaturated fat reduce total and
low-density lipoprotein cholesterol without adverse
effects on high- density lipoprotein cholesterol or
triglyceride levels
 a range of carbohydrate (45–60%) and fat (25–35%)
intakes is compatible with good diabetes control
provided that low glycaemic index carbohydrates and
foods high in monounsaturated fat are promoted.
 monounsaturated fatty acids should provide between
10 and 20% total energy
Glycemic index of certain food
items
 Low GI: Pasta, Basmati rice, wholegrain products,
porridge, oat-based cereal bars, lentils and pulses
including baked beans, and kidney beans
 High GI: Corn Flakes, Rice Krispies, sugared cereals,
white bread, rice (other than Basmati), potatoes, fruit
juice, bananas, honey sandwich
 for those people with Type 1 diabetes, especially
 in those with hypertension, intakes of protein should
not exceed 10–20% total energy because of the
increased risk of nephropathy
 It is recommended that a diet rich in foods which
naturally contain significant quantities of antioxidants,
especially fruit and vegetables, is followed
The normal protein requirements
are:
 . 2 g/kg per day in early infancy
 . 1 g/kg per day for a 10-year-old
 . 0.8 g/kg in later adolescence towards adulthood
Nutritional recommendations for childhood and
adolescent Type 1 diabetes
 Total daily energy intake should be distributed as
follows:
 (i) Carbohydrate >50%
 mainly as complex higher fibre carbohydrate
 moderate sucrose intake
 (ii) Fat 30–35%
 Mainly monounsaturated fat
 (iii) Protein 10–15% (decreasing with age)
 Fruit and vegetables (recommend five portions per
day)

Diabetes Mellitus.ppt

  • 1.
    Estado Libre Asociado dePuerto Rico Estado Libre Asociado de Puerto Rico
  • 2.
     over thepast few decades, diabetes has emerged as an important medical problem in developing regions of the world  In a more recent report on global diabetes estimates and projections for the years 2000–2030,Wild et al. showed that the worldwide prevalence of diabetes for all age groups would increase from 2.8% in 2000 to 4.4% in 2030, with a corresponding 114% increase in the numbers, from 171 million to 366 million. The greatest relative increases will occur in developing regions, namely India and the Middle Eastern Crescent
  • 3.
     Important contributorsinclude an increase in the urban population in developing countries and an increase in the proportion of people >65 years of age across the world
  • 4.
     Diabetes mellitus(DM) is a common syndrome and caused by lack or decreased effectiveness of endogenous insulin  The chronic hyperglycemia of diabetes is associated with long-term damage, dysfunction, and failure of various organs, especially the eyes, kidneys, nerves, heart, and blood vessels.
  • 5.
    Classification of primarydiabetes  Type 1 (insulin-dependent (IDDM), juvenile onset):  Only 5–10% of those with diabetes  May occur at any age but more common in patients <30y.  results from a cellular-mediated autoimmune destruction of the β-cells of the pancreas
  • 6.
     Some patients,particularly children and adolescents, may present with ketoacidosis as the first manifestation of the disease.  These patients are also prone to other autoimmune disorders such as Hashimoto’s thyroiditis, vitiligo, autoimmune hepatitis and pernicious anemia.
  • 7.
    Type 2 (non-insulindependent (NIDDM), maturity onset):  90–95% of those with diabetes  the cause is a combination of resistance to insulin action and an inadequate compensatory insulin secretory response  a degree of hyperglycemia sufficient to cause pathologic and functional changes in various target tissues, but without clinical symptoms, may be present for a long period of time before diabetes is detect
  • 9.
    Islet Cell Dysfunctionand Abnormal Glucose Homeostasis in Type 2 Diabetes
  • 10.
     Most patientswith this form of diabetes are obese, obesity itself causes some degree of insulin resistance  Insulin resistance may improve with weight reduction and/or pharmacological treatment of hyperglycemia but is seldom restored to normal
  • 11.
    The risk ofdeveloping this form of diabetes increases with:  age,  obesity,  and lack of physical activity.  In women with prior GDM  Individuals with hypertension or dyslipidemia
  • 13.
     Older  Overweight Insulin-resistant  High TG’s/Low HDL-C • Younger • More lean • Insulin-deficient • Low triglycerides Type 1 DM Type 2 DM
  • 14.
    Gestational diabetes mellitus (GDM) GDM is defined as any degree of glucose intolerance with onset or first recognition during pregnancy.  GDM complicates 4% of all pregnancies in the U.S., resulting in 135,000 cases annually
  • 15.
    Presentation of DM Acute: Ketoacidosis  Sub-acute: Weight loss, polydipsia, polyuria, lethargy, irritability, infections (candidiasis, skin infection, recurrent infections slow to clear), genital itching, blurred vision, tingling in hands/feet.
  • 16.
     With complications:Presentation with skin changes, peripheral neuropathy with risk of foot ulcers, amputations, nephropathy, eye disease  Asymptomatic: DM may be detected on routine screening during well man/woman checks .
  • 17.
    Adapted from Ramlo-HalstedBA, Edelman SV. Prim Care. 1999;26:771-789; Nathan DM. N Engl J Med. 2002;347:1342-1349 Natural History of DM 2 Type 2 diabetes Years from diagnosis 0 5 -10 -5 10 15 Pre-diabetes Onset Diagnosis Insulin secretion Insulin resistance Postprandial glucose Macrovascular complications Fasting glucose Microvascular complications
  • 18.
    Impact of DiabetesMellitus Diabetes The leading cause of new cases of end stage renal disease A 2- to 4- fold increase in cardio- vascular mortality The leading cause of new cases of blindness in working- aged adults The leading cause of nontraumatic lower extremity amputations www.hypertensiononline.org
  • 19.
    Criteria for theDiagnosis of Diabetes
  • 20.
  • 21.
    Estimated global prevalenceof type 1 and type 2 diabetes
  • 22.
    ¡Viva la Vidacon Salud! Global Prevalence Estimates, 2000 and 2030 0.0% 1.0% 2.0% 3.0% 4.0% 5.0% 2000 2030 4.4 % 2.8 % Reference: Wild S, Roglic G, Green A, Sicree R, King H. Global prevalence of diabetes. Diabetes Care. 2004; 27(5): 1047-1053.
  • 23.
    ¡Viva la Vidacon Salud! Diabetes in the World millions India 31.7 China 20.8 USA 17.7 Indonesia 8.4 Japan 6.8 Year 2000 Reference: Wild S, Roglic G, Green A, Sicree R, King H. Global prevalence of diabetes. Diabetes Care. 2004; 27(5): 1047-1053.
  • 24.
    ¡Viva la Vidacon Salud! Diabetes in the World millions India 79.4 China 42.3 USA 30.3 Indonesia 21.3 Japan 8.9 Year 2010 Reference: Wild S, Roglic G, Green A, Sicree R, King H. Global prevalence of diabetes. Diabetes Care. 2004; 27(5): 1047-1053.
  • 25.
    ¡Viva la Vidacon Salud! Prevalence of Diabetes by Country 11.0 7.4 7.1 7.0 5.0 Prevalence (%) Puerto Rico (2003)* Australia (2002)** United States (2003)* Arabia (1999)*** Alaska (2003)* * > 18 years only. Centers for Disease Control and Prevention. Behavioral Risk Factor Surveillance System 1999-2003. Atlanta, GA: United States, Department of Health and Human Services. ** Dunstan DW, Zimmet PZ, Welborn TA, Courten MP, Cameron AJ, Sicree RA, et al. The raising prevalence of diabetes and impaired glucose tolerance. Diabetes Care. 2002; 25(5): 829-834. *** Warsy AS, el-Hazmi MA. Diabetes mellitus, hypertension and obesity-common multifactorial disorders in Saudis. Eastern Mediterranean Health Journal. 1999; 5(6): 1236-42.
  • 26.
    ¡Viva la Vidacon Salud! Prevalence of Diabetes in Adults United States, BRFSS* 1998 - 2003 7.1 6.7 6.5 6.1 5.6 5.4 0.0 1.0 2.0 3.0 4.0 5.0 6.0 7.0 8.0 1998 1999 2000 2001 2002 2003 Prevalence (Mean %) * BRFSS = “Behavioral Risk Factor Surveillance System” (>18 years). Centers for Disease Control and Prevention. Behavioral Risk Factor Surveillance System 1998-2003. Atlanta, GA: United States, Department of Health and Human Services.
  • 27.
    Global Incidence ofIDDM 0 5 10 15 20 25 30 35 FIN CAN SWD SCOT NOR US UK DEN PLD Cuba JPN MEX PRC
  • 32.
    GENETIC RISK  Thereis ample evidence that type 2 diabetes has a strong genetic component.  Type 2 diabetes clusters in families.  The lifetime risk of developing type 2 diabetes is about 40% in offspring of one parent with type 2 diabetes ; the risk approaches 70% if both parents have diabetes.
  • 33.
     Intriguingly, therisk in the offspring seems to be greater if the mother rather than the father has type 2 diabetes  a first-degree relative of a patient with type 2 diabetes has a threefold increased risk of developing the disease
  • 34.
    ADULT OBESITY  Obesityand weight gain are major risk factors for type 2 diabetes, and they have been blamed for or implicated in the rising prevalence of diabetes worldwide.  A community-based survey in Saudi Arabia in 1995– 2000 of people aged 30–70 years found that 36.9% were overweight and 35.5% were obese.  Men were more likely to be overweight and women were more likely to be obese
  • 35.
    CHILDHOOD OBESITY  Thesharp increase in the prevalence of overweight and obesity worldwide is not only limited to adults, but also extends to adolescents and children and even to preschool children. This increase in weight led to an increase in the incidence of type 2 diabetes in childhood, to a point that it is becoming more common than type 1 diabetes in a few countries, such as in Japan and Taiwan
  • 36.
    Dietary risk factors Studies utilizing a variety of epidemiological approaches have implicated a range of lifestyle-related environmental factors in the etiology of type 2 diabetes
  • 37.
    CARBOHYDRATE AND DIETARY FIBER refined carbohydrates, and sugars in particular, might be involved in the etiology of type 2 diabetes  Over 40 studies have examined the role of sugars in the etiology of type 2 diabetes, with about half suggesting a positive association and a comparable number suggesting no association
  • 38.
     On theother hand, there is rather more support for the suggestion that foods rich in slowly digested or resistant starch or high in dietary fiber (nonstarch polysaccharide) might be protective In controlled experiments, diets high in soluble fiber-rich foods [20] or foods with a low glycemic index are associated with improved diurnal blood glucose profiles and long-term overall improvement in glycemic control, as evidenced by reduced levels of glycated hemoglobin
  • 39.
     Some otherstudies provide indirect support for this hypothesis. Diabetes risk appears to be lower in Seventh-Day Adventists who are vegetarians than in those who are not strict vegetarians [22].  The diet of vegetarians is characterized by a high intake of dietary fiber, but differs in other ways from that of nonvegetarians. In addition to not eating meat and animal products, vegetarians also have less saturated fat,more polyunsaturated fat and a diet which differs in micronutrient composition when compared with nonvegetarians.
  • 40.
    DIETARY FATS  Morethan 60 years ago, Himsworth [23] suggested that high intakes of fat increased the risk of diabetes in populations and individuals.  In the San Luis Valley Diabetes Study, a high fat intake was associated with an increased risk of type 2 diabetes and impaired glucose tolerance (IGT) [25];
  • 41.
     in afollow-up, 1 to 3 years later, fat consumption predicted progression to type 2 diabetes in those with IGT
  • 42.
     On theother hand, no association was found between fat intake and risk of type 2 diabetes in a 12-year follow-up of women in Gothenburg, Sweden  The type of dietary fat may also be relevant. Saturated fatty acids were positively related to fasting and postprandial glucose levels in normoglycemic Dutch men, the effect being independent of energy intake and obesity.
  • 43.
     In arecent Italian study, intake of butter (rich in palmitic and myristic acids) was positively associated with fasting glucose levels, and the use of olive oil (high in oleic acid) was inversely associated with fasting glucose Levels  The ratio of polyunsaturated to saturated fatty acids in serum phospholipids has been shown to be inversely associated with insulin secretion and positively associated with insulin action
  • 44.
    PROTEIN  There areno firm epidemiological data concerning  the role of protein intake in the etiology of  type 2 diabetes,  though the fact that meat-eating  Seventh-Day Adventists have higher rates than  those who do not eat meat has been taken to  suggest a possible deleterious effect of animal  protein
  • 45.
     The strongpositive associations  between animal protein and saturated fatty acids  and vegetable protein and dietary fiber mean that  it is almost impossible to disentangle separate  effects in epidemiological studies.  High intakes of proteins, especially animal  protein, appear to be associated with an increased  risk of nephropathy in type 1 diabetes [44], so  restriction of protein may help to delay progression  of microalbuminuria to clinical nephropathy
  • 46.
    OTHER DIETARY FACTORS Several micronutrients, most notably chromium,  zinc, magnesium and vitamin E, have been implicated  in the pathogenesis of type 2 diabetes  and/or been shown to be associated with improved  glycemic control.  However, no epidemiological  studies have provided convincing support for the  role of any of these nutrients in the etiology of the  disease. There is, perhaps, rather more support for  the suggestion vitamin D deficiency may be important
  • 47.
     Vitamin Ddeficiency impairs insulin release,  followed, if prolonged, by impairment of insulin  secretion and reduction of glucose tolerance which  progresses to irreversible diabetes.
  • 48.
    smooking  The roleof smoking  as a risk factor for type 2 diabetes has received  relatively little attention. Smoking induces insulin  resistance [51], and cigarette smokers have  been shown to be relatively glucose intolerant and  Dyslipidemic  Thus, smokers might be expected to be at  considerably increased risk of type 2 diabetes.
  • 49.
    PHYSICAL INACTIVITY  Incross-sectional epidemiological  studies, type 2 diabetes rates have been shown  to be lower amongst physically active individuals  than amongst those not having regular physical  activity
  • 50.
     The protectiveeffect of physical  activity against type 2 diabetes has been confirmed  in several prospective studi
  • 51.
    ¡Viva la Vidacon Salud! Prevalence of Factors Associated with Diabetes, Puerto Rico BRFSS* 2003 45.2% 63.6% 27.3% Physical Inactivity Overweight / Obesity Hypertension * BRFSS = “Behavioral Risk Factor Surveillance System” (>18 years). Centers for Disease Control and Prevention. Behavioral Risk Factor Surveillance System 2003. Atlanta, GA: United States, Department of Health and Human Services.
  • 53.
    Normal Prediabetes DiabetesComplications Death Risk Factors for Complications • Uncontrolled blood pressure • Inadequate glycemic control • Hyperlipidemia • Smoking • Sedentary behavior Preventive Care Practices • Foot exam • HbA1c testing • Dilated eye examination • Diabetes education et al J Public Health Management Practice, 2003 (suppl). S44-51 Stages in the Evolution of Major Diabetes Surveillance Indic Primary Prevention • Physical activity • IFG / IGT • Diet/nutrition • Body composition Indicators of Burden: DM prevalence and incidence Acute complications Amputation ESRD CVD Death The future: inued evolution of all domains. New generation quality of care Community or system level County and state level Health service measures for PP
  • 54.
    Treatment  In someindividuals with diabetes, adequate glycemic control can be achieved with weight reduction, exercise, and/or oral glucoselowering agents.  Individuals with extensive -cell destruction and therefore no residual insulin secretion require insulin for survival.
  • 55.
    NutritionalManagement of D M Diets rich in monounsaturated fat reduce total and low-density lipoprotein cholesterol without adverse effects on high- density lipoprotein cholesterol or triglyceride levels
  • 56.
     a rangeof carbohydrate (45–60%) and fat (25–35%) intakes is compatible with good diabetes control provided that low glycaemic index carbohydrates and foods high in monounsaturated fat are promoted.  monounsaturated fatty acids should provide between 10 and 20% total energy
  • 57.
    Glycemic index ofcertain food items  Low GI: Pasta, Basmati rice, wholegrain products, porridge, oat-based cereal bars, lentils and pulses including baked beans, and kidney beans  High GI: Corn Flakes, Rice Krispies, sugared cereals, white bread, rice (other than Basmati), potatoes, fruit juice, bananas, honey sandwich
  • 58.
     for thosepeople with Type 1 diabetes, especially  in those with hypertension, intakes of protein should not exceed 10–20% total energy because of the increased risk of nephropathy  It is recommended that a diet rich in foods which naturally contain significant quantities of antioxidants, especially fruit and vegetables, is followed
  • 59.
    The normal proteinrequirements are:  . 2 g/kg per day in early infancy  . 1 g/kg per day for a 10-year-old  . 0.8 g/kg in later adolescence towards adulthood
  • 60.
    Nutritional recommendations forchildhood and adolescent Type 1 diabetes  Total daily energy intake should be distributed as follows:  (i) Carbohydrate >50%  mainly as complex higher fibre carbohydrate  moderate sucrose intake  (ii) Fat 30–35%  Mainly monounsaturated fat  (iii) Protein 10–15% (decreasing with age)  Fruit and vegetables (recommend five portions per day)