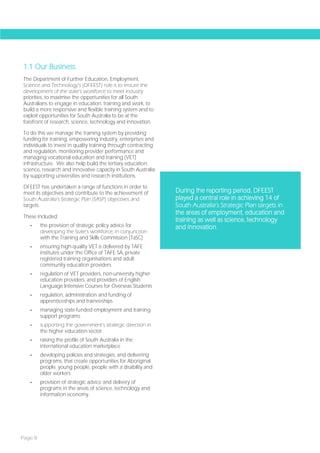
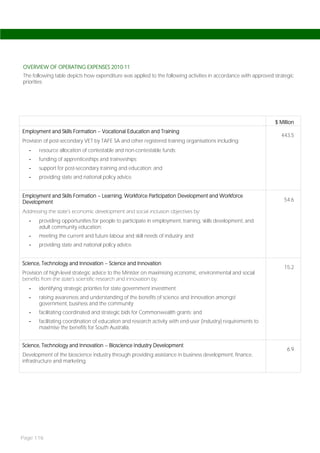
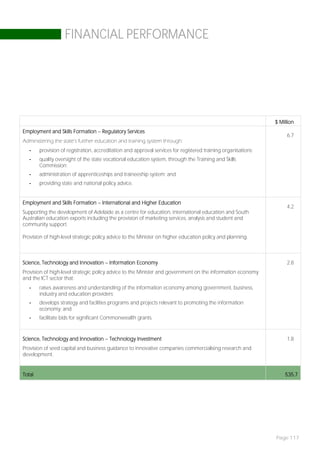
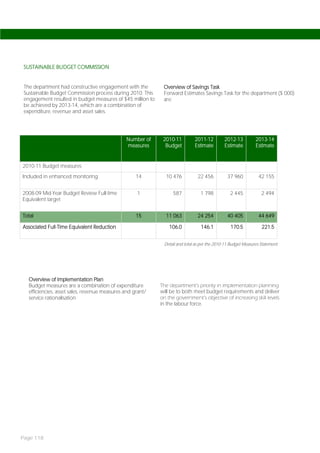
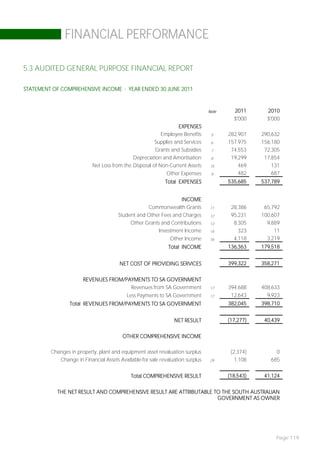
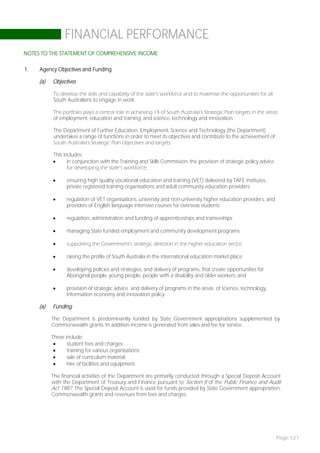
Page
FOR FURTHER COPIES AND ENQUIRIES PLEASE CONTACT


Department of Further Education, Employment, Science and Technology
Office of the Chief Executive
GPO Box 320
ADELAIDE SA 5001


ABN: 16692317206


Telephone: (08) 8226 3821
Facsimile: (08) 8226 9533


The 2011 Annual Report is available on the department’s website at:
http://www.dfeest.sa.gov.au


ISSN: 1449-6437


Page 2
Page 3
SECTION ONE                                   7
         YEAR IN REVIEW
           Our Business                                8
           From the Chief Executive                    9
           At a Glance: Highlights of 2011             10
           Skills for All                              12
           TAFE SA                                     14


         SECTION TWO                                   17
         ABOUT THE DEPARTMENT
           Our Priorities                              18
           Our Structure                               20
           South Australia’s Strategic Plan            22
           DFEEST’s Five Year Strategic Plan 2010-14   24


         SECTION THREE                                 27
         OUR PERFORMANCE
           Workforce Planning                          28
           Engagement with Industry                    32
           Providing Opportunities for All             40
           Building World-Class Infrastructure         50
           Digital Economy and Technology              54
           A Focus on Quality                          57
           Science and Research                        64
           Tertiary Education                          68
           National Contributions                      78


Page 4
CONTENTS

SECTION FOUR                                     83
CORPORATE GOVERNANCE AND REPORTING
  Ministerial Accountability                     84
  Legislation                                    84
  Boards, Committees and Authorities             85
  Governance                                     87
  Asbestos Management in Government Buildings    89
  Carers Recognition Act 2005                    89
  Disability Action Plans                        89
  Freedom of Information                         89
  Management of Human Resources                  91
  Reconciliation                                102
  Sustainability                                103
  Urban Design Charter                          111
  Whistleblowers Protection Act 1993            111


SECTION FIVE                                    113
FINANCIAL PERFORMANCE
  Financial Overview                            114
  Summary of Financial Information              114
  Audited General Purpose Financial Report      119
  Account Payment Performance                   165
  Consultants                                   165
  Certification by Departmental Executive       167
  Independent Auditor’s Report                  168
  Contractual Arrangements                      170
  Fraud                                         170
  Overseas Travel                               170


GLOSSARY                                        173


                                                Page 5
Page
SECTION ONE
         YEAR IN REVIEW


Page 7
1.1 Our Business
The Department of Further Education, Employment,
Science and Technology’s (DFEEST) role is to ensure the
development of the state’s workforce to meet industry
priorities, to maximise the opportunities for all South
Australians to engage in education, training and work, to
build a more responsive and flexible training system and to
exploit opportunities for South Australia to be at the
forefront of research, science, technology and innovation.

To do this we manage the training system by providing
funding for training, empowering industry, enterprises and
individuals to invest in quality training through contracting
and regulation, monitoring provider performance and
managing vocational education and training (VET)
infrastructure. We also help build the tertiary education,
science, research and innovative capacity in South Australia
by supporting universities and research institutions.

DFEEST has undertaken a range of functions in order to
meet its objectives and contribute to the achievement of        During the reporting period, DFEEST
South Australia’s Strategic Plan (SASP) objectives and          played a central role in achieving 14 of
targets.                                                        South Australia’s Strategic Plan targets in
                                                                the areas of employment, education and
These included:
                                                                training as well as science, technology
   -     the provision of strategic policy advice for           and innovation.
         developing the State’s workforce, in conjunction
         with the Training and Skills Commission (TaSC)
   -     ensuring high-quality VET is delivered by TAFE
         institutes under the Office of TAFE SA, private
         registered training organisations and adult
         community education providers
   -     regulation of VET providers, non-university higher
         education providers, and providers of English
         Language Intensive Courses for Overseas Students
   -     regulation, administration and funding of
         apprenticeships and traineeships
   -     managing state-funded employment and training
         support programs
   -     supporting the government’s strategic direction in
         the higher education sector
   -     raising the profile of South Australia in the
         international education marketplace
   -     developing policies and strategies, and delivering
         programs, that create opportunities for Aboriginal
         people, young people, people with a disability and
         older workers
   -     provision of strategic advice and delivery of
         programs in the areas of science, technology and
         information economy.


Page 8
YEAR IN REVIEW

1.2 From the Chief Executive
I am pleased to present the 2011 Annual Report for the
Department of Further Education, Employment, Science
and Technology.

2011 has been an exciting and challenging year with the
commencement of transformational reforms to South
Australia’s training system through Skills for All. The reforms,
when fully implemented, will see funding for an extra
100 000 training places, the removal of fees for many
courses, better access to training for many students and a
training system that will be able to respond more quickly to
student and industry demand.

In 2011 DFEEST implemented a number of major initiatives
to progress the Skills for All reforms.                            The centre will be a state-of-the-art facility incorporating the
                                                                   main building trades with a focus on sustainable industries
The Office of TAFE SA was established to help prepare              and clean technologies. The design was developed during
TAFE SA for the new contestable VET sector from                    2011 with construction work to commence in 2012.
July 2012. In addition, the implementation of 24 other
major reform projects commenced including the                      Throughout 2011 TAFE SA continued its focus on
assessment of Skills for All providers which will help             providing excellence in training to students from all walks
underpin the quality of training that occurs under                 of life. More than 81 000 students received training during
Skills for All.                                                    2011. Over 91 percent of TAFE SA graduates were satisfied
                                                                   with the overall quality of their training, the highest
A major initiative was the introduction of the Training            satisfaction rating nationally.
Guarantee for South Australian Certificate of Education
(SACE) Students which helps fund students to undertake             Employers also gave very positive feedback with over
vocational training while at school and upon completion of         90 percent extremely satisfied with the quality of training
their SACE guarantees an ongoing training place. This              being delivered by TAFE SA.
scheme will be expanded in 2012 with increasing interest
from schools and students.                                         It was a great honour that this high standard of training
                                                                   was recognised at the 2011 National Training Awards with
I am very pleased and proud of what staff across the               TAFE SA Regional winning the award as Large Training
department have achieved to date, and look forward to              Provider of the Year.
seeing the culmination of these efforts when Skills for All
goes fully live on 2 July 2012.                                    The department also received recognition for the
                                                                   excellence of its work through the 2011 Premier’s Awards.
In April, Adjunct Professor Don Bursill commenced his
appointment as Chief Scientist for South Australia and has         The first award was for the collaborative work DFEEST did
been working with the department and key stakeholders in           with AdamMax to provide wireless broadband to fix 50,000
strengthening the links between research and industry.             broadband blackspots across the state.

In August, the Minister for Science and Information                The second Premier’s Award was for the initiative ‘Remote
Economy launched 'A Science, Technology, Engineering               Indigenous Public Access Project – Oodnadatta’.
and Mathematics (STEM) Skills Strategy for South Australia' .
                                                                   None of this would have been possible without the
The STEM Skills Strategy is targeted at increasing the uptake      dedication and hard work of many staff and the leadership
in science, technology, engineering and mathematics                of our Ministers in 2011 - Minister Snelling, Minister
professions to support the growing demand in our high              Kenyon and Premier Weatherill.
value emerging industries.

During 2011 the department also progressed work on the
exciting new $105 million Sustainable Industries Education         Raymond Garrand
Centre at Tonsley Park.                                            Chief Executive


                                                                                                                            Page 9
1.3 At A Glance : Highlights of 2011


                            -   123 800 South Australian students participated in accredited training
                            -   34 400 Apprentices and Trainees participated in training (as at 30 June 2011) -
      People in Training
                                a 3.9 percent increase on the previous year’s figure
                            -   More than 81 000 students were enrolled in TAFE SA


                            -   Over $150 million of Commonwealth funding supported South Australian
   Commonwealth and State       employment and training outcomes
        Relations           -   The National Agreement for Skills and Workforce Development: Equity and
                                Foundation Skills, driven by DFEEST, was embedded in national policy


                            -   Over 1500 people were engaged in community consultations
                            -   The Training Guarantee for SACE Students commenced
                            -   Learner Support Services trials commenced in TAFE SA
          Skills for All    -   Over 1400 subsidised courses have been identified for inclusion on the Subsidised
                                Training List
                            -   The Adult Community Education program was expanded to increase
                                learner pathways


                            -   Skills for Jobs 2011, a five-year skills and workforce development plan, was launched
      Training and Skills
                            -   Two regional visits, Whyalla and the Riverland, were undertaken
         Commission
                            -   A workforce study on Eyre Peninsula mining projects was released


                            -   TAFE SA achieved 91 percent student satisfaction
                            -   The $9.4 million Victor Harbor campus was opened and awarded a Civic Trust Award
                            -   Construction of the Sustainable Industries Education Centre is one step closer
           TAFE SA
                            -   The new $20.4 million Student Information System was implemented
                            -   TAFE SA shone at South Australian Training Awards with TAFE SA Regional winning
                                Large Training Provider of the Year


Page 10
YEAR IN REVIEW


                              -     South Australia exceeded National Partnership Agreement targets
                              -     $51 million invested for Existing Workers with 14 000 existing worker
                                    enrolments approved
Productivity Places Program
                              -     $16 million invested for Job Seekers with 5 420 job seeker enrolments approved
                              -     A $4.5 million boost was allocated to the South Australian Defence industry
                              -     $4.6 million was invested to fund 1 223 qualifications in mining


                                  - Outback Connect won two Premier’s Awards for AdamMax – Shining the Light on
                                    Broadband Blackspots and Remote Indigenous Public Access Project – Oodnadatta
   Digital Economy and
                                  - The National Broadband Network arrived in Willunga with the highest take-up of
        Technology
                                    any region
                                  - Port Pirie received a $112 000 boost for broadband services


                              -     $5 million invested in a purpose-built Photonics Facility
  Science and Research        -     SA STEM Skills Strategy launched
                              -     Professor Don Bursill was announced as the new Chief Scientist for South Australia


                              -     Over 11 000 people participated in 93 Adult Community Education (ACE) programs
                                    delivered by 70 community-based organisations
  South Australia Works
                              -     $6.4 million invested will support 8800 people through South Australia Works
                              -     $2.4 million invested in the ACE program to increase learner pathways


                              -     $2.6 million of Commonwealth funding was secured for more training and jobs
 Aboriginal Training and
                              -     $1 million funding offered to assist Aboriginal job seekers
      Employment
                              -     Industry Clusters supported 285 Aboriginal people into training or employment


                              -     The amended Training and Skills Development Act 2008 was implemented to
                                    strengthen regulation
          Quality             -     The Vocational Education and Training (Commonwealth Powers) Bill drafted and
                                    submitted to Parliament
                              -     An International Student Card was launched with SAPOL


                                                                                                                  Page 11
1.4 Skills for All
 Skills for All, announced in late December 2010, is the             MORE SUPPORT FOR THE MOST DISADVANTAGED
 strategic direction for VET in South Australia.                     The South Australian government will encourage more
                                                                     people than ever to enter training, successfully complete
 Implementation is planned over four years. When fully               that training and gain employment. To achieve this,
 implemented, Skills for All will bring fundamental changes          additional learner support services, which will include
 to the state’s training system in order to:                         specialised learning and workplace experience, was trialled
  -    raise the skills level of South Australians                   for the most disadvantaged. Examples of disadvantaged
                                                                     groups include women returning to work and those facing
  -    increase the number of South Australians with post-
                                                                     generational unemployment.
       school qualifications
  -    increase workforce participation.                             Certificate I and II level training, and foundation skills will be
                                                                     fully funded with no course fees, and further concessions
 To support Skills for All, the South Australian government          will continue to be available at Certificate III and IV level for
 committed an additional $194 million and set an ambitious           low-income earners.
 goal as part of its Jobs Strategy which, with the Productivity
 Places Program (PPP), to create 100 000 new jobs for the            IMPROVED PATHWAYS INTO LEARNING AND WORK
 state over the six years from 2010-11.                              Skills for All recognises the importance of ensuring
                                                                     foundation skills are readily accessible to support those
 In order to achieve this goal, an additional 100 000 training       who may experience barriers to training and employment.
 places in key growth industries has been committed over
 six years.                                                          The state government has doubled funding for foundation
                                                                     skills and committed $6.4 million for the Adult Community
 The aim is to create a VET system that responds quickly and         Education (ACE) sector to create an additional 6000
 flexibly to the needs of individuals and industry; a system         training places for South Australians who want to boost
 which is simpler to access and navigate, and supports               their literacy and numeracy skills in order to move on to
 more people to enter training and progress to higher                higher level training or find work.
 qualifications and employment.
                                                                     Pathways from school to further training have also been
 Key aspects of the reform will be in place by 2 July 2012.          improved. The training system now supports school
                                                                     students 16 years and over who are on a VET pathway
 GOVERNMENT-FUNDED TRAINING PLACES
                                                                     and provides access to the training subsidy for further
 South Australians aged 16 years and over will be eligible           training once they complete school.
 for a government-funded training subsidy to meet
 individual needs and industry demand.                               A SHARED INVESTMENT IN SKILLS
                                                                     The funding structure is being simplified. The overall
 CLIENT CHOICE OF TRAINING PROVIDER
                                                                     funding provided by government is increasing. There will
 Students will be able to select the training provider of their      be a greater sharing of the costs for higher level training
 choice from TAFE SA and other approved private training             for which, at Diploma and Advanced Diploma levels,
 providers. To assist South Australians in selecting the             providers will be able to offer income-contingent loans.
 training and provider that is right for them, Skills for All will   Maximum and minimum restrictions on course fees will
 focus on developing resources and information that will             prevent providers from overcharging students, while
 give people access to high-quality information on careers,          ensuring that providers cannot offer training at artificially
 training options and providers.                                     low prices.
 CLIENTS WILL BE WELL INFORMED                                       MORE SUPPORT FOR INDUSTRY
 The Skills for All website will build a training information        Employers can also access government-endorsed,
 portal that offers information about Skills for All providers,      independent workforce development advisors to help
 their services and funded training courses. It will link South      identify workforce development needs and broker relevant
 Australians to high-quality information and tools on                training and support.
 careers, occupations and training pathways at one up-to-
 date and easy-to-navigate website.                                  Skills for All implementation has made good progress and is
                                                                     on track for the 2 July 2012 starting date.


Page 12
YEAR IN REVIEW

AN ASSURANCE OF QUALITY                                          A RENEWED PARTNERSHIP WITH INDUSTRY
From 2012, South Australia will be part of the National VET      Under Skills for All, the South Australian government will
Regulation system, and will work cooperatively with the          work with industry to promote workforce development,
Australian Skills Quality Authority (ASQA). Training             maximise investment in training and encourage more
providers wishing to access public funding will need to          people to gain skills through training throughout their
meet rigorous criteria to become a Skills for All provider.      working lives.
The requirements are in addition to meeting the standards
under the Australian Quality Training Framework (AQTF)           Skills in the Workplace
and may mean that not all currently registered training
providers will be able to access public funding. This will       The Skills in the Workplace program will allow employers in
result in training providers that meet the highest standards     key target industries to co-invest with government to
of quality for students to ensure that South Australia retains   improve the skill level of employees at higher qualification
its reputation for high-quality education and training.          levels and support workforce development.

From 2012, the Tertiary Education Quality Standards              Skills in the Workplace will offer contestable funding
Agency (TEQSA) will have national responsibility for higher      designed to raise the skill levels of existing workers and to
education provision.                                             address skill demands in key industry sectors. Employer
                                                                 commitment and investment will be key requirements of
EMPLOYER RECOGNITION PROGRAM                                     Skills in the Workplace, and government investment in the
                                                                 program will add to, not replace, enterprise investment in
DFEEST will establish a new Employer Recognition                 workforce skills development.
Program that publicly acknowledges the critical role
employers and businesses play in meeting skill needs and
developing the workforce. This new program will help to
recognise and reward employers and to assist in the
continued development of a culture of training in South
Australia.


                                                                                                                        Page 13
1.5 TAFE SA
 As South Australia’s largest provider of VET, TAFE SA plays a    TAFE SA was also awarded, or contributed to the awarding
 major role in providing a comprehensive range of courses         of the following:
 to industry, the community and disadvantaged groups.
 Together, the three TAFE institutes of Adelaide North,           -   TAFE SA was awarded the National Excellence Award
 Adelaide South and Regional play a critical role in delivering       for Outstanding Contribution to Indigenous
 on South Australian government priorities, including the             Interpreting by the Australian Institute of Interpreters
 facilitation of an additional 100 000 training places over six       and Translators for its delivery of the Diploma in
 years.                                                               Interpreting in the Anangu Pitjantjatjara Yankunytjatjara
                                                                      Lands and other parts of South Australia
 In 2011, TAFE SA delivered training to over 81 000 students
 in more than 800 courses across 50 campuses.                     -   A South Australian apprentice carpenter, trained by
                                                                      TAFE SA, was judged as the best apprentice and
 TAFE SA achieved the highest satisfaction ratings nationally         winner of the National Apprentice Carpenter of
 with over 91 percent of TAFE SA graduates satisfied with             the Year
 the overall quality of their training (National Centre for
 Vocational Education Research (NCVER) 2011), and                 -   TAFE SA’s Regency International Centre was awarded
 95 percent of TAFE SA graduates would recommend the                  the Servicing Industry Award at the South Australian
 training they undertook to other people.                             Premier’s Food Industry Awards which recognises a
                                                                      business for outstanding and innovative service. The
 A total of 91 percent of employers are satisfied with the            centre also won the bronze medal in the Tourism
 quality of training delivered by TAFE SA to apprentices and          Education and Training category at the 2011 South
 trainees, and 94 percent are satisfied with the quality of           Australian Tourism Awards
 nationally recognised training delivered by TAFE SA
 (NCVER 2011).                                                    -   An apprentice from Mount Gambier won a bronze
                                                                      medal at the 41st WorldSkills International Competition
 The Office of TAFE SA commenced operation in July 2011               held in London
 as an interim arrangement to progress TAFE SA priorities
 and to assist TAFE SA to become increasingly independent         -    A TAFE SA Building Lecturer won the 2011 SafeWork
 and accountable in preparation for autonomy as a                     award for the Best Individual Contribution to
 statutory authority. Ms Elaine Bensted, the Chief Executive,         Workplace Health and Safety for his submission on the
 Office of TAFE SA has been reporting to the TAFE SA                  3M™ Peltor™ Lite-Com III™ communication headset
 Interim Board since July 2011 and held to account for the            which controls hazardous noise and has improved
 outcomes against the Ministerial Charters and Institute              safety for lecturers and students. The TAFE SA Building
 Performance Agreements.                                              program is believed to be the first educational
                                                                      institution in Australia to have used this cutting-edge
 Fortnightly video-conferences were held for all staff to             technology in the form of two-way communication
 ensure that changes as a result of Skills for All are well           headsets to allow lecturers to effectively and safely
 understood by staff. Campus forums have also been held to            communicate with their students in a high-noise
 provide opportunities for staff to engage in discussion. All         training environment
 areas of TAFE SA’s business are being reviewed to ensure
 they are appropriate with the move into a new funding            -   A Glass Glazing Lecturer at Marleston campus won the
 model in 2012.                                                       Glass Glazing Association of South Australia 2011
                                                                      South Australian Glass Person of the Year Award
                                                                  -   TAFE SA Beer brand ‘Campus Brewery’ won two silver
 Recognition and Awards                                               medals at the 2011 Australian International Beer
 South Australia was well represented at the 2011 Australian          Awards for the beers ‘Nut Brown’ and ‘American
 Training Awards, with eleven nominations, including six              Brown Ale’. These awards showcase premium beer
 relating to TAFE SA. TAFE SA Regional won the Large                  and brewing excellence in the Asia-Pacific region.
 Training Provider of the Year and a TAFE SA student won
 Vocational Student of the Year. Murray Bridge Veterinary
 Clinic won Small Employer of the Year with accredited
 training provided by TAFE SA. TAFE SA was also the
 national runner-up in both of the VET Teacher/Trainer of
 the Year and Australian School-based Apprentice of the
 Year categories.


Page 14
YEAR IN REVIEW


Plans for 2012
2012 is a very important year for TAFE SA, with significant        TAFE SA will continue to set the benchmark in Australia in
changes being undertaken in the vocational education and           terms of student satisfaction and employment outcomes,
training system in South Australia as the Skills for All reforms   and continue to play a central role in the state’s
are introduced.                                                    development.

TAFE SA as South Australia’s largest provider will play a          TAFE SA fosters productivity, prosperity and social inclusion
critical role in progressing these reforms and 2011 has            through skills development for individuals and industry as a
been a year for TAFE SA to ensure it is ready to effectively       state government owned entity. TAFE SA will continue to
operate in a more competitive demand-driven market.                deliver on its goals by:

Legislation will be introduced in 2012 to establish TAFE SA           -   delivering training that provides students every
as a Statutory Authority. This will give TAFE SA greater                  opportunity to achieve their personal, educational
autonomy, increased capacity to respond to market needs,                  and career goals
and the opportunity to attract more funding and grow in               -   engaging with employers, industry and the
what will be a much bigger training system .                              community to continue developing the highly
During 2012, TAFE SA will strengthen relationships with                   skilled workforce they need
industries and engagement with employers to deliver the               -   ensuring our products and services meet the
education and training required to develop the highly                     diverse needs of our students and industry
skilled workforce needed by current and emerging
industries.                                                           -   prioritising resources to support our vision, meet
                                                                          market expectations and implement contemporary
With the proposed changes, work will continue for                         methodologies and technologies
TAFE SA to remain South Australia’s largest provider of               -   building relationships to guarantee our
vocational education and training and will continue to offer              educational delivery is meaningful and current
a diverse range of courses, including building, construction
and furnishing, manufacturing, engineering and transport,             -   working with ACE providers to support South
community services and health, hospitality and tourism,                   Australians needing foundation skills.
business and finance and primary industries, food                  TAFE SA looks forward to working with students, staff,
and wine.                                                          employers, industry and its many stakeholders during 2012
                                                                   and in the future.


                                                                                                            Vanessa Corbell - a
                                                                                                             TAFE SA Floristry
                                                                                                             student won the
                                                                                                            State and National
                                                                                                            Oasis Designz Cup
                                                                                                               competitions


                                                                                                                        Page 15
Page
SECTION TWO
          ABOUT THE DEPARTMENT


Page 17
2.1 Our Priorities
Through skills and innovation, DFEEST provides the                   OUR VISION
underpinning elements for a strong sustainable economy               South Australia has the best workforce in Australia.
for South Australia, achieved through greater participation
and productivity from our workforce.
                                                                     OUR MISSION
DFEEST’s priorities include ensuring South Australia has
exemplary workforce planning and development practices;              To develop the skills and capability of the state’s workforce
strong industry partnerships; increased participation in             and to maximise the opportunities for all South Australians to
learning and work; a state with high quality and excellence          engage in work.
in tertiary education and training; supporting the state’s
environmental sustainability through the development of              Our actions to achieve this mission include:
skills and technology; supporting world competitive research           -    supporting the Training and Skills Commission
and uptake of new technologies and innovation; all with a                   (TaSC) in providing strategic advice and
continued emphasis on quality and high performance.                         recommendations to the government on priorities
                                                                            and actions to increase the skills base of the
Supporting the South Australian government’s agenda in
                                                                            workforce
areas such as Information and Communication Technology
(ICT) infrastructure, and the rollout of the National                   -   working with industry, employers, business and
Broadband Network (NBN) in identified regions of the state                  across government to develop the highly skilled
is a continuing priority of DFEEST.                                         workforce needed by current and
                                                                            emerging industries
In preparation for the ongoing implementation of Skills for
                                                                        -   building on our past successes to propel the state
All from 2012, the process for identifying and developing its
                                                                            forward with an education and training system that
strategic direction was a major priority throughout 2011.
                                                                            is more responsive to industry demands
Skills for All, the department’s strategic direction for VET, will
position the sector to respond quickly and flexibly to the skill        -   exploiting opportunities which put South Australia
needs of industry and individuals. This includes ensuring that              at the national forefront of research and
TAFE SA has appropriate governance and funding                              technology, and innovation development
arrangements in place so that it is well prepared for changes
                                                                        -   creating more opportunities for Aboriginal people,
to the way in which VET is delivered in South Australia.                    young people, people with disabilities and older
                                                                            people to participate in the workforce and in
                                                                            their communities.


Page 18
ABOUT THE DEPARTMENT


OUR VALUES
DFEEST is striving to become a high-performance learning         Openness in decision making by:
organisation which attracts, develops and retains a highly
                                                                    -    providing reasons for our decisions
talented workforce. The department will only achieve this
through a strong commitment to our people and core                  -    restricting information only in the public interest
values. We will demonstrate this through:                                and preservation of personal privacy
                                                                    -    resolving conflicts
Respect for:                                                        -    being transparent.
   -   the values, beliefs, customs and cultures of
       individuals and our community
                                                                 Striving for excellence in:
   -   others’ rights, responsibilities and professionalism.
                                                                    -    the efficient and effective use of public resources
Responsiveness in:                                                  -    environmental sustainability
   -   providing timely and caring services                         -    embedding equality of access and opportunity
   -   generating innovative and creative                           -    treating people fairly
       shared solutions                                             -    standards of service.
   -   embracing change that improves our effectiveness
       and efficiency
                                                                 Courage in:
   -   recognising and celebrating effort
       and achievement.                                             -    challenging and being challenged
                                                                    -    taking risks
                                                                    -    doing things in different ways
                                                                    -    taking responsibility for mistakes and learning
                                                                         from them
                                                                    -    enforcing our code of conduct.


                                                                                               The key priorities for the
                                                                                               Department of Further
                                                                                               Education, Employment,
                                                                                               Science and Technology in
                                                                                               2011 centred on the
                                                                                               department’s Strategic Plan
                                                                                               2010-2014 and
                                                                                               directly reflected the vision,
                                                                                               mission and values of
                                                                                               South Australia’s Strategic
                                                             Kristal West -                    Plan targets.
                 Aboriginal and Torres Strait Islander Student of the Year
                                2011 South Australian Training Awards
                                                                                                                           Page 19
2.2 Our Structure
                                                                  PRODUCTIVITY
In order to successfully respond to the objectives of             One of the focuses for Skills for All is the need for industry to
Skills for All, and to strengthen capacity in science, research   increase its productivity through co-investment in training
and technology, the structure within the department               and workforce development. This is ideally achieved
required transformation.                                          through a renewed partnership with education providers,
                                                                  industry, unions, the community and individuals.
The organisational restructure was fundamentally about
refocusing the department to deliver on the new policy            The application of science, research, innovation and digital
direction and approach in Skills for All and to deliver on the    technologies will also be critical determinants of future
Minister’s agenda for advancing science, technology,              productivity and growth.
engineering and mathematics (STEM) skills as well as for
science, research and technology.                                 The following directorates are grouped under the
                                                                  Productivity stream:
The realignment of activities also provided an opportunity
to achieve administrative efficiencies, minimise duplication,        -    Traineeship and Apprenticeship Services
improve systems and processes and, where possible,                   -    Industry Skills Development
economies of scale in areas such as contract management
                                                                     -    Digital Economy and Technology
and administration to achieve significant budget savings.
                                                                     -    Quality, Tertiary Education, Science and Research
Skills for All is making significant changes to South                     (QTESR) (specifically STEM and science
Australia’s VET system, and TAFE SA, the state’s public                   and research).
training provider is changing too. Skills for All gives TAFE SA
greater autonomy along with increased capacity to
respond to changing market needs.
                                                                  PARTICIPATION
With TAFE SA having greater autonomy through the Office
of TAFE SA, and in the future as a statutory authority, there     Skills for All proposes fundamental changes to the way
was a need to reconfigure DFEEST Corporate, both in               training is accessed. A new directorate, Skills SA, was
terms of its relationship with TAFE SA as well as in terms of     formed to deliver on Skills for All reforms. Skills SA has a
working across the training system, with all education            dedicated team of staff to ensure stakeholders have access
sectors, industry and employers.                                  to high-quality consumer information on careers and
                                                                  training options. The focus initially is on provision of better
The organisational restructure, and the corresponding             information to allow a demand-driven model to function
changes in the way that DFEEST operates, was designed to          and then investment in systems to administer and allocate
ensure that the department could deliver on Skills for All        funding based on student demand and industry needs.
objectives and requirements. Initial structural changes were
made from 1 July 2011.                                            The department has a focus on increasing the participation
                                                                  of South Australians in learning, training and work, in
The DFEEST Corporate structure has been developed                 particular people experiencing barriers and disadvantage in
around three themes which inform functional groupings:            the labour market.
   -    Productivity                                              Directorates under the Participation stream include:
   -    Participation                                                -    QTESR (specifically quality of training providers
   -    Policy and Corporate Support.                                     through contracting and support for
                                                                          professional development)
                                                                     -    Skills SA
                                                                     -    Participation and Equity.


Page 20
ABOUT THE DEPARTMENT

POLICY AND CORPORATE SUPPORT
Strategic Policy, Resources and           Corporate Services                           Corporate Communications and
Finance                                   Skills for All will require changes to the   Marketing
The key objective of the Strategic        tools, resources and infrastructure          Corporate Communications and
Policy, Resources and Finance area is     required to support the new student-         Marketing is responsible for managing
to ensure highest quality business,       centred demand-driven training               the communications and marketing
economic and labour market analysis       system. This will require enhanced           needs of DFEEST and for providing
to support prompt and informed            information management systems               strategic media and communications
resource allocation by the Chief          configured to new funding models.            advice to the Chief Executive and the
Executive and DFEEST executives,          With new systems comes an                    Minister.
thereby focusing alignment between        opportunity to review and consolidate
DFEEST programs and pursuit of            contract management and                      The role includes responding to
strategic targets (both for DFEEST        administrative functions. Corporate          requests from the media, and initiating
and SASP).                                Services had previously undergone a          contact with the media to announce
                                          major review to develop a preferred          and promote initiatives of DFEEST and
Strategic policy, review and evaluation   structure that will provide the optimal      TAFESA. It also includes providing
are brought together in a single          systems and arrangements to deliver          advice on the development and use
directorate to provide strong             on the Skills for All reforms and            of social media, monitoring trends in
integration between policy and            achieve efficiencies.                        communications and marketing, and
evaluation, and some economies of                                                      managing and marketing events such
scale. Individual directorates are        For more information about                   as the South Australian Training
responsible for operational policy,       Corporate Governance, please refer to        Awards and the South Australian
operational review and evaluation as      page 87.                                     Science Excellence Awards.
it relates to implementation.


                                                                                                                      Page 21
2.3 South Australia’s Strategic Plan
South Australia’s Strategic Plan (SASP) outlines a medium to
long-term course for the whole of South Australia, and sets
out targets under interrelated objectives.

At the start of 2011, DFEEST was the lead agency
responsible for 14 targets, under the objectives: growing
prosperity; fostering creativity and innovation; and
expanding opportunity.


OBJECTIVE – GROWING PROSPERITY

T1.10     Jobs: Better the Australian average employment        T4.10   Australian Government resources: Secure
          growth rate by 2014. (Now target T47).                        Australian Government research and
                                                                        development resources to 10 percent above
T1.11     Unemployment: Maintain equal or lower than                    South Australia’s per capita share by 2010
          the Australian average through to 2014.                       and increase this share to 25 percent by
          (Now target T49).                                             2014, for both public and private spheres.

T1.12     Employment participation: Increase the                T4.11   Business expenditure: Increase business
          employment to population ratio, standardised                  expenditure on research and development to
          for age differences, to the Australian average.               1.5 percent of GSP in 2010 and increase to
                                                                        1.9 percent by 2014. (Now target T98).
T1.26     Aboriginal unemployment: Reduce the gap
          between Aboriginal and non-Aboriginal
          unemployment rates each year.
          (Now target T51).
                                                               OBJECTIVE – EXPANDING OPPORTUNITY
T1.16     Share of overseas students: Double South
          Australia’s share of overseas students by 2014.
          (Now target T90).                                     T6.15   Learning or earning: By 2010, increase the
                                                                        number of 15-19 year olds engaged full-time
                                                                        in school, work or further education/training
OBJECTIVE – FOSTERING CREATIVITY AND INNOVATION                         (or combination thereof) to 90 percent.
                                                                        (Now target T54).
T4.6      Commercialisation of research: Increase gross
          revenues received by South Australian-based           T6.19   Non-school qualifications: By 2014, equal or
          research institutions from licences, options,                 better the national average for the
          royalty agreements, assignments, licensed                     proportion of the labour force with
          technology and patents by 2010.                               non-school qualifications.
          (Now target T95).                                             (Now target T91).
                                                                T6.20   Higher education: Increase South Australia’s
T4.8      Broadband usage: Broadband usage to                           proportion of higher education students to
          exceed the Australian national average by                     7.5 percent of the national total by 2014.
          2010, and be maintained thereafter.                           (Now target T93).
          (Now target T57).
                                                                T6.21   VET participation: Exceed the national
T4.9      Public expenditure: By 2010, public                           average for VET participation by 2010.
          expenditure on research and development as
          a proportion of GSP, to match or exceed
          average investment compared to other
          Australian states. (Now target T96).


Page 22
ABOUT THE DEPARTMENT


RELAUNCH OF THE SASP
The 2011 update of the SASP included 100 targets
restructured to reflect the visions shared by all South
Australians across six priority areas of community,
prosperity, environment, health, education and ideas.

Since November 2011, DFEEST has had lead responsibility
for 17 of the 100 targets detailed in the Plan in the areas of
prosperity, education and ideas. While many of the
department’s targets have been amended, five new targets
have been assigned:

T48     Ageing workforce participation: Increase the
        proportion of older South Australians who are
        engaged in the workforce by 10 percentage
        points by 2020.

T50     People with disability: Increase by 10 percent the
        number of people with a disability employed in
        South Australia by 2020.

T55     Apprentices: Increase the number of apprentice
        completions in trade occupations by 20 percent
        by 2020.


T58     Online business: Increase the proportion of
        businesses that receive orders online from
        24 percent to 40 percent by 2014 and continue
        growth each year to 2020.

T92     Science, technology, engineering and
        mathematics qualifications: Increase the number
        of domestic students completing undergraduate
        qualifications in specified science, technology,
        engineering and mathematics fields of education
        by 15 percentage points to 3 600 students per
        annum by 2020.


                                                                 Page 23
2.4 Our Five Year Strategic Plan 2010-14
The department’s Five Year Strategic Plan 2010-14, released
in May 2010, provides the strategic direction for the
department. The plan maps out seven clear goals that link
to SASP targets, and which focus on:


1. EXEMPLARY WORKFORCE PLANNING AND                                3. HIGH LEVELS OF PARTICIPATION AND ACHIEVEMENT
DEVELOPMENT                                                        IN LEARNING AND WORK
Our future workforce will be built through a world-class           Investing in education, skills and training that leads to
system of workforce planning and development based on              secure, well-paid jobs is essential to the state’s future
understanding and responding to both industry and                  prosperity through increased productivity, workforce
individual demand.                                                 participation and social inclusion.

Links to SASP Targets T1.10, T1.11, T1.12, T1.26, T6.15,           Links to SASP Targets T1.16, T6.15, T6.19, T6.20 and T6.21.
T6.19, T6.20 and T6.21.


                                                                   4. EXCELLENCE IN TERTIARY EDUCATION AND TRAINING
2. STRONG INDUSTRY PARTNERSHIPS
                                                                   Building the capability, quality and capacity of the VET and
Strong partnerships ensure employers have people with              higher education systems to meet the demands of
the right skills at the right time to increase productivity in a   individuals and of industry to address South Australia’s
rapidly changing and higher skilled economy.                       future labour supply requirements.
Links to SASP Targets T1.10, T1.11, T1.12, T1.26, T4.6, T4.8,      Links to SASP Targets T1.10, T6.15, T6.16, T6.19, T6.20
T4.9, T4.10, T4.11, T6.15, T6.19, T6.20 and T6.21.                 and T6.21.


Page 24
ABOUT THE DEPARTMENT


5. WORLD COMPETITIVE RESEARCH, TECHNOLOGY AND                    7. DFEEST IS A HIGH-PERFORMANCE ORGANISATION
INNOVATION                                                       DFEEST is a highly skilled organisation that provides
                                                                 responsive, effective and efficient services to industry, small
The state’s prosperity, economic growth, environmental           and medium enterprises, individuals, the community and
sustainability and social wellbeing are underpinned by the       the government.
discovery and application of knowledge to create new and
better products, and smarter processes and systems.              Links to SASP Targets T1.7, T1.8, T1.9, T2.7, T2.11, T2.12,
                                                                 T3.13 and T4.8.
Links to SASP Targets T4.6, T4.8, T4.9, T4.10 and T4.11.


6. SKILLS AND TECHNOLOGY FOR THE STATE’S
ENVIRONMENTAL SUSTAINABILITY
The long-term economic prosperity of South Australia is
inextricably connected to environmental sustainability,
investments in research and technological innovations and
in building the skills for sustainable development; these
things are essential to secure business and employment
opportunities from innovative green industries and services.

Links to SASP Targets T3.7, T4.6, T4.7, T4.9, T4.10 and T4.11.


                                                                                                                         Page 25
Joshua Konc -
                         Apprentice of the Year
          2011 South Australian Training Awards
Page 26
SECTION THREE
          OUR PERFORMANCE


Page 27
3.1 Workforce Planning
DFEEST Strategic Plan Goal 1

DFEEST continued to refine workforce modelling in                         Skills for Jobs
conjunction with the TaSC as follows:                                     In early December 2011 the TaSC released its annual
      -    supported targeted industries to develop                       update of the five-year plan for skills and workforce
           workforce plans                                                development, Skills for Jobs. The plan showed that job
                                                                          openings over the period 2009-10 to 2014-15 will total
      -    facilitated the development and launch of the                  approximately 163 000, comprising of 69 000 new jobs
           Resources Industry Workforce Action Plan in                    due to economic growth and 94 000 due to replacement
           conjunction with Resources and Energy                          of those leaving the workforce.
           Skills Australia
      -    supported the early childhood development                      The total demand for qualifications over this period is
           workforce through an analysis of their workforce               estimated to reach 299 000 - 95 000 of which are at the
           requirements, and informed the State Migration                 Bachelor degree or higher; 51 000 at the
           Plan through analysis and modelling of                         Advanced Diploma/Diploma level; 44 000 at the Certificate
           relevant data.                                                 IV level and 70 000 at the Certificate III level.

However, more and better job opportunities are vital if                   The plan was again developed following extensive
people are to lead fulfilling, independent lives and generate             consultation with industry and regional stakeholders, and
future opportunities. Being employed affects income, living               includes a detailed analysis on the demand for
standards, welfare dependency, social inclusion and social                qualifications associated with specialist occupations. The
connectedness, and through them, social and economic                      plan identifies 87 specialist occupations in South Australia,
wellbeing, for both individuals and their family members 2.               around one-quarter of all occupations in the state. The skills
                                                                          for these occupations are highly specialised and often
While strong jobs growth is a sign of a strong and                        require extended learning over several years. TaSC’s
prosperous economy, the quality of available jobs is                      analysis shows that 33 of these specialist occupations are
increasingly important. Higher skilled jobs provide higher                likely to have insufficient supply of qualifications over the
incomes and greater security for the people who                           five-year period. This information will be used by DFEEST in
hold them.                                                                devising its eligible qualifications list and caps and
                                                                          incentives regime under Skills for All reforms.
DFEEST also continued to work with a number of industries
concerning their workforce planning and development                       The 2011 plan also highlighted the participation challenge
needs. During the year, DFEEST supported the workforce                    facing South Australia and urged the government to
planning activities of a number of industries, including                  address this challenge through targeting its Skills for All
transport and logistics, telecommunications, early                        investment in areas such as foundation skills, adult
childhood, defence and mining industries.                                 community education, and wrap-around services for those
                                                                          who face barriers to training and work.
DFEEST continued to coordinate and facilitate joint
activities with the network of industry skills boards which
provided opportunities to work through policy issues
with industries.

As part of Skills for All, employers will be able to access
government-endorsed, independent workforce
development advisors to help identify workforce
development needs and broker relevant training
and support.


 2
     ABS 2010, Year Book Australia, 2009-10, cat. no. 1301.0, ABS, Canberra cited in ABS 4125.0 - Gender Indicators, Australia, July 2011

Page 28
OUR PERFORMANCE

Plans for 2012
As the government transfers its regulatory powers over to       In 2012 the TaSC will continue to hold regional visits
ASQA in VET and Tertiary Education Quality and Standards        following its successful visits to Whyalla and the Riverland
Agency (TEQSA) in higher education in 2012 the TaSC will        during 2011. During 2012 the TaSC will also advise the
continue to advise the Minister on the extent to which          Minister on how the state can maximise employment
Skills for All produces quality vocational outcomes. The TaSC   participation from the mining expansion, particularly for
will also encourage industry to embrace Skills for All and      regional communities.
partner with government to invest in workforce planning
and training.


     15 Percent Workforce Participation in Government Construction Procurement
     From 1 January 2011, government construction contracts require the contractor to ensure
     that 15 percent of the onsite labour hours on major government building and civil
     infrastructure projects are undertaken by apprentices, trainees, Aboriginal people and local
     people who have barriers to employment.
     DFEEST is working with contractors to provide assistance to meet compliance obligations
     through measures such as South Australia Works, Skills in the Workplace and
     Indigenous programs.
     Projects signed in 2011, and that fall within scope, include DFEEST’s Sustainable Industries Education Centre
     (SIEC) and the Adelaide Oval Redevelopment.

     Other projects that were signed prior to 1 January 2011, such as the Seaford Rail Extension and the South Road
     SuperWay have participation targets built into their contracts. DFEEST’s South Australia Works regional
     coordinators are working with these contracts to identify training and employment services that will assist them
     to meet their targets.


     Women Influencing Defence and Resources Industry project
     DFEEST collaborated with the defence and resources sectors to foster a community of
     practice with over 150 women. The Women Influencing Defence and Resources Industry
     project provided programs aimed at supporting the attraction and retention of female
     employees in the two industry sectors. Participants attended professional development in
     leadership and mentoring and were provided with networking opportunities.


                                                                                                                      Page 29
Employment Growth
 The current annual employment growth rate at December 2011 was 0.6 percent in South Australia and 0.1 percent at the
 national level. At the same time, South Australia’s labour force participation rate was 63.3 percent.


                       Figure 1: Trend total employment growth


                                                                                                          Source: Australian Bureau of Statistics (ABS) Cat No 6202.0


                          Figure 2: Labour force participation
               66%
               65%
               64%
               63%
                                                                                                                               63.2%
               62%                                                                                                           Dec 2011
                                                                                                                                  Projected
               61%                                                                                                        (Target 65.4 at Jan 2012 )
                                                         Trend (Jan 2001 - Dec 2011)
               60%
               59%
               58%
                     Jan-01

                              Jan-02

                                       Jan-03

                                                Jan-04

                                                           Jan-05

                                                                    Jan-06

                                                                             Jan-07

                                                                                      Jan-08

                                                                                               Jan-09

                                                                                                        Jan-10

                                                                                                                 Jan-11

                                                                                                                          Jan-12

                                                                                                                                   Jan-13

                                                                                                                                            Jan-14

                                                                                                                                                     Jan-15

                                                                                                                                                              Jan-16


                                                                                                                                              Source: ABS Cat No 6202.0


Page 30
OUR PERFORMANCE

Young people full time in school, work or further education/training
In November 2011, 85.5 percent of young people aged 15 to 19 in South Australia were engaged full time in either study
or employment, or a combination of both. This compares to 84.8 percent at the national level.


                 Figure 3: Youth (15-19 years) learning or earning engagement ratio


                                                                                                         Source: ABS Cat No 6202.0


Unemployment rates by level of educational attainment
In 2006, people with qualifications of Certificate III and above experienced unemployment rates considerably lower than
those without higher level qualifications.


                      Figure 4: Unemployment rate census 2006


                                                                                                Source: ABS Population Census 2006


                                                                                                                       Page 31
3.2 Engagement with Industry
DFEEST Strategic Plan Goals1, 2 and 3


APPRENTICES AND TRAINEES
The traineeship and apprenticeship system is an area in
which the department directly engages with industry to
develop and maintain South Australia’s skilled workforce.
DFEEST is responsible for the regulation of South Australia’s
traineeship and apprenticeship system, under delegation
from the Training and Skills Commission, and for the
provision of subsidies to support the training of trainees
and apprentices.


Trainee and apprentice activity                                 Traineeship and Apprenticeship Information Service
In 2011, more South Australians participated in the             The department operates an information service to provide
traineeship and apprenticeship system than ever before,         advice and information on the traineeship and
with an increase in both the number of commencements            apprenticeship system to trainees, apprentices, their
and completions. The number of early completions                employers and the general public. In 2011, the information
also increased.                                                 service responded to 27 341 phone calls – an average of
                                                                525 calls per week. This represents a 5.5 percent increase in
   -   At 30 June 2011, there were an estimated 34 400
       trainees and apprentices in training, a 3.9 percent      calls from 2010.
       increase on the previous year’s figure
       (see Figure 5)
                                                                Employer Registrations and Employer Visits
   -   In 2010-11, there were an estimated 23 200
       traineeship and apprenticeship commencements,            The Training and Skills Development Act 2008 requires
       a 4.5 percent increase on the previous year’s            employers to register prior to employing and training
       figure (see Figure 5)                                    trainees and apprentices. In 2011, 2294 new employers
                                                                were registered to take on trainees and apprentices. A total
   -   An estimated total of 12 400 trainees and                of 16 032 employers were registered in South Australia at
       apprentices completed their training in the twelve       31 December 2011.
       months to 30 June 2011, a 4.2 percent increase on
       the previous year’s figure (see Figure 5)                The department works closely with employers and their
   -   The number of existing worker commencements              trainees and apprentices and conducted over 4000
       and newly commencing workers both increased              employer visits in 2011.
       in 2010-11 (see Figure 6).
   -   The number of early completions experienced a
       minor increase of 0.4 percent in 2011.


Page 32
OUR PERFORMANCE


Figure 5: Trainee and apprentice activity, five years ending 30 June 2011 4

 40000

 35000
 30000

 25000

 20000                                                            In-Training

 15000                                                            Commencements
                                                                  Completions
 10000
     5000

        0
            2007    2008     2009     2010     2011

                              Year


Figure 6: Existing worker trainee and apprentice commencements compared to newly commencing
workers, five years ending 30 June 2011 4


 4
   Data for Figures 8 and 9 are sourced from the NCVER Australian VET statistics – Apprentices and trainees June quarter
 (2011) report. Data for 2011 and in training data for 2010 are estimates. The NCVER may revise these figures in the fu-
 ture. In training data is provided at 30 June annually; commencement and completion data are provided from the
 12 months ending 30 June of each year.


                                                                                                                 Page 33
User Choice Training Subsidies                                     E-Training Plans
The department is responsible for the provision of User            Registered Training Providers are now able to lodge
Choice training subsidies to both public and private training      apprenticeship and traineeship training plans online. Online
organisations, to support trainees and apprentices with the        lodgement has reduced red tape and improved the quality
cost of formal training. The User Choice policy has                of the information available to the department.
historically supported all trade qualifications, a range of
traineeships at Certificate II and III Australian Qualifications   Apprenticeship Nominal Terms
Framework (AQF) levels and a small number of higher level
traineeship qualifications. As part of the South Australian        DFEEST prepared a consultation paper for the TaSC that
government’s election promise to support an additional             was used to consult key industry stakeholders about the
100 000 training places over six years and the Skills for All      appropriateness of current nominal terms for twelve trade
reform, User Choice funding was extended to all existing           apprenticeships. The chosen trades have an early
worker trainees undertaking Certificate III qualifications in      completion rate of 40 percent or more for all completions
September 2011. This was followed by the extension of              over the period January 2007 to June 2010. The trades
training subsidies to new and existing worker trainees who         concerned were Bread Baker and Pastry Cook, Butcher,
commenced a Training Contract from 7 December 2011 in              Cook, Automotive Parts Interpreting (Specialist), Engineering
most AQF levels II to VI qualifications.                           Tradesperson (Fabrication) and (Mechanical), Bricklaying,
                                                                   Carpentry and/or Joinery, Painting and Decorating, Tiling
In 2010, 160 registered training organisations (consisting of      (Wall and Floor), Hairdressing and Printing Machining. All
TAFE SA and privately owned providers) received funding            have a nominal term of four years, except for Automotive
under a User Choice agreement. A total of $42 million in           Parts Interpreting (Specialist), which has a three-year term.
contestable funding was provided by the department                 The TaSC will consider industry feedback in early 2012.
during the year to support almost 22 000 trainees.

As illustrated in figures 7 and 8, funding for apprentices         Institution-based Trade Training Survey and Paper
represented 56 percent of student numbers and 70 percent           In 2011, DFEEST conducted a survey of institution-based
of expenditure, while funding for traineeships represented         trade training learners across the state, and included the
44 percent of student numbers and 30 percent of                    results in an information paper on institutional pathways to
expenditure. In general, apprenticeship training is more           trade qualifications, prepared for the TaSC. The paper is
expensive than traineeship training due to higher                  intended to assist the TaSC to develop a policy position on
infrastructure costs and smaller class sizes.                      institution-based trade training in South Australia.


Supervisor’s Guide
                                                                                 Figure 7: Student numbers
In 2011, DFEEST launched a comprehensive information
package for supervisors of trainees and apprentices. The
package consists of a booklet and DVD designed to support
supervisors in their day-to-day management, and enable
them to work more productively with trainees and
apprentices. The Supervisor’s Guide emphasises the need to
provide pastoral support and mentoring, which research
indicates is vital to the retention of trainees and apprentices,
and their completion of traineeships and apprenticeships.
A copy of the Supervisor’s Guide was sent to approximately
16 500 registered employers, with additional copies sent to
Industry Skills Boards and Australian Apprenticeships                            Figure 8: Funding ($ million)
Centres. The Supervisor’s Guide has also been uploaded
onto the Skills for All website, with hard copies available
from the department on request.


Page 34
OUR PERFORMANCE

Plans for 2012
Harmonisation                                                  Phoenix
In 2011, states and territories agreed, in principle, to the   Phoenix, a web-based system assisting in the management
harmonisation of training laws and administrative processes    of Training Contracts, is expected to be delivered during
for traineeships and apprenticeships by 30 June 2014. The      2012-13. This system enables training providers, employers,
department has commenced work with other jurisdictions         apprentices and trainees to view and manage their own
to complete Stage 1 of the implementation plan by              information online.
30 June 2012. The Commonwealth government has
announced the devolvement of the management of
Australian Apprenticeship Support Services to the states and   Employer Recognition Program
territories in 2014, conditional upon the achievement          In 2012 the department will implement an employer
of harmonisation.                                              recognition program as part of the Skills for All reforms. The
                                                               program will encourage and reward employers with an
                                                               outstanding commitment to training and workforce
Mentoring Apprentices and Trainees                             development, including apprenticeships.
Research indicates that the provision of mentoring and
pastoral care significantly affects the chances of an
apprentice or trainee completing their qualification. DFEEST
will work with industry and employers to develop a range of
mentoring initiatives targeting disadvantaged groups, as
well as apprentices and trainees training in skills
shortage areas.


                                                                                                                     Page 35
UPSKILLING EXISTING WORKERS
Jobs Strategy Projects                                          Environmental Sustainability
As part of its Jobs Strategy, the South Australian              As part of the government’s 100 000 Jobs Strategy,
government, in partnership with the Commonwealth, has           $500 000 has been allocated to sustainable industries
committed to creating 100 000 training places over six          experiencing rapid growth to provide training in part
years from 2010-11, and upskilling existing workers to meet     qualifications for existing workers. This includes $200 000
changing workforce needs is a key part of that strategy.        for Grid Connect training for solar panel installations with
                                                                over 185 electricians undertaking the training. A sum of
New industries and emerging skill demand sectors have
                                                                $150 000 will assist Suzlon Energy Australia to devise wind
driven the allocation of the additional training places to
                                                                turbine maintenance training to support their current
ensure that South Australia has the right education and
                                                                workforce and $150 000 has been allocated to the Berri
training system.
                                                                Barmera Council to train staff in the installation of a
The department has funded a total of 14 specific projects       subsurface irrigation system across 52 hectares of council
supporting 1018 people to gain training in a variety of         parks and gardens.
industry sectors.

Productivity Places Program for Existing Workers
                                                                Plans for 2012
The PPP is a Commonwealth government initiative to
                                                                Skills in the Workplace is Skills for All’s approach to tailored
deliver $156 million of training for existing workers and job
                                                                training and workforce development responses for
seekers in areas of high skills demand.
                                                                industry. Skills shortages in key industry sectors and
In 2011, DFEEST allocated around $44.8 million of PPP           companies in the supply chains for critical projects and
funding toward almost 12 500 existing worker                    infrastructure investments will be targeted with training
qualifications. Furthermore, from 1 July 2011 an additional     subsidies, with small to medium-sized enterprises a
$4.2 million of PPP funding supported additional User           particular focus. Depending on the size of their workforce,
Choice existing worker traineeship positions under              businesses will be eligible for up to 90 percent of their
Contracts of Training. These PPP-funded trainees are            training costs towards qualifications, and skill sets, at
undertaking higher level qualifications (Certificate IV and     Certificate IV and above to support their employees. Both
above) where User Choice funding would not otherwise            complete qualifications and tailored combinations of units
be available.                                                   of competency will be funded. Program design and early
                                                                implementation was completed by the end of
Industry Partnership Program                                    December 2011.

The Industry Partnership Program concluded as an
individual program in July 2011; however it has been
absorbed into the Skills in the Workplace program.
The program worked closely with industry sectors to
develop a workforce that has the right skills, in the right
place and at the right time by creating employment and
training opportunities that are industry-led and
demand-driven.                                                                    Skills in the Workplace
Projects developed under the Industry Partnership Program                         will fund training
brokered and managed workforce development programs                               critically required by
that recruited, inducted, trained and retained                                    industry for more than
underemployed and/or unemployed people in
South Australia.
                                                                                  2000 SA workers.
Successful proposals, demonstrating matched funding from
industry, were funded on a contractual basis.


Page 36
OUR PERFORMANCE

ASSISTANCE FOR RETRENCHED WORKERS
DFEEST supported 194 workers through the Retrenched              As at 30 November 2011:
Workers Program who were retrenched from Bridgestone                -    163 workers had registered to access services
and Kimberly-Clark Australia during 2011.                           -   103 accessed or are accessing training support
DFEEST is managing the Labour Market Adjustment
                                                                    -   32 workers who accessed training achieved full
program, utilising expertise in the Limestone Coast Career
                                                                        AQF qualifications
Development Centre and the National Industry Skills
Council, Forestworks.                                               -   60 individuals gained employment.
Services include:
   -    skill recognition and career planning
   -   job search assistance
   -   referral for skills and vocational training, as well as
       licences and tickets which are fully funded under
       the program
   -   employment brokerage.


                                                                                                                     Page 37
TAFE SA - INDUSTRY PARTNERSHIPS
TAFE SA acknowledges the important contribution industry          In 2011, TAFE SA also developed and maintained
has in assisting TAFE SA to construct and deliver VET that is     relationships with:
current and relevant, to develop and maintain a highly               -    Woolworths and Service Skills SA, with the first ten
skilled workforce. Our partnerships with employers are                    Diploma of Retail Management PPP
essential to our success.                                                 participants graduating
                                                                     -    the Adelaide Health Service Registered Training
OneSteel Whyalla Steelworks                                               Organisation and the Department of Health, for the
                                                                          upskilling of weekly paid workers in the Certificate III
Over many years TAFE SA has developed a close strategic                   and IV qualifications in health
relationship with the OneSteel Whyalla Steelworks. This
partnership has produced many industry-leading VET                   -    the Repatriation General Hospital, Flinders Medical
programs and helped to develop OneSteel’s workforce. The                  Centre and the Calvary Health Care Group, with
‘Critical Safety Training Centre’, located at Whyalla, is a               successful Productivity Places Program existing
formal partnership with OneSteel who train all of their staff             worker funding for the Certificate III, IV, Diploma
in the facility using joint resources and staff. Another                  and Advanced Diploma.
partnership initiative with OneSteel is the development of a
‘Technician Certificate’, a tailored trade certificate not only
providing a customised solution, but supporting the               Regional Development
government’s national agenda for higher level qualifications.     The delivery of the innovative Smart E-Skills program used
                                                                  existing relationships with Regional Development Australia
                                                                  (RDA) board across the state and built further relationships
South Australian Wine Industry
                                                                  with organisations such as Women in Business and
The South Australian wine industry is a major contributor to      Regional Development in the South East of the state. The
the state’s economy in export and tourism earnings.               program was jointly marketed and provided opportunities
TAFE SA has worked in close partnership with the industry         for small to medium-sized enterprises across all industry
over many years, developing a noteworthy client list              sectors to develop skills in the use of the internet. The
including: Yalumba, Constellation Wines, Pernod Ricard,           program was delivered through face-to-face workshops,
Treasury Wine Estates, Peter Lehmann Wines, Vinpac                one-to-one mentoring, and follow-up online services. Smart-
International and Angove Family Winemakers; 95 percent of         E-Skills was enthusiastically received by participants, resulting
students enrolled in Certificate III or higher wine-related       in the delivery of the program to 1174 enterprises across
qualifications are working within the industry. Training          the state.
programs are customised to meet industry requirements
and currently 39 percent of training is delivered within
the workplace.                                                    Arts
                                                                  The TAFE SA Adelaide College of the Arts (AC Arts) has an
                                                                  active industry board which represents the arts sector.
Industry Reference Groups
                                                                  Members, appointed by the Minister and Chair, participate
TAFE SA established industry reference groups regionally to       in industry reference panels based on their respective areas
provide direct advice on industry skill needs (current and        of knowledge. During 2011, AC Arts fostered new
emerging) and the relevance and currency of training and          partnership arrangements with the Australian Dance
assessment processes. These groups include representatives        Theatre, the State Theatre Company, Country Arts SA and
from industry peak bodies, private registered training            the Hill Smith Gallery. One key outcome was the
organisations, Job Services Australia providers, not-for-profit   opportunity for TAFE SA students to partner with the
organisations and small to medium-sized enterprises. Advice       Australian Dance Theatre for the performance
from these groups provides valuable business intelligence         of ‘Worldhood’.
that enhances existing quality assurance strategies and
ensures informed decision-making processes.


Page 38
OUR PERFORMANCE

Engineering and Automotive Industries                             Hair and Beauty
TAFE SA collaborated with Clipsal to produce a progressive        The Limestone Coast Hair and Beauty Competition,
electrical engineering program, teaching its apprentices to       organised by TAFE SA and in its 18th year, is another
use the latest C-Bus Technology. C-Bus is Australia’s market-     example of long-standing and successful industry
leading energy management system for industrial projects          engagement. Each year the competition grows in
and residential homes. The TAFE SA School of Electrical           participation and audience, attracting an average of 100
Engineering Certificate III curriculum included a C-Bus           competitors and an audience of 800. The cost of staging the
course for the first time, with the program completed by 56       event is fully covered by sponsors and entrance fees, and
apprentices as an elective unit of competency as part of the      any profit is used to support students to attend the National
students’ off-the-job training.                                   Hair and Beauty Expos.
TAFE SA Automotive training introduced the latest                 Over 20 TAFE SA Hair and Beauty lecturers and students
technology and state-of-the-art equipment thanks to Toyota        from metropolitan and regional campuses worked
Motor Corporation Australia and Kawasaki Australia, who           backstage, creating the hair and make-up looks for five of
generously donated vehicles to the value of over $100 000.        the Adelaide Fashion Festival parades. During the festival,
Two top-of-the-range vehicles, a Land Cruiser Prado Kakadu        the TAFE SA Fashion program also presented three parades.
and the popular Toyota Corolla Ascent, will give Certificate II   Sponsored by Attitude Magazine, the parades showcased
to Diploma in Automotive Retail Services and Repair               the final year Advanced Diploma of Fashion Design and
students access to new electrical engine technology and           Technology students’ graduation collection.
electronic aids. A Kawasaki ER60 motorcycle that uses the
latest fuel-injected engine management system, ABS braking
system and cassette-type transmission was also donated.


Defence
TAFE SA welcomed new families of the Australian Defence
Force to South Australia at the Defence Community
Organisation Welcome Expo, as part of a major relocation
of the 7RAR Battalion from Darwin to Adelaide. The expo
attracted over 1000 Australian Defence Force members and
their families.
Over the past two years, TAFE SA has worked with the
Australian Submarine Corporation and Air Warfare
Destroyer Alliance to establish a pre-employment welder
evaluation program. The innovative program was
developed to identify specific skill gaps in students, and then
conducted targeted training to equip welders with the skills
needed to gain employment in the defence industry.


Design
During December 2011, TAFE SA Visual Merchandising staff
and students spent a week at Myer City to assist in the set-up
of Christmas displays within the store. This exercise involved
not only installing the décor, but also creating
merchandising gift stories throughout a range of
departments. The store was later judged the ‘best presented             Celebrity hairdresser and make-up artist
Myer store nationally’.                                                 Dale Dorning led TAFE SA’s Hair and
                                                                        Beauty session styling team at the 2011
                                                                        Adelaide Fashion Festival.


                                                                                                                      Page 39
3.3 Providing Opportunities for All
DFEEST Strategic Plan Goal 3


SOUTH AUSTRALIA WORKS
South Australia Works - Working Regions Program engaged         Plans for 2012
and supported people who faced barriers to learning,
                                                                During the 2011-12 financial year, DFEEST will invest
training and work by delivering flexible and responsive
                                                                $6.4 million to implement South Australia Works Action
initiatives tailored to the specific needs of individuals,
                                                                Plans across the whole of the state. Over 10 200 people will
communities, regions, industries and employers.
                                                                participate in SA Works regional projects. Of these, over
Career development services provided through the                5650 will participate in employment programs with over
department’s regional program supported and assisted            2940 gaining a job, and 4550 will progress along pathways
individuals to make informed choices about education,           to employment, including learning, training and skills
training and work, and facilitated planned pathways and         development. Projects will provide opportunities for people
successful transitions to learning and work.                    to access training and a combination of case management,
In 2010-11, DFEEST, through regional projects, provided         mentoring and post-employment support while gaining
over 7600 learning, skills development training and work        valuable work experience, and benefitting from employers’
opportunities to people facing difficulty entering the          commitments to provide jobs.
workforce, with over 3800 people gaining employment.
Regional strategic planning, strengthened by the
development of evidence-based three-year Strategic Plans,
provided a robust response to the labour force needs of
local labour markets. Over 800 people, including
representatives from industry, communities and
government, attended stakeholder forums to identify priority
areas which increased participation in learning, training
and work.
In addition, DFEEST, in conjunction with Commonwealth
Department of Education, Employment and Workplace
Relations (DEEWR), facilitated a Regions Forum attended by
over 120 regional partners and stakeholders to align
Commonwealth, state and local/regional efforts on training
and workforce participation.
DFEEST’s regional coordinators worked with the South
Australia Works networks to respond to each region’s
unique learning, training and employment challenges. The
networks bring together the three tiers of government,
employers, industry, education and training providers, the
non-government sector and community organisations,
enabling decision-making in local communities.
The establishment of six Career Development Practitioner
networks in the Barossa, Limestone Coast, Kangaroo Island,
Riverland, Northern and Southern Adelaide has enhanced
the existing 17 regional career development services. The
services support and complement the locally tailored
participation projects delivered in state government regions.


Page 40
OUR PERFORMANCE


ABORIGINAL TRAINING AND EMPLOYMENT
DFEEST’s Aboriginal employment programs build the             Aboriginal Access Centre
capacity of employers to increase and sustain the             Through the Aboriginal Access Centre, TAFE SA provided
employment of Aboriginal people, and build the capacity of    Aboriginal people with access to VET and supported
Aboriginal people to gain and sustain employment. This        students from unemployment to VET to employment.
activity responds to the COAG and SASP targets which aim      The Aboriginal Access Centre, in partnership with mining
to halve the gap in employment outcomes between               company OZ Minerals (Prominent Hill), has successfully
Aboriginal and non-Aboriginal people by 2018.                 developed and delivered numerous customised Aboriginal
The unemployment rate for Aboriginal people in South          pre-employment training programs. These programs have
Australia was 26.6 percent in 2010, compared to the           produced 51 mining graduates, 40 of whom are now
unemployment rate for non-Aboriginal people of                locally employed by OZ Minerals. In recognition of these
5.2 percent. (see figure 9).                                  achievements, OZ Minerals was recently presented with the
                                                              2011 South Australia Premier’s Social Inclusion in Mining
DFEEST Aboriginal participation brokers have a visible        and Energy Award for Excellence in Community Programs.
presence on the ground in regions and local communities
that have high numbers of Aboriginal people who are           TAFE SA has also partnered with ETSA Utilities and the
disengaged from and not participating in learning, training   Aboriginal Access Centre to develop an industry-specific
or work. The brokers facilitated strategic and operational    training facility at Port Augusta. The ETSA Training Facility
solutions to local training and employment needs, in          was created to provide training for ETSA powerline worker
particular, to prepare Aboriginal people for local jobs       apprentices and is aimed at increasing base-level training for
identified by employers. Under the Workforce Participation    Aboriginal and non-Aboriginal people in the region, and
in Government Construction Procurement Policy, ‘up to         more specifically to increase opportunities for those students
2 percent’ of the total labour hours were allocated to        to be employed by ETSA Utilities.
Aboriginal people on government construction projects.
                                                              Aboriginal Apprenticeship Mentoring
                                                              The Aboriginal Apprenticeship Mentoring program worked
                                                              with private providers, Group Training Organisations, Job
                                                              Network Providers, employment service providers and RTOs
                                                              to identify and place Aboriginal participants into
                                                              employment. Twelve apprentices, 25 trainees, and 11
                                                              school-based participants have been placed to date.


                         Figure 9: Unemployment rates for Aboriginal and non-Aboriginal South Aus-
                         tralians


                                                                                                                   Page 41
Aboriginal Employers Industry Champions Network                 Learning and Employment Outcomes
DFEEST, in partnership with the Commonwealth                    DFEEST improved learning and employment outcomes for
government, engaged with industry to support Aboriginal         2409 Aboriginal people by providing support, job training,
employment and training, with the key objective to develop      work placements, recruitment leadership training, career
and support an industry-led strategy.                           enhancement, traineeships and apprenticeships. Of the
Twenty-six senior business leaders across the state             2409 Aboriginal people who participated in DFEEST work
participated in the Aboriginal Employers Industry               programs, 1218 gained employment.
Champions Network (AEICN), which promotes and                   In 2011, there were 4953 Aboriginal VET students in South
supports this work. The Minister for Employment, Higher         Australia, 3.5 percent of total VET students. This was higher
Education and Skills sponsors this group, which includes        than the population share of 1.7 percent and represented a
prominent business and community leaders.                       significant increase in participation of almost 20 percent
Industry clusters, established by the AEICN in 2010, in the     since 2003.
areas of Retail, Advanced Manufacturing, Community              Four percent of all participants in PPP were Aboriginal and/
Services, Hospitality, Professional Services, Sports and        or Torres Strait Islander people. As at June 2011, six percent
Recreation, and Energy and Water have attracted                 of all PPP Job Seeker enrolments have been Aboriginal
$1.8 million in Commonwealth and state funding.                 participants as well as three percent of PPP Existing
The industry clusters have built the capacity of employers      Worker enrolments.
and industry to increase and sustain the employment of
Aboriginal people. Connecting Aboriginal People to Mining       Plans for 2012
(CAPM) is another example of the collaborative approach
taken with industry. In 2010-11, CAPM assisted 41               DFEEST will continue to deliver programs, services and
Aboriginal people to gain employment at OZ Minerals, Iluka,     support to Aboriginal people, with a greater focus on
BHP Billiton and with contractors supporting the                pathways to learning, training and workforce participation.
mining sector.                                                  Over 1310 Aboriginal people will participate in employment
                                                                programs, with 856 to gain a job, and a further 1300 will
                                                                participate in learning, training and skill development
National Partnership Agreement on Remote Indigenous             programs. Through the PPP, 2.5 percent of participants will
Public Internet Access                                          be Aboriginal and/or Torres Strait Islanders.
Through the Commonwealth of Australian Governments              To achieve the SASP target, an additional 520 Aboriginal
(COAG) National Partnership Agreement on Remote                 people will need to gain and sustain employment every year
Indigenous Public Internet Access (2009-2013), Indigenous       in the South Australian workforce, and a further 250 will
people in two remote communities, Oodnadatta and                need to undertake training (2008-2018).
Marree, have been provided with improved community
based telecommunications, internet access, and training in
computer and internet use. Services in Yalata, Amata and
Mimili in the Anangu Pitjantjatjara Yankunytjatjara (APY)
Lands will be in place by April 2012.


Pika-Wiya Learning Centre
In the area of Aboriginal health, TAFE SA has worked for
many years in collaboration with various communities and
groups. A particularly strong partnership has been with
Pika-Wiya Learning Centre at Port Augusta, a service which
provides learning opportunities and support for Aboriginal
people to develop employment in the health industry.


Tauondi Aboriginal College
The Tauondi Aboriginal College, an independent, Aboriginal
owned and operated organisation, funded by DFEEST,
provided 752 Aboriginal people with accredited or non-
accredited training and played a significant role in building
the confidence, capacity and capability of the state’s
Aboriginal community.


Page 42
OUR PERFORMANCE

BUILDING FAMILY OPPORTUNITIES PROGRAM                           ABILITIES FOR ALL
The Building Family Opportunities program, a four-year          Abilities for All, a partnership program with Bedford
social inclusion ‘demonstration program’ (2010-2014)            Industries and community centres, targets participants with
funded through the Department of the Premier and                a disability who are disconnected from their communities,
Cabinet, breaks the cycle of long-term family joblessness and   have multiple barriers to learning and employment, have
demonstrates that intensive case management can result in       low literacy and numeracy skills and need assistance to
education, training and employment outcomes for                 achieve their true potential.
disadvantaged families.                                         Participants were provided with a combination of
A range of government and non-government agencies               accredited and non-accredited training, work experience
refer families to the program. Intensive case management is     and on-the-job training; high and complex needs were
provided to families with complex needs in three local          addressed through wrap-around services and support.
government areas by three non-government organisations:         Welfare dependent, hard-to-reach learners were engaged
UnitingCare Wesley in Port Adelaide Enfield, Centacare          on a pathway to training and employment. Participants,
Catholic Family Services in Playford and UnitingCare Wesley     ranging from 18 to 65 years, had a physical, intellectual or a
in Port Augusta.                                                psychiatric disability, limited schooling, specific learning
The program brought together long-term jobless families,        difficulties including low literacy and numeracy levels, and
local community organisations, government and employers         lacked the confidence and life management skills to
and found solutions to complex issues that prevent families     participate in mainstream training activities.
from participating in employment.                               In 2010-11, 217 people with a disability participated in the
The program has attracted an additional $1.5 million from       program, 75 gained employment and 203 completed a
the Commonwealth government’s Family Centred                    Certificate II in Business or Community Services.
Employment Project (FCEP) and will assist an additional
65 families living in the western region over three
years (2010-2013).                                              Plans for 2012
In the first 18 months, the program has improved the lives      The Abilities for All program will provide 160 people with
of over 330 highly complex jobless families, which consisted    disability a combination of accredited training, learner
of over 1000 individual family members, including children      support and work experience, with 70 participants to gain a
and dependents; the majority of these were single parent        job.
families. 112 families identified as Aboriginal, comprising
77 percent of families in Port Adelaide Enfield, 57.5 percent   An e-learning trial through community centres located in
of families in Port Augusta and 34 percent of families          Port Pirie, Port Augusta and Berri will enable 15 participants
in Playford.                                                    to access electronic training packages and complete a
                                                                Certificate II in Business or Community Services.
An across-government Senior Coordination Group, with
representation from state government and the
Commonwealth government will continue to address
systemic issues, with Local Coordination Groups ensuring
that issues specific to disadvantaged families in the local
community are addressed throughout the duration of
the program.


Plans for 2012
The target of working with 400 families during 2010-2014
increased to 465 families when the Commonwealth
government invested $1.5 million FCEP funding to expand
the program at Port Adelaide. A minimum of 40 percent will
be single parent families, 30 percent will be couple parent
families and 30 percent will be Aboriginal families.


                                                                                                                      Page 43
ADULT COMMUNITY EDUCATION
ACE is the community learning gateway for people wanting          Plans for 2012
to participate in learning and further training and who face      The ACE program will continue to provide an important
social and economic barriers to formal participation. ACE         outreach pathway for attracting and re-engaging people
provided learning programs in a supportive community              who are disengaged/disadvantaged because of low levels
setting, and delivered accredited training and non-               of literacy and numeracy skills, and not ready or able to
accredited learning programs for working-age adults               participate in institutional learning.
(17 years and over) through not-for-profit
community-based organisations.                                    There will be 14 290 people participating in ACE programs,
                                                                  including 2200 people in foundation skills programs, funded
The ACE program funded training that promoted                     through the Jobs Strategy.
foundational skills development and increased literacy and
numeracy skills. All delivery through ACE had a vocational        The ACE sector will be further strengthened as a fourth
intent with increased focus on articulated pathways into          sector of education, and will build on the ability of the sector
VET. A comprehensive approach to digital literacy                 to engage marginalised population groups, and enable
foundation skills addressed the barriers to online                more training to be delivered to more people experiencing
participation through the community.                              barriers to participation in their local community. This will
                                                                  include development of a new curriculum used for the
In 2010-11, 11 470 people participated in 93 ACE projects.        delivery of non-accredited and accredited training through
Funding allocated through a competitive grants process            the ACE sector, and supporting the professional
supported accredited courses, non-accredited learning and         development of ACE providers, particularly through training
workforce development delivered by not-for-profit                 in Certificate IV in Language, Literacy and Numeracy
community-based education and training providers.                 Assessment and Certificate IV in Training and Assessment.
ACE program funding supported:
  -   Multi-Literacies projects, which focused on a range
      of key literacies (e.g. prose literacy, finance literacy,
      computer literacy)                                          SKILLING JOB SEEKERS THROUGH THE PRODUCTIVITY
   -    Foundation Skills projects, which delivered               PLACES PROGRAM
        accredited training that addressed barriers to            As mentioned previously, the PPP delivers training for
        successful participation by individuals in formal         existing workers and job seekers in areas of high skill
        education, training and work                              demand.
   -    Transitions projects, which featured partnerships         The 2011 Job Seeker round was allocated in December
        between community organisations and TAFE SA               2010, with $13.85 million allocated to fund over 4500
        that assisted adults to make successful transitions       qualifications. To date 81 percent of students have enrolled
        from non-formal to formal learning and                    and 35 percent of students have obtained a
        achievement of a post-school qualification                final qualification.
   -    Workforce Development projects, which increased
        the capacity of the ACE sector to deliver training
        through professional development.

At least $6.4 million 2010 Jobs Strategy funding, invested
over the six years, will increase the delivery of foundation
skills and the development of stronger pathways between
ACE and the VET system.
The Remote Indigenous Public Internet Access Project in
Oodnadatta expanded opportunities for remotely located
Aboriginal communities to participate in the digital
economy. The project provided free public computer and
internet access and a training program.


Page 44
OUR PERFORMANCE

TAFE SA - LEARNING PATHWAYS                                     under a VET in Schools Agreement in partnership with
                                                                industry, and schools purchasing directly from TAFE SA.
Learning pathways are an important part of ensuring
individuals have the assistance to help them succeed in their   In November 2010, the Commonwealth government
chosen field. TAFE SA has numerous partnerships in place        allocated funding to construct a purpose-built training
with schools and universities to provide direction and to       facility at Umuwa on the APY Lands. The facility, due for
maximise opportunities for students.                            completion in 2012, will be used by eight schools with
                                                                students receiving training in weekly blocks. During 2011,
TAFE SA aims to maximise educational outcomes for all           consultative and collaborative negotiation was ongoing
learners and particularly for those who need additional         between TAFE SA, DECD (the lead agency on the project)
support to succeed in education and training. A significant     and the Anangu schools to further develop the range and
amount of activity occurred during 2011 to assist learners to   depth of VET on the APY Lands in readiness for the Trade
achieve their potential.                                        Training Centre. In 2011, TAFE SA provided training for APY
TAFE SA Information and Student Services provides ongoing       Lands school-based staff with 12 completing the
information, support and career counselling to the school       Certificate IV in Training and Assessment, further enhancing
sector through a number of presentations held each year         the delivery of VET pathway offerings.
including Career Expo’s, Open Days and one-to-one career        In 2011, TAFE SA purchased, through a Commonwealth
guidance. TAFE SA continually promote pathways between          government grant worth $745 000, a new range of mobile
the education sectors and actively engage with higher           mining equipment to equip TAFE SA with up-to-date
education to create and facilitate pathways for exiting TAFE    training tools for the mining and civil industries. The multi-
SA students to ensure they take advantage of the                purpose equipment included a Skid-Steer, Front-End Loader,
articulation and credit arrangements with the                   Forklift and Back-Hoe made fully mobile with a truck. The
university sector.                                              equipment can be transported around the state to train
The annual TAFE SA Open Day, held in August, provided           wherever demand is. Collaborating with regional schools,
prospective students with the opportunity to obtain             the mining equipment is able to be used by eligible school
information on courses and speak with lecturers. This year      students at Trade Training Centres.
the Open Day coincided with Tertiary Week, with the three       TAFE SA also had a long-term partnership with the Young
South Australian universities also conducting open              Men’s Christian Association (YMCA) and in 2011 they invited
day activities.                                                 TAFE SA Workplace Education Services to help deliver the
In Semester 2, 2011, a range of VET Tasters was purchased       first accredited training component of the South Australian
by the Department of Education and Child Development            Youth Parliament Program since the first program was held
(DECD) with funding received from the Commonwealth              in the Legislative Council in 1995. Participants gained
Department of Education, Employment and Workplace               valuable TAFE SA training in public speaking, Bill
Relations (DEEWR) Partnership Broker Eyre Futures.              development and parliamentary process and etiquette. The
TAFE SA, in using a mix of face-to-face and online              accredited training in two units of competency ‘Work
methodology, was able to offer training in Conservation         Effectively with Others’ and ‘Communicate in the
and Land Management, and Community Services and                 Workplace’ enabled participants to complete SACE
Health. Negotiations are still underway to provide training     components. TAFE SA received excellent feedback from
for some school-based trainers.                                 YMCA for its responsiveness and flexibility within a very tight
                                                                timeline to participate in the program.
The Riverland Trade Training Centre, which opened on 17
November 2011, was conceived by a consortium of the             Learner Support Services (LSS), being trialled by TAFE SA
four Riverland schools: Glossop, Waikerie, Renmark and          lecturers as part of Skills for All, aims to address students in
Loxton. The consortium chose TAFE SA as a partner and           vocational programs who are at risk of non-completion and
allocated $4 million to the acquisition of new equipment        who are experiencing significant barriers that impact on
and refurbishment of the existing Manufacturing,                their learning. The service provides students with the
Engineering and Transport workshop at Berri. The funds will     necessary support to be successful in their studies and links
enable the delivery of full Certificate III qualifications in   them with relevant agencies (where necessary) to address
Engineering, Electrical and Automotive trades, enabling         personal issues that may be providing a barrier to learning.
apprentices to complete their trades locally. The ultimate      These services may include an assessment of requirements,
result: a smoother transition from school to school-based       personal support, advocacy within and external to TAFE SA,
apprenticeship to full apprenticeship without any travel        learning case management, study skills support, career
costs to the city for training.                                 planning/guidance, work placements and
                                                                transition support.
Schools across the APY Lands have embraced the
opportunity to access and incorporate VET in their
curriculum offerings. VET is offered in a range of ways on
the APY Lands including: delivery by the school under a VET
in Schools Agreement arrangement with TAFE SA, offered


                                                                                                                       Page 45
TAFE SA has also implemented a cutting-edge Applied                 Blokes-On-The-Block – Playford Alive Program
Learning Model as a collaborative approach between                  This 13-week program targeted at long-term unemployed
program lecturers and Language, Literacy and Numeracy               men is designed to focus on the developmental needs of
lecturers. The model provides targeted language, literacy           the individuals. Participants designed, planned and created
and numeracy services to students with specific learning            a sustainable garden in the front yard of a Housing SA
needs. This model has meant that often two lecturers are            property in the Playford Alive development. This initiative
working with a group of students simultaneously, providing          served as a tool for engaging the local community to learn
students with technical training expertise as well as practice      about sustainable gardening practices for potential
and positive learning support. Success of the model is              implementation in their own residences. Literacy and
evidenced by an increase in completion rates.                       numeracy support for all participants was provided by
TAFE SA is working closely with a number of key                     TAFE SA and specialist lecturers were brought in for the
stakeholders in the northern Adelaide region, including the         gardening and landscaping components.
City of Playford, the Land Management Corporation, the
Northern Connections Office and DFEEST, through South               Indigenous Horse Skill Training
Australia Works in the Regions, to look at training
opportunities for targeted groups in a number of areas.             This pilot program offered by TAFE SA’s Horse Skill Centre, in
These target groups include young people who are out of             partnership with the RDA Murraylands and Riverland Board,
school and not participating in learning, training and              Aboriginal Access Centre and the Murray Bridge Racing
employment; mature aged people; Aboriginal people;                  Club, delivered successful outcomes with all students
people with a disability; women; migrants and refugees.             completing their Certificate I in Racing. Participants were
                                                                    provided with pastoral care mentors, along with practical
                                                                    components delivered at the Murray Bridge Racing Club.
Woolworth’s Pre-employment Program
Woolworths contracted DFEEST and TAFE SA to establish a
pre-employment program for new supermarkets opened in
the northern suburbs. This program commenced in May
2011 with 40 participants and an expected 20 employment
opportunities. The program is also supported by DEEWR
and is an excellent example of local networks collaborating
to provide a positive outcome for the community.


Powerful Pathways for Women
Established to provide female job seekers from the northern
Adelaide region with opportunities to gain a suite of
qualifications, this program offered a potential pathway to
employment through the 2011 ETSA apprenticeship intake.
Further educational pathways were also planned as a key
target for the program. Participants undertook the
Certificate I in Electro-technology, Certificate I in Information
Technology and Certificate II in Women’s Education.


Page 46
OUR PERFORMANCE

TAFE SA also developed and maintained relationships with:        During 2011, a number of initiatives were implemented to
                                                                 provide support for students with disabilities, including:
   -    Interwork Ltd, Woolworths, South Australia Works,
        Northern Futures and the Wyatt Benevolent                   -    an AC Arts Dance lecturer was placed with the
        Institution to deliver a retail pre-employment                   Restless Dance Company. This lecturer
        program targeted at people with disabilities in                  choreographed a series of performances
        northern Adelaide                                                accompanied by several Bachelor of Performing
                                                                         Arts dance students; one of the performances held
   -    The Migrant Resource Centre, with 35 PPP
                                                                         was nominated to tour Papua New Guinea in 2012
        participants completing the Certificate II in Retail
                                                                    -    a film and television lecturer delivered the
   -    The Adelaide Women’s Prison with 10 PPP
                                                                         Certificate II in Media to two highly successful
        participants completing the Certificate II in Retail
                                                                         disabled students
   -    The Lyell McEwin Health Service by membership of
                                                                    -    an AC Arts Acting lecturer provided work
        the Aboriginal Cadetship Reference Group; with
                                                                         placement opportunities for disabled persons
        the first Indigenous student from this program
                                                                         wanting to observe acting voice and speech classes
        graduating in September 2011.
                                                                         and rehearsal sessions.
TAFE SA Community Services and Health had a partnership
                                                                 A further example of improving access and equity outcomes
with the Reynella Neighbourhood Centre to deliver the
                                                                 is a program to train Aboriginal nurses on the Eyre
Certificate III Community Services Work for 15 volunteers at
                                                                 Peninsula. This project, a partnership between TAFE SA, the
the centre. The delivery was a partnership of TAFE SA
                                                                 Aboriginal Access Centre, state and Commonwealth
lecturers and centre staff, qualified as assessors. All
                                                                 governments, the Regional Health Services and job service
volunteers completed their qualification with several
                                                                 providers, not only increases the number of Aboriginal
transitioning to continue their studies in Certificate IV
                                                                 health professionals within the community, but also
Community Services and some gaining entry to university to
                                                                 provides invaluable role models to assist in improving the
study social work.
                                                                 overall health of Aboriginal people in the region.
TAFE SA Community Services and Health also had an
                                                                 TAFE SA has provided English language services to migrants
Auspice Agreement with the Hackham West Community
                                                                 under the Adult Migrant English Program with the
Centre to deliver the Certificate III Children’s Services for
                                                                 Commonwealth Department of Immigration and Citizenship
15 volunteers at the crèche at the centre. Course delivery
                                                                 (DIC) since 2003. In July 2011, TAFE SA was advised they
was a partnership of TAFE SA lecturers and centre staff,
                                                                 were successful in being the only provider to offer this
qualified as assessors. All volunteers have completed
                                                                 training for migrants under a new contract until 2014.
their qualification.
                                                                 TAFE SA partnered with ZeroWaste SA to develop a
TAFE SA has delivered ‘Apply First Aid’ to students learning
                                                                 teaching resource for non-English speaking people called
English as a Second Language since 2004 and now has a
                                                                 ‘Recycle Right’. An increased number of residents have
partnership with the Australian Red Cross to deliver the
                                                                 come from countries where recycling simply does not exist
training, through gaining accreditation for some lecturing
                                                                 or where they may not have bins. Recycle Right helps to
staff as Red Cross trainers. More than 500 students from
                                                                 improve householders’ knowledge of what can and cannot
many nationalities have gained a certificate in First Aid. The
                                                                 be placed into the kerbside recycling and green organics
course has provided pathways to employment and further
                                                                 bins and the correct preparation of items before they are
study as well as enabling students to assist their ethnic
                                                                 placed in the recycling bin. TAFE SA was involved in piloting
communities and ensure the safety of their families.
                                                                 the materials with nine classes of students learning English
                                                                 as a second language.
During 2011, the TAFE SA Apprentice Kickstart
Pre-Apprenticeship project saw 75 disadvantaged people
                                                                 TAFE SA and the Australian Football League (AFL) charity
work towards a mechanical and engineering
                                                                 organisation, Ladder, are collaborating to provide training in
trade apprenticeship.
                                                                 cookery and hospitality to formerly homeless youths, which
                                                                 will enable them to source employment opportunities in the
AC Arts supported and encouraged TAFE SA Arts lecturers
                                                                 industry. Participants undertake training at TAFE SA in
to broaden their connection with the disability community.
                                                                 hospitality and basic cookery and also gain work placements
                                                                 at Adelaide’s leading hotels and restaurants. Students
                                                                 receive mentoring from past and present AFL players and
                                                                 elite female athletes as part of the program. The students
                                                                 will gain training in the Certificate II in Hospitality and basic
                                                                 cookery level, which links into the skill shortages in the
                                                                 hospitality industry in kitchen and food services areas.


                                                                                                                        Page 47
TAFE SA 2010 Statistics 1


                     Figure 9: TAFE SA Students by Major Course Field of Education


          1
              Please note that 2011 data had not yet been finalised at time of the report being prepared


Page 48
OUR PERFORMANCE


Figure 10:TAFE SA Students by Age Group


Figure 11: TAFE SA Students by Australian Qualifications Framework Level


                                                                           Page 49
3.4 Building World-Class Infrastructure
DFEEST Strategic Plan Goals 4 and 6


The vocational training needs of South Australians are        The development will also see the Business Services and
changing over time as a result of changes in the economy      Health and Community Services programs (at both the
and community. Accordingly, there is a need for changes       Panorama and Adelaide City campuses in 2011)
to TAFE SA program delivery to ensure that training           consolidate at the Adelaide City campus in the heart of the
demand is matched with supply.                                central business district, ultimately creating a centre for
                                                              excellence in Business Services. In addition to improved
There are also changes to the VET system underway with        accessibility, students who currently study business at the
Skills for All that will mean that more funds will be made    ageing and inefficient Panorama campus will reap the
contestable with an increased level of competition for        benefits of studying in a modern facility that will enhance
publicly funded training.                                     their learning experience. The contemporary design of the
                                                              new learning spaces at the Adelaide City campus will
Consequently, the department, together with TAFE SA,          provide student facilities that are modern, comfortable and
must adapt and respond to these changes, which require        incorporate the latest technology.
program consolidation and infrastructure development.
                                                              International Student Services, who currently do not have a
To ensure that the state’s training infrastructure is up to   presence on the ground floor, will be relocated in a
date, since 2008 the South Australian government (in          refurbished area that meets the specific needs of the
combination with Commonwealth funds) has made the             workgroup in an easily accessible location.
single biggest investment ever in TAFE SA, committing
more than $200 million to upgrades and new facilities.

The focus for these infrastructure investments is to ensure   RIVERLAND TRADE TRAINING CENTRE
TAFE SA can meet changing demand and compete in the           The Berri TAFE SA campus recently opened its Trade
new vocational training system, including:                    Training Centre. This is part of the Riverland Trade Training
   -   developing centres of excellence for specific          Centre, a consortium of the four Riverland Schools,
       industries to include access to the most up-to-date    Waikerie, Renmark, Loxton and Glossop, in partnership
       equipment and industry specialists all in the one      with TAFE SA.
       location. Examples include industries such as
       Building at Tonsley Park and Hospitality at Regency    The upgrade of the TAFE SA Berri Campus workshop will
                                                              give full apprenticeship opportunities in Automotive,
   -   improving local and regional campuses to provide       Fitting/Machining, Fabrication Welding and Electrical, all
       ready access for students and to provide a focus       now offered locally reducing the need to travel to Adelaide
       for training and advice for the community. This        for training. A state-of-the-art renewable energy centre,
       includes having the information and resources          with solar and wind power training, is also a feature.
       necessary to assist new and continuing students
       as well as acting as assessment and referral           The facilities will herald a new era in cooperation between
       centres.                                               the four Riverland High Schools, TAFE SA Regional and
                                                              other training providers that promises to bring
                                                              considerable benefits to school students and local industry
                                                              in the Riverland.
ADELAIDE CITY
An example is the new development at the Adelaide City
campus in existing under-utilised space that offers a
‘shop front’ service to students. This incorporated the
creation of a new Client Services area providing a
shopfront at the Currie Street entrance for current and
prospective students to obtain career path and course
information, vocational preparation, and recognition of
prior learning advice as well as being able to enrol in
TAFE SA.


Page 50
OUR PERFORMANCE

INDUSTRY AND INDIGENOUS SKILLS CENTRE PROGRAM                   SUSTAINABLE INDUSTRIES EDUCATION CENTRE (SIEC)
DFEEST helped applicants in South Australia to secure           A further response to ageing TAFE SA infrastructure
$1.5 million funding in 2011 through the Commonwealth           involved $125 million provided by the South Australian
Industry and Indigenous Skills Centre (IISC) program            government to establish the Sustainable Industries
(formerly known as the National Training Infrastructure         Education Centre (SIEC) at the 58-hectare Tonsley Park
Program). The program consists of two streams: (i) Industry     Redevelopment site.
Skills Centres; and (ii) VET Infrastructure for
Indigenous People.                                              The project encompasses three key elements:
                                                                  1. Consolidation of metropolitan Building and
The Commonwealth government, through DEEWR,                            Construction training delivery at the Tonsley Park
competitively funded the program on a financial year basis             Redevelopment site
to the value of $11 million, with a matching industry              2.   Divestment of campuses at Panorama, O’Halloran
contribution for successful IISC applicants.                            Hill, and Marleston
The primary purpose of the program is to fund the                  3.   Consolidation of non-Building and Construction
building, refurbishing and expansion of VET training                    programs from divested campuses at other
facilities, including the purchase of mobile and simulation             metropolitan campuses.
equipment to deliver accredited VET that directly leads to
and supports the development of state-identified industry       SIEC will consolidate Building and Construction programs
and community VET skills requirements.                          from five metropolitan campuses into a single delivery
                                                                point, incorporating shared learning and support spaces
The projects approved this year were the Construction           with universities and industry partners. This is the first time a
Industry Training Centre, Kalka and Career                      tripartite approach has been taken for a TAFE SA facility in
Employment Group.                                               South Australia, and possibly Australia.

                                                                The SIEC is on schedule for training delivery to commence
                                                                at Tonsley Park from early 2014. Its purpose is to improve
MOUNT GAMBIER                                                   sustainability research and design through linkages
                                                                between our universities, education and training services,
DFEEST and TAFE SA opened the Solar and Domestic                and the Building and Construction industry that relies on
Wind Turbine Installation and Grid Connect Training             both sectors. SIEC will transform training in the building,
Centre at Mount Gambier in August 2011. This training           construction and water industries and open the way to
facility was established in response to local industry          incorporating more sustainable products, processes and
demand and TAFE SA’s commitment to environmental                technology into future building projects.
sustainability. The centre offers facilities for electrical
contractors wanting to gain the necessary training to install   The facility layout and infrastructure, both essential
solar panels and domestic wind turbines. The training site      components of the learning framework, will be used to
allows for the installation of solar systems on a range of      maximise opportunities for:
roof types, and incorporates three domestic wind turbines         -     cross-curriculum collaboration and multi-skilling
which suit a range of applications in regional South
Australia. Regional students in building and construction          -    thematic interdisciplinary approaches to complex
and pre-vocational electrical students were heavily involved            problem solving
in the production of the training centre.                          -    the use of ICT to support innovative approaches to
                                                                        teaching and learning.

                                                                The innovative educational vision of SIEC requires an
                                                                appropriate infrastructure, one that will essentially reshape
                                                                the delivery of education and training to the Building and
                                                                Construction industries in the state. In this new model:
                                                                   -    co-located programs will maximise synergy and
                                                                        opportunities for innovation between trades
                                                                   -    new partnerships and advisory arrangements will
                                                                        ensure industries and enterprises have input into
                                                                        SIEC’s management and are able to provide
                                                                        advice on training and workforce
                                                                        development needs


                                                                                                                         Page 51
-    high-speed fibre network will provide an IT-rich           VICTOR HARBOR TAFE SA CAMPUS
        environment which will support:
                                                                   The new Victor Harbor TAFE SA Campus, officially opened
          -    increased accessibility                             in March 2011, provides a hub for around 550 students in
          -    links to a network of existing                      courses including enrolled nursing, aged care, disability
                                                                   services, business administration, hospitality and community
               educational providers
                                                                   services work. The position of the campus adjacent to the
          -    extensive e-learning resources, thus                Victor Harbor High School, Victor Harbor Council Library
               promoting autonomy and                              and Encounter Centre enhances the existing
               self-directed learning                              educational precinct.
   -    there will be space for industry to demonstrate
        new products and services and deliver                      The state-of-the-art facilities include sustainable design as a
        sustainability related training programs                   centrepiece of the construction methodology. The campus
                                                                   includes energy efficient innovations such as an extensive
   -    industry’s onsite presence will facilitate stronger        use of solar panels and energy efficient lighting and has a
        TAFE SA/enterprise connections and enhance                 strong emphasis on water conservation. It was no surprise
        trainer understanding of enterprise needs                  that the Victor Harbor TAFE SA campus was awarded the
   -    flexible design principles will allow areas to be          Civic Trust Award - Urban category in November 2011.
        reconfigured as teaching and learning
        needs change.

The SIEC is not simply a building in which learning occurs;
it is an educational tool designed to demonstrate clean
technologies and to inspire and intrigue those who
observe its inner workings. The core of the building will be
transparent, enabling learners (and visitors) to watch the
intricacies of the pipe and electrical infrastructure. Learners
will be able to physically interact with their surroundings by
intervening in its operation and monitoring the impact of
their actions on building performance.
Key features of the design of this world-class facility include:
   -    demonstrator elements
   -    spatial efficiency / shared spaces
   -    minimised recurrent costs.


Page 52
OUR PERFORMANCE


      The Victor Harbor TAFE SA campus was awarded the
Australian Civic Trust Award – Urban Category in November 2011.
                                                                  Page 53
3.5 Digital Economy and Technology
DFEEST Strategic Plan Goal 5


A range of ICT-related projects were completed in 2011   Priorities for 2012
with the following achievements:
                                                         Priorities relating to digital economy and technology align
   -   Premier’s Award in the category of Growing        with the primary drivers of the Information Economy
       Prosperity: AdamMax – Shining the Light on        Agenda 2009-2014, the ‘3Cs’ (Connectivity, Capability and
       Broadband Blackspots                              Content). They contribute to the achievement of a number
                                                         of SASP targets and address recommendations of the
   -   Premier’s Award in the category of Expanding
                                                         report by 2009 Thinker in Residence, Dr Genevieve Bell,
       Opportunity: Remote Indigenous Public Access
                                                         entitled ‘Getting Connected, Staying Connected: Exploring
       Project – Oodnadatta
                                                         South Australia’s Digital Futures’. The Digital Economy
   -   AdamMax: Completion of the AdamMax Project        priorities acknowledge and complement the department’s
       providing fixed wireless broadband access to      wide focus on productivity and participation in
       blackspot areas in metropolitan Adelaide          employment and training as set out in the Skills for All
   -   Mid North Broadband Project: Providing            strategy.
       broadband access to the Mid North of South
       Australia with a fixed wireless solution          The priorities have been developed in the context of the
                                                         new SASP 2011 targets:
   -   The gap between South Australian broadband
       usage and the national average was reduced to        -    Target 57: Broadband Access – the proportion of
       one percentage point                                      South Australian premises with access to
                                                                 broadband services delivered by fibre technology
   -   Successful completion of Mobile Enterprise                meets the national average by 2020
       Growth Alliance (MEGA) 2011 Digital
       Entrepreneurship Program                             -    Target 58: Online Business – Increase the
                                                                 proportion of businesses that receive orders online
   -   Successful trials of the ForwardIT website and            from 24 percent to 40 percent and continue
       High Speed Broadband eBusiness Program                    growth each year to 2020.
       in Willunga
   -   Release of the Willunga pre-NBN Baseline
       Study Report
   -   Development of a Digital Economy Strategy for
       Northern Adelaide Region Councils (Playford,
       Salisbury and Tea Tree Gully).


                                                                                           The National Broadband
                                                                                           Network was successfully
                                                                                          ‘switched on’ in Willunga.


Page 54
OUR PERFORMANCE


ENSURING EVERY SOUTH AUSTRALIAN HAS ACCESS TO                                                                                 PROMOTING DIGITAL LITERACY AS FOUNDATION SKILLS
BROADBAND                                                                                                                     FOR ALL SOUTH AUSTRALIANS
The South Australian government recognises that                                                                               The South Australian government recognises that whilst
broadband is the ‘utility’ of the 21st century and that all                                                                   digital connectivity is important, it alone is not sufficient to
South Australians are entitled to broadband connectivity.                                                                     create a vibrant economy and an engaged community.
DFEEST is committed to maximising the benefits of the                                                                         The future prosperity of South Australia, and the wellbeing
NBN rollout scheduled to take place over the next nine                                                                        of its citizens, is predicated on having a broader-based
years, with a particular emphasis on achieving the highest                                                                    knowledge-driven economy with a better educated and
possible extent of fibre, and recognising the particular                                                                      trained workforce and, a competent and confident society
challenge of optimising broadband quality and speed in                                                                        in the skills that are demanded by the global digital
regional areas. It will do this by working collaboratively with                                                               economy. This has been recognised in the South Australian
the Commonwealth government, local governments and                                                                            government’s Skills for All reforms for South Australia.
RDA, NBN Co, industry and communities.
                                                                                                                              There are two key areas that need to be addressed.
In 2012, DFEEST will:                                                                                                         These are:
   -   develop a whole-of-state Position Statement on                                                                            -       creating trust and confidence so that South
       broadband and the NBN                                                                                                             Australians can maximise their interaction with the
                                                                                                                                         online world and unlock the true economic and
   -   conduct an Economic Impact Study; making the
                                                                                                                                         social value of online engagement
       case for fibre or best possible technology
       deployment in regional areas of economic and                                                                              -       improving the digital literacy of all citizens.
       social significance
                                                                                                                              In early 2012, DFEEST will work with the VET sector on skills
   -   provide an appropriate whole-of-government                                                                             for the digital economy and with Skilled Workforce
       response to the Commonwealth government’s                                                                              Advisors on the use of ICT for productivity. DFEEST will also
       Convergence Review which examines policy and                                                                           develop the digital literacy skills content and methodology
       regulatory frameworks that apply to the                                                                                for the Industry/Enterprises sector.
       converged media and communications landscape
       in Australia.

In 2010-11, the difference that historically existed between
the national and South Australian use of broadband, for
internet-connected households, was reduced to just one
percentage point. This result represents a highly positive
change from the longstanding situation of the state’s usage
being approximately ten percentage points below the
national average.


         Figure 12: Broadband use in householdsHouseholds
                           Broadband Use in

                                         100%
                                                                                                                                     91% 92%
                                         90%                                                                            86%
                                                                                                                  81%
         Broadband as % of Connections


                                         80%                                                            78%

                                                                                        68%       68%
                                         70%

                                         60%                                      57%

                                         50%                            47%                                                                       SA
                                         40%
                                                                                                                                                  Aust
                                                                  36%

                                                        28%
                                         30%
                                                  19%
                                         20%

                                         10%

                                          0%
                                                ABS 2004-2005   ABS 2005-2006   ABS 2006-2007   ABS 2007-2008   ABS 2008-2009    ABS 2010-2011                                Source: ABS Cat No 8146.0

                                                                                                                                                                                             Page 55
BUILDING A DIGITAL ECONOMY POWERED BY                            DEVELOPING BEST PRACTICE AND MODELS FOR
INNOVATION AND ICT                                               LOCALISED DIGITAL ECONOMIES
The South Australian government recognises that ICT plays        DFEEST recognises the need to engage with regional
a central role in driving economic productivity and global       authorities, key industry users and promoters of ICT services
competitiveness of all South Australian industries and that      as well as business and community users to develop
the ICT industry in particular can contribute much to            ‘flagship’ examples of flourishing localised digital economies
achieving these objectives. DFEEST will work in partnership      for others to emulate. In 2012, DFEEST will partner with the
with the ICT industry to foster the innovative application of    Australian Information Industries Association to leverage
new technologies in the sectors that are driving our state’s     National Digital Economy Strategy funding (Digital Hubs &
economy. In 2012, DFEEST will conduct an Adelaide                Enterprises).
Wireless Network feasibility study, partner with the
Australian Information Industries Association (AIIA) to run      DFEEST continues to assist councils to become NBN ready.
the ‘Seeding ICT Innovation’ Forum and work with key             An example is the development of a Digital Economy
South Australian industry sectors to identify digital economy    Strategy for the Northern Adelaide Region in partnership
opportunities within the sector.                                 with Playford, Salisbury and Tea Tree Gully councils. The
                                                                 document will provide a template for similar strategies for
                                                                 other South Australian councils.
BUILDING HIGHER ORDER SKILLS CAPABILITY AND SMART
CONTENT TO UNDERPIN THE STATE’S DIGITAL ECONOMY
                                                                 POSITIONING SOUTH AUSTRALIA TO TAKE ADVANTAGE
The South Australian government recognises the need to
                                                                 OF OTHER INITIATIVES
work with and through industry, businesses and other
stakeholders to develop programs to support skilling             DFEEST recognises that its actions alone are not sufficient to
through training for both enterprises and individuals to drive   achieve the above outcomes and collaboration is essential.
economic productivity. E-business programs continue to           We are committed to working with the community, industry
explore opportunities for South Australian businesses to         and all levels of government to implement a number of
access high-end technology skills and basic digital literacy     digital economy initiatives that create valuable opportunities
skills to enhance opportunities for business and industry.       for South Australia. In 2012, DFEEST will coordinate ‘Green
                                                                 IT’ activities with the AII Sustainability taskforce in
MEGA, a workshop program designed, presented and                 collaboration with Technology Industry Association’s Green
mentored by industry to develop skills and knowledge in          Task Force, participate in and provide input into National
digital content and applications was run in 2011 with            Digital Economy working groups, provide South Australian
22 participants pitching seven new concepts for digital          government representation and input on the
products or services.                                            Commonwealth government’s Senior Officials Working
                                                                 Group on Digital Productivity and provide input to the
                                                                 Commonwealth and State Regional Taskforce on digital
                                                                 economy issues and opportunities.


Page 56
OUR PERFORMANCE

3.6 A Focus on Quality
DFEEST Strategic Plan Goals 4 and 7


REGULATION
Throughout 2011, the delivery of higher education (other        Non self-accrediting institutions
than that provided by the state universities), VET, and         Over the last two decades, non self-accrediting higher
educational services to overseas students was regulated         education institutions (NSAIs) have become an integral
under the Training and Skills Development Act 2008 (the         part of the higher education sector in South Australia. The
Act). The Act provides the basis for ensuring that              sector offers diversity and contributes to the state’s
education and training providers, and the courses they          objective of increasing the number of international
deliver, are quality assured under national education and       students in South Australia, as well as the national
training standards. Data on regulatory activity across these    objective of increasing the number of individuals with a
three sectors is presented in tables 1-5 starting on page 76.   higher education qualification. The sector comprises
                                                                approximately 30 NSAIs registered in South Australia or
The department manages the registration of education            operating in the state under mutual recognition provisions.
and training providers under Part 3 of the Act through a        These include: two overseas universities - Carnegie Mellon
delegation from the TaSC. The assessment of applications        University and University College London; TAFE SA; and
for registration and the monitoring of compliance with          three self-accrediting institutions - Australian College of
standards are managed by the department with the                Theology, Australian Film Television and Radio School and
engagement of personnel from industry, occupational             Melbourne College of Divinity.
licensing bodies, the three state universities and other
stakeholders as required.                                       In 2011, the department undertook a comparative analysis
                                                                of course offerings and student enrolment data collected
                                                                from South Australian NSAIs in 2008-2010. The results of
                                                                the study were reported to the Higher Education
Transition to national regulation                               Registration and Accreditation Board and the TaSC to
On 1 July 2011 the Commonwealth Vocational Education            inform them on NSAI’s performance.
and Training (VET) Regulator Act 2011 came into effect
and ASQA commenced operations. To allow ASQA
jurisdictional operation in South Australia, the South
Australian government was required to refer its previous        VET registration and compliance monitoring and
regulatory powers to the Commonwealth. This was done            assessment
through the Vocational Education and Training                   The number of registered providers in the domestic VET
(Commonwealth Powers) Bill 2011 (the Bill) which was            sector fell from 324 in 2010 to 308 in 2011. This came
introduced into State Parliament late in 2011. The Bill,        about through a 23 percent reduction in the number of
transferring all regulatory activity to ASQA, is due for        approvals from the previous calendar year and the transfer
completion by April 2012.                                       of seven providers to the ASQA because their principal
                                                                place of business was not in South Australia. Twenty three
The year 2011 was also the final year of the state’s role in    providers withdrew their registration to deliver to
regulating higher education (other than universities which      domestic students and three providers had their
are self-accrediting). From 2012, regulating higher             registration cancelled.
education will be undertaken by the national regulatory
body, TEQSA, which was also established in July 2011            At the beginning of the year, 11 providers had their
following passage of the Commonwealth’s Tertiary                registration under the Act managed by the National Audit
Education Quality Standard Agency Act.                          and Registration Agency through delegated authority
                                                                from the TaSC. The closure of this agency, following the
                                                                establishment and commencement of operations of ASQA
                                                                in a number of states and territories, resulted in
                                                                responsibility for the management of these registered
                                                                providers being transferred back to the department on
                                                                1 July 2011.


                                                                                                                    Page 57
There was a small reduction in the total number of              The department receives and investigates complaints made
providers registered to deliver training to overseas students   about registered providers operating in South Australia. As
from 71 to 68. Two applications for initial registration to     at 1 January 2011 the department had a total of 37
deliver training to overseas students were approved; one        complaints open. A further 22 written complaints were
was refused. Two providers had their registration cancelled     received during the year. These complaints were
and three providers voluntarily withdrew their registration.    investigated by the department to determine whether the
                                                                registered provider was operating in compliance with the
The department maintained a targeted program of                 Training and Skills Development Act 2008 and its
monitoring audits to ensure that providers were operating       conditions of registration. Four of these complaints were
in compliance with all regulatory requirements. In a            referred to other registering bodies interstate for further
number of cases, joint audits were conducted with DIC           investigation. As at 31 December 2011 the department
and DEEWR.                                                      had closed 45 of these complaints.


Page 58
OUR PERFORMANCE

RECOGNITION DATA


    Table 1 : VET REGISTRATION                                                                             2009        2010      2011
    Summary

    Total Registered Training Organisations (RTOs) registered in SA for domestic delivery                   327        324a      308

    RTOs also delivering Higher Education courses                                                            16         15           13
    RTOs with delegated powers b                                                                             3           3           3
    Approvals
    Initial registration                                                                                     40         22           17
    Renewal of registration                                                                                  41         24           31
    Extension to scope of registration                                                                      146        157       162
    TOTAL                                                                                                   227        203       210

    Qualifications added to TAFE SA scope of registration under delegation                                  203        272       188

    Refusals, Cancellations and Suspensions
    RTOs who expired or voluntarily withdrew registration                                                    17         22           23

    RTOs who transferred to another registering body                                                         0           0           7

    RTOs who had registration cancelled by registration authority                                            0           3           3

    RTOs who had registration suspended by registration authority                                            0           0           0

    RTOs who had registration refused by registration authority:

           Initial registration                                                                             4           3           4

           Extension to scope of registration                                                               2           1           7

           Renewal of registration                                                                          0           0           0

    Audit Activity: Number of audits conducted
    Initial registration                                                                                     43         27           17

    Renewal of registration                                                                                  39         21           23

    Extension to scope of registration                                                                       58         66           43

    Monitoring                                                                                               28         40           61

    TOTAL                                                                                                   168        154       144


a
 Total figure inclusive of eleven RTOs that had their auditing and registration managed by National Audit and Registration Agency.
These RTOs were transferred back to SA in 2011 in preparation for transfer to the new national regulator Australian Skills Quality
Authority
b
    The three TAFE SA institutes have delegated powers to vary scope of registration and to accredit Crown copyright courses.


                                                                                                                                Page 59
Table 2 : VET ACCREDITATION                                                    2009   2010   2011

    Summary
    Total accredited courses                                                       174    122    126
    Approvals
    Courses accredited                                                              15     5      14

    Courses accredited (TAFE SA under delegated authority)                          6      8      10
    Training package qualifications endorsed nationally                            204    150    290

    New qualifications made available through traineeships or apprenticeships in
                                                                                    82    139    110
    South Australia


    Table 3 : HIGHER EDUCATION REGISTRATION                                        2009   2010   2011
    Summary

    Higher education providers registered in SA for domestic delivery               32     32     30

    Higher education providers who also deliver VET courses                         16     15     13
    Approvals
    Initial registration                                                            2      2      1
    Variation to scope of registration                                              12     9      11
    Refusals, Revocations and Withdrawals

    Higher education providers who voluntarily withdrew registration                2      2      3

    Higher education providers who had registration cancelled by registration
                                                                                    0      0      0
    authority

    Higher education providers who had registration suspended by registration
                                                                                    0      0      0
    authority


    Higher education providers who had registration refused by registration
    authority

           Initial registration                                                    0      0      1

           Variation of registration                                               0      0      2

           Renewal of registration                                                 0      0      0


    Table 4 : HIGHER EDUCATION ACCREDITATION                                       2009   2010   2011
    Summary
    Total current accredited courses                                                332    342    352
    Approvals
    Courses accredited                                                              82     21     59


Page 60
OUR PERFORMANCE
Table 5 : OVERSEAS RECOGNITION                                              2009   2010   2011
Summary

Registered providers delivering only VET courses to overseas students        47     43     40

Registered providers delivering only higher education courses to overseas
                                                                             11     10     12
students
Registered providers delivering VET and higher education courses to
                                                                             9      8      2
overseas students

Registered providers delivering only English Language Intensive Courses
                                                                             5      3      3
to Overseas Students (ELICOS)

Registered providers delivering VET and higher education and ELICOS          3      5      6

Registered providers delivering ELICOS and VET courses to overseas
                                                                             2      1      4
students

Registered providers delivering ELICOS and higher education courses to
                                                                             1      1      1
overseas students

Total registered providers approved to deliver courses to overseas
                                                                             78     71     68
students
Approvals
Initial registration                                                         17     7      2

Renewal of registration                                                      7      2      2
Extension to scope of registration                                           41     20     20

Refusals, Revocations and Withdrawals
RTOs who voluntarily withdrew registration                                   0      11     3
RTOs who had registration cancelled by registration authority                0      3      2

RTOs who had registration suspended by registration authority                0      0      0


RTOs who had registration refused by registration authority:
       Initial registration                                                 1      3      1
       Extension to scope of registration                                   1      0      1
       Renewal of registration                                              0      0      1


Audit Activity: Number of audits conducted
Initial registration                                                         18     11      2
Renewal of registration                                                      6       2      2
Extension to scope of registration                                           25      7      9
Monitoring                                                                   9      26     15

TOTAL                                                                        58     46     28


                                                                                                 Page 61
SUPPORTING QUALITY
Building the capability of the VET workforce was a major         A number of new measures to support quality were
focus for the department throughout 2011. The focus on           introduced through revised Guidelines for Registered
quality was driven in part through Skills for All, which         Training Organisations approved by the Minister under the
among other things aims to build the capacity of the VET         Training and Skills Development Act 2008. These measures
system to support the expansion of the market and to             required Registered Training Organisations (RTOs) to,
ensure its ongoing quality. Increasing the quality and           amongst other things:
capability of the VET systems was also a national focus in          -   apply to the TaSC for approval to deliver VET to
2011 through the release of a number of significant reports             school students. Over 40 applications were
such as the Productivity Commission’s Report; Skills                    assessed and approved by 1 January 2012
Australia’s Road Map to Prosperity; and L.H. Martin’s,
Quality of the VET Workforce. A capability framework is             -   submit a Special Purpose Financial report based
also being developed by the Innovation and Business Skills              on financial data from certified accounts from the
Australian Industry Skills Council for VET practitioners which          previous two financial years. This report was
will be underpinned by the recently endorsed Diploma of                 developed by an internationally recognised
Vocational Education and Training. These qualifications                 accounting and risk management firm to assist the
and frameworks provide a focus for continuing the                       department to assess the financial health of RTOs
professional development in the sector.                             -   appoint a suitably qualified and experienced
                                                                        person as an Accountable Officer to provide
To support these initiatives, the department provides a                 educational leadership to its trainers and assessors.
targeted professional development program for training
providers that addresses contemporary education, training        The department, in conjunction with TAFE SA, conducted
and workforce development practice. This also includes           a successful pilot of the Training Guarantee for SACE
distribution of 11 editions of E-news to 1700 stakeholders.      Students scheme for over 200 students. The scheme, which
                                                                 will commence fully in mid-2012, is designed to assist SACE
In 2011, 15 contemporary VET practice workshops were             students start on a relevant Certificate III pathway, which
held involving 409 VET practitioners. An additional six          they will finish with a Skills for All training provider after
information sessions were held which focused on: Skills for      completing their SACE studies.
All; Training Guarantee for South Australian Certificate of
Education (SACE) students; International Education Forum;
and TEQSA transition. A total of 1192 people attended
these sessions.                                                  Plans for 2012

Other events under the Capability Building Series included:      Although, regulation of the VET sector will transfer to
                                                                 ASQA in 2012, the department will continue to drive
   -   Building Capability Assessment program which              excellence and quality in South Australia through
       ran several workshops and work-based projects             Skills for All reforms. This will be achieved through
   -   Building Foundation Skills for the Future, which          procurement and contracting systems that have a strong
       included two Language, Literacy and Numeracy              focus on quality as well as continuing to build the provider
       programs with 40 participants attending four              capability of providers through targeted
       workshops                                                 professional development.

   -   The New Directions in VET program which                   The department developed robust selection criteria and
       focussed on training organisations as businesses,         assessment processes to assess applicants to be Skills for All
       provided RTOs with the opportunity to undertake           providers. Once enrolments commence from 2 July 2012
       a business health check. The program attracted            the department will monitor the quality of services
       19 RTOs as participants                                   provided by Skills for All training providers through a range
   -   Implementation sessions were facilitated for the          of data including information exchanged with the national
       Diploma of Vocational Education and Training              regulator. Where necessary, the department will conduct
       which involved four workshops attended by                 audits to confirm that providers are complying with their
       14 people.                                                contractual obligations.


Page 62
OUR PERFORMANCE

TAFE SA AND QUALITY
TAFE SA prides itself on being the number one provider of       The process for TAFE SA admissions through the South
quality VET in South Australia. TAFE SA plays a major role in   Australian Tertiary Admissions Centre (SATAC) has
providing a comprehensive range of courses and services         continued to be refined during 2011 to provide a more
to industry, the community and disadvantaged groups.            streamlined service for prospective students and to assist
                                                                TAFE SA in maximising the number of student offers. A
The 2011 NCVER Student Outcomes Survey focused on               significant improvement is the ability for programs to
the students’ employment outcomes, benefits of training,        remain open on the SATAC and TAFE SA websites,
satisfaction and improved employment status in Australia.       allowing applications and offers to be made to programs
The publication reported on results from a national survey      with vacancies all year round. In Semester 1, 2011, 16 198
of students who completed their VET during 2010.                applications were made to TAFE SA courses, an increase of
                                                                5.75 percent from 2010. In Semester 2 2011, 9279
In 2011, a high number of South Australia’s VET graduates       applications were made, an increase of 39.39 percent
reported that they were satisfied with the overall quality of   from 2010.
their training, with:
                                                                The Student Information System (SIS), a package of
   -   91.2 percent of government-funded TAFE SA                software products that will provide modern and flexible
       graduates satisfied, the highest figure of all the       web-based services to TAFE SA students and staff, was
       states and territories                                   partially implemented in June 2011. 21 000 students
   -   77.5 percent of all TAFE SA graduates employed           enrolled in Semester 2 2011, and work will continue in
       after training, an increase of 0.2 percentage points     2012 on the development and testing of the ‘system’.
       on the 2010 figure (77.3 percent) and above the          Monitoring and recording details and student information
       national average of 77.1 percent                         for those with special needs will also be a useful feature
                                                                of SIS.
   -   74.9 percent of government-funded TAFE SA
       graduates employed after training
                                                                In 2011, the TAFE SA website continued to support the
   -   of all TAFE SA graduates who were employed               needs of students and business with traffic on the website
       after training in 2011, 78.5 percent reported that       continuing to increase with 2.98 million visits to the site.
       their training was relevant to their current job and
       72.8 percent reported at least one job-related           As South Australia moves into a new contestable training
       benefit. These figures were above the national           market, TAFE SA sees that maintaining a high-quality
       average of 77.0 percent and 72.7 percent                 training outcome is essential. Performance indicators
       respectively.                                            around student satisfaction, employer satisfaction and
                                                                module completions are critical for TAFE SA and will
The NCVER also runs a survey of employers, namely the           continue to be in 2012.
Employers Use and Views of the Vocational Education and
Training System.

A figure of 91 percent of employers were satisfied with the
quality of training delivered by TAFE SA to apprentices and
trainees, and 94 percent were satisfied with the quality of
nationally recognised training delivered by TAFE SA
(NCVER 2011).


                                                                                                                      Page 63
3.7 Science and Research
DFEEST Strategic Plan Goal 5


Innovation underpins South Australia’s productivity and        SOUTH AUSTRALIA’S CHIEF SCIENTIST
business competitiveness and the state’s capacity to respond   Adjunct Professor Don Bursill was appointed Chief Scientist
to a variety of environmental and social challenges. Equally   for South Australia in April 2011, replacing Dr Ian Chessell
as important, innovation contributes to the state’s social     who held the position from March 2008 up to December
wellbeing in terms of health, education and quality of life,   2010.
resulting in a stronger community, economic prosperity and
the delivery of better government services.                    Professor Bursill commenced his tenure with a round of
                                                               discussions with the three South Australian universities to
South Australia’s public expenditure on research and           gain their views on the strategic development of the state’s
development (R&D) as a proportion of Gross State Product       research sector and how it can better engage with industry.
(GSP) has continually risen from 1.04 percent in 2002-03 to    He also established an Early Career Researcher Network in
1.18 percent in the 2008-09 Australian Bureau of Statistics    conjunction with the Royal Institution of Australia. This
(ABS) reporting period. This compares to an average            network provides an opportunity for young researchers to
national investment in R&D of 0.81 percent of GSP for          discuss their own experiences and pass on their expertise to
2008-09.                                                       others and promote collaboration across research
                                                               institutions.
Expenditure by the Defence Science and Technology
Organisation (DSTO) and the Commonwealth Scientific and
Industrial Research Organisation (CSIRO) contributes to the
State’s achievements in R&D.


              Figure 13: South Australian Public Expenditure on R&D, as a % of GSP 2002-2009 (including a
              comparison to average national investment in R&D)


Page 64
OUR PERFORMANCE


PREMIER’S SCIENCE AND RESEARCH FUND                             SUPER SCIENCE FUNDING
The Premier’s Science and Research Fund facilitates             A sum of $3.8 million over four years (2010-11 to 2013-
investment in key science and research areas that have a        2014) was allocated to support recipients who received
demonstrable potential to generate significant and              funding from the Commonwealth government’s Super
sustainable economic, social and/ or environmental              Science Fund.
benefits for the state.
                                                                These Super Science funding recipients included:
An internal review of the Fund commenced in 2011, with
an expected outcome to be a re-launch of the Fund with          -     Ian Wark Research Institute (University of South
new investment categories. The South Australian Research              Australia) and Flinders University for the purchase
Fellowships, outlined below, will be retained as a leading            and operation of nano-tomography computer
investment strategy in order to expand the state’s                    equipment as part of the South Australian node of
research talent.                                                      the Australian National Fabrication Facility

In 2011, the Fund awarded $1.1 million to the South             -     Institute for Photonics and Advanced Sensing
Australian Research and Development Institute for the                 (University of Adelaide) for optical fibre research
Macroalgal Aquaculture project. This project assists with the         equipment that will aid the development of the next
development of the culture of two taxa of macroalgae with             generation of sensors that have a wide range of
market potential in optimised production systems at a proof           applications such as non-invasive monitoring of
-of-concept scale utilising nutrient-enriched waste water             embryos and devices to remotely identify corrosion
streams.                                                              in aircraft

                                                                -     Australian Wine Research Institute to enhance their
                                                                      metabolomics research services to support
RESEARCH FELLOWSHIPS AND SCHOLARSHIPS                                 bioscience research across a range of fields,
Funding for three new Fellowships was provided in 2011                including enabling wine producers to have greater
in the areas of clean technology, minerals processing and             control over wine quality and characteristics
experimental physics. These positions are part-funded by
the state government for three years with matching              -     Adelaide Proteomics Centre (University of Adelaide
funding provided by the universities.                                 and SA Pathology) is investing to enhance their
                                                                      analytical capabilities to support research into the
Professional Development Scholarships for Women, valued               fight against diseases such as cancer and the
at $15 000 each, were also awarded to six outstanding                 development of therapeutics to treat these diseases.
early to mid-career researchers working in science,
technology, engineering and mathematics. The
scholarships are used to help build and extend the
recipients’ research profile via exposure to the national and
international research community.


                                                                                                                   Page 65
SCIENCE EXCELLENCE AWARDS                                       CO-OPERATIVE RESEARCH CENTRES (CRCs)
Since 2005, the South Australian Science Excellence             DFEEST currently provides $1.2 million annually to 12 Co-
Awards (the Awards) have recognised and rewarded                operative Research Centres (CRCs) to support the
excellence in science and acknowledged commitment and           involvement of state government agencies in these
skill in raising public awareness of science. Award             national centres. In 2011, the Commonwealth government
categories had been modestly amended over the years to          provided $148 million for six CRC applicants, two of which
recognise the teaching of science and school, tertiary and      DFEEST is supporting through the state government’s
community levels, and highlight collaboration                   CRC Assistance Program.
with industry.
                                                                These CRCs are:
After an internal review in early 2011, the Awards were
                                                                  -    Automotive Australia 2020 CRC (previously Auto
renewed to not only maintain the prestige of the Awards,
                                                                       CRC), which received $26 million to position
but to bring far greater attention to emerging scientists and
                                                                       Australia as a leading international manufacturer
researchers, particularly PhDs and early career STEM
                                                                       and technology provider for low-emission
professionals in local employment; and to support the
                                                                       transport solutions. The South Australian node is
quality of STEM teaching at school and tertiary levels.
                                                                       based at the University of South Australia.
In November 2011, Awards were presented to 10                     -    CRC for Low Carbon Living received $28 million
researchers and educators, with joint winners in the                   and will provide government and industry with
category of Early Career STEM Educator. Other Award                    social, technological and policy tools to overcome
categories included:                                                   identified market barriers preventing adoption of
                                                                       cost-effective low carbon products and services,
   -   Scientist of the Year                                           while maintaining industry competitiveness and
   -   PhD Research Excellence – Health                                improving quality of life. The South Australian
       and Medical Sciences                                            node, based at the University of South Australia,
                                                                       will link with the state government’s Integrated
   -   PhD Research Excellence – Life                                  Design Commission.
       or Environmental Sciences
   -   PhD Research Excellence – Physical Sciences/
       Mathematics/Engineering
   -   Early Career STEM Professional
   -   Early Career STEM Educator – Tertiary.

In 2011, an evaluation of the renewed Awards deemed
them to be a success. Knowledge gained through the
feedback and experience highlighted further
improvements could to be made with the timing of the
Awards in 2012.


Page 66
OUR PERFORMANCE


                  Page 67
3.8 Tertiary Education
DFEEST Strategic Plan Goals 4 and 7


In addition to its regulatory role, the department provides
important policy and program support to ensure
sustainable growth in the state’s tertiary education system,
especially in areas of strategic importance to the state. A
key consideration is the number and types of linkages
across the education and training system, most notably in
the area of school to post-school pathways.


TAFE–UNIVERSITY CREDIT TRANSFER AND ARTICULATION                SUPPORTING HIGHER EDUCATION POLICY
PATHWAYS                                                        DEVELOPMENT AND IMPLEMENTATION

Head Collaboration Agreements were signed between               South Australia’s publicly funded universities play a crucial
TAFE SA and Charles Darwin University, Flinders University,     role in supporting and promoting the state’s economic and
the University of Adelaide and the University of South          social prosperity. The sector continues to operate in an
Australia during 2011. These agreements are designed to         increasingly deregulated and globalised market with local,
strengthen established relationships between TAFE SA and        national and international competition for students, staff
each of the universities and to deliver increased               and resources.
collaborative educational offerings and pathways to South
Australians.                                                    The last 12 months has been a period of intense
                                                                consultation with the sector on a range of issues arising
During 2011, TAFE SA registered 176 new specific credit         from the creation of the TEQSA through to issues involving
transfer and articulation agreements. The 563 agreements        the implementation of the Commonwealth government’s
promoted on the TAFE SA website, as at December 2011,           reform agenda for higher education. The department’s
cover both qualifications currently available for enrolment     participation in these high-level discussions is ongoing
and previous versions of qualifications where credit is still   through the Ministerial Council for Tertiary Education and
awarded by the university.                                      Employment and its Senior Officials Committee.

During 2011, 63 003 page views (up from 42 299 in 2010)         The department also provides input to Commonwealth
were recorded across credit transfer and articulation pages     government reviews and inquiries, and in 2011 provided
on the TAFE SA website.                                         submissions to the following reviews:
                                                                   -   Strategic Review of the Student Visa Program (the
                                                                       Knight Review) in consultation with Education
                                                                       Adelaide, the DECD (International Office), the
NEW PRIVATE UNIVERSITY                                                 Office of the Training Advocate, Immigration SA
                                                                       and Multicultural SA. The Review’s terms of
In October 2011, the South Australian government
                                                                       reference were developed with a view to
approved an application from Laureate International
                                                                       enhancing the quality, integrity and
Universities to establish a private university in Adelaide.
                                                                       competitiveness of the international education
Torrens University Australia is only the third private
                                                                       sector, as well as strengthening the integrity of the
university in Australia and is expected to deliver academic
                                                                       Student Visa Program
programs to Australian and international students from
2013 onwards.                                                      -   Commonwealth government’s Base Funding
                                                                       Review of Higher Education, which is investigating
                                                                       the principles that should underpin public
                                                                       investment in higher education
                                                                   -   Review of Higher Education Access and
                                                                       Outcomes for Aboriginals and Torres Strait
                                                                       Islanders.


Page 68
OUR PERFORMANCE


RESEARCH PROJECTS                                              SCIENCE, TECHNOLOGY, ENGINEERING AND
                                                               MATHEMATICS STRATEGY
Several research projects were commissioned in 2011, two
of which were facilitated through the ABS State                In August 2011, the Minister for Science and Information
Consultancy Fund.                                              Economy launched ‘A Science, Technology, Engineering
                                                               and Mathematics Skills Strategy for South Australia’ (STEM
These research projects included:                              Skills Strategy).
   -   an investigation into the participation of low socio-   The need for STEM skills in our growing defence, mining,
       economic status students in tertiary education in       bioscience, clean-tech, food production and other
       South Australia in response to national and state       industries is outpacing the supply of skilled workers. For all
       targets. This project is due to be finalised early      South Australians to reap the benefits of these high-value
       in 2012                                                 emerging industries and the digital economy, it is critical
   -   a feasibility investigation for South Australia         that we all work together to attract and develop a
       meeting the Commonwealth government target              workforce with stronger skills in the STEM occupations.
       of 40 percent of 25 to 34 year olds having a
       completed bachelor degree or higher by 2025.            Addressing these demands requires concerted and focused
       Copies of the report have been provided to              action, and this is the aim of the STEM Skills Strategy. The
       each university                                         strategy establishes:
   -   meeting with university representatives to identify        -    policy and program priorities for government
       ongoing work and opportunities for collaboration                investment in STEM
       in achievement of state and national targets               -    an Executive Reference Group chaired by
   -   a further research project initiated in 2011 which is           Raymond Spencer, Chair of the Economic
       investigating the number of female school and                   Development Board and including executives from
       tertiary graduates with STEM qualifications in South            relevant government departments
       Australia and their participation in related STEM
                                                                  -    a Cabinet Taskforce that includes Ministers
       occupations. The purpose of this project is to:                 responsible for Science and Information Economy,
       -    obtain a current South Australian profile of               Education, Trade, Defence Industries, Mineral
            female participation and retention rates in                Resources, and Employment, Higher Education
            STEM fields of education at both the senior                and Skills.
            secondary schooling and university levels
            of education                                       The STEM Skills Strategy also outlines the suite of
                                                               government programs to improve skills in science and
       -    investigate the transition patterns of female
                                                               mathematics, including substantial investment in
            students with completed year 12 STEM school
                                                               professional development and training for the state’s
            subjects into a university STEM bachelor
                                                               teachers, a range of enhancement and enrichment
            qualification and from bachelor degree to
                                                               activities for school students, and support for VET and
            STEM post-graduate study and into
                                                               university students including scholarships.
            the workforce
       -    establish a current profile of females working     About 150 key industry representatives attended the STEM
            in STEM-related industries in South Australia.     Skills Strategy launch, and workshops were held for
                                                               providers of STEM enhancement and enrichment activities.
A report on the project will be released during 2012.
                                                               In addition to the launch in 2011, DFEEST began the
                                                               evaluation of new and existing STEM programs (e.g.
                                                               community-based science awareness programs) against
                                                               identified STEM Skills policy and program criteria. DFEEST
                                                               officers also began meeting with South Australian
                                                               universities to form closer collaborative ties with
                                                               education providers.


                                                                                                                      Page 69
TAFE SA LEARNING PATHWAYS
In 2011, TAFE SA continued to work with South Australian         There are three study pathway options for students:
universities to identify and establish credit transfer              -   successful students will have guaranteed entry to a
agreements that acknowledged the completion of relevant                 range of Flinders University courses
and comparable studies at TAFE SA. At the end of 2011,
international students could access 104 established credit          -   students can elect to undertake Diploma or
pathways into degrees in most study areas including                     Advanced Diploma studies within TAFE SA and
Agriculture and Biology, Art and Design, Building and                   thereby opt for direct entry to Flinders University
Furnishing, Business and Marketing, Community and                       through successful completion of their studies at
Health, Education and Languages, Electrical and                         Certificate IV or higher level
Electronics, Engineering and Transport, Food and Wine,              -   students will be referred to TAFE SA courses suited
Hair and Beauty, Hospitality and Tourism as well as                     to their capabilities and vocational aspirations.
Information Technology.
                                                                 In order to assist in addressing major skills shortages in the
A partnership arrangement developed between TAFE SA              regional health sector, TAFE SA partnered with local
and Flinders University will see greater accessibility to a      industry, schools and the Department of Health to create
university education for students who may have                   the regional ‘Pathways to Nursing’ program. Through this
considered further study impossible. The special entry           locally driven program, students not only complete their
scheme gives TAFE SA students at Adelaide City and               SACE, but gain valuable industry skills and qualifications,
Noarlunga campuses the option to enrol mid-year in               with 95 percent of graduating students securing
Foundation Studies at Flinders University. This partnership      employment as care workers in local organisations. The
will strengthen study pathways for students to move from         continued success of the program was recognised when it
vocational education to higher education, giving TAFE SA         was awarded the 2010 Coorong District Council Australia
students the strategies and skills needed for success at         Day Award for School Programs.
university. Students will be enrolled with Flinders University
and registered with DEEWR which will fund student fees           An agreement between TAFE SA and the University of
whilst staff from Flinders University and TAFE SA will           Adelaide will give Aboriginal and Torres Strait Islander
collaborate on the delivery. University mentored TAFE SA         students pathways to a university law degree. The
lecturers will deliver 75 percent of the program on TAFE SA      agreement will give students completing a Certificate IV in
campuses with the final 25 percent of the program                Legal Services entry into the Bachelor of Laws program at
delivered by Flinders University Student Learning Centre         the University from 2012 onwards. The new study
staff at Flinders University.                                    pathway, known as the ‘Aboriginal Law Program’ is the
                                                                 collaborative effort of TAFE SA, the Aboriginal Access
                                                                 Centre working with the Law Society of South Australia,
                                                                 the President of the Law Council of Australia, Allianz
                                                                 Insurance and the University of Adelaide. The Law Society
                                                                 of South Australia has also agreed to provide additional
                                                                 funding to support the Indigenous Law Studies project
                                                                 in 2012.


Page 70
OUR PERFORMANCE

STUDENT SCHOLARSHIPS                                             SENIOR SECONDARY TO POST-SCHOOL PATHWAYS -
                                                                 TRAINING GUARANTEE FOR SACE STUDENTS
In 2011, the first round of the South Australian government
Defence Scholarships was implemented, with 50                    The Training Guarantee for SACE Students is a new
scholarships of $5000 awarded to students undertaking a          scheme which commenced in Semester 2, 2011. It enables
defence-related honour degree or degree with honours at          eligible senior secondary school students to commence a
the University of Adelaide, Flinders University and the          Certificate III completion pathway while still at school as an
University of South Australia.                                   integrated part of their senior secondary studies (SACE or
                                                                 equivalent). The scheme subsidises students to undertake
The scholarships were designed to ensure long-term               accredited training at an RTO in prescribed qualifications
supply of quality skills and a vibrant workforce to meet the     and guarantees them a place with that RTO to complete
needs of the defence industry in South Australia.                the qualification after secondary schooling is completed.

While the number of awarded scholarships fell short of the       A total of 201 students from 51 schools across the state
75 available, it is expected that the 2012 round will be         participated in the scheme undertaking training at TAFE SA
oversubscribed.                                                  across 40 different qualifications, ranging from construction
                                                                 and furniture making, community services and health, to
We are also undertaking a detailed research project to           tourism and hospitality. Approximately two-thirds were at
track participation in STEM study and careers longitudinally.    Certificate II level, and one-third at Certificate III level.
The research includes data from the SACE Board,
International Baccalaureate Organisation, SATAC, the             There are two distinct phases in implementing the scheme.
University of Adelaide, Flinders University and the University   During Phase 1 (July 2011 – June 2012) TAFE SA is the
of South Australia.                                              principal provider and a small number of selected private
                                                                 RTOs will commence delivery during Semester 1, 2012.
The project will provide a more comprehensive                    Phase 2 (i.e. from 1 July 2012), of the scheme will see full
understanding of the patterns of female participation in         implementation as part of Skills for All.
STEM areas of learning and work, and the critical transition
points between school and university student, and from
university studies into the workplace. The research is
designed to identify at which of these critical transition
points women cease to participate in STEM study or work.

Once completed, the research will be made
publicly available.


                                                                                                                        Page 71
INTERNATIONAL EDUCATION
International Student Enrolment Trends                           Launch of the International Student Card
As at November 2011, international student enrolments in         In February 2011, the Minister launched the International
South Australia had decreased by 8.9 percent compared to         Student Card which is designed to provide international
the same period in 2010. This decline is lower than the          students with easy access to key contacts for the South
national average which contracted by 9.4 percent based           Australia Police, the Office of the Training Advocate and
on national Australian Education International statistics, all   Education Adelaide.
education sectors inclusive. Based on the same set of
Australian Education International figures, 31 190
international students studied in South Australia compared
to 554 764 nationally, representing a market share of            Health and Wellbeing of International Students
5.6 percent. The top three source countries remained in
                                                                 DFEEST has partnered with SA Health and Multicultural SA
the same order as the previous year: China, India and
                                                                 to undertake a project through the Health in All Policies
Malaysia. With the support of Education Adelaide, the
                                                                 initiative on the Health and Wellbeing of International
department continued to promote South Australia as an
                                                                 Students. With a focus on international students from the
international student destination despite challenges to the
                                                                 VET sector, the project’s priority has been to assess the
market felt across Australia.
                                                                 health and wellbeing of international students, and their
                                                                 knowledge of and ability to access health services in South
                                                                 Australia.
Student Roundtable
                                                                 The intended outcome is to identify the health and
In 2011, the inaugural International Student Roundtable          wellbeing needs of international students, the structures
was established to provide a forum for discussing issues         and services that are available to address these needs, and
around international student education, safety, community        opportunities to improve international students’
and social engagement and to identify opportunities that         information, support and access to these services.
enhance the experience of international students studying
in South Australia. Membership of the Roundtable includes        The project’s findings and recommendations will be
international students from a range of education sectors         completed during 2012.
and countries, along with supporting agencies and
government representatives. The Roundtable is chaired by
Ms Leesa Vlahos, Parliamentary Secretary to the Premier, on
behalf of the Minister for Employment, Higher Education
and Skills. The Roundtable provided a mechanism for
international students to advise the South Australian
government on their key issues of concern. They also
influenced the national agenda, with three international
student Roundtable representatives from South Australia
attending the National Roundtable in Canberra in August
2011.


                                                                                      Since February 2011, more than
                                                                                      16 000 cards have been
                                                                                      distributed to international
                                                                                      students. It is anticipated a further
                                                                                      12 000 cards will be distributed
                                                                                      each year and will be included
                                                                                      with the StudyAdelaide student
                                                                                      guides and satchels.

Page 72
OUR PERFORMANCE


TAFE SA International Activity                                      In 2011, TAFE SA instigated a number of initiatives to attract
                                                                    international students:
TAFE SA’s international activities, including the delivery of
programs to international students (both onshore and
                                                                    Student Ambassador Program
offshore) is an important function that supports the overall
goals of TAFE SA and the South Australian government.               With the recruitment of seven international students as
International students integrated into classes and campus           ambassadors, TAFE SA was the first VET provider in
life enrich the learning experience, broaden perspectives           Australia to introduce an International Student Ambassador
through shared ideas and experiences, contribute                    program. Recruitment was through a selection process and
significantly to the growth of the community, and provide           the ambassadors represent a wide range of nationalities
additional funds for building better facilities and employing       and courses studied. The aim of the International Student
quality staff.                                                      Ambassador program, which supports the Council of
                                                                    Australian Governments’ (COAG) International Student
The year 2011 continued to be a challenging year in the             Strategy and responds to the Study Adelaide Brand Health
international education industry in Australia. The strong           survey, is to:
value of the dollar made Australia more expensive as a
study destination, and changes to the Skilled Migration                -   build a quality, enriched international student
program, the Student Visa program, work rights post-study,                 experience and meet student needs
and negative press about international student treatment               -   increase international student engagement and
continued to deter some prospective students. ABS data                     build an active student community
published at the end of the year showed education as an
export for Australia was valued at $15.8 billion in 2010-11,           -   create activities and opportunities for interaction
a 15 percent decrease compared to 2009-10.                                 specifically for international students to foster
                                                                           friendships, find support groups and build
                                                                           confidence
At the end of 2011, TAFE SA had 164 courses registered for
delivery to international students including 23 new courses            -   provide insights into international student
at all levels ranging from Certificate II, III and IV to Diploma,          experiences, wants and needs to aid TAFE SA
Advanced Diploma and Bachelors, in areas of Advertising,                   strategic planning of student support, recruitment
Automotive, Banking, Business, Children’s Services,                        and marketing
Hospitality, Information Technology, Language                          -   develop ambassadors into advocates for TAFE SA
Development, Mining, Sport and Recreation, Tourism and                     through the provision of personal development
Veterinary studies.                                                        opportunities.

Most TAFE SA international students who complete a                  The program also harnesses the power of word of mouth
program at TAFE SA continue on to further degree studies            recommendations for recruitment. A survey of current
at one of the local universities. TAFE SA programs provide          TAFE SA international students indicated that almost
an excellent bridge for transition into undergraduate               50 percent of TAFE SA’s students hear about TAFE SA
degrees.                                                            through word of mouth from family and/or friends,
                                                                    indicating that word of mouth and personal
                                                                    recommendations are powerful international student
                                                                    recruitment tools.


                                                                                                                         Page 73
International Student Ambassador Blog                          Some examples of these efforts include:

Since its introduction in early 2011, the International        TAFE SA presence on Facebook
Student Ambassador blog continued to be popular,
recording more than 49 000 views. Web analysis shows           The TAFE SA International Facebook page now has more
that viewers spend a substantial time on the blog page and     than 24 000 ‘likes’ or ‘fans’. This places TAFE SA
move from this page to viewing the rest of the website,        International at number seven in the top 10 highest
including TAFE SA course information. The blog continues       Facebook fans of university and VET providers in Australia.
to act as an important recruitment tool, introducing           TAFE SA is the only VET provider in the top ten.
potential students to real student experiences and
harnessing word of mouth recommendations and the               Short Marketing Films
authentic voice of international students.
                                                               In 2011, TAFE SA undertook the development and
                                                               production of a suite of short marketing films for
                                                               recruitment purposes. The real student experiences of the
                                                               TAFE SA International Student Ambassador team were
TAFE SA identity on QQ.com                                     chosen as the focus of these films.
QQ.com (the Chinese equivalent to Facebook) now
incorporates a TAFE SA identity to recruit students. A
TAFE SA staff member is available on QQ each week to
communicate with potential students in Mandarin. This has      TAFE SA has a strong commitment to its international
led to a significant number of students being recruited        students, ensuring a comprehensive suite of services is
through this channel since the QQ platform was launched.       provided to meet their educational, personal and
                                                               community needs. Some examples of this work include:
In 2011, TAFE SA pursued an aggressive growth strategy
that saw a changed focus from overseas travel in favour of     International Student Aid
a greater emphasis on digital (online) marketing, increasing
marketing reach to over 163 countries.                         A number of aid and scholarship programs continued to
                                                               work with TAFE SA to support students who would not
                                                               normally have the opportunity to study a vocational
Overseas travel was biased towards ensuring that growth        education program in Australia. In 2011:
was aggressive yet balanced and the composition of
overseas students diversified. TAFE SA participated in            -   Eighteen students were sponsored by the Saudi
various country recruitment exhibitions and agent events              Arabian Cultural Mission to study English, Nursing
across a total of nine regions including China, Vietnam,              and Business Studies
South Korea, Malaysia, Philippines, Hong Kong, Taiwan,
Thailand and Latin America.                                       -   Nine students were supported by the Australian
                                                                      Agency for International Development (AusAID)
                                                                      scholarships from Laos, Timor-Leste, Papua New
The greater emphasis in digital efforts resulted in students          Guinea and the Solomon Islands to study
from nine new country regions including Armenia, Congo,               Geoscience, Tourism, Human Resource
Israel, Mauritius, Nigeria, Russian Federation, Slovakia,             Management, Food Technology and Children’s
Uganda and the Ukraine. TAFE SA also experienced an                   Services
increase in the number of students from Saudi Arabia
purely from digital marketing efforts.                            -   Seven students from Indonesia, Bhutan, Laos,
                                                                      Nepal, Papua New Guinea, and Pakistan received
                                                                      Endeavour Awards to study Veterinary Nursing,
                                                                      Engineering, Community Services, Automotive
                                                                      Technology and IT
                                                                  -   Becas Chile sponsored two students to study
                                                                      Frontline Management and Mining programs.


Page 74
OUR PERFORMANCE


International Student Services                                  provide a more direct engagement between the
                                                                universities and TAFE SA; this enhanced the quality and
The Admissions staff attend to all prospective student          credibility of the programs being delivered at the University
enquiries about the application process, programs and           of Industry in Hanoi and in Ho Chi Minh City.
transition to life in Adelaide, and specialised welfare staff
guide students through their study by ensuring they are
suitably orientated to their new environment, have the          TAFE SA also engaged with Austraining International
support they need through their studies to reach their          Pty Ltd, partnering in bids for AusAID-funded projects for
potential, and have many opportunities to engage with           two significant programs in East Timor and Kiribati. The East
their colleagues and the broader Adelaide community.            Timor project involved delivery of trade expertise for local
                                                                East Timor trainers through a series of visits by highly skilled
                                                                TAFE SA trade lecturers. The objective of the project was to
                                                                build the capacity of East Timor to deliver its own skills
Student Events                                                  training and therefore strengthen their capacity to rebuild
In 2011, international students participated in a broad         infrastructure and enhance the skills of the local population.
range of social and interactive events including Karaoke,
Love Adelaide International Dinners, International Students     In 2011, the Kiribati Technical VET Strengthening Program
Parties, Dance and Open Mic competitions, Ice Skating,          saw nine short-term advisers from TAFE SA living in Kiribati
Victor Harbor Team Building, Deep Creek Conservation            in 2011 for periods of approximately 40 days each visit.
Park bush walks, The Amazing Great Race, Orientation BBQ        They provided expertise in educational programs of
with Multicultural Youth South Australia, Lawn Bowls,           carpentry, auto mechanical, electro-technology,
Volleyball, and City and Precinct bus tours. These events       accounting, business administration, information
promote social interactions and provide opportunities for       technology and English language. Other advisers provided
students to participate in off-campus activities, meet other    expertise in Technical VET Policy and Apprenticeship Policy.
students including domestic students and expand their           This program is set to grow in 2012 to include auspicing
social networks.                                                arrangements and extend through to 2015.

                                                                There have also been a number of other smaller AusAID-
Study Tours                                                     funded projects in Samoa and Tonga operated through
                                                                TAFE SA’s Justice Department and Hospitality sector, which
As well as recruiting students to study full award programs,
                                                                have been successful and provide further evidence of
TAFE SA attracts numerous groups each year for short
                                                                TAFE SA’s ability to provide meaningful and quality
study tours that provide an exciting combination of cultural
                                                                engagement with international organisations to build
and educational experiences which are delivered across
                                                                capacity.
the state. These tours take advantage of the beautiful and
amazing sights that South Australia has to offer, blended
with state-of-the-art facilities and industry trained           The collaborations with Austraining International Pty Ltd
educational expertise at TAFE SA. In 2011, the Regency          across a variety of activities demonstrates TAFE SA’s capacity
campus hosted two study tours from Kia Ping and Tam Shui        to provide a broad range of services across a complex
Vocational Culinary Colleges in Taiwan. Set to grow             variety of disciplines in a timely and effective manner.
significantly in 2012, study tours from Korea, Taiwan, Hong     Continued engagement with similar types of projects in the
Kong, Indonesia and India have already been confirmed.          future will further enhance TAFE SA’s reputation at local,
                                                                national and international levels.
TAFE SA engaged with universities, colleges and
government to deliver programs in the areas of business,        The TAFE SA Legal and Justice Studies program travelled to
hairdressing, hospitality, information technology, nursing      New Zealand to deliver a one week Train the Trainer
and tourism to over 1000 students across Asia in countries      Program for judicial trainers from the Pacific Forum Island
including Vietnam, China, Sri Lanka, Hong Kong and              Countries. This is an AusAID-funded initiative as part of the
Singapore. Auspicing arrangements continue to deliver           Pacific Judicial Development Program. Justice and Policing
AQTF-accredited programs to hundreds of students in             Studies (part of TAFE SA’s Legal and Justice Studies
Vietnam in the areas of banking, business and information       program) have won a contract with the Australian
technology. The management of these auspicing                   Commonwealth Court to deliver three one-week Train the
arrangements were significantly modified during 2011 to         Trainer programs interstate.


                                                                                                                        Page 75
The year 2011 also provided the opportunity to conduct an                        EDUCATION AND TRAINING
 extensive review that led to significant changes in how                          Education and training is vital for sustaining a strong
 transnational business operates at TAFE SA.                                      workforce with solid economic growth and rising living
 Recommendations from the review led to more stringent                            standards. Education and training is designed to improve
 management of transnational education and improvement                            worker productivity and skill relevance, which in turn leads
 of processes to mitigate risk and increase quality of future
                                                                                  to greater economic production3.
 offshore projects. This renewed focus on quality
 management ensures compliance to requirements,
 protection for students’ rights, ensures programs meet                           Non-school qualifications
 expectations, and the department’s reputation as a quality
 provider of vocational education is strengthened. All                            Data shows that the proportion of people with non-school
 Transnational Business processes and procedures                                  qualifications is growing, in South Australia and for
 (including due diligence, contract management and quality                        Australia as a whole, and that the South Australian level has
 assurance) have been or are in the process of being revised                      been gradually approaching the national level. The gap
 to ensure more robust management.                                                has narrowed from 4.2 percentage points in 2001, to
                                                                                  3.5 percentage points in 2011. In 2010, the gap was
                                                                                  2.4 percentage points.
 Plans for 2012
 The department will continue to monitor national reforms
 in both vocational and higher education in terms of quality
 assurance, qualification frameworks, funding models and
 international education, responding to and driving the
 agenda as appropriate.

 The department, in partnership with Education Adelaide
 continues to build the reputation of South Australia as an
 international education destination, ensuring international
 students receive a quality education and have a positive
 experience in South Australia.


Figure 14: Proportion of the labour force withof the labour force with non-school qualifications,
                                  Proportion non-school qualifications, South Australia and Australia
                                                               South Australia and Australia
                        65


                        60
             Per cent


                        55


                        50


                                                                                                                                                   Source:
                        45
                             2001    2002     2003      2004     2005     2006       2007    2008      2009     2010      2011
                                                                                                                                        ABS Cat No 6227.0
           South Australia   49.1    51.1     51.1      54.9     52.9      54.1      55.5     56.6     58.1      58.9     58.5
           Australia         53.3    54.5     55.0      57.0     56.9      58.2      58.1     59.3     60.3      61.3     62.0


3
    The Allen Consulting Group (2004). The Vocational Education and Training System: Key Issues for Large Enterprises. A report prepared for the Business
    Council of Australia


Page 76
OUR PERFORMANCE

The proportion of people aged 20-64 who did not have qualifications at Certificate III level or above has been declining in
South Australia and for Australia as a whole with the gap between the South Australian and national levels remaining
relatively the same. In South Australia, the population aged 20 to 64 who did not have qualifications at Certificate III level or
above has declined from 62.6 percentage points in 2001 to 49.4 percentage points in 2011.


                  Figure 15: 20-64 year old population without qualification at Certificate III level or above


                                                                                                                                        Source: ABS Cat No 6227.0


Vocational education and training
The VET participation rate of the South Australian working population, aged 15 to 64 years, has remained fairly constant
since 2003. In 2010, the South Australian participation rate was 0.6 percentage points lower than the national rate.


                    Figure 16: VET participation rates, South Australian and Australia
                                                          VET participation rates, South Australia and Australia
                                      14


                                      13


                                      12
                           Per cent


                                      11


                                      10


                                       9


                                       8
                                            2001   2002      2003     2004     2005       2006     2007     2008     2009     2010
                          South Australia   13.0   13.2       11.4    11.3     11.3       10.9     11.1     11.2     10.9     11.0
                          Australia         12.2   12.2       12.2    11.3     11.4       11.4     11.3     11.3     11.1     11.6


                                                                 Source: (Commonwealth) Department of Education, Employment and Workplace Relations (DEEWR),
                                                                               Annual National Report of the Australian Vocational and Technical Education System,
                                                                                      National Centre for Vocational Education Research (NCVER), ABS Cat No 3201.0


                                                                                                                                                       Page 77
3.9 National Contributions
DFEEST Strategic Plan Goals 4 and 7


DFEEST plays an active role in engaging with the
Commonwealth government to achieve positive outcomes
for the state.


NEGOTIATIONS FOR THE NEW NATIONAL AGREEMENT                   ACCESS AND PARTICIPATION PRINCIPAL COMMITTEE
AND NATIONAL PARTNERSHIPS
                                                              The Access and Participation Principal Committee (APPC)
Negotiations have commenced with the Commonwealth             has lead responsibility ‘to provide advice on matters relating
and other state and territory governments for a new           to impediments to access tertiary education and
National Agreement for Skills and Workforce Development       employment particularly amongst disadvantaged groups
(NASWD) and associated National Partnership (NP) to           and consider strategies to increase participation in tertiary
replace the current Agreement and NPs. The revised            education and employment’.
NASWD, to be considered by COAG in early 2012, will
provide the direction and framework for training and skills   In 2011, the APPC’s advice to national training and
development over the coming years, and emphasise joint        employment senior officers and Standing Council on
accountability of the states, territories and the             Tertiary Education, Skills and Employment (SCOTESE)
Commonwealth in meeting clear and transparent targets.        included:

Subject to endorsement by COAG, the new NASWD and                -    Development of national principles and priorities
NP will implement a national training entitlement to                  for VET equity policy and funding, including
increase participation in training leading to employment;             consideration of the needs of regional and remote
improve industry engagement and VET information                       communities, through working with the National
transparency; support disadvantaged learners; improve                 VET Equity Advisory Council, an independent
foundation skills; promote better consumer information                advisory body to national ministers, on improving
(including through the national MySkills website); maintain           outcomes for equity groups in VET
support for the public provider; strengthen enterprise           -    Working with the Commonwealth to improve
workforce skills and development and improve pathways                 employability of low-skilled individuals through
across the tertiary sector.                                           identifying barriers to joined up employment
                                                                      services and training provision
Linked reforms include external accreditation of registered      -    Commissioning independent research on support
training providers by the national regulator and the                  models to assist disadvantaged groups that
introduction of an income-contingent loans scheme for                 informed the APPC’s advice on best practice in
people undertaking further training at the diploma and                wrap-around service delivery for at-risk groups
advanced diploma level. Work is also progressing on
longer-term goals such as the introduction of a national         -    Approving the National Foundation Skills Strategy.
Unique Student Identifier, improved partnerships between
Job Service Australia and Disability Employment Service
providers, and closer harmonisation of the Australian
Apprenticeship system.

Plans for 2012
South Australia has commenced a number of the reforms
covered by the new NASWD and NP, and will seek to link
Commonwealth government funding to progress towards
reform goals and ensure a continuous funding stream for
current and future training commitments.


Page 78
OUR PERFORMANCE


NATIONAL PARTNERSHIP AGREEMENT ON                               NATIONAL PARTNERSHIP ON YOUTH ATTAINMENT AND
PRE-APPRENTICESHIP TRAINING                                     TRANSITIONS
South Australia secured $3.6 million in Commonwealth            Through the National Partnership on Youth Attainment
funding in 2010-2011 under the National Partnership             and Transitions (NPYAT), agreed by COAG in July 2009,
Agreement on Pre-Apprenticeship Training between the            governments are working collaboratively to better engage
Commonwealth and South Australian governments to                young people in education and training; achieve
deliver the Apprentice Kickstart Pre-Apprenticeship (AKPA)      improvements in the numbers of young people making
project. The project, which concluded in November 2011,         successful transitions from schooling into further education,
primarily targeted school leavers and Indigenous job            training or employment; and lift qualification levels.
seekers and aimed to increase the number of apprentices in
skills shortage areas through pre-apprenticeship training.      The South Australian Implementation Plan, outlining how
                                                                South Australia will implement the NP, was agreed in
Through the AKPA project, 604 participants commenced a          March 2010 and the Minister for Employment, Higher
pre-apprenticeship course – exceeding the DEEWR                 Education and Skills and the Minister for Education and
requirement of 500 commencements by 20.8 percent. Nine          Child Development are jointly responsible for this plan.
registered training organisations delivered 44 courses
during the life of the project, with 418 participants           Two key outcomes of the NPYAT are to achieve a national
successfully completing the training. As a result of the AKPA   Year 12 or equivalent attainment rate of 90 percent by
project, 174 participants gained an apprenticeship, while       2015, and to provide an education or training entitlement
an additional 81 gained employment.                             to young people aged 15 to 24 (initially referred to as the
                                                                ‘Youth Compact’). DFEEST and DECD have collaborated to
                                                                implement the Youth Compact, and have especially
                                                                concentrated on increasing the range of opportunities for
                                                                young people to take up training programs either as part of
                                                                their schooling or as a full-time student at TAFE SA. Out of
                                                                this collaboration has evolved the Training Guarantee for
                                                                SACE Students scheme, a program within Skills for All,
                                                                through which senior secondary students are supported to
                                                                commence Certificate III completion pathways as part of
                                                                their schooling program, and finish their studies when they
                                                                leave school.

                                                                A trial of the scheme commenced on 1 July 2011 with a
                                                                little over 200 students participating in a range of TAFE SA
                                                                programs (at Certificate II and III levels).

                                                                Plans for 2012
                                                                The trial is being extended from 1 January 2012 to include
                                                                selected private providers, with in excess of 600 students
                                                                anticipated to be involved. The scheme will be fully rolled
                                                                out from 1 July 2012.


                                                                                                                     Page 79
TRANSITION TO NATIONAL REGULATION FOR HIGHER                     NATIONAL BOARD/COMMITTEE PARTICIPATION
EDUCATION AND VOCATIONAL EDUCATION
                                                                 DFEEST has representation on 14 national committees to
South Australia is in the process of transitioning to national   continue engagement with the Commonwealth
regulation for both vocational education and higher              government. These committees are:
education.
                                                                   -    Access and Participation Committee
On 1 July 2011 the Commonwealth Vocational Education               -    Commonwealth State and Territory Advisory
and Training (VET) Regulator Act 2011 came into effect                  Council on Innovation
and ASQA commenced operations. To enable ASQA                      -    Data and Performance Measurement Principal
jurisdictional operation in South Australia, the state                  Committee
government was required to refer its regulatory powers to
the Commonwealth. As a result, the Vocational Education            -    Flexible Learning Advisory Group
and Training (Commonwealth Powers) Bill 2011 was                   -    Higher Education Standards Panel
introduced into State Parliament late in 2011 and the Bill is
expected to be passed in early 2012.                               -    Joint Committee on International Education
                                                                   -    Ministerial Council for Tertiary Education and
The year 2011 was also the final year of the state’s role in            Employment
regulating higher education (other than universities which              now Standing Council on Tertiary Education, Skills
are self-accrediting). From 2012, regulating higher                     and Employment
education will be undertaken by the national regulatory            -    National Broadband Network Liaison Group
body, TEQSA, which was also established in July 2011
following passage of the Commonwealth’s Tertiary                   -    National Centre for Vocational Education Research
Education Quality Standard Agency Act.                             -    National Centre for Vocational Education Research
                                                                        - Audit Committee
Once the Vocational Education and Training                         -    National Resources Sector Employment Taskforce
(Commonwealth Powers) Bill 2011 passes the South
Australian Parliament, the process to transfer all regulatory      -    National Senior Officials Committee
activity to ASQA will commence and is expected to be               -    National Skills Standards Council
completed by 30 June 2012.
                                                                   -    Tertiary Education, Quality and Pathways Principal
                                                                        Committee.


Page 80
OUR PERFORMANCE


                                               Zoe Dick -
                                      Trainee of the Year
                  2011 South Australian Training Awards


                                            Page 81
Page 82
SECTION FOUR
          CORPORATE GOVERNANCE
          AND REPORTING


Page 83
4.1 Ministerial Accountability                               4.2 Legislation


The Minister is accountable to the South Australian public   As at 31 December 2011, the department was responsible
for the delivery of efficient and effective services that    for administering the following legislation:
respond to training, employment and workforce needs.
                                                               -   Construction Industry Training Fund Act 1993
                                                               -   Construction Industry Training Fund Regulations
                                                                   2008
CURRENT ACCOUNTABILITY                                         -   Flinders University of South Australia Act 1966
Hon Tom Kenyon MP                From 22 October 2011          -   Public Corporations (Bio Innovation SA)
                                                                   Regulations 2001
Minister for Employment, Higher Education and Skills
                                                               -   Public Corporations (Education Adelaide)
Minister for Science and Information Economy
                                                                   Regulations 1998
                                                               -   Public Corporations (Playford Centre) Regulations
                                                                   1996
PREVIOUS ACCOUNTABILITY                                        -   Technical and Further Education Act 1975
Hon John Snelling MP        25 Mar 2010 – 21 Oct 2011          -   Technical and Further Education Regulations 1999
                                                               -   Technical and Further Education (Vehicles)
Minister for Employment, Training and Further Education
                                                                   Regulations 1998
Minister for Science and Information Economy
                                                               -   Training and Skills Development Act 2008
Hon Tom Kenyon MP           23 Jun 2011 to 21 Oct 2011         -   Training and Skills Development Regulations 2008
Minister Assisting the Minister for Employment, Training       -   University of Adelaide Act 1971
and Further Education                                          -   University of South Australia Act 1990

Hon Jay Weatherill MP        8 Feb 2011 to 21 Oct 2011
Minister for Science and Information Economy


Page 84
CORPORATE GOVERNANCE AND REPORTING

4.3 Board, Committees and Authorities


BOARDS, COMMITTEES AND AUTHORITIES
ADMINISTERED BY DFEEST


Training and Skills Commission                                 Office of the Training Advocate
The Training and Skills Development Act 2008 establishes       The Office of the Training Advocate provides a public
the TaSC and outlines its functions.                           contact point to respond to questions or complaints about
                                                               the training system.
The current commission, appointed on 1 September 2010,
has nine members and two deputy members appointed by           In this context the training system comprises higher
the Governor. It is chaired by Mr Adrian Smith, who has        education, VET, apprenticeships and traineeships, adult
been a commission member since 2003.                           community education and education services for overseas
                                                               students.
The commission is the peak advisory body to the state
government on skills and workforce development priorities,     The office is an independent statutory authority established
and is responsible for the preparation and annual update       under the Training and Skills Development Act 2008 and
of a Five-Year Plan for Skills and Workforce Development in    operates in accordance with a Charter of Functions. These
South Australia. The plan is the principal instrument by       functions are designed to enhance consumer protection
which the commission provides its advice to the Minister for   by improving access and effective participation in
Employment, Higher Education and Skills.                       employment and skill formation opportunities, and to
                                                               contribute to strategies which raise the quality and
In developing its advice to the Minister the commission is     responsiveness of the training system in South Australia.
required, under the Act, to consult with a wide range of       The functions are established to:
stakeholders, including groups representing industry,             -   promote employment, education and training
employees, education and training providers, industry skills
boards and training advisory bodies, government and the           -   provide independent complaint handling
community.                                                        -   provide advocacy

Digital Economy Strategy Group                                    -   provide information and advice
                                                                  -   monitor the training system.
The Digital Economy Strategy Group oversees the
government’s role in the activities resulting from the
Genevieve Bell report, the Digital Economy Strategy Group
(DESG) was created. The group provides strategic input
and direction to the Minister for Science and Information
Economy on ways to position the state to take maximum
advantage of the digital economy


                                                                                                                    Page 85
Premier’s Science and Industry Council                           BOARDS AND COMMITTEES REPRESENTED BY DFEEST
(formerly the Premier’s Science and Research Council)
                                                                 DFEEST has representation on the following state
The Premier’s Science and Research Council was established       committees to continue its engagement with industry,
by the government in 2002 to provide independent advice          tertiary education providers, science and research
on strategies to optimise the contribution of the state’s        institutions and digital economy institutions.
capabilities in science, research and innovation to South
Australia’s overall development.                                   -    Aboriginal Employment Industry Champions
                                                                        Network
Under the leadership of the Council’s Co-Chair, Chief              -    Bio Innovation SA
Scientist Adjunct Professor Don Bursill, the Council re-           -    Chief Executives Group on Aboriginal Affairs
examined its previous practices and priorities during 2011
and set an agenda for the future that focuses more clearly         -    COAG Implementation Reporting and Evaluation
on developing the state’s science and research capabilities in          Group
the critical area of adaptation to industry. This is in            -    Education Adelaide
accordance with the recommendations to revitalise
manufacturing as proposed by the ‘Thinker in Residence’            -    Education Adelaide - Audit Committee
Professor Göran Roos and in the establishment of the               -    Every Chance for Every Child Senior Officers Group
Department for Manufacturing, Innovation, Trade,
Resources and Energy. The Council has also taken steps to          -    Government Planning and Coordination Group
link its activities more closely with the program of the           -    Green Futures
Economic Development Board in line with the change
                                                                   -    Higher and Further Education Task Group
of emphasis.
                                                                   -    InnovateSA Board
Now known as the Premier’s Science and Industry Council, it        -    Invest SA Board
better reflects current South Australian government priorities
                                                                   -    Maritime Skills Centre
on industry engagement.
                                                                   -    Resources and Engineering Skills Alliance
Science, Technology, Engineering and Mathematics                   -    SABRENet
Executive Reference Group
                                                                   -    SACE Review Implementation Steering Committee
The Science, Technology, Engineering and Mathematics
(STEM) Executive Reference Group was established in 2011           -    SA NBN Taskforce
to oversee the implementation of the whole-of-government           -    Senior Management Council
STEM Skills Strategy. The reference group is responsible for:
                                                                   -    South Australian Tertiary Admissions Centre
   -   making joint decisions on the funding of new or             -    Southern Suburbs Coordination Group
       continuing STEM programs
                                                                   -    Teach SA Reference Group
   -   making recommendations to Cabinet on policies
       and programs to improve the supply of South                 -    Teacher Education Taskforce
       Australians with STEM skills                                -    Training Guarantee for SACE Students
   -   monitoring and reporting annually against STEM                   Reference Group
       goals and targets.                                          -    University Aspiration Project Advisory Committee

The reference group is chaired by Mr Raymond Spencer,
Chair of the Economic Development Board, meets every
two months, and is administratively supported by
the department.


Page 86
CORPORATE GOVERNANCE AND REPORTING

4.4 Governance


DFEEST CORPORATE GOVERNANCE
The department’s corporate governance obligations are            Budget and Finance Executive Committee
prescribed in the Public Sector Act 2009 and the Technical
                                                                 The Budget and Finance Executive Committee is an expert
and Further Education Act 1975. These Acts establish
                                                                 committee providing financial governance over the
general management aims, personnel management and
                                                                 department's resources. The committee monitors the
employee conduct standards. The Chief Executive of the
                                                                 department's performance against fiscal targets for the
department is responsible for observance of these aims
                                                                 current financial year. It regularly reviews the department's
and standards.
                                                                 financial strategies and the performance of the current
                                                                 year’s operating and capital budgets. It considers options
The department maintains a governance framework that             and advises the Chief Executive on the department's
integrates strategic management, leadership and                  financial strategies and options to mitigate budget risk in
accountability in the way it manages its people and              the current financial year.
resources to achieve the best performance of its functions.
                                                                 Information and Communications Technology Strategy
In 2011 the department’s governance structure                    Committee
encompassed the following:
                                                                 The purpose of the Information and Communications
                                                                 Technology Strategy Committee is to set the department’s
Corporate Executive
                                                                 strategic directions for Information and Communications
Corporate Executive is a high-level decision-making and          Technology, to monitor the implementation of Information
leadership group in the department. Its primary role is to       and Communications Technology strategies across the
ensure the successful achievement of the department’s            agency, to drive value for money in Information and
strategic planning and portfolio outcomes and it has             Communications Technology investment and to ensure
responsibility for maintaining the effectiveness of these        compliance to the Information and Communications
governance mechanisms.                                           Technology governance framework.

Executive Forum                                                  Infrastructure and Facilities Strategy Committee

Executive Forum consists of the executive leaders                The Infrastructure and Facilities Strategy Committee
responsible for the achievement of departmental objectives.      provides strategic guidance for the integrated planning
The forum also has a role in providing strategic discussion,     and management of all government-owned infrastructure
collaboration and shared vision for the agency.                  requirements across the department, and the development
                                                                 of strategic infrastructure plans for its portfolios.
Audit and Risk Management Committee
The Audit and Risk Management Committee provides
assurance and assistance to the Chief Executive to
undertake his statutory responsibilities; this committee is an
integral part of the department’s framework
for governance.


                                                                                                                       Page 87
Occupational Health and Safety Committee                          TAFE SA GOVERNANCE
The Occupational Health and Safety Committee provides             TAFE SA Interim Board
leadership in Injury Prevention and Injury Management for         The TAFE SA Interim Board was established in July 2011 to
the department’s directorates and contributes to the              prepare TAFE SA for new governance arrangements as a
establishment, implementation, monitoring and review of           statutory authority. The key responsibilities for the board
Injury Prevention and Management Systems                          come from the framework set out in Public Corporations Act
within directorates.                                              1993, section 12. In particular:

The committee works collaboratively and within the strategic         -    performance of commercial operations in
guidance of the department’s Strategic Occupational Health,               accordance with prudent commercial principles and
Safety and Injury Management Committee.                                   use of best endeavours to achieve a level of profit
                                                                          consistent with its functions
People and Culture Committee                                         -    efficient and effective performance of non-
                                                                          commercial functions in accordance with the
The People and Culture Committee provides strategic
                                                                          Ministerial Charter.
guidance for the prioritisation, planning and management of
all organisational development requirements across the
department and the implementation of the People and               The board comprises members of the DFEEST Corporate
Culture Plan.                                                     Executive, a senior representative from the Department of
                                                                  Treasury and Finance and three external members.
Strategic Procurement Committee
                                                                  TAFE SA Institute Councils
The Strategic Procurement Committee oversees procurement
operations within the department to advance the State             The TAFE SA Institute Councils are established by the Minister
Procurement Act objective of advancing government                 for Employment, Higher Education and Skills for each of the
priorities by a system of procurement for public authorities      three institutes of TAFE SA under the Technical and Further
directed towards:                                                 Education Act 1975. The councils advise, monitor
                                                                  performance and provide supplementary funding for the
   -   obtaining value for money in the expenditure of
                                                                  institutes’ operations.
       public money
   -   providing for ethical and fair treatment                   TAFE SA Executive
       of participants
                                                                  TAFE SA Executive is the peak decision-making body for all
   -   ensuring probity, accountability and transparency in       strategic issues relating to TAFE SA. Membership consists of
       procurement operations.                                    the Chief Executive, Office of TAFE SA and the three institute
                                                                  Managing Directors.
Sustainable Industries Education Centre Board
The Sustainable Industries Education Board oversees the SIEC      TAFE SA Adelaide North Institute Executive
project which is the development of a Sustainable Industries      Management Team
Education Centre on the Land Management Corporation
managed development at Tonsley Park. It includes all              The TAFE SA Adelaide North Institute Executive Management
associated capital developments, divestments, program             Team is responsible for supporting the role, function and
movements and realisation of operating savings required to        responsibilities of the Managing Director.
deliver the benefits of the SIEC business case in an efficient,
cost-effective and timely manner.                                 TAFE SA Adelaide South Institute Executive Committee
                                                                  The TAFE SA Adelaide South Institute Executive Management
                                                                  Team is responsible for the development of business strategy,
                                                                  direction and monitoring the performance of the institute
                                                                  and responsibilities and function of the Managing Director.

                                                                  TAFE SA Regional Executive Operations Committee
                                                                  The TAFE SA Regional Executive Operations Committee
                                                                  supports the Managing Director, TAFE SA Regional in the
                                                                  execution of the role, functions and responsibilities of the
                                                                  position. It is the peak decision-making body of the institute.


Page 88
CORPORATE GOVERNANCE AND REPORTING

4.5 Asbestos Management in                                       4.8 Freedom of Information
Government Buildings
                                                                 The Freedom of Information Act 1991 (the Act) confers on
Asbestos management reporting has been modified. As              each member of the public a legally enforceable right to be
such, each agency is now required to provide asbestos            given access to documents held by the government, subject
management information to the Department of Planning,            only to such restrictions as are reasonably necessary for the
Transport and Infrastructure (DPTI), which will be               proper administration of the government and the
incorporated into an annual across-government report on          preservation of personal privacy. It also enables members of
asbestos management. There is no longer a need to report         the public to apply for the amendment of records
on asbestos management in agencies’ annual reports.              concerning their personal affairs if the records are
DFEEST complied with this modification and forwarded its         incomplete, incorrect, misleading or out of date.
asbestos management report on to DPTI in October 2011.
                                                                 The structure and functions of the department are described
                                                                 elsewhere in this report.

                                                                 These functions affect the public through the direct delivery
4.6 Carers Recognition Act 2005                                  of the education, training, and employment services, as well
                                                                 as through the purchase of such services from private and
DFEEST promotes the Carers Recognition Act 2005 and the          community providers; the accreditation of training courses;
Carers Charter on its intranet to ensure all employees have      the registration of training providers; the investigation of
an awareness and understanding of this information.              complaints about training organisations and accredited
Information is also incorporated into the new DFEEST online      courses; the management of contracts of training; facilitation
induction package. Communication occurs through Human            and development of the skills in the state; the
Resource units across the department and on intranet sites.      encouragement of science, technology and innovation-
                                                                 based industries; and the uptake and usage in the
                                                                 community of online technologies and other ways of
                                                                 enhancing the economy of South Australia.
4.7 Disability Action Plans
                                                                 The public can participate in the department’s policy
TAFE SA Disability Access Plans are now used for all students    development in a number of ways. Some of these ways
with a disability or medical condition who require additional    include membership of TAFE SA councils and other boards
support. This allows for consistency as well as the ability to   and committees, as well as responding to calls for public
track trends and ensure students do not have to reapply          consultation on particular issues.
when moving campuses. Provision has been made under
the SIS to greatly improve dissemination of information to       The department holds correspondence and administrative
students with disabilities in a much more timely fashion.        records including:
                                                                    -   personnel records
Ongoing improvements to physical access are constantly
monitored. In 2010-11, $100 000 in additional funding               -   accounts records
across TAFE SA was allocated for addressing items identified        -   payroll records
through the access audits conducted in 2009. Access
upgrades included improved toilet facilities and installation       -   supply records
of more electronic doors.                                           -   facilities management records
                                                                    -   students’ records in TAFE SA institutes
In addition, access improvements were made as part of
major works on the following campuses: Tea Tree Gully,              -   student services records
Whyalla, Victor Harbor, Regency and Adelaide City.                  -   records relating to accredited training courses
                                                                    -   complaints made about registered training
                                                                        providers and contracts of training
                                                                    -   contracts
                                                                    -   records relating to grants of funding
                                                                    -   surveys and statistics.


                                                                                                                      Page 89
Records are held in a variety of media including paper,        Public access to documents
microfiche and electronic formats. Information and
explanatory documents about courses, contracts of training,    The public can access documents and seek amendment to
course accreditation and training organisation registration,   documents under the Act.
youth services, science, innovation and information
economy are available free of charge from the                  An application under the Act must be made in writing,
following websites:                                            specifying that they are made under the Act, include an
                                                               address in Australia to which correspondence may be sent
   -   TAFE SA: www.tafe.sa.edu.au                             and be accompanied by the prescribed application fee. A
   -   Skills SA: www.skills.sa.gov.au                         waiver or remission of a fee applies in cases where the
                                                               applicant satisfies an agency that he or she is a concession
   -   Information on accreditation, registration and          card holder or the payment of the fee or charge would
       contracts of training, the South Australian             cause financial hardship to the person.
       traineeship and apprenticeship system:
       www.dfeest.sa.gov.au
                                                               Freedom of Information applications should be
   -   Higher Education accreditation: www.aqf.edu.au          addressed to:
   -   Adult Community Education grants:
       www.skills.sa.gov.au                                           Senior Consultant Freedom of Information, Privacy
   -   User Choice Policy located under the User Choice               and Intellectual Property
       submenu: www.training.sa.gov.au                                Legislation and Delegations Unit
                                                                      Department of Further Education, Employment,
   -   Training and Skills Commission guidelines:                     Science and Technology
       www.tasc.sa.gov.au                                             GPO Box 320
   -   Science, Innovation and Information Economy                    ADELAIDE SA 5001
       information: www.dfeest.sa.gov.au
   -   General DFEEST information: www.dfeest.sa.gov.au        Telephone enquiries can be made on (08) 8226 3276.


                                                               Access requests in 2011
                                                               During the 2011 calendar year, the department processed
                                                               42 Freedom of Information applications under the Act.


Page 90
CORPORATE GOVERNANCE AND REPORTING

4.9 Management of Human Resources


WORKFORCE DATA                                                       EMPLOYEE NUMBERS, GENDER AND STATUS
The following data is based on records from the Human                All data has been sourced from employer records. Unless
Resource Information System, Empower, for persons                    otherwise stated, data relates to the final pay period in June
identified as being employed on 30 June 2011.                        2011.

Hourly paid instructors are excluded from most data tables           The following tables depict the total number of employees
as they are employed under different conditions and                  including persons and Full-Time Equivalent (FTE)
reported accordingly. To combine hourly paid instructors’            employees.
data with regular staff information would result in data
distortion.


       Total number of employees

       Persons                                                     3 411
       Full-Time Equivalents                                       3 082.5
       As at 30 June 2011 excluding HPIs and casuals


       Gender                   Persons                % Persons               FTEs                 % FTEs
       Male                      1 312                     38.5               1 268.9                41.2
       Female                    2 099                     61.5               1 813.5                58.8
       Totals                    3 411                     100                3 082.5                100
       As at 30 June 2011 excluding HPIs and casuals


       Number of persons who were recruited to and separated from the
       department

       Separated from the department                                    393
       Recruited to the department                                      418

      Over Financial Year 2010-11 excluding HPIs and casuals


                                                                                                                           Page 91
Number of persons at 30 June 2011

           On Leave Without Pay                                                      140

           Excluding HPIs and casuals


           Age Bracket                  Female              Male               Total         % of Total           Workforce
                                                                                                                  Benchmark
           15 - 19 years                   5                   2                 7                0.2                  6.4
           20 - 24 years                  53                  13                66                1.9                 10.3
           25 - 29 years                  110                 55               165                4.8                 10.8
           30 - 34 years                  194                 89               283                8.3                 10.1
           35 - 39 years                  209                117               326                9.6                 10.1
           40 - 44 years                  274                140               414               12.1                 11.3
           45 - 49 years                  293                175               468               13.7                 11.5
           50 - 54 years                  377                241               618               18.1                 11.4
           55 - 59 years                  351                246               597               17.5                  9.2
           60 - 64 years                  184                182               366               10.7                  5.7
           Over 65 years                  49                  52               101                 3                   3.3
           TOTAL                        2 099               1 312             3 411              100                   100
          Source: Australian Bureau of Statistics Australian Demographic Statistics, 6291.0.55.001 Labour Force Status (ST LM8) total
          from Supertable, SA as at June 2010


          As at 30 June 2011 excluding HPIs and casuals


Page 92
CORPORATE GOVERNANCE AND REPORTING

Number of employees by salary bracket

 Salary Bracket                        Female           Male
 $1 - $50,399                             621           132
 $50,400 - $64,099                        321           142
 $64,100 - $82,099                        829           742
 $82,100 - $103,599                       279           252
 $103,600 +                               49            44
 As at 30 June 2011 excluding HPIs and casuals


 As at 30 June 2011 excluding HPIs and casuals


Number of executives by gender and classification

            Classification         Tenure         Female       Male
                       EM-C           Y             6           3
               EXEC ULE               N             0           1
                   SAES-1             N            15          11
                   SAES-2             N             2           4
                                          Total    23          19

  As at 30 June 2011


                                                                      Page 93
Status of employees in current position (excluding hourly paid instructors)


                              Ongoing             Short-Term          Long-Term              Other       Total
                                                   Contract*           Contract            (Casuals)

   Male                         1 132                 155                  25                 17         1 329
   Female                       1 714                 354                  31                 78         2 177
   Total                        2 846                 509                  56                 95         3 506

  * Short-term contracts are under two years; long-term contracts are over two years

  As at 30 June 2011 including casual employees


  Status of FTE employees in current position (excluding hourly paid instructors)

                         Ongoing             Short-Term          Long-Term             Other (Casuals)    Total
                                              Contract            Contract

   Male                  1 102.20              141.82               24.90                    5.1         1 274.0

   Female                1 484.79              300.54               28.20                   28.5         1 842

   Total                 2 586.99              442.36               53.10                   33.6         3 116


  As at 30 June 2011 including casual employees


  Hourly Paid Instructors

   In total, 1 849 individual hourly paid instructors (as 218.6 full-time equivalent) provided 209 864 teaching hours at a cost
   of $12.9 million.


Page 94
CORPORATE GOVERNANCE AND REPORTING

ABORIGINAL AND/OR TORRES STRAIT ISLANDER EMPLOYEES


       Male                 Female                   Total                    % of Agency           %Target*

        24                     41                    65**                         1.9                 2.0
*Target set by SASP

** as at 5 January 2012


APPRENTICES, TRAINEES AND CADETS

                                              Male                 Female
  Apprentices                                   1                      0
  Trainees                                      1                      7
  Cadets                                        0                      2


CULTURAL AND LINGUISTIC DIVERSITY

                                                               Male             Female      Total         % of      % SA
                                                                                                         Agency   Community

Number of employees born overseas                                92              148        240             7       20.3


Number of employees who speak                                    61               71        132             3.9     12.2
language(s) other than English at home

Benchmarks from ABS Publication Basic Community Profile (SA) Cat No. 2001.0

As at 30 June 2011 excluding HPIs and casuals


GRADUATE PROGRAM

                                             Male                  Female
 Graduates                                     8                       7


                                                                                                                              Page 95
NUMBER OF EMPLOYEES WITH AN ONGOING DISABILITY

 This table indicates the number of employees who have self-identified as having an ongoing disability.

      Male               Female                  Total         % of Agency

        16                  15                    31                0.9
 As at 30 June 2011 excluding HPIs and casuals


 NUMBER OF EMPLOYEES WITH A DISABILITY REQUIRING WORKPLACE ADAPTATION

      Male               Female                  Total         % of Agency
        3                    2                     5                0.15

As at 30 June 2011 excluding HPIs and casuals


 LEAVE MANAGEMENT
 The following table depicts the average days taken per FTE                There is a 2 percent increase in leave from 2009-10 to 2010
 (excluding hourly paid instructors and casuals) over the                  -11. A further investigation of the data reveals that
 2010-2011 Financial Year. Sick Leave is inclusive of Family               although there were more employees in 2010-11 who
 Carer’s Leave.                                                            took no sick leave, those who did take sick leave took
                                                                           slightly more sick leave. As DFEEST’s employee population
 The types of leave contained within Special Leave With Pay                ages, more employees are experiencing sickness that results
 include Paid Maternity Leave, Adoption Leave,                             in long-term absences. As a result, the average sick leave
 Miscellaneous Special Leave and Workers                                   per FTE increases.
 Compensation Leave.


                                                07-08       08-09          09-10         10-11

 Sick Leave                                      7.6         8.2            8.2           8.4

 Special Leave with Pay                          2.3         2.5            3.2           3.2

Average Leave Days taken per FTE over each Financial Year


Page 96
CORPORATE GOVERNANCE AND REPORTING

                                                                 The data below has been extracted from an employee
PERFORMANCE DEVELOPMENT
                                                                 climate survey, known as BULB. DFEEST is currently in the
A job capability framework was developed in 2011 to              process of developing a system to provide a fit-for-purpose
identify the essential capabilities required for DFEEST to be    performance coaching and professional development
a high-performing organisation. The framework describes          recording system that supports individual staff,
the competency requirements of: communication; positive          management and corporate needs. The new system will
working relationships; business excellence; achieve results;     be operational by the end of 2012, and provide an
strategic and operational thinking; and technical expertise.     accurate data set to facilitate statutory, tactical and strategic
Funding was then allocated to professional development           business intelligence needs.
activities that will build the capacity of staff at all levels
against the capability framework.                                Leadership and Management Training Expenditure
                                                                 Leadership and management training is funded across the
Performance Coaching                                             department by DFEEST Corporate Services, individual
DFEEST and TAFE SA placed a stronger focus on                    directorates and TAFE SA institutes. Funds are allocated to
performance development in 2011, commissioning a new             Capacity Building and programs of activity are negotiated
Performance Coaching Framework, which included a                 annually, based on the business needs and future
revised policy, procedure and supporting templates for           directions of the agency. DFEEST has a strong Leadership
TAFE Act, Public Sector Act and South Australian Executive       and Management Development Program that has specific
Service executives.                                              programs for management, leadership and executive
                                                                 development.
To support the rollout of the Performance Coaching
Framework, mandatory training commenced in October               The majority of TAFE SA employees are TAFE Act lecturers;
2011 and was delivered to DFEEST and TAFE SA executives          therefore staff development expenditure is spent
and line managers to assist in building the capability of our    predominantly in the areas of teaching and learning to
managers and leaders to hold the conversations that are          ensure lecturers have the relevant knowledge and skills to
essential to creating a performance culture.                     maintain educational and industry currency. An evaluation
                                                                 of lecturer capabilities in the areas of VET and industry
It was vital to the success of the performance coaching          currency commenced in 2010. This program will be
training that the rollout commenced at executive level.          finalised in all three institutes in 2012 and the resulting
Executive leadership and commitment to performance               evidence will inform development programs over the
coaching is critical to building a performance culture in        following two years.
DFEEST.

Training and Development                                                        Total Cost             % of Total Salary
                                                                                                        Expenditure
Total training and development expenditure                                     $3 731 587                      2

Total leadership and management development expenditure                         $294 603                      0.2


Accredited Training Packages
The accredited training packages in the table below are sourced from the Public Service Training Package.


Classification                          Number of Accredited Training Packages

ASO3 – ASO5                             PSP51104 - Diploma of Government

                                        BSB51407 - Diploma of Project Management (Capacity Building)

ASO6 and above – Leadership             BSB51107 - Diploma of Management
Development Program
                                        BSB61407 - Advanced Diploma of Management (Capacity Building)

ASO2 and above                          PSP40104 - Certificate IV in Government (DFEEST Graduate Program)

                                        BSB40807 - Certificate IV in Frontline Management (Capacity Building)

                                                                                                                           Page 97
Leadership and Management Capability Development System

Program                          # of           Development      Mentoring/coaching         Project
                             participants        workshops

                                                  1-2 day        Mentoring/coaching
Management                                                                                  Group
                                 17              workshops         by middle-level
Development Program                                                                         Project
                                                each month            manager

                                                  1-2 day           Mentoring by a
Leadership                                                                                  Group
                                 21              workshops           departmental
Development Program                                                                         Project
                                                each month             executive

Leadership Action                                                 Individual executive
                                              2 day workshops                              Individual
Learning Teams                   14                                coaching sessions
                                              every 6-8 weeks                                Project
Program                                                                   (six)

Total                            52


Management Development Program                                  Leadership Action Learning Teams Program
The Management Development Program is an accredited             The Leadership Action Learning Teams Program is aimed
learning program pitched at existing and next generation        at developing employees who have been identified as
managers. The aim of the program is to equip employees          high-potential future executives. It is aligned to the South
with operational management skills, such as how to deliver      Australian Executive Services competency framework. This
effective client services, how to manage resources, how to      program is based on implementing behavioural change
manage risk and change, increase understanding of               within participants through group and individual coaching.
government compliance, as well as how to                        It also provides each participant with the opportunity and
manage people.                                                  support to implement a strategic project in their work area.
                                                                The program is most suitable for those who already have a
Leadership Development Program                                  management qualification, or those who are seeking
                                                                coaching on their leadership style, as it is not aligned to
The Leadership Development Program is an accredited             a qualification.
program targeting both high-potential and current leaders.
It aims to equip participants with strategic thinking skills,
knowledge of how to facilitate change, increase
self-awareness of leadership behaviours, understand
how to engage and inspire people, as well as
comprehend the context of leading in the broader
South Australian government.


Page 98
CORPORATE GOVERNANCE AND REPORTING

Voluntary Flexible Working Arrangements

This table depicts the various components of voluntary    Staff employed under the TAFE Act and Weekly Paid Act
flexible working arrangements which are utilised by       are not entitled to utilise the full suite of Voluntary Flexible
departmental staff.                                       Working Arrangements available to Public Sector Act
                                                          employees.


                                                         Male          Female             Total
Purchased leave                                           1                0                1
Flexitime                                                207              599              806
Compressed weeks                                          3                7                10
Part-time job share                                       1               12                13
Working from home                                         3                6                9
Flexitime and working from home                           3                9                12
Flexitime and compressed weeks                            6                7                13
Flexitime and compressed weeks and working from
                                                          2                0                2
home
Flexitime and part-time job share                         0               20                20

Flexitime and part-time job share and working from
                                                          0                1                1
home

Flexitime and purchased leave                             1                4                5
Total                                                    227             665               892


                                                                                                                   Page 99
WORKPLACE HEALTH AND SAFETY
During the 2010-11 financial year, DFEEST continued to          Significant investment continued in 2010-11 for the
build upon and further improve previous years’ positive         TAFE SA machine management program with an extra
workplace health and safety results.                            $500 000 being allocated to fast-track safety outcomes
                                                                from the project. To date, approximately $3.5 million has
DFEEST’s Strategic Plan 2010-2014, Goal 7 DFEEST is a high      been spent on improving safety of plant and equipment so
-performance organisation states that DFEEST’s workforce        that students and staff are safe. Improvement was also
will have a healthy and safe environment in which to work.      achieved in the prevention of psychological injuries with
This is aligned to SASP Target 21 - Greater safety at work      only 12 new injuries compared to 22 in the previous year.
(achieve the nationally agreed target of 40 percent
reduction in injury by 2012), Target 13 - Work/life balance     The year 2011 saw DFEEST being critically assessed in
(improve the quality of life of all South Australians through   OHS&W and Injury Management with a WorkCover
maintenance of a healthy work/life balance) and Target 86       Evaluation. As a result of improvements and refinement of
- Psychological wellbeing (equal or lower than the              DFEEST’s management system, DFEEST was awarded
Australian average for psychological distress by 2014).         Level 2 under the Natural Consequences Model for Self-
                                                                Insurers. This achievement recognises that DFEEST has a
For the financial year, DFEEST’s performance in workplace       mature management system that is continually improving.
health and safety continues to significantly improve.
TAFE SA provides training in all high-risk industries and       There will be substantial challenges faced by DFEEST in
TAFE SA’s commitment to the safety and wellbeing of staff       2012 with the introduction of the pending Workplace
and students is held in the highest regard.                     Health and Safety Act, Skills for All reforms and the
                                                                establishment of TAFE SA as a Statutory Authority.
In the 2010-11 financial year, DFEEST recorded 55 new
injuries. This was a 32 percent reduction from the previous
financial year. Of the 55 new injuries there was a
24 percent reduction in those incurring lost time (25           WORKFORCE RELATIONS
injuries) compared to the previous year. Total costs of         A high level of industrial and employee relations advice and
workers compensation reduced by $408 174 (13 percent            support to management and human resource staff has
reduction) from the previous financial year.                    continued to be provided in an efficient and timely manner.

During 2011, DFEEST was again recognised at the
SafeWork SA Awards with Mr Jorgen Andersen winning              A total of 49 staff disciplinary or grievance-related matters
the category Best Individual Contribution to Workplace          were investigated with 43 being satisfactorily completed
Health and Safety. This is now the fourth time an employee      and the others still pending.
of DFEEST has won an occupational health, safety and
welfare (OHS&W) award and demonstrates the
commitment and contribution of DFEEST employees to a
safe work environment.


Page 100
CORPORATE GOVERNANCE AND REPORTING
                                                                                   *
 OCCUPATIONAL HEALTH, SAFETY AND INJURY MANAGEMENT

                                                                                             2010-11                  2009-10               2008-09

1    OHS Legislative Requirements (includes incidents involving students, contractors and visitors)

     Number of notifiable occurrences pursuant to OHS&W Regulations                    9 (2 from students & 4    11 (4 from students   7 (3 from students)
     Division 6.6                                                                         from contractors)          and 3 from
                                                                                                                     contractors)

     Number of notifiable injuries pursuant to OHS&W Regulations Division              5 (1 from student & 2         1 (student)               1
     6.6                                                                                 from contractors)

     Number of notices served pursuant to OHS&W Act s35, s39 and s40                   3 (1 from contractor)     4 (3 from students)     12 (relate to 4
                                                                                                                                           incidents)

2    Injury Management Legislative Requirements

     Total number of new claimants who participated in the rehabilitation                       24                       30                    23
     program
     Total number of employees rehabilitated and reassigned to alternative                       0                       2                     2
     duties
     Total number of employees rehabilitated back to their original work                         7                       6                     4


3    WorkCover Action Limits

     Number of open claims as at 30 June 2010                                                   123                     163                   182

     Percentage of workers compensation expenditure over gross annual                         0.0109                   0.0123               0.0137
     remuneration
4    Number of Injuries

     Number of new workers compensation claims in the financial year                            55                       81                    74

     Number of fatalities, lost time injuries, medical treatment only
                                          (F)                                                                            0                     0
                                                                                                 0
                                         (LTI)                                                                           33                    27
                                                                                                25
                                         (MTO)                                                                           48                    47
                                                                                                30

     Total number of whole working days lost                                                   6 397                   6 141                 8 198

5    Cost of Workers Compensation

     Cost of new claims for the financial year                                                        $439 273             $440 677                $417 802

     Cost of all claims excluding lump sum payments                                               $2 011 885             $1 957 661            $2 328 242

     Amount paid for lump sum payments (s42, s43, s44)                                                $691 886           $1 154 284                $726 837

     Total claims expenditure                                                                     $2 703 771             $3 111 945            $3 055 079

     Total amount recovered from external sources (s54)                                               $180 000             $147 937                   $0.00

     Budget allocation for workers compensation                                                   $3 000 000             $3 200 000            $3 200 000

     Actuarial (Outstanding) Liability                                                            $9 025 481             $8 091 903            $7 411 427

6    Trends
     **Injury frequency rate for new lost-time injury/disease for each million
                                                                                                4.6                      5.9                  4.9
     hours worked
     Most frequent cause (mechanism) of injury                                            Body Stressing           Body Stressing        Body Stressing

     Most expensive cause (mechanism) of injury                                            Mental Stress            Mental Stress        Mental Stress

* Occupational Health Safety and Injury Management Reporting is based on financial year as determined by the Australian Standard. Prior to 2006/07 re-
porting was based on Calendar Year as determined by the TAFE Act.
** Based on Lost Time Flag (i.e. ≥ 1 day or shift.
                                                                                                                                               Page 101
4.10 Reconciliation

The department works closely with Reconciliation SA and           The department’s commitment to working collaboratively
other South Australian government agencies to achieve             with Aboriginal communities to develop an updated
the government’s commitment to Reconciliation.                    Reconciliation Statement resulted in the signing and launch
                                                                  of the Reconciliation Statement by Kaurna Aboriginal
The department’s commitment was symbolised by                     Elders. The department further committed to distributing
employees placing their hand print on canvas during               copies of the signed and framed Reconciliation Statement
Reconciliation Week 2010. The “Future Generations”                and Acknowledgement banner to 18 TAFE SA campuses
canvasses, where employees’ children placed their hand            located within the recognised traditional Kaurna lands. As
print, were launched during Reconciliation Week 2011 as a         such, the department is engaging with recognised
gesture of an intention towards a collaborative journey to        traditional owners in areas where TAFE SA campuses are
unite in the true spirit of Reconciliation. The canvasses are     located.
displayed in the main reception area on Level 4,
11 Waymouth Street.                                               A new Reconciliation Action Committee was established to
                                                                  include a broader cross-section of employees and
The department facilitated a variety of cultural activities and   representation across all directorates to promote,
events to celebrate Aboriginal culture during Reconciliation      investigate and implement appropriate activities across the
Week 2011. Tauondi College hosted tours of its museum             department. The department committed considerable
for the department’s staff, which was an excellent                funds to build a culturally inclusive environment which will
opportunity to gain insight into Aboriginal culture and           promote decision-making that is inclusive of Aboriginal
history. Tauondi also provided ten pieces of student              people and to monitor the activities in the Reconciliation
artwork for the department to showcase. The department            Action Plan.
was extremely fortunate to host an Artist-in-Residence, with
staff afforded an opportunity to observe and interact with        Work continues on the Aboriginal Employment Strategy
the artist regarding his cultural background and artwork.         2010-2015 – Building a Culturally Inclusive Workforce
                                                                  which aims to increase the participation of Aboriginal
                                                                  people in the department’s workforce.


Page 102
CORPORATE GOVERNANCE AND REPORTING

4.11 Sustainability
(incorporating Energy Efficiency Action Plans and Greening of Government Operations)


The sustainability reporting is aligned to the DFEEST Strategic Plan 2010-2014, the whole-of-government Energy Efficiency
Action Plan and the Greening of Government Operations plans, which are all linked to various targets in the State Strategic
Plan, of which the following objectives, goals and aims are as follows.


ENERGY EFFICIENCY

 Year being reported               Energy Use (GJ)           GHG Emissions (t/CO2e)             Business Measure MJ/m

 2010-11                                  167 651                        25 260                               386

 2009-10                                  177 337                        29 860                               405

                                                Energy Consumption Targets

 Base year 2000-2001                      156 222                        49 878                               376

 Target for 2010-11                       132 191                        42 425                               304

 Target for 2014-15                       122 524                        38 584                               282

                                                          Corporate

 2010-11                                   2 135                           426                                217

 2009-10                                   2 353                           548                                224

                                                    TAFE SA Adelaide North

 2010-11                                   83 353                        12 420                               458

 2009-10                                   93 697                        14 934                               505

                                                    TAFE SA Adelaide South

 2010-11                                   54 221                         7 903                               385

 2009-10                                   53 486                         9 251                               384

                                                       TAFE SA Regional

 2010-11                                   27 942                         4 511                               273
 2009-10                                   27 801                         5 127                               272


Notes:

-   Energy use is expressed in gigajoules (GJ) and is the sum of all fuel types used in our facilities (electricity, natural and bottled gas) for
    that period.

-   Greenhouse Gas Emissions are expressed in tonnes of Carbon Dioxide equivalent, which is a combination of six recognised
    greenhouse gases; (Carbon Dioxide CO2, Methane CH4, Nitrous Oxide N2O, Hydrofluorocarbons HFCs, Perfluorocarbons PFCs and
    Sulphur Hexafluoride SF6).

-   The key performance indicator for energy efficiency is energy intensity; the amount of energy consumed per unit of a given business
    measure. DFEEST uses the net size of all of our facilities in m 2. This is a common measure used across many agencies.

-   It is acknowledged that portfolio structures change over time. Therefore the portfolio baseline will represent the structure of the
    portfolio in the given reporting period.


                                                                                                                                       Page 103
SIGNIFICANT ENERGY MANAGEMENT ACHIEVEMENTS
Overall, the department’s results in relation to energy       TAFE SA Adelaide North Institute
efficiency are below target, yet they are a considerable      TAFE SA Adelaide North Institute reduced its energy
improvement over the previous reporting period (2009-10).     consumption by 11 percent compared to the previous
There has been a net decrease in energy use of 5.5 percent    reporting period. This was a result of a number of
across the department. Of the three TAFE SA institutes, two   initiatives including:
have increased their energy use: TAFE SA Adelaide South
by 1.4 percent and TAFE SA Regional by 0.5 percent. TAFE         -   Regency Cogeneration Unit has undergone
SA Adelaide North reduced its energy use by 11 percent.              repairs which has affected its ongoing operations.
                                                                     This unit operates on natural gas and when
The ageing of TAFE SA facilities and increased                       operational provides heat and electrical power to
business outcomes contribute towards increased                       the site, reducing our need to purchase electricity
energy consumption.                                                  from the grid
However, DFEEST has endeavoured to improve its energy            -   Lighting: further rollout of the Axion Emergency
performance and some of the initiatives are detailed below.          Lighting System to Regency and Tea Tree Gully
                                                                     campuses. This system replaces emergency
                                                                     lighting with low wattage LED lighting
Corporate DFEEST                                                 -   Participated in Earth Hour 2011 through
DFEEST’s occupation in the 5-star green City Central                 reviewing energy requirements for their campuses
(11 Waymouth Street, Adelaide) consumed 9.3 percent less             and increasing the awareness amongst staff of our
energy compared to the previous reporting period. A                  environmental impacts
number of initiatives contributed to this success:               -   TAFE SA Renewable Energy Centre working in
                                                                     partnership with Royal Rewinds Mechanical and
Earth Hour 2011
                                                                     Engineering installed a three kilowatt wind turbine
A review of the building management systems across
                                                                     as part of the renewable energy project.
Corporate DFEEST and all TAFE SA institutes to maximise
energy efficiencies was conducted, and staff were
encouraged to acknowledge our impacts on the
environment as part of the department’s participation in      TAFE Adelaide South Institute
Earth Hour 2011. Over 134 countries participated in this      TAFE SA Adelaide South Institute increased its energy
international awareness-raising event.                        consumption by 1.4 percent compared to the previous
                                                              reporting period. To counter this increase, the institute has
National Australian Built Environment Rating System –         implemented the following initiatives:
City Central Energy Rating
DFEEST is the largest tenant in City Central (occupies 6         -   Noarlunga: an $8.7 million upgrade included a
levels) and in February 2011 the building was awarded a 5-           15 kWh solar power generation system with
star rating for base building energy efficiency. DFEEST              84 solar panels. This system has generated
undertook a lighting control system review in late 2010 to           35 100 kWh’s since July 2010. 1600 light fittings
ensure maximum efficiency of the tenancies lighting.                 were upgraded to energy efficient T5 lights and
                                                                     additional LED downlights were installed in the
ICT                                                                  John Reynella Restaurant
DFEEST ICT has been instrumental in strongly reducing
ICT-related energy usage through new ‘virtual’ equipment         -   Participated in Earth Hour 2011 through
(blade servers) replacing inefficient ICT components. The            reviewing energy requirements for their campuses
floor level ICT is located on realised a 13.5 percent                and increasing the awareness amongst staff of our
reduction in energy usage, whilst three of the other floor           environmental impacts.
levels reduced their energy usage by an average of
5 percent. A focus on printer settings and equipment
utilisation such as automatic power shutdown of PCs, and
newer more efficient PCs and monitors have all contributed
to reducing energy consumption.


Page 104
CORPORATE GOVERNANCE AND REPORTING


TAFE SA Regional                                            Initiatives planned for 2011-12
TAFE SA Regional increased its energy consumption by        Sustainability initiatives for 2011-12 include:
0.5 percent compared to the previous reporting period. To
counter this increase, the institute has implemented the       -    Adelaide: A $3.8 million refurbishment of the
following initiatives:                                              ground floor area into a client services area
                                                                    includes energy efficient lighting and updated
  -    Berri: existing solar power generation system of             air-conditioning
       1.5 kWh has generated an estimated 3 200 kWh’s
                                                               -    Berri: Additions of 54 solar panels (10 kWh) to
       this financial year
                                                                    the existing solar power generation system
  -    Gawler: A $100 000 project was completed to                  are planned
       install energy efficient T5 and LED lighting
                                                               -    Murray Bridge: the second stage refurbishment of
       throughout the campus
                                                                    the Library and Client Services areas will include
  -    Mount Gambier: existing solar power generation               replacement of inefficient lighting with more
       system of 14.5 kWh has generated an estimated                efficient T5 lighting. Additions of 54 solar panels
       19 000 kWh’s this financial year                             (10 kWh) to the existing solar power generation
                                                                    system are planned
  -    Murray Bridge: a $300 000 project was completed
       as a first stage in consolidating the Library and       -    Whyalla: Two 1.5 kWh solar power generation
       Client Services areas, including upgrades to more            systems are planned.
       efficient lighting. An existing solar power
       generation system of 1.5 kWh has generated an
       estimated 3200 kWh’s this financial year
  -    Victor Harbor: existing solar power generation
       system of 22.7 kWh has generated an estimated
       26 500 kWh’s this financial year
  -    Participated in Earth Hour 2011 through
       reviewing energy requirements for their campuses
       and increasing the awareness amongst staff of our
       environmental impacts.


                                                                                                                Page 105
WATER USAGE
DFEEST’s water conservation measures for             TAFE SA Regional - Specific Water
2010-11 have been outstanding. The                   Conservation Initiatives
department consumed 4.6 percent less water           Urrbrae campus: ongoing development of
than during the previous period; however,            water capture, storage and reuse to toilet
water-related costs increased by 9.2 percent.        blocks, nursery, aquaculture and local piggery
Since 2002-03 the department has reduced its         onsite. Development this year has been
water consumption by 39 percent.                     towards connecting the two wetlands at this
                                                     site in order to provide back-up water to the
Extensive use of native vegetation replacing         TAFE SA nursery/toilets and for irrigation.
lawn areas throughout TAFE SA campuses
across all institutes has been instrumental in       TAFE SA is investigating potential alternative
achieving these results. Ongoing replacement         water supplies such as recycled water (e.g. the
of water furniture in kitchens, toilets and          Barker Inlet Stormwater Reuse Scheme).
general wet areas to water-efficient taps,
showerheads and toilet ware (supporting the
Water for Good Action 37 and SASP Target 75)
across the three institutes has also contributed
towards this outstanding result.


                                    DFEEST Total Water Consumption 2010-11

                                         Water Consumption (Kilolitres =
Year being reported 2010-11                                                  % of use       Expenditure $
                                               1 KL = 1,000 litres)

Institutes

Northern                                            106 552                   64%             519 182

Regional                                             25 450                   15%             236 450

Southern                                             34 912                   21%             331 341

Total                                               166 914                   100%           1 086 973


Base year 2002-03                        Water Consumption (Kilolitres)      % of use       Expenditure $

Institutes

Northern                                            145 871                   54%             325 890

Regional                                             65 907                   26%             177 258

Southern                                             59 723                   20%             326 278

Total                                               271 501                   100%            829 426


DFEEST Target for year being reported               235 717

DFEEST Target for 2014                              235 357


Page 106
CORPORATE GOVERNANCE AND REPORTING


WASTE MANAGEMENT
DFEEST has undergone an extensive review of waste            The tender anticipates diverting waste from landfill across
management across all sites to consolidate waste             our many waste streams in as many sites as possible. The
management under one contract. It is anticipated the new     waste products diverted from landfill are anticipated to be
contract will provide auditable reporting of all waste       integrated in established recycling centres across the state.
streams, contributing towards SASP Target 67: Zero Waste –
                                                             The new waste contract is expected to commence in early
reduce waste to landfill by 35 percent by 2020 (baseline;
                                                             2012.
2002-03). Milestone of 25 percent by 2014.


                                                                                                                   Page 107
FLEET MANAGEMENT
DFEEST continues to offset all carbon emissions from our                               A new reduction target of carbon emission (grams per km)
long-term vehicle fleet with Greenfleet Australia. Since                               was announced by the Premier in early 2011. Our emission
2008, this collaboration has offset over 6200 tonnes of                                reduction target is a 10 percent reduction from 2009-10
carbon emissions through the planting of over                                          base year – 248.1 gm/km to 223.2 gm/km by 2014-15.
23 000 trees.                                                                          Each agency has a specific target.
For this reporting period we are committed to offset an                                The table below demonstrates the emission offsets from
additional 1045 tonnes of carbon emissions and this                                    our long-term vehicle fleet. Our total fleet was reduced by
equates to $5.52 per vehicle per month.                                                four vehicles overall, of which 123 vehicles are classed as
                                                                                       green/low-emission vehicles, which represents 58 percent
Additionally from 2009-10 we reduced the kilometres                                    of the total fleet from 2009-10. Our four-cylinder fleet has
travelled by 3.9 percent, fuel usage by 6 percent, number                              increased by 23 vehicles, and represents 26 percent of our
of vehicles by 1.8 percent, tonnes of carbon emissions by                              total fleet.
1.1 percent and increased fuel cost by 0.8 percent.


                                                                                                                                      Emissions CO2 (grams)
                                                                                           Fuel Expenditure ($)
                                           Number of Vehicles


                                                                 Fuel Usage (Litres)


                                                                                                                                                                Total km travelled
                                                                                                                  Emissions (t/CO2)


                                                                                                                                             per km
 2010 - 2011


                                           213                  438 703                 $467 131                  1 045               245.31                  3 951 046


 Unleaded (All)                                                 212 512                                            525

 Diesel                                                         112 873                                            326

 LPG/Dual Fuel                                                  113 318                                            194

                                           123
 Green/low-emission vehicles
                                          (58%)

 Total                                                          438 703                                           1 045

 Greenfleet carbon offset information

 Number of trees                                                 3 899

 Total Cost                                                     $14 106

                                          $5.52 per vehicle per                         $66.22 per vehicle per
 Cost per vehicle per month & year
                                                 month                                          year


Page 108
CORPORATE GOVERNANCE AND REPORTING

TAFE SA SUSTAINABILITY INITIATIVES
TAFE SA has a pivotal role to play in the development of       TAFE SA delivered a five-day environmental compliance
sustainable South Australian workforces through the            course for the Environmental Protection Authority and
provision of training programs and services that meet the      other government agencies during 2011. This is a new
current and future needs of key stakeholder groups.            intensive environmental compliance course which is being
TAFE SA also has a vital role to play in the creation and      offered by TAFE SA.
distribution of innovative products, processes and practices
across its areas of industry focus.                            During 2011, TAFE SA launched a Carbon Accounting
                                                               short course specifically developed to improve literacy and
TAFE SA is a party to the South Australian VET Sector          numeracy skills relating to the challenges of sustainability
Agreement with the Minister for Sustainability, Environment    and climate change. The short course consists of two units
and Conservation. The purpose of the agreement is to           offered in a three-day workshop environment designed for
show leadership and cooperation in responding to climate       students and professionals with a background in disciplines
change through skills development for South Australia’s        including sustainability, environmental management,
workforce. To this end, the Regional GreenPrint supports       accounting and policy.
the TAFE SA Sustainability and Action Plan 2009-2012, the
South Australian VET Sector Agreement and the National         Funding for 180 students was allocated from the PPP for
VET Sector Sustainability and Action Plan to guide             TAFE SA’s Diploma of Sustainability. Developed by TAFE SA,
environmentally sustainable development.                       the Diploma recognises the need to:

A team of TAFE SA Electrical and Engineering students             -   build a common understanding of sustainability
designed and produced the solar car SolarSpirit Australia,            across all sectors of private and public activity to
which competed in the 2011 World Solar Challenge in                   build capacity for development and
October 2011.                                                         implementation of sustainability programs
                                                                  -   develop a common understanding of the
During 2011, the TAFE SA Bachelor of Visual Arts
                                                                      concepts and language of sustainability
(Printmaking Studio) sought to achieve four core actions:
Reduce, Reuse, Recycle and Recover. The print studio uses a       -   introduce the latest techniques for implementing
number of consumables which are expensive and with a                  sustainability programs.
change in practice by collecting and reusing supplies,         Both private and public VET sector employees, business,
funding and waste have been reduced, for example toxic         industry and government (e.g. SA Water, Department of
waste substances in the studio are being converted to          Environment and Natural Resources) enrolled in the
solvent products using vegetable oil.                          Diploma, as well as representatives from the private sector
                                                               in ‘green’ industries, small business owners and staff
                                                               seeking to improve business performance.


                                                                                                   SolarSpirit Australia,
                                                                                                   the sole South Australian
                                                                                                   entrant in the 2011
                                                                                                   World Solar Challenge,
                                                                                                   successfully completed
                                                                                                   the 3000 kilometres from
                                                                                                   Darwin to Adelaide.


                                                                                                                     Page 109
Page 110
CORPORATE GOVERNANCE AND REPORTING

4.12 Urban Design Charter                                         4.13 Whistleblowers Protection Act 1993

Urban design is integrated within DFEEST’s core systems           DFEEST appointed five responsible officers within the
and procedures. Consultants, contractor tenders and major         department for the purposes of the Whistleblowers
contracts are managed on behalf of the department by              Protection Act 1993. The department received three
DPTI. DFEEST has supported DPTI in the preparation of             whistleblower-related allegations during the year. One is
policies, including the impact of our presence in the local       being investigated, one was reviewed by the department
community, with a view to integrating with the urban fabric       and deemed not to be a whistleblowers complaint and the
so that a positive contribution is made.                          complainant of the third is reconsidering their concerns.
To initiate the engagement of consultants to undertake
design work, DFEEST collaborates with DPTI to define and/
or request specific urban design principles associated with
the project or request their investigation, including:
  -    ecologically sustainable development initiatives to
       be considered
  -    specific site issues such as cultural, political and
       heritage issues
  -    corporate parameters (relevant policies, standards
       and guidelines)
  -    specific consultant services required (e.g. tree audits,
       traffic management surveys, disability access,
       Indigenous/cultural issues).
DFEEST interacts and communicates with the community
through TAFE SA institutes and campuses. With respect to
major projects, the Public Works Committee and DPTI work
on behalf of the department to ensure exposure to a wide
range of community views and scrutiny.


                                                                                                                   Page 111
Page 112
SECTION FIVE
           FINANCIAL PERFORMANCE


Page 113
5.1 Financial Overview                                           5.2 Summary of Financial Information

On a comparative basis to 2009-10, expenses decreased by         NET RESULT
$2.1 million (or 0.4 percent) in 2010-11 relating primarily to   The change in the Net Result from a $40.4 million surplus in
a $7.7 million decrease in employee expenses and partly          2009-10 to a $17.3 million deficit in 2010-11 is attributable
offset by a $2.2 million increase in grants and subsidies and    mainly to a decrease in Commonwealth government
a $1.8 million increase in supplies and services. The            grants of $38 million (including a $30 million decrease in
decrease in employee expenses was primarily attributable         capital grants for TIIFT and BTF) and a decrease in net
to a reduction in Targeted Voluntary Separation Package          revenues from the South Australian government of
(TVSP) costs.                                                    $17 million. The South Australian government net revenue
DFEEST’s income excluding ‘Revenues from Government’             decrease relates primarily to a reduction in 2010-11 of
decreased by $43.2 million (or 24.0 percent) in 2010-11,         appropriation transfers from contingency provisions for
driven by a $37.4 million decrease in Commonwealth               once-off items, TVSPs and programs which reached their
revenue. This decrease related primarily to the 2010-11          milestones.
completion of two short-term Commonwealth Programs
titled Training Infrastructure Investment for Tomorrow
(TIIFT) and Better TAFE Facilities (BTF).
BTF and TIIFT were two components of the
Commonwealth’s Teaching and Learning Capital Fund and
essentially one year capital programs with the majority of
revenue paid in instalments during 2009-10, except the
final 5 percent which was paid in 2010-11 following the
acquittal of all projects to the Commonwealth.
The tables provided in this section set out a summary of the
actual results for the 2010-11 financial year. The detailed
financial statements reflecting actual results for 2010-11 are
presented under ’Financial Information’.


                                                                                     Actual              Actual
                                                                                    2010-11             2009-10
                                                                                     $’000               $’000

        Statement of Comprehensive Income
        Expenses                                                                    535 685             537 789
        Income                                                                      136 363             179 518
        Net Cost of Providing Services                                              399 322             358 271
        Revenues from Government                                                    382 045             398 710
        Net Result                                                                  (17 277)             40 439


Page 114
FINANCIAL PERFORMANCE


OPERATING REVENUES
Total operating revenues for 2010-11, including revenues
from government were $518.4 million. The principal source
of funding for DFEEST relates to state government
appropriations which in 2010-11 amounted to
$382 million. Other operating revenues included
Commonwealth grants of $28.3 million and $95.2 million
from Student and other Fees and Charges.
The chart to the right depicts an overview of revenue
sources for 2010-11.


OPERATING EXPENSES
Employee Benefits of $282.9 million amounted to
53 percent of total 2010-11 operating expenses of
$535.7 million. Grants and subsidies expenses totalled
$74.6 million including $24.0 million for employment
programs, $22.4 million for science and information
economy programs, $12.1 million for vocational education
and training programs and $11.2 million for Tertiary
Student Transport Concessions.
The other major component of operating expenses
(supplies and services) amounted to $158.0 million.
Included in this category were $45.5 million for funding to
non-TAFE providers for vocational education and training,
$20.5 million for information technology infrastructure and
communication, $20.5 million for minor works,
maintenance and equipment, $17.7 million for fees for
contracted services and $10.7 million for printing and
consumables. A further $19.3 million was charged to
Depreciation and Amortisation expense.
The chart to the right depicts an overview of operating
expenses for 2010-11.


                                                              Page 115
OVERVIEW OF OPERATING EXPENSES 2010-11
The following table depicts how expenditure was applied to the following activities in accordance with approved strategic
priorities:


                                                                                                                $ Million
Employment and Skills Formation – Vocational Education and Training
                                                                                                                   443.5
Provision of post-secondary VET by TAFE SA and other registered training organisations including:
   -   resource allocation of contestable and non-contestable funds;
   -   funding of apprenticeships and traineeships;
   -   support for post-secondary training and education; and
   -   providing state and national policy advice.


Employment and Skills Formation – Learning, Workforce Participation Development and Workforce
Development                                                                                                         54.6

Addressing the state’s economic development and social inclusion objectives by:
   -   providing opportunities for people to participate in employment, training, skills development, and
       adult community education;
   -   meeting the current and future labour and skill needs of industry; and
   -   providing state and national policy advice.


Science, Technology and Innovation – Science and Innovation
                                                                                                                    15.2
Provision of high-level strategic advice to the Minister on maximising economic, environmental and social
benefits from the state’s scientific research and innovation by:
   -   identifying strategic priorities for state government investment;
   -   raising awareness and understanding of the benefits of science and innovation amongst
       government, business and the community;
   -   facilitating coordinated and strategic bids for Commonwealth grants; and
   -   facilitating coordination of education and research activity with end-user (industry) requirements to
       maximise the benefits for South Australia.


Science, Technology and Innovation – Bioscience Industry Development
                                                                                                                      6.9
Development of the bioscience industry through providing assistance in business development, finance,
infrastructure and marketing.


Page 116
FINANCIAL PERFORMANCE


                                                                                                                $ Million
Employment and Skills Formation – Regulatory Services
                                                                                                                     6.7
Administering the state’s further education and training system through:
   -    provision of registration, accreditation and approval services for registered training organisations;
   -    quality oversight of the state vocational education system, through the Training and Skills
        Commission;
   -    administration of apprenticeships and traineeship system; and
   -    providing state and national policy advice.


Employment and Skills Formation – International and Higher Education
                                                                                                                     4.2
Supporting the development of Adelaide as a centre for education, international education and South
Australian education exports including the provision of marketing services, analysis and student and
community support.

Provision of high-level strategic policy advice to the Minister on higher education policy and planning.


Science, Technology and Innovation – Information Economy                                                             2.8
Provision of high-level strategic policy advice to the Minister and government on the information economy
and the ICT sector that:
   -    raises awareness and understanding of the information economy among government, business,
        industry and education providers;
   -    develops strategy and facilities programs and projects relevant to promoting the information
        economy; and
   -    facilitate bids for significant Commonwealth grants.


Science, Technology and Innovation – Technology Investment                                                           1.8
Provision of seed capital and business guidance to innovative companies commercialising research and
development.


Total                                                                                                               535.7


                                                                                                                Page 117
SUSTAINABLE BUDGET COMMISSION


 The department had constructive engagement with the         Overview of Savings Task
 Sustainable Budget Commission process during 2010. This     Forward Estimates Savings Task for the department ($ 000)
 engagement resulted in budget measures of $45 million to    are:
 be achieved by 2013-14, which are a combination of
 expenditure, revenue and asset sales.


                                               Number of     2010-11         2011-12         2012-13          2013-14
                                               measures       Budget         Estimate        Estimate         Estimate


2010-11 Budget measures
Included in enhanced monitoring                     14        10 476           22 456          37 960           42 155


2008-09 Mid-Year Budget Review Full-time            1             587           1 798           2 445            2 494
Equivalent target


Total                                               15        11 063           24 254          40 405           44 649

Associated Full-Time Equivalent Reduction                       106.0            146.1           170.5            221.5


                                                             Detail and total as per the 2010-11 Budget Measures Statement.


   Overview of Implementation Plan
   Budget measures are a combination of expenditure         The department’s priority in implementation planning
   efficiencies, asset sales, revenue measures and grant/   will be to both meet budget requirements and deliver
   service rationalisation.                                 on the government’s objective of increasing skill levels
                                                            in the labour force.


Page 118
FINANCIAL PERFORMANCE

5.3 AUDITED GENERAL PURPOSE FINANCIAL REPORT

STATEMENT OF COMPREHENSIVE INCOME - YEAR ENDED 30 JUNE 2011


                                                                                Note     2011       2010
                                                                                         $'000      $'000
                                                                  EXPENSES
                                                          Employee Benefits      5     282,907    290,632
                                                       Supplies and Services     6     157,975    156,180
                                                       Grants and Subsidies      7      74,553     72,305
                                             Depreciation and Amortisation       8      19,299     17,854
                           Net Loss from the Disposal of Non-Current Assets     15         469        131
                                                            Other Expenses       9         482        687
                                                            Total EXPENSES             535,685    537,789


                                                                 INCOME
                                                   Commonwealth Grants          11      28,386     65,792
                                       Student and Other Fees and Charges       12      95,231    100,607
                                            Other Grants and Contributions      13       8,305      9,889
                                                        Investment Income       14         323         11
                                                             Other Income       16       4,118      3,219
                                                              Total INCOME             136,363    179,518


                                        NET COST OF PROVIDING SERVICES                 399,322    358,271


                       REVENUES FROM/PAYMENTS TO SA GOVERNMENT
                                       Revenues from SA Government              17     394,688    408,633
                                           Less Payments to SA Government       17      12,643      9,923
                 Total REVENUES FROM/PAYMENTS TO SA GOVERNMENT                         382,045    398,710


                                                                NET RESULT             (17,277)    40,439


                                         OTHER COMPREHENSIVE INCOME

         Changes in property, plant and equipment asset revaluation surplus             (2,374)        0
            Change in Financial Assets Available-for-sale revaluation surplus   29        1,108      685


                                             Total COMPREHENSIVE RESULT                (18,543)    41,124


           THE NET RESULT AND COMPREHENSIVE RESULT ARE ATTRIBUTABLE TO THE SOUTH AUSTRALIAN
                                                                     GOVERNMENT AS OWNER


                                                                                                       Page 119
STATEMENT OF FINANCIAL POSITION - AS AT 30 JUNE 2011


                                                                                  Note     2011      2010
                                                                                           $'000     $'000
                                                            CURRENT ASSETS
                                                Cash and Cash Equivalents         18      64,675    85,981
                                                                   Receivables    19      17,041    17,898
                                                                   Inventories    23         887       972
                                 Non-current assets classified as held for sale   20       1,578         0
                                                     Total CURRENT ASSETS                 84,181   104,851

                                                      NON-CURRENT ASSETS
                                                                  Receivables     19         239       248
                                                                 Investments      29       4,999     3,891
                                              Property, Plant and Equipment       21     635,681   650,691
                                                                  Intangibles     22      15,895     9,909
                                                Total NON-CURRENT ASSETS                 656,814   664,739

                                                               TOTAL ASSETS              740,995   769,590

                                                         CURRENT LIABILITIES
                                                                    Payables      24      27,612    39,407
                                                           Employee benefits      25      27,777    23,898
                                                                  Provisions      26       2,101     1,934
                                                          Unearned Revenue        27       4,827     7,211
                                                      Other Current Liabilities   28         753     1,135
                                                   Total CURRENT LIABILITIES              63,070    73,585

                                                   NON-CURRENT LIABILITIES
                                                                 Payables         24       1,984     2,023
                                                         Employee benefits        25      48,114    48,379
                                                                Provisions        26       7,091     6,306
                                             Total NON-CURRENT LIABILITIES                57,189    56,708

                                                            TOTAL LIABILITIES            120,259   130,293

                                                                  NET ASSETS             620,736   639,297

                                                                        EQUITY
                                                             Retained Earnings    31     395,220   412,515
                        Financial Asset Available-for-Sale Revaluation surplus    31       2,395     1,287
                                                      Asset revaluation surplus   31     223,121   225,495
                                                                  Total EQUITY           620,736   639,297
             The Total Equity is attributable to the SA Government as owner

                         UNRECOGNISED CONTRACTUAL COMMITMENTS                     32
                                CONTINGENT ASSETS AND LIABILITIES                 33


Page 120
FINANCIAL PERFORMANCE

STATEMENT OF CHANGES IN EQUITY - YEAR ENDED 30 JUNE 2011


                                                                                 Available-for-Sale
                                                                                   Financial Asset
                                                                   Revaluation


                                                                                      Revaluation


                                                                                                      Retained
                                                                                                      Earnings
                                                                       Surplus


                                                                                           Surplus
                                                                         Asset


                                                                                                                      Total
                                                            Note
                                                                     $'000           $'000            $'000          $'000


                              Balance at 30 June 2009              225,495                  602       370,929        597,026

                                      Error Correction                   0                    0         (550)          (550)
                         Changes in accounting policy        3           0                    0           400            400
                     Restated balance at 30 June 2009              225,495                  602       370,779        596,876

                                 Net Result for 2009-10                      0                  0      40,439         40,439


           Change in Financial Assets available-for-sale                     0              685                  0        685

                   Total comprehensive result 2009-10                        0              685        40,439         41,124

                 Net assets transferred as a result of an
                              administrative restructure                 0                   0            140            140
                               Balance at 30 June 2010             225,495               1,287        411,358        638,140

                         Changes in Accounting Policy        3               0                  0       1,303          1,303
                                     Error Correction                        0                  0       (146)          (146)

                     Restated balance at 30 June 2010              225,495               1,287        412,515        639,297

                                 Net Result for 2010-11                      0                  0     (17,277)       (17,277)


           Change in Financial Assets available-for-sale    29               0           1,108                   0     1,108


         Loss on revaluation of library during 2010-11               (2,374)                    0                0    (2,374)

                   Total comprehensive result 2010-11                (2,374)             1,108        (17,277)       (18,543)

     Net assets received as a result of an administrative
                                             restructure    34           0                   0            (18)           (18)
                               Balance at 30 June 2011             223,121               2,395        395,220        620,736

    All changes in equity are attributable to the SA Government as owner


                                                                                                                              Page 121
FINANCIAL PERFORMANCE

 STATEMENT OF CASH FLOWS - YEAR ENDED 30 JUNE 2011


                                                                                       2011          2010
                                                                                       $'000         $'000
                                                                                     Inflows       Inflows
                                                                           Note   (Outflows)    (Outflows)
                      CASH FLOWS FROM OPERATING ACTIVITIES
                                                CASH OUTFLOWS
                                      Employee benefit payments                   (277,944)     (291,016)
                                Payments for supplies and services                (182,142)     (177,081)
                                 Payments of grants and subsidies                  (74,553)      (72,305)
                                              GST paid to the ATO                   (4,215)       (4,126)
                                                  Other payments                      (292)         (835)
                                          Cash used in operations                 (539,146)     (545,363)
                                                  CASH INFLOWS
                                          Commonwealth grants                        28,386        65,792
                              Student and other fees and charges                     96,519        97,878
                                   Other grants and contributions                     8,305         9,831
                                                  Interest received                      38            11
                                     GST recovered from the ATO                      19,650        18,566
                                                Dividends received                      285             0
                                                     Other receipts                   3,969         4,453
                                 Cash generated from operations                     157,152       196,531
                         CASH FLOWS FROM SA GOVERNMENT:
                                    Receipts from SA Government                     394,688       408,633
                                     Payments to SA Government                      (12,643)       (9,923)
                            Cash generated from SA Government                       382,045       398,710

                 Net cash provided by (used in) operating activities       37            51        49,878

                       CASH FLOWS FROM INVESTING ACTIVITIES
                                                      Cash Outflows
                        Purchase of property, plant and equipment                   (15,811)      (34,418)
                                            Purchase of intangibles                  (5,557)       (7,338)
                                     Cash used in investing activities              (21,368)      (41,756)
                                                       Cash Inflows
           Proceeds from the sale of property, plant and equipment                       11           613
                           Cash generated from investing activities                      11           613

                  Net cash provided by (used in) investing activities               (21,357)      (41,143)

                       CASH FLOWS FROM FINANCING ACTIVITIES
                                              Cash Outflows
                Cash transferred as a result of restructuring activities                  0         (542)
                 Net cash provided by (used in) financing activities                      0         (542)

     NET INCREASE (DECREASE) IN CASH AND CASH EQUIVALENTS                            (21,306)        8,193
                 CASH AND CASH EQUIVALENTS AT 1 JULY 2010                              85,981       77,788
               CASH AND CASH EQUIVALENTS AT 30 JUNE 2011                   18          64,675       85,981


Page 122
DISAGGREGATED DISCLOSURES - EXPENSES AND INCOME - YEAR ENDED 30 JUNE 2011


                                                              Employment and Skills Formation                             Science, Technology and Innovation

                                                                    Learning,
                                                                  Workforce
                                                 Vocational   Participation &                   International                                  Bioscience
                                                 Education        Workforce     Regulatory       and Higher     Science and   Information         Industry     Innovation
                                               and Training          Develop      Services         Education     Innovation     Economy      Development       Investment      Total

                                                     $'000             $'000         $'000             $'000         $'000          $'000           $'000          $'000      $'000
                                  Expenses
                         Employee benefits         253,907           18,588          5,638             1,565         2,492           717                0              0    282,907
                      Supplies and services        148,931            5,972          1,058             1,020           509           485                0              0    157,975
                       Grants and subsidies         20,430           30,039              0             1,630        12,217         1,579            6,882          1,776     74,553
             Depreciation and Amortisation          19,299                0              0                 0             0             0                0              0     19,299
              Net Loss on disposal of assets           469                0              0                 0             0             0                0              0        469
                           Other expenses              450               15             12                 2             2             1                0              0        482
                            Total Expenses         443,486           54,614          6,708             4,217        15,220         2,782            6,882          1,776    535,685

                                    Income
                    Commonwealth grants             19,722             8,621             1                 0             0            42                0              0     28,386
                Student and other fees and
                                   charges          94,461               93            654                 9            10             4                0              0     95,231
             Other grants and contributions          5,003            3,126              1                 0           175             0                0              0      8,305
                        Investment income              295               18              5                 2             2             1                0              0        323
                             Other income            3,688               92             38                82           145            73                0              0      4,118
                              Total Income         123,169           11,950            699                93           332           120                0              0    136,363

              Net Cost of Providing Services       320,317           42,664          6,009             4,124        14,888         2,662            6,882          1,776    399,322

                Revenues from/payments to
                           SA Government
             Revenues from SA Government           311,668           46,918          6,009             4,092        14,702         2,641            6,882          1,776    394,688
               Payments to SA Government           (12,643)               0              0                 0             0             0                0              0    (12,643)

                                 Net Result        (21,292)            4,254             0              (32)          (186)          (21)               0              0    (17,277)


Page 123
DISAGGREGATED DISCLOSURES - ASSETS AND LIABILITIES - YEAR ENDED 30 JUNE 2011


Page 124
                                                           Employment and Skills Formation                                 Science, Technology and Innovation

                                                                 Learning,
                                                               Workforce
                                              Vocational   Participation &                   International                                     Bioscience                       General/
                                              Education        Workforce     Regulatory       and Higher     Science and      Information         Industry      Innovation           Not
                                            and Training          Develop      Services         Education     Innovation        Economy      Development        Investment   attributable     Total

                                                  $'000             $'000         $'000             $'000         $'000             $'000           $'000           $'000          $'000      $'000
                                   Assets
              Cash & Cash Equivalents                 0                 0            0                  0             0                 0               0               0        64,675      64,675
                             Receivables         12,529                66          154                  1             4                 0               0               0         4,526      17,280
                              Inventories           887                 0            0                  0             0                 0               0               0             0         887
           Non-current Assets Held for
                                     Sale         1,578                0             0                  0             0                0                0               0             0       1,578
                            Investments               0                0             0              4,999             0                0                0               0             0       4,999
           Property, Plant & Equipment          634,977              444           141                 39            61               19                0               0             0     635,681
                              Intangibles        15,895                0             0                  0             0                0                0               0             0      15,895
                             Total Assets       665,866              510           295              5,039            65               19                0               0        69,201     740,995

                              Liabilities
                              Payables           20,218             1,483            92                22           455              462                0               0         6,864      29,596
                     Employee Benefits           67,630             5,340         1,619               302           838              162                0               0             0      75,891
                            Provisions                0                 0             0                 0             0                0                0               0         9,192       9,192
                    Unearned Revenue              4,827                 0             0                 0             0                0                0               0             0       4,827
                       Other Liabilities            464                 5             0                 1             0                0                0               0           283         753
                        Total Liabilities        93,139             6,828         1,711               325         1,293              624                0               0        16,339     120,259

                              Net Assets        572,727           (6,318)       (1,416)             4,714        (1,228)            (605)               0               0        52,862     620,736
DISAGGREGATED DISCLOSURES - EXPENSES AND INCOME - YEAR ENDED 30 JUNE 2010


                                                               Employment and Skills Formation                                 Science, Technology and Innovation

                                                                   Learning,
                                                  Vocational      Workforce                      International                                   Bioscience In-
                                                  Education     Development       Regulatory      and Higher     Science and      Information    dustry Devel-      Technology
                                                and Training   & Employment         Services        Education     Innovation        Economy            opment        Investment      Total

                                                      $'000             $'000         $'000             $'000         $'000             $'000            $'000           $'000      $'000
                                  Expenses
                          Employee benefits         270,987            11,326         4,067               872         1,483            1,897                 0               0    290,632
                       Supplies and services        148,810             4,856         1,279               222           528              485                 0               0    156,180
                        Grants and subsidies         29,454            15,471           360             1,617        13,362            2,898             7,556           1,587     72,305
              Depreciation and Amortisation          17,854                 0             0                 0             0                0                 0               0     17,854
               Net Loss on disposal of assets           122                 5             2                 0             1                1                 0               0        131
                            Other expenses              651                18            13                 1             2                2                 0               0        687
                              Total Expenses        467,878            31,676         5,721             2,712        15,376            5,283             7,556           1,587    537,789

                                     Income
                     Commonwealth grants             65,068              573              4                 1            44              102                 0               0     65,792
           Student and other fees and charg-
                                          es         99,974               118           512                 0             1                2                 0               0    100,607
              Other grants and contributions          8,619             1,266             1                 2             0                1                 0               0      9,889
                         Investment income               11                 0             0                 0             0                0                 0               0         11
                               Other income           2,894                 0           184                18            90               33                 0               0      3,219
                               Total Income         176,566             1,957           701                21           135              138                 0               0    179,518


               Net Cost of Providing Services       291,312            29,719         5,020             2,691        15,241            5,145             7,556           1,587    358,271

                Revenues from/payments to
                           SA Government
             Revenues from SA Government            339,750            29,845         5,870             4,281        15,062            4,682             7,556           1,587    408,633
               Payments to SA Government             (9,923)                0             0                 0             0                0                 0               0     (9,923)

                                  Net Result         38,515              126            850             1,590          (179)            (463)                0               0     40,439


Page 125
DISAGGREGATED DISCLOSURES - ASSETS AND LIABILITIES - YEAR ENDED 30 JUNE 2010


Page 126
                                                   Employment and Skills Formation                                 Science, Technology and Innovation
                                                         Learning,
                                      Vocational       Workforce                     International                                     Bioscience                        General/
                                      Education    Development &     Regulatory       and Higher     Science and      Information         Industry      Technology            Not
                                    and Training     Employment           Services      Education     Innovation        Economy      Development         Investment   attributable     Total

                                          $'000             $'000          $'000            $'000         $'000            $'000             $'000           $'000          $'000      $'000
                        Assets
      Cash & Cash Equivalents                 0                 0             0                 0             0                0                 0               0        85,981      85,981
                  Receivables            12,232                 0           637                 4             2               22                 0               0         5,249      18,146
                   Inventories              972                 0             0                 0             0                0                 0               0             0         972
      Non-current Assets Held
                       for Sale               0                 0              0                0             0                0                 0               0              0          0
                 Investments                  0                 0              0            3,891             0                0                 0               0              0      3,891
             Property, Plant &
                  Equipment             650,497               115            39                 6            15               19                 0               0             0     650,691
                   Intangibles            9,909                 0             0                 0             0                0                 0               0             0       9,909
                  Total Assets          673,610               115           676             3,901            17               41                 0               0        91,230     769,590

                      Liabilities
                      Payables           26,443             1,947            55               109            15              142                 0               0        12,719      41,430
             Employee Benefits           66,939             2,942         1,306               178           407              505                 0               0             0      72,277
                    Provisions                0                 0             0                 0             0                0                 0               0         8,240       8,240
            Unearned Revenue              7,211                 0             0                 0             0                0                 0               0             0       7,211
               Other Liabilities          1,031                 5             1                 0             0                0                 0               0            98       1,135
                Total Liabilities       101,624             4,894         1,362               287           422              647                 0               0        21,057     130,293

                     Net Assets         571,986            (4,779)         (686)            3,614          (405)            (606)                0              (0)       70,173     639,297
FINANCIAL PERFORMANCE
NOTES TO THE STATEMENT OF COMPREHENSIVE INCOME

1.   Agency Objectives and Funding

     (a)   Objectives

           To develop the skills and capability of the state’s workforce and to maximise the opportunities for all
           South Australians to engage in work.

           The portfolio plays a central role in achieving 14 of South Australia’s Strategic Plan targets in the areas
           of employment, education and training, and science, technology and innovation.

           The Department of Further Education, Employment, Science and Technology (the Department)
           undertakes a range of functions in order to meet its objectives and contribute to the achievement of
           South Australia’s Strategic Plan objectives and targets.

           This includes:
                 in conjunction with the Training and Skills Commission, the provision of strategic policy advice
                  for developing the state’s workforce;

                 ensuring high quality vocational education and training (VET) delivered by TAFE institutes,
                  private registered training organisations and adult community education providers;

                 regulation of VET organisations, university and non-university higher education providers, and
                  providers of English language intensive courses for overseas students;

                 regulation, administration and funding of apprenticeships and traineeships;

                 managing State funded employment and community development programs;

                 supporting the Government’s strategic direction in the higher education sector;

                 raising the profile of South Australia in the international education market place;

                 developing policies and strategies, and delivery of programs, that create opportunities for
                  Aboriginal people, young people, people with a disability and older workers; and

                 provision of strategic advice and delivery of programs in the areas of science, technology,
                  information economy and innovation policy.

     (a)   Funding

           The Department is predominantly funded by State Government appropriations supplemented by
           Commonwealth grants. In addition income is generated from sales and fee for service.

           These include:
                 student fees and charges;
                 training for various organisations;
                 sale of curriculum material;
                 hire of facilities and equipment.

           The financial activities of the Department are primarily conducted through a Special Deposit Account
           with the Department of Treasury and Finance pursuant to Section 8 of the Public Finance and Audit
           Act 1987. The Special Deposit Account is used for funds provided by State Government appropriation,
           Commonwealth grants and revenues from fees and charges.


                                                                                                                     Page 127
NOTES TO THE STATEMENT OF COMPREHENSIVE INCOME


      (a)   Principles of Consolidation

            Associates

            Associates are all entities over which the Department has significant influence but not control,
            generally accompanying a shareholding of between 20 percent and 50 percent of the voting rights.

            The Minister for Employment, Training and Further Education has a 100% interest in Austraining
            International Pty Ltd. Although the Minister has control over Austraining it is not considered part of the
            Department’s operations. The Department cannot influence the decisions of Austraining, nor can the
            Department dominate the financial and operational policies of Austraining. Consequently, Austraining
            has not been consolidated in the accounts. The value of Austraining is shown in the Statement of
            Financial Position under Investments.

            Details of the investment in Austraining International Pty Ltd are set out in Note 29.

             The Minister for Employment, Training and Further Education has a 25% interest in SABRENet.
            SABRENet was registered on 28 September 2005 as a non-profit company limited by guarantee and
            has been recognised by the ATO as a tax exempt entity. The founding members are the three South
            Australian Universities and the South Australian Government. The objects for which the company was
            established are to be a non-profit institution to further the use of advanced data networking for the
            conduct of research and education in South Australia for the benefit of South Australia and for the
            purposes of economic and social advancement in Australia generally. While the Minister has significant
            influence over SABRENet, his interest in SABRENet is limited to his use of SABRENet’s asset (the
            network). That is, the Minister receives no return for its interest in SABRENet. SABRENet is not
            accounted for using the equity method as the Minister does not have access to the residual assets of
            the entity.

            Institute Councils are established under section 28 of the Technical and Further Education (TAFE) Act.
            The council works with the directors of the TAFE institutes in the development of the business plans
            and monitors the performance of the institutes. At 30 June 2011 the three institute councils held an
            aggregate balance of $1.4 million. This balance is held in an interest-bearing section 21 deposit
            account with the Department of Treasury and Finance.

            Joint Venture Entities

            The Department has a 25% interest in the South Australian Tertiary Admissions Centre (SATAC). The
            interests in this joint venture are not considered to be material to the Department’s core activities.
            Consequently, they have not been taken up in the accounts on an equity basis as per AASB 131
            Interests in Joint Ventures.

            SATAC is a joint venture of the three South Australian universities and the Minister for Education,
            Training and Employment. SATAC receives and processes undergraduate and postgraduate
            applications for admission to TAFE SA, Charles Darwin University and the three universities in South
            Australia.


Page 128
FINANCIAL PERFORMANCE
NOTES TO THE STATEMENT OF COMPREHENSIVE INCOME

2.   Summary of Significant Accounting Policies

     (a)   Statement of Compliance

           The financial statements are general purpose financial statements. The accounts have been prepared
           in accordance with relevant Australian Accounting Standards and Treasurer's Instructions and
           Accounting Policy Statements promulgated under the provision of the Public Finance and Audit Act
           1987.

           Except for AASB 2009-12, which the department has early adopted, Australian Accounting standards
           and interpretations that have recently been issued or amended but are not yet effective have not been
           adopted by the department for the reporting period ending 30 June 2010. These are outlined in Note 3.

     (b)   Basis of Preparation

           The preparation of the financial statements requires:
                the use of certain accounting estimates and requires management to exercise its judgement in
                 the process of applying the Department’s accounting policies. The areas involving a higher
                 degree of judgement or where assumptions and estimates are significant to the financial
                 statements are outlined in the applicable notes;
                accounting policies are selected and applied in a manner which ensures that the resulting
                 financial information satisfies the concepts of relevance and reliability, thereby ensuring that the
                 substance of the underlying transactions or other events are reported;
                compliance with accounting policy statements issued pursuant to section 41 of the Public
                 Finance and Audit Act 1987. In the interest of public accountability and transparency the
                 Accounting Policy Statements require the following note disclosures, that have been included in
                 these financial statements:
            (a) revenues, expenses, financial assets and liabilities where the counterparty/transaction is with an
                 entity within the SA Government as at reporting date, classified according to their nature. A
                 threshold of $100 000 for separate identification of these items applies;
            (b) expenses incurred as a result of engaging consultants (as reported in the Statement of
                 Comprehensive Income);
            (c)  employees whose normal remuneration is equal to or greater than the base executive
                 remuneration level (within $10 000 bandwidths) and the aggregate of the remuneration paid
                 or payable or otherwise made available, directly or indirectly by the entity to those employees;
                 and
            (d) board/committee member and remuneration information, where a board/committee member
                 is entitled to receive income from membership other than a direct out-of-pocket reimbursement;
            (e) employee targeted voluntary separation package information.

           The Department’s Statement of Comprehensive Income, Statement of Financial Position and
           Statement of Changes in Equity have been prepared on an accrual basis and are in accordance with
           historical cost convention, except for certain assets that have been valued in accordance with the
           valuation policy applicable.

           The Statement of Cash Flows has been prepared on a cash basis.

           The financial statements have been prepared based on a twelve month period and presented in
           Australian currency.

           The accounting policies set out below have been applied in preparing the financial statements for the
           year ended 30 June 2011 and the comparative information presented for the year ended
           30 June 2010.


                                                                                                                   Page 129
NOTES TO THE STATEMENT OF COMPREHENSIVE INCOME


      (c)   Reporting Entity

            The Department is a government department of the State of South Australia, established pursuant to
            the Public Sector Act 2009. The Department is an administrative unit acting on behalf of the Crown.

            The financial statements and accompanying notes reflect the use of assets, liabilities, revenues and
            expenses controlled or incurred by the Department in its own right. Transactions and balances
            relating to administered resources are not recognised as departmental income, expense, assets and
            liabilities. As administered items are insignificant in relation to the department’s overall financial
            performance and position, they are disclosed in summary in Note 39 Administered Items.

            Except as otherwise disclosed, administered items are accounted for on the same basis and using the
            same accounting policies as for departmental items.

      (d)   Transferred Functions

            The Public Sector (Reorganisation of Public Sector Operations) Notice 2010 (dated 1 July 2010)
            declared that:
                 The Bragg Institute and Royal Institution of Australia (RiAus) was transferred from the
                  Department of Premier and Cabinet to the Department of Further Education, Employment,
                  Science and Technology, effective 1 July 2010 (refer to Note 34).

      (e)   Comparative Information

            The presentation and classification of items in the financial statements are consistent with prior periods
            except where specific accounting standards and/or Accounting Policy Statements has required a
            change. Where presentation or classification of items in the financial statements has been amended,
            comparative amounts have been reclassified unless reclassification is impracticable.

            The restated comparative amounts do not replace the original financial statements for the preceding
            period.

      (f)   Income and Expenses

            Income and expenses have been classified according to their nature and have not been offset unless
            required or permitted by a specific accounting standard, or where offsetting reflects the substance of
            the transaction or other event.

            Income

            Income is recognised to the extent that it is probable that the flow of economic benefits to the
            Department will occur and can be reliably measured.

            The following are specific recognition criteria:
                  Income from fees and charges is derived from the provision of goods and services to other SA
                   government agencies and to other clients and is recognised when invoices are raised.
                  Income from disposal of non-current assets is recognised when control of the asset has passed
                   to the buyer and determined by comparing proceeds with carrying amount.
                  Income from grants is recognised upon receipt of funding.
                  Interest income is recognised as it accrues. Dividend income is recognised only when it is
                   declared.
                  Contribution income is recognised when control of the contribution or the right to receive the
                   contribution and the income recognition criteria are met.
                  Appropriations for program funding are recognised as revenues when the Department obtains
                   control over the funding. Control over appropriations is normally obtained upon their receipt.

            Payments to the SA Government include the return of surplus cash pursuant to the cash alignment
            policy.


Page 130
FINANCIAL PERFORMANCE
NOTES TO THE STATEMENT OF COMPREHENSIVE INCOME

          Expenses

          Expenses are recognised to the extent that it is probable that the flow of economic benefits from the
          Department will occur and can be reliably measured.

          The following are specific recognition criteria:

          Employee benefit expense

          Employee benefit expense includes all costs related to employment including wages and salaries and
          leave entitlements. These are recognised when incurred.

          In regards to superannuation expenses, the amount charged to the Statement of Comprehensive
          Income represents the contributions made by the Department to the superannuation plan in respect of
          current services of current departmental staff. The Department of Treasury and Finance centrally
          recognises the superannuation liability in the whole of government financial statements.

          Grant expenses

          Grants are amounts provided by the Department to entities for capital, specific or recurrent purposes
          and the name or category reflects the use of the grant. The grants given are usually subject to terms
          and conditions set out in the contract, correspondence, or by legislation. The grants are paid when the
          conditions set out in the contract or correspondence are met.

    (g)   Current and Non-Current Classification

          Assets and liabilities are characterised as either current or non-current in nature. Assets and liabilities that
          are sold, consumed or realised as part of the normal operating cycle even when they are not expected
          to be realised within twelve months after the reporting date have been classified as current assets or
          current liabilities. All other assets and liabilities are classified as non-current.

          Where asset and liability line items combine amounts expected to be realised within twelve months and
          more than twelve months, the Department has separately disclosed the amounts expected to be
          recovered or settled after more than twelve months.

    (h)   Events after the end of the reporting period

          Note disclosure is made about events between 30 June and the date the financial statements are
          authorised for issue where the events relate to a condition which arose after 30 June and which may
          have a material impact on the results of subsequent years (refer to Note 35).

    (i)   Cash and cash equivalents

          Cash and cash equivalents in the Statement of Financial Position include cash at bank and on hand.

          For the purposes of the Statement of Cash Flows, cash and cash equivalents includes cash at bank and
          cash on hand.

          Cash is measured at nominal value.


                                                                                                                        Page 131
NOTES TO THE STATEMENT OF COMPREHENSIVE INCOME


      (j)   Receivables

            Receivables include amounts receivable from trade, prepayments and other accruals.

            Trade receivables arise in the normal course of providing goods and services to other agencies and to
            the public. Trade receivables are generally receivable within 30 days after the issue of an invoice or the
            goods/services have been provided under a contractual arrangement.

            The recoverability of trade receivables is reviewed on an ongoing basis. Debts that are known to be
            uncollectible are written off when identified. An allowance for doubtful debts is raised when there is
            objective evidence that the Department will not be able to collect the debt.

      (k)   Inventory

            Inventories include goods and other property held either for sale or distribution at no or nominal cost
            in the ordinary course of business.

            Inventories held for distribution at no or nominal consideration, are measured at cost and adjusted
            when applicable for any loss of service potential. Inventories held for sale are measured at the lower
            of cost or their net realisable value.

            Cost is assigned to low volume inventory items on a specific identification of cost basis.

            Inventories comprise of learning modules, food and wine, wine making equipment, books, stationery,
            hair and beauty products and timber supplies.

            The amount of any inventory write-down to net realisable value/replacement cost or inventory losses
            is recognised as an expense in the period the write-down or loss occurred. Any write-down reversals
            are recognised as an expense reduction.

            Bases used in assessing loss of service potential for inventory held for distribution at no or minimal cost
            include current replacement cost and technological or functional obsolescence.

      (l)   Non-Current assets held for sale

            Non-current assets are classified as held for sale and stated at the lower of their carrying amount and
            fair value less costs to sell if their carrying amount will be recovered principally through a sale
            transaction rather than through continuing use. This condition is regarded as met only when the sale
            is highly probable and the asset’s sale is expected to be completed one year from the date of
            classification.

            Non-current assets classified as held for sale are presented separately from the other assets in the
            Statement of Financial Position.

      (m)   Property, Plant and Equipment

            Non-current assets are initially recorded at cost or at the value of any liabilities assumed, plus any
            incidental cost involved with the acquisition. Non-current assets (excluding land) are subsequently
            measured at fair value less accumulated depreciation. Where assets are acquired for no
            consideration, or minimal value, they are recorded at their fair value in the Statement of Financial
            Position. However, if the assets are acquired at no or nominal value as part of a restructure of
            administrative arrangements then the assets are recognised at book value, ie the amount recorded by
            the transferor public authority immediately prior to the restructure.

            Componentisation of complex assets is only performed when the complex asset’s fair value at the time
            of acquisition is greater than $1 million.


Page 132
FINANCIAL PERFORMANCE
NOTES TO THE STATEMENT OF COMPREHENSIVE INCOME

         Revaluation of non-current assets

         All non-current assets are valued at written down current cost (a proxy for fair value); and revaluation
         of non-current assets or group of assets is only performed when its fair value at the time of acquisition
         is greater than $1 million and estimated useful life is greater than three years.

         Every three years, the Department revalues its land, buildings, improvements and libraries. However, if
         at any time management considers that the carrying amount of an asset materially differs from its fair
         value, then the asset will be revalued regardless of when the last valuation took place. Non-current
         assets that are acquired between revaluations are held at cost until the next valuation, where they are
         revalued to fair value.

         Any revaluation increment is credited to the asset revaluation surplus, except to the extent that it
         reverses a revaluation decrement of the same asset class previously recognised as an expense, in
         which case the increase is recognised as income in the Statement of Comprehensive Income.

         Any revaluation decrement is recognised in the Statement of Comprehensive Income as an expense,
         except to the extent that it offsets a previous revaluation increment for the same asset class, in which
         case the decrease is debited directly to the asset revaluation surplus to the extent of the credit balance
         existing in the revaluation surplus for that asset class.

         The valuation methodology applied to specific classes of non-current assets under revaluations is as
         follows:

         Land

         Land is recorded on the basis of existing use market value. The most recent valuations for land were
         conducted as at 30 June 2009 by Liquid Pacific and Valcorp Aust Pty Ltd, independent valuers, on the
         basis of existing use market value.

         Buildings and Improvements

         Buildings and improvements are valued at written down current cost. The building data provided in
         the statements relates specifically to buildings, paved areas, utility reticulation, fencing, sheds and other
         site infrastructure assets. The most recent valuations for building and infrastructure assets were
         conducted as at 30 June 2009 by Liquid Pacific and Valcorp Aust Pty Ltd, independent valuers, on the
         basis of written down current cost.

         Buildings under construction are recorded as work in progress and are valued at cost.

         Library Collection

         The library collection is recorded at replacement value. The most recent valuation was carried out as
         at 30 June 2011 by the Australian Valuation Office, an independent valuer, on the basis of
         depreciated replacement cost (a proxy for fair value).

         Plant and Equipment

         Items of plant and equipment are recorded at fair value less accumulated depreciation.

         All Plant and Equipment assets with a value of $10,000 or greater are capitalised.

         Items under $10,000 are recorded in the Statement of Comprehensive Income as an expense in the
         accounting period in which they are acquired.


                                                                                                                    Page 133
NOTES TO THE STATEMENT OF COMPREHENSIVE INCOME


            Intangibles

            An intangible asset is an identifiable non-monetary asset without physical substance. Intangible assets
            are measured at cost. Following initial recognition, intangible assets are carried at cost less any
            accumulated amortisation and any accumulated impairment losses.

            The useful lives of intangible assets are assessed to be either finite or indefinite. The department only
            has intangible assets with finite lives. The amortisation period for the intangible assets is reviewed on
            an annual basis.

            The acquisition of or internal development of software is capitalised only when the expenditure meets
            the definition criteria (identifiability, control and the existence of future economic benefits) and
            recognition criteria (probability of future economic benefits and cost can be reliably measured) and
            when the amount of expenditure is greater than or equal to $10,000.

            All research and development costs that do not meet the capitalisation criteria outlined in AASB 138
            are expensed.

      (n)   Impairment

            All non-current assets are tested for indications of impairment at each reporting date. Where there is
            an indication of impairment, the recoverable amount is estimated. An amount by which the asset’s
            carrying amount exceeds the recoverable amount is recorded as an impairment loss.

            For revalued assets an impairment loss is offset against the asset revaluation surplus.

      (o)   Depreciation and amortisation of Non-Current Assets

            Non-current assets are systematically depreciated/amortised using the straight-line method of
            depreciation over their useful lives. Amortisation is used in relation to intangible assets such as
            software, while depreciation is applied to tangible assets such as property, plant, equipment and
            libraries. All assets are depreciated/amortised from the first day of the acquisition month. This method
            is considered to reflect the consumption of their service potential. The Department reviews useful lives
            of assets annually.

            Land and non-current assets held for sale are not depreciated.

            Depreciation/amortisation is calculated on a straight line basis over the estimated useful life of the
            following classes of assets as follows:


                                                                          Useful life (Years)
            Buildings                                                          15 - 60
            Improvements                                                        5 - 25
            Paved areas                                                        40 - 50
            Computing and communication equipment                               1 - 20
            Other plant and equipment                                           1 - 47
            Library collection                                                 12 - 15
            Intangibles                                                        10 - 15


Page 134
FINANCIAL PERFORMANCE
NOTES TO THE STATEMENT OF COMPREHENSIVE INCOME

     (p)   Payables

           Payables include creditors, accrued expenses and employment on-costs.

           Creditors represent the amounts owing for goods and services received prior to the end of the
           reporting period that are unpaid at the end of the reporting period. Creditors include all unpaid
           invoices received relating to the normal operations of the Department.

           Accrued expenses represent goods and services provided by other parties during the period that are
           unpaid at the end of the reporting period and where an invoice has not been received.

           All payables are measured at their nominal amount, are unsecured and are normally settled within 30
           days from the date of the invoice or date the invoice is first received.

           Employee benefit on-costs include superannuation contributions, workers compensation and payroll
           tax with respect to outstanding liabilities for salaries and wages, long service leave and annual leave.

           Payroll tax is a State tax levied on total gross salary paid plus (non-cash) benefits and employer
           superannuation contributions. The estimated amount of payroll tax payable in respect of employee
           benefits liabilities is also shown as a payable in the Statement of Financial Position. Any increase or
           decrease in the level of required payroll tax provision is charged as an increase or decrease in the
           payroll tax expense in the Statement of Comprehensive Income. The payroll tax liability is only payable
           when employee benefits are paid.

           The Department makes contributions to several State Government and externally managed
           superannuation schemes. These contributions are treated as an expense when they occur. There is
           no liability for payments to beneficiaries as they have been assumed by the respective superannuation
           schemes. The only liability outstanding at balance date relates to any contributions due but not yet
           paid to the South Australian Superannuation Board and externally managed schemes.

     (q)   Employee Benefit and Employment Related Liabilities

           Liabilities have been established for various employee benefits arising from services rendered by
           employees to balance date. Employee benefits include entitlements to wages and salaries, long
           service leave, annual leave and non-attendance days. Long-term benefits are measured at present
           value and short-term employee benefits are measured at nominal amounts.

           Non-attendance days are accrued annually for employees engaged under the Technical and Further
           Education Act 1975 but are non-cumulative.

           Employment related expenses include on-costs such as employer superannuation and payroll tax on
           employee entitlements together with the workers’ compensation insurance premium. These are
           reported under Payables as on-costs on employee benefits (refer Note 24).

           Salaries, wages, annual leave and non-attendance days

           Liabilities for salaries and wages are measured as the amount unpaid at the reporting date at
           remuneration rates current at reporting date.

           The annual leave liability is expected to be payable within twelve months and is measured at the
           undiscounted amount expected to be paid. In the unusual event where salary and wages and annual
           leave are payable later than 12 months, the liability will be measured at present value.


                                                                                                                 Page 135
NOTES TO THE STATEMENT OF COMPREHENSIVE INCOME


            Long service leave

            The liability for long service leave is recognised after an employee has completed six and a half years of
            service. An actuarial assessment of long service leave undertaken by the Department of Treasury and
            Finance based on a significant sample of employees throughout the South Australian public sector
            determined that the liability measured using the short hand method was not materially different from
            the liability measured using the present value of expected future payments. This calculation is
            consistent with the Department’s experience of employee retention and leave taken.

            Sick leave

            Sick leave is not provided for in the financial report, as it is non-vesting and the average sick leave taken
            in future years by employees is estimated to be less than the annual entitlement for sick leave.

      (r)   Financial Assets (Investment)

            In accordance with AASB 139 other financial assets are classified into the following specified
            categories:

            financial assets 'at fair value through profit or loss', 'held-to-maturity' investments, 'available-for-sale'
            financial assets, and 'loans and receivables'. The classification depends on the nature and purpose of
            the financial assets and is determined at the time of initial recognition.

            Available-for-sale financial assets

            Certain shares held are classified as being available-for-sale and are stated at fair value less impairment.
            Gains and losses arising from changes in fair value are recognised directly in the available-for-sale
            revaluation surplus, until the investment is disposed of or is determined to be impaired, at which time
            the cumulative gain or loss previously recognised in the available-for-sale revaluation surplus is
            included in profit or loss for the period. This category includes investments classified as ‘available-for-
            sale’ and any investments that do not fit the definitions for inclusion in any of the categories contained
            in AASB 139. Consequently it should not be assumed that the Department has plans to dispose of
            these assets.

      (s)   Provisions

            A liability has been reported to reflect unsettled workers compensation claims. The workers
            compensation provision is based on an actuarial assessment performed by the Public Sector
            Workforce Relations Division of the Department of the Premier and Cabinet.

            Provisions are recognised when the Department has a present obligation as a result of a past event, it
            is probable that an outflow of resources embodying economic benefits will be required to settle the
            obligation and a reliable estimate can be made of the amount of the obligation.

            When the department expects some or all of a provision to be reimbursed, the reimbursement is
            recognised as a separate asset but only when the reimbursement is virtually certain. The expense
            relating to any provision is presented in the Statement of Comprehensive Income net of any
            reimbursement.

            Provisions are measured at the present value of management’s best estimate of the expenditure
            required to settle the present obligation at the Statement of Financial Position date. If the effect of the
            time value of money is material, provisions are discounted for the time value of money and the risks
            specific to the liability.


Page 136
FINANCIAL PERFORMANCE
NOTES TO THE STATEMENT OF COMPREHENSIVE INCOME

     (t)   Leases

           The Department has entered into a number of operating lease agreements, as lessee, for buildings
           and other facilities where the lessors effectively retain all risks and benefits incidental to ownership of
           the items held under the operating leases.

           Operating lease payments are recognised as an expense in the Statement of Comprehensive Income
           on a straight-line basis over the lease term. The straight-line basis is representative of the pattern of
           benefits derived from the leased assets.

           Details of commitments of current non-cancellable operating leases are disclosed at Note 32.

     (u)   Accounting for Taxation

           The Department is not subject to income tax. The Department is liable for payroll tax, fringe benefits
           tax, goods and services tax (GST), emergency services levy and local government rate equivalents.

           Income, expenses and assets are recognised net of the amount of GST except:
               when the GST incurred on a purchase of goods or services is not recoverable from the
                Australian Taxation Office, in which case the GST is recognised as part of the cost of acquisition
                of the asset or as part of the expense item applicable; and
               receivables and payables, which are stated with the amount of GST included.

           The net amount of GST recoverable from, or payable to, the Australian Taxation Office is included as
           part of receivables or payables in the Statement of Financial Position.

           Cash flows are included in the Statement of Cash Flows on a gross basis and the GST component of
           cash flows arising from investing and financing activities, which is recoverable from, or payable to, the
           Australian Taxation Office is classified as part of operating cash flows.

           Unrecognised Contractual Commitments and contingencies are disclosed net of the amount of GST
           recoverable from, or payable to the Australian Taxation Office. If GST is not payable to, or recoverable
           from the Australian Taxation Office, the commitments and contingencies are disclosed on a gross
           basis.

     (v)   Financial Guarantees

           At the time a financial guarantee contract is issued, it is recognised as a liability initially measured at fair
           value. If there is a material increase in the likelihood that the guarantee may have to be exercised, the
           financial guarantee is measured at the higher of the amount determined in accordance with AASB
           137 Provisions, Contingent Liabilities and Contingent Assets and the amount initially recognised less
           cumulative amortisation, where appropriate.

           In the determination of fair value, consideration is given to the following factors:
                the overall capital management / prudential supervision framework in operation;
                the protection provided by the State Government by way of funding should the probability of
                 default increase;
                the probability of default by the guaranteed party; and
                the likely loss to the Department in the event of default.

           The Department has reviewed its financial guarantees and determined that there is no material liability
           to be recognised for financial guarantee contracts as at 30 June 2011 (there was no material liability
           recognised for financial guarantee contracts in 2010).

           Whilst no liability has been recognised for financial guarantee contracts, further note disclosures
           relating to financial guarantees are contained at Note 33 Contingent Assets and Liabilities.


                                                                                                                         Page 137
NOTES TO THE STATEMENT OF COMPREHENSIVE INCOME


      (w)   Unrecognised contractual commitments and contingent assets and liabilities

            Commitments include those operating, capital and outsourcing commitments arising from contractual
            or statutory sources and are disclosed at their nominal value.

            Contingent assets and contingent liabilities are not recognised in the Statement of Financial Position,
            but are disclosed by way of a note and, if quantifiable, are measured at nominal value.

            Unrecognised contractual commitments and contingencies are disclosed net of the amount of GST
            recoverable from, or payable to the Australian Taxation Office. If GST is not payable to, or recoverable
            from the Australian Taxation Office, the commitments and contingencies are disclosed on a gross
            basis.

      (x)   Rounding

            All amounts in the financial statements and accompanying notes have been rounded to the nearest
            thousand dollars ($’000).


 3.   Changes in Accounting Policies

            In accordance with the amendments to APS 4.8 within Accounting Policy Framework II General
            Purpose Financial Statements Framework, effective 1 July 2010, the Department has disclosed all
            employees whose normal remuneration is equal to or greater than the base executive level
            remuneration. Previously APS 4.8 within APF II required the Department to disclose all employees
            whose normal remuneration was equal to or greater than $100,000. This change is reflected in Note 5.

            During 2010-11 the Department changed various asset policies to improve alignment with the
            Department of Treasury and Finance’s Accounting Policy Framework III Asset Accounting Framework.
            These changed policies have resulted in the recognition of intangible assets above $10,000 for the
            period ending 30 June 2011 as well as the recognition of intangible assets above $10 000 in prior
            periods. The impact on prior periods has been disclosed within the Statement of Changes in Equity.

            Except for AASB 2009-12, which the department has early-adopted, the Australian accounting
            standards and interpretations that have recently been issued or amended but are not yet effective,
            have not been adopted by the department for the period ending 30 June 2011. The department has
            assessed the impact of the new and amended standards and interpretations and considers there will
            be no impact on the accounting policies or the financial statements of the department.


Page 138
FINANCIAL PERFORMANCE
NOTES TO THE STATEMENT OF COMPREHENSIVE INCOME

4.   Activities and sub-activities

     Activities - Employment and Skills Formation

     Description/Objective: To strengthen the economic prosperity and social well-being of South Australians
     through strategic employment, skills formation and workforce development.

       Sub-activities - Vocational Education and Training

       Provision of post secondary vocational education and training (VET) by TAFE SA and other registered
       training organisations including:
                 resource allocation of contestable and non-contestable funds;
                 funding of apprenticeships and traineeships;
                 support for post secondary training and education; and
                 providing state and national policy advice.

       Sub-activities - Learning, Workforce Participation Development and Workforce Development

       Addressing the State’s economic development and social inclusion objectives by:
               providing opportunities for people to participate in employment, training, skills development,
                and adult community education;
               meeting the current and future labour and skill needs of industry; and
               providing state and national policy advice.

       Sub-activities - Regulatory Services

       Administering the state’s further education and training system through:
                provision of registration, accreditation and approval services for registered training organisations;
                quality oversight of the state vocational education system, through the Training and Skills
                 Commission;
                administration of apprenticeships and traineeship system; and
                providing state and national policy advice

       Sub-activities - International and Higher Education

       Supporting the development of Adelaide as a centre for education, international education and South
       Australian education exports including the provision of marketing services, analysis and student and
       community support.

       Provision of high-level strategic policy advice to the Minister on higher education policy and planning.


                                                                                                                    Page 139
NOTES TO THE STATEMENT OF COMPREHENSIVE INCOME


      Activities - Science, Technology and Innovation

      Description/Objective: Provides the Government’s principal strategic focus for science, technology,
      information economy and innovation policy development and program delivery that links government,
      business, industry and education sectors.

        Sub-activities - Science and Innovation

        Provision of high level strategic advice to the Minister on maximising economic, environmental and social
        benefits from the State’s scientific research and innovation by:
                  identifying strategic priorities for State Government investment;
                  raising awareness and understanding of the benefits of science and innovation amongst
                   government, business and the community;
                  facilitating coordinated and strategic bids for Commonwealth grants; and
                  facilitating coordination of education and research activity with end-user (industry) requirements
                   to maximise the benefits for South Australia.

        Sub-activities - Information Economy

        Provision of high level strategic policy advice to the Minister and Government on the information economy
        and the ICT sector that:
                  raises awareness and understanding of the information economy among government, business,
                   industry and education providers;
                  develops strategy and facilities programs and projects relevant to promoting the information
                   economy; and
                  facilitate bids for significant Commonwealth grants.

        Sub-activities – Bioscience Industry Development

        Development of the bioscience industry through providing assistance in business development, finance,
        infrastructure and marketing.

        Sub-activities – Innovation Investment

        Provision of seed capital and business guidance to innovative companies commercialising research and
        development.


Page 140
FINANCIAL PERFORMANCE
NOTES TO THE STATEMENT OF COMPREHENSIVE INCOME


                                                                                  2011               2010
                                                                                  $'000              $'000
   5   Employee Benefits
       Salaries and Wages (including Annual Leave)                             227,305             222,387
       Superannuation                                                           23,888              23,543
       Payroll Tax                                                              13,020              12,942
       Long Service Leave                                                       10,340               8,876
       Workers’ Compensation                                                     3,730               3,827
       Targeted Voluntary Separation Payments                                    3,681              18,006
       Other Employee Related Costs                                                943               1,051
                                                                               282,907             290,632


       Targeted Voluntary Separation Packages (TVSP's)
       Amount paid to these employees:
       TVSP's                                                                     3,681             18,006
       Annual Leave and Long Service Leave Accrued paid during the
       Period                                                                     1,178              5,233
                                                                                  4,859             23,239

       Funding from the Department of Treasury and Finance (refer
       note 17)                                                                   3,307              9,152
       Net amount paid to employees                                               1,552             14,087

       Number of Employees who were paid TVSPs during the report-
       ing period                                                                    36                161


                                                                                   2011                2010
       Remuneration of Employees
       The number of employees whose remuneration received or receivable falls within the following bands:

       $127,500 to $130,699*                                                         0                   2
       $130,700 to $140,699                                                         15                   5
       $140,700 to $150,699                                                          6                   4
       $150,700 to $160,699                                                          4                   8
       $160,700 to $170,699                                                          2                   4
       $170,700 to $180,699                                                          5                   3
       $180,700 to $190,699                                                          2                   2
       $190,700 to $200,699                                                          0                   2
       $200,700 to $210,699                                                          2                   2
       $210,700 to $220,699                                                          1                   0
       $220,700 to $230,699                                                          4                   2
       $230,700 to $240,699                                                          1                   1
       $260,700 to $270,699                                                          2                   1
       $270,700 to $280,699                                                          0                   1
       $280,700 to $290,699                                                          0                   1
       $300,700 to $310,699Δ                                                         1                   0
       $310,700 to $320,699                                                          0                   1
       $320,700 to $330,699O                                                         2                   1


                                                                                                              Page 141
NOTES TO THE STATEMENT OF COMPREHENSIVE INCOME


                                                                                      2011                  2010
                              ΔO
       $340,700 to $350,699                                                              1                     1
       $350,700 to $360,699ΔO                                                            1                     2
       $360,700 to $370,699Δ                                                             2                     0
       $380,700 to $390,699O                                                             0                     1
       $450,700 to $460,699Δ                                                             1                     0
       Total number of employees                                                         52                   44

       * This bandwidth has been included for the purposes of reporting comparative figures based on the
       executive base level remuneration rate for 2009-10.
       Δ
           This bandwidth includes employees that have received TVSP's during 2010-11.
       O
           This bandwidth includes employees that have received TVSP's during 2009-10.


       The table includes all employees who received remuneration equal to or greater than the base executive
       remuneration level during the year. Remuneration of employees reflects all costs of employment
       including salaries and wages, superannuation contributions, separation packages, fringe benefits tax and
       any other salary sacrifice benefits.

       The total remuneration received by these employees for the year was $10.3 million ($8.7 million).

       For 2010-2011, the above figures include six non-executive employees (five in 2009-10) who took a
       Targeted Voluntary Separation Package (TVSP's) during the year. The total remuneration received by
       these employees for the year was $2.2 million ($1.7 million).

       For 2010-11, the above figures include 4 non-executive employees (one in 2009-10) who received leave
       paid on termination payments during the year and were not paid TVSP's.


       Accounting Policy Change
       In accordance with the revised Accounting Policy Framework II General Purpose Financial Statements
       Framework, the department has changed its accounting policy and now discloses all employees who
       receive remuneration equal to or greater than the base executive remuneration level rather than all
       employees who have received remuneration equal or greater than $100,000. The impact of this change
       in accounting policy is the number of employees disclosed (including TVSP's) has reduced by 260 for
       2011 and 218 for 2010.


Page 142
FINANCIAL PERFORMANCE
NOTES TO THE STATEMENT OF COMPREHENSIVE INCOME


                                                                                     2011                 2010
                                                                                     $'000                $'000
   6   Supplies and Services
       Funding to Non-TAFE Providers for Vocational Education and
       Training                                                                    45,474               41,731
       Printing and Consumables                                                    10,667               11,737
       Minor Works, Maintenance and Equipment                                      18,731               19,076
       Information Technology Infrastructure and Communication                     20,498               17,730
       Fees - Contracted Services (Including Consultants)                          17,710               18,642
       Trainee & Apprenticeship Reimbursements                                        733                  996
       Utilities                                                                    7,251                7,601
       Cleaning                                                                     9,398                9,699
       Vehicle and Travelling Expenses                                              6,742                6,717
       Rentals and Leases                                                           6,233                6,193
       Books, Materials and Copyright                                               3,031                3,501
       SATAC and Student Support                                                    1,932                2,113
       Other                                                                        9,575               10,444
       Total Supplies and Services                                                157,975              156,180


       Supplies and Services Provided by Entities Within the SA Government
       Funding to Non-TAFE Providers for Vocational Education and
       Training                                                                      2,381                 712
       Minor Works, Maintenance and Equipment                                       15,072              13,986
       Information Technology Infrastructure and Communication                       3,716               3,142
       Fees - Contracted Services (Including Consultants)                            8,089               8,476
       Utilities                                                                     1,357               1,335
       Cleaning                                                                      7,986               8,404
       Vehicle and Travelling Expenses                                               2,878               3,005
       Rentals and Leases                                                            4,267               4,252
       Other                                                                           538                 562
                                                                                    46,284              43,874

       The total supplies and services amount disclosed includes GST amounts not-recoverable from the ATO
       due to the Department not holding a valid tax invoice or payments relating to third party arrangements.


       Consultancy
       The number and dollar amount of Consultancies paid/payable (included in supplies and services) that fell
       within the following bands:
                                                                        #                   #
       Below $10,000                                                    1            10     5               21
       Between $10,000 and $50,000                                      3            62     4             129
       Above $50,000                                                    1            88     1               57
       Total paid/payable to the consultants engaged (GST excl)                    160                    207


                                                                                                                 Page 143
NOTES TO THE STATEMENT OF COMPREHENSIVE INCOME


                                                                                2011     2010
                                                                                $'000    $'000
    7   Grants and Subsidies
        Employment Programs                                                    24,029   22,116
        Vocational Education and Training Programs                             12,125    8,223
        Science and Information Economy Programs                               22,444   25,250
        Tertiary Student Transport Concessions                                 11,157   10,965
        National Training Infrastructure Program                                2,135    4,526
        Other Specific Grants                                                   2,663    1,225
        Total Grants and Subsidies                                             74,553   72,305


        Grants and Subsidies Paid/Payable to Entities Within the SA
        Government
        Employment Programs                                                     1,787    4,022
        Vocational Education and Training Programs                                 80    1,919
        Science and Information Economy Programs                               11,179   12,048
        Tertiary Student Transport Concessions                                 11,157   10,965
        National Training Infrastructure Program                                  128      107
        Other Specific Grants                                                     974      312
                                                                               25,305   29,373


    8   Depreciation and Amortisation
        Buildings and Improvements                                             14,481   13,283
        Plant and Equipment                                                     2,275    2,300
        Library                                                                 2,282    2,235
        Intangibles                                                               261       36
        Total Depreciation and Amortisation                                    19,299   17,854


    9   Other Expenses
        Audit Fees (refer note 10)                                               290      283
        Allowance for Doubtful Debts and Debt Write-offs                         190      394
        Other                                                                      2       10
        Total Other Expenses                                                     482      687


   10   Auditor's Remuneration
        Audit Fees Paid/Payable to the Auditor-General's Department              260      247
        Other Audit fees                                                          30       36
        Total Auditor's Remuneration Paid/Payable                                290      283

        No other services were provided by the Auditor-General’s Department.


Page 144
FINANCIAL PERFORMANCE
NOTES TO THE STATEMENT OF COMPREHENSIVE INCOME


                                                                                      2011                 2010
                                                                                      $'000                $'000
  11   Commonwealth Grants
       Productivity Places Program                                                    8,437               26,907
       Pre-Apprenticeship Training                                                    3,493                    0
       Language Literacy & Numeracy Delivery Statewide                                3,322                    0
       Indigenous Employment Programs (IEP) Projects                                  2,610                    0
       National Training Infrastructure Program                                       1,540                1,228
       Australian Flexible Learning Framework                                         1,498                    0
       Group Training Scheme                                                          1,189                1,311
       Training Infrastructure Investment for Tomorrow (TIIFT)                          935               17,765
       Better TAFE Facilities                                                           732               13,903
       Aged Care Workforce                                                              689                    0
       National VET Data Strategy Action Group                                          500                  500
       Remote Indigenous Public Internet Access                                          42                   42
       Targeting Skills Needs in Regions                                                  0                  170
       Skills Sub Group                                                                   0                  895
       TAFE Fee Waivers for Childcare Qualifications                                    580                  640
       Other Specific Commonwealth Revenue                                            2,819                2,431
       Total Commonwealth Grants                                                     28,386               65,792


       2010-11 Commitments
       The Productivity Places Program received $8.4 million of Commonwealth revenue in 2010-11 which was
       fully spent.

       As part of the Pre-Apprenticeship Training Program, $3.5 million was received in 2010-11 to deliver the
       AKPA project under the National Partnership Agreement on Pre-Apprenticeship Training, of which
       $1.8 million is committed to be spent in 2011-12.

       The Language Literacy & Numeracy Delivery Statewide Program received $3.3 million of Commonwealth
       revenue in 2010-11 which was fully spent.

       The Indigenous Employment Programs Projects received $2.6 million of Commonwealth contributions in
       2010-11 of which a commitment exists to spend the funding in the 2011-12 and 2012-13 financial years.
       The purpose of the funding is for six Aboriginal projects - Mentoring Aboriginal Apprentices; Mentoring
       Aboriginal People in Mining; Try a Trade Workshops; Pre-Employment Training; Up-skilling Indigenous
       Workers; Industry Clusters Training Support.

       The National Training Infrastructure Program received $1.5 million of Commonwealth contributions in
       2010-11 which is committed to be spent in 2011-12 and out years. The committed funds are for the
       provision and development of skills centres and capital equipment.

       The Aged Care Workforce Program received $0.7 million in 2010-11 of which $0.5 million is committed
       to be spent in 2011-2012 as part of providing Personal Care Workers opportunities to upgrade their
       qualifications.

       The National VET Data Strategy Action Group received $0.5 million in 2010-11, of which a commitment
       exists to spend $0.4 million for the agreed projects of the Action Group during 2011-12 financial year.
       The committed funds are for the purpose of progress work of the National VET Data Strategy.


                                                                                                                 Page 145
NOTES TO THE STATEMENT OF COMPREHENSIVE INCOME


        2009-10 Commitments
        The Productivity Places Program received $26.9 million of Commonwealth revenue in 2009-10, of which
        a commitment exists to spend $19.6 million in the 2010-11 financial year.

        The National Training Infrastructure Program received $1.2 million of Commonwealth contributions in
        2009-10 of which a commitment exists to spend $1.2 million in the 2010-11 financial year. The
        committed funds are for the provision and development of skills centres and capital equipment.

        DFEEST has received $1.3 million of Commonwealth revenue for the Group Training Scheme in the
        financial year, $0.2 million of which will be incurred in the 2010-11 financial year.

        The National VET Data Strategy Action Group received a $0.5 million one-off grant, of which a
        commitment exists to utilise $0.3 million for the agreed projects of the Action Group during 2010-11
        financial year. The committed funds are for the purpose of progress work of the National VET Data
        Strategy.

        The Skills Sub Group received a $0.9 million one-off grant, of which a commitment exists to spend $0.8
        million for projects which align to national priorities.

        DFEEST has received $42,000 of Commonwealth revenue for the Remote Indigenous Public Internet
        Access in the financial year, $17,000 of which will be incurred in the 2010-11 financial year.


                                                                                       2011                2010
                                                                                       $'000               $'000
   12   Student and Other Fees and Charges
        Sales/Fee for Service Revenue                                                57,697               63,370
        Student Enrolment Fees and Charges                                           32,059               33,696
        Other User Fees and Charges                                                   5,475                3,541
        Total Fees and Charges Received/Receivable                                   95,231              100,607


        Fees and Charges Received/Receivable from Entities Within the SA Government
        Sales/Fee for Service Revenue                                             1,782                    1,345
        Student Enrolment Fees and Charges                                        1,874                      931
        Other User Fees and Charges                                                 563                      189
                                                                                  4,219                    2,465


   13   Other Grants and Contributions
        Grants and Subsidies Revenue                                                   3,065               4,458
        Miscellaneous Contributions                                                      733                 854
        Donations                                                                         49                  59
        Grants from Entities Within the SA Government                                  4,458               4,518
        Total Other Grants and Contributions                                           8,305               9,889


   14   Investment Income
        Dividends (refer note 17)                                                       285                       0
        Interest from Entities External to the SA Government                             38                      11
        Total Investment Income                                                         323                      11


Page 146
FINANCIAL PERFORMANCE
NOTES TO THE STATEMENT OF COMPREHENSIVE INCOME


                                                                                            2011               2010
                                                                                            $'000              $'000
  15   Net (Loss)/Gain on Disposal of Non-Current Assets
       Land and Buildings
       Proceeds from Disposals                                                                  0                560
       Less: Net Book Value of Assets Disposed                                              (245)              (419)
                                                                                            (245)                141

       Plant and Equipment
       Proceeds from Disposals                                                                 11                 53
       Less: Net Book Value of Assets Disposed                                              (235)              (325)
                                                                                            (224)              (272)

       Total Assets
       Total Proceeds from Disposal                                                            11                613
       Less: Net Book Value of Assets Disposed                                              (480)              (744)
       Total Net Loss on disposal of Non-Current Assets                                     (469)              (131)


  16   Other Income
       Reimbursement of Travel                                                                107                  0
       Recoup of Salaries                                                                     201                859
       Insurance Recoveries                                                                   311                  0
       Grant Recoveries                                                                       579                  0
       Sundry Income                                                                        2,920              2,360
       Total Other Income                                                                   4,118              3,219


  17   Revenues from/Payments to SA Government
       Revenues from SA Government
       Appropriations from Consolidated Account Pursuant to the
       Appropriation Act                                                                 382,039             372,944
       Accrual Appropriation                                                               9,177              11,563
       Appropriation Transfers from Contingency1                                           3,472              24,126
                                                                                         394,688             408,633
       Payments to SA Government
       Return of Surplus Cash Pursuant to Cash Alignment Policy                          (11,221)            (9,923)
       Other payments to Consolidated Account 2                                           (1,422)                  0
                                                                                         (12,643)            (9,923)

       Total Revenues from/Payments to SA Government                                     382,045             398,710

       1
           Includes an amount of $3.3 million (9.2 million) for funding of TVSP payments (Refer to note 5)
       2
           Includes payments to DTF for dividends received and land sales


                                                                                                                   Page 147
NOTES TO THE STATEMENT OF COMPREHENSIVE INCOME


                                                                                           2011                 2010
                                                                                           $'000                $'000
    18     Cash and Cash Equivalents
           Deposits with the Treasurer                                                    59,823               51,707
           Special Deposit Account with the Department of Treasury and
           Finance                                                                         4,798               34,209
           Cash on Hand                                                                       54                   65
           Total Cash and Cash Equivalents                                                64,675               85,981


           Deposits with the Treasurer
           Comprises funds held in the Accrual Appropriation Excess Funds Account. The balances of these funds
           are not available for general use (i.e. funds can only be used in accordance with the Treasurer's/Under
           Treasurer's approval).

           Interest rate risk
           Cash on hand is non-interest bearing. Deposits at call and with the Treasurer earn interest at a floating
           interest rate, based on daily bank deposit rates. The carrying amount of cash and cash equivalents
           represents fair value.


    19     Receivables
           Current
           Fees and Charges Receivable                                                    13,230               13,111
           Less: Allowance for Doubtful Debts                                             (2,076)              (2,471)
           Prepayments                                                                      1,322                1,602
           GST Recoverable from ATO                                                         4,201                5,523
           Other Receivables                                                                  364                  133
           Total Current Receivables                                                      17,041               17,898

           Non-Current
           Workers compensation receivable                                                   239                  248
           Total Non-current Receivables                                                     239                  248

           Total Receivables                                                              17,280               18,146

           Receivables from SA Government Entities
           Receivables                                                                       983                1,492
           Workers Compensation Receivable                                                   239                  248
           Prepayments                                                                        14                    0
                                                                                           1,236                1,740


Page 148
FINANCIAL PERFORMANCE
NOTES TO THE STATEMENT OF COMPREHENSIVE INCOME


       Movement in the allowance for doubtful debts
       The allowance for doubtful debts (allowance for impairment loss) is recognised when there is objective
       evidence (i.e. calculated on past experience and current and expected changes in client credit rating)
       that a receivable is impaired.

       An allowance for impairment loss has been recognised in 'other expenses' in the Statement of
       Comprehensive Income for specific debtors and debtors assessed on a collective basis for which such
       evidence exists.

                                                                                          2011               2010
                                                                                          $'000              $'000

       Carrying amount at the beginning of the period                                     2,471              2,204
       Increase in the allowance                                                            192                420
       Amounts written off                                                                (587)              (153)
       Carrying amount at the end of the period                                           2,076              2,471


       Interest rate risk
       Receivables are raised for all goods and services provided for which payment has not been received.
       Receivables are normally settled within 30 days. Trade receivables, prepayments and accrued revenues
       are non-interest bearing.

       Other than as recognised in the allowance for doubtful debts, it is not anticipated that counterparties will
       fail to discharge their obligations.

       The carrying amount of receivables approximates net fair value due to being receivable on demand.
       There is no concentration of credit risk.

       (a)    Maturity analysis of receivables - Please refer to table 38.3 in Note 38.

       (b)   Categorisation of financial instruments and risk exposure information - Please refer to note 38.


  20   Non-Current Assets Held for Sale
       Land at Fair Value                                                                 1,578                   0
                                                                                          1,578                   0

       During 2010-11 land at the old Victor Harbor site was identified as surplus to requirements. It is
       anticipated that the land at Victor Harbor will be sold by 30 June 2012.


                                                                                                                      Page 149
NOTES TO THE STATEMENT OF COMPREHENSIVE INCOME


                                                                                       2011               2010
                                                                                       $'000              $'000
    21     Property, Plant and Equipment
           Land and Buildings
           Land at Fair Value                                                        154,212            155,790
           Buildings and Improvements at Fair Value/Cost                             938,489            924,378
           Accumulated Depreciation                                                (481,473)          (468,325)
           Construction Work in Progress                                               2,065             12,562
                                                                                     613,293            624,405
           Plant and Equipment
           Plant and Equipment at Cost (Deemed Fair Value)                            33,457              32,498
           Accumulated Depreciation                                                 (17,891)            (17,149)
                                                                                      15,566              15,349
           Libraries
           Libraries at Valuation                                                     21,660              29,877
           Accumulated Depreciation                                                 (14,838)            (18,940)
                                                                                       6,822              10,937

           Total Property, Plant and Equipment                                    1,149,883           1,155,105
           Total Accumulated Depreciation at the end of the period                (514,202)           (504,414)
           Total Property, Plant and Equipment                                      635,681             650,691


           Valuation of Libraries
           The valuation of Libraries was performed by Kim Adams and Ian Noble independent valuers from Aus-
           tralian Valuation Office as at 30 June 2011.


           Impairment
           There were no indications of impairment of property and plant and equipment assets at 30 June 2011.


Page 150
NOTES TO THE STATEMENT OF COMPREHENSIVE INCOME


                         Reconciliations

                         Reconciliations of the carrying amount of each class of non-current assets at the beginning and end of the current financial year are set out below:

                                                                1 July 2010                                   Net revaluation                                       30 June 2011
                                                                   Carrying                                       Increment/    Other Move-                              Carrying
                                                                    amount       Additions     Disposals        (decrement)           ments       Depreciation           amount
                                                                      $’000         $’000         $’000                 $’000         $’000             $’000              $’000
                         2011
                         Land at fair value                        155,790               0             0                    0         (1,578)                0            154,212
                         Buildings and improvements                456,053               0         (245)                    0          15,689         (14,481)            457,016
                         Plant & Equipment                          15,349           2,727         (235)                    0               0          (2,275)             15,566
                         Construction work in progress              12,562           5,482             0                    0        (15,979)                0              2,065
                         Libraries at valuation                     10,937             541             0              (2,374)               0          (2,282)              6,822
                         Sub Total                                 650,691           8,750         (480)              (2,374)         (1,868)         (19,038)            635,681


                                                                1 July 2009                                   Net revaluation                                       30 June 2010
                                                                   Carrying                                       Increment/    Other Move-                              Carrying
                                                                    amount       Additions     Disposals        (decrement)           ments       Depreciation           amount
                                                                      $’000         $’000         $’000                 $’000         $’000             $’000              $’000
                         2010
                                                                                                                                                                                    FINANCIAL PERFORMANCE


                         Land at fair value                        154,715          1,075              0                    0               0                0            155,790
                         Buildings and improvements                440,851              0              0                    0          28,485         (13,283)            456,053
                         Plant & Equipment                          15,405          2,569          (325)                    0               0          (2,300)             15,349
                         Construction work in progress               1,621         39,426              0                    0        (28,485)                0             12,562
                         Libraries at valuation                     12,583            589              0                    0               0          (2,235)             10,937
                         Total                                     625,175         43,659          (325)                    0               0         (17,818)            650,691


Page 151
NOTES TO THE STATEMENT OF COMPREHENSIVE INCOME


Page 152
                                                                                     2011                   2010
                                                                                     $'000                  $'000
           22   Intangibles
                Computer Software                                                   14,910                    717
                Accumulated amortisation                                             (297)                    (36)
                Intangible Work in Progress                                          1,282                  9,228
                Total Computer software                                             15,895                  9,909

                The computer software predominantly relates to the department's Student Information System (SIS) with a remaining useful life of 10 years and carrying amount of
                $12.8 million.

                The department has a $1.06 million contractual commitment for the acquisition of Phoenix in 2011-2012.


                Impairment
                There were no indications of impairment on intangible assets at 30 June 2011.


                Reconciliations

                                                        1 July 2010                                 Net revaluation                                    30 June 2011
                                                           Carrying                                     Increment/           Other                          Carrying
                                                            amount      Additions     Disposals       (decrement)        Movements     Amortisation         amount
                                                              $'000        $'000         $'000                $'000          $'000           $'000            $'000

                Intangibles                                    681              0               0                    0       14,193            (261)          14,613
                Intangibles work in progress                 9,228          6,247               0                    0     (14,193)                0           1,282
                Total                                        9,909          6,247               0                    0            0            (261)          15,895


                                                        1 July 2009                                 Net revaluation                                    30 June 2010
                                                           Carrying                                     Increment/           Other                          Carrying
                                                            amount      Additions     Disposals       (decrement)        Movements     Amortisation         amount
                                                              $'000        $'000         $'000                $'000          $'000           $'000            $'000

                Intangibles                                      0            717               0                    0           0              (36)              681
                Intangible Work in Progress                    881          8,347               0                    0           0                 0            9,228
                Total                                          881          9,064               0                    0           0              (36)            9,909
FINANCIAL PERFORMANCE
NOTES TO THE STATEMENT OF COMPREHENSIVE INCOME


                                                                                       2011                 2010
                                                                                       $'000                $'000
  23   Inventories
       Current
       Inventories Held for Sale                                                         492                    513
       Inventories Held for Distribution                                                 395                    459
       Total Inventories                                                                 887                    972


  24   Payables
       Current
       Creditors                                                                      12,999               23,294
       Accrued Expenses                                                                9,833               11,729
       Employment On-Costs                                                             4,711                4,276
       Other                                                                              69                  108
       Total Current Payables                                                         27,612               39,407

       Non-Current
       Employment on-costs                                                             1,984                2,023
       Total Non-current Payables                                                      1,984                2,023

       Total Payables                                                                 29,596               41,430

       Payables to SA Government Entities
       Creditors                                                                       3,319               12,925
       Accrued Expenses                                                                5,656                8,406
       Employment On-costs                                                             6,695                6,299
                                                                                      15,670               27,630

       As a result of an actuarial assessment performed by the Department of Treasury and Finance, the
       average factor for the calculation of employer superannuation cost on-cost has changed from the 2010
       rate of 10.8 percent to 10.3 percent. These rates are used in the employment oncost calculation.


       Interest rate and credit risk
       Creditors are raised for all amounts billed but unpaid and accruals are raised where goods and services
       are received but an invoice has not yet been received. Sundry Creditors are normally settled within 30
       days. Employment on-costs are settled when the respective employee benefit that they relate to is
       discharged. All payables are non-interest bearing. The carrying amount of payables represents fair value
       due to the amounts being payable on demand.

       (a)   Maturity analysis of payables - Please refer to table 38.3 in Note 38.
       (b)   Categorisation of financial instruments and risk exposure information - Please refer to note 38.


                                                                                                                  Page 153
NOTES TO THE STATEMENT OF COMPREHENSIVE INCOME


                                                                                         2011                  2010
                                                                                         $'000                 $'000
  25   Employee Benefits
       Current
       Annual Leave                                                                     10,031                 9,559
       Long Service Leave                                                                7,301                 4,848
       Accrued Salaries and Wages                                                        5,213                 4,451
       Non-Attendance Days                                                               5,232                 5,040
       Total Current Employee Benefits                                                  27,777                23,898


       Non-Current Employee Benefits
       Long Service Leave                                                               48,114                48,379
       Total Non-Current Employee Benefits                                              48,114                48,379

       Total Employee Benefits                                                          75,891                72,277

       The total current and non-current employee benefits (i.e. aggregate employee benefit plus related on-
       costs) for 2011 is $32.4 million and $50.1 million respectively.

       As a result of an actuarial assessment performed by the Department of Treasury and Finance, the
       benchmark for the measurement of long service leave liability has changed from the 2010 benchmark
       7 years to 6.5 years.

       The net financial effect of the changes in the current financial year is an increase in the long service leave
       liability of $0.4 million and employee benefit expense of $0.4 million.

       The impact on future periods is impracticable to estimate as the benchmark is calculated using a number
       of assumptions – a key assumption is the long-term discount rate. With current conditions, the long-term
       discount rate is experiencing significant movement.


  26   Provisions
       Current
       Workers Compensation                                                              2,101                 1,934
                                                                                         2,101                 1,934
       Non-Current
       Workers Compensation                                                              7,091                 6,306
                                                                                         7,091                 6,306

       Total Provisions                                                                  9,192                 8,240

       Carrying amount at 1 July                                                         8,240                 7,613
            Additional provisions recognised                                               952                   627
       Carrying amount at 30 June                                                        9,192                 8,240

       A liability has been reported to reflect unsettled workers compensation claims. The workers
       compensation provision is based on an actuarial assessment performed by the Public Sector Workforce
       Relations Branch of the Department of the Premier and Cabinet. These claims are expected to be settled
       within the next financial year.


Page 154
FINANCIAL PERFORMANCE
NOTES TO THE STATEMENT OF COMPREHENSIVE INCOME


                                                                                          2011                  2010
                                                                                          $'000                 $'000
   27   Unearned Revenue
        Unearned Revenue SA Govt Entities                                                     0                  278
        Unearned Revenue Non-SA Govt Entities                                             4,827                6,933
                                                                                          4,827                7,211


   28   Other Liabilities
        Current
        Deposits                                                                            655                1,037
        Other Liabilities                                                                    98                   98
        Total Other Liabilities                                                             753                1,135


   29   Investments - Austraining International Pty Ltd
        Contributed Capital in Subsidiary Company (Austraining)                            400                  400
        Share of Retained Profit                                                          100%                 100%


        Retained Profits Attributable to Subsidiary Company
        Balance at 1 July                                                                 3,891                3,206
        Share of Operating Profit After Income Tax                                        1,108                  685
        Total Investments                                                                 4,999                3,891


        Austraining International Pty Ltd
        Austraining International Pty Ltd, which has a reporting date of 30 June, is controlled by the Minister for
        Employment, Higher Education and Skills. Its principal activity is to secure international contracts for work
        in vocational education and training.

        The current investment value is based on unaudited financial statements as at 30 June 2011.


                                                                                                                    Page 155
NOTES TO THE STATEMENT OF COMPREHENSIVE INCOME


                                                                             Financial Asset
                                                                               Available-for-
                                                                    Asset               Sale
                                                              Revaluation       Revaluation        Retained
     30    Adjustments to Equity                                  Surplus            surplus       Earnings          TOTAL
                                                                    $'000             $'000           $'000           $'000
           Balance at 1 July 2009                                225,495              1,287        411,508          638,290
           Prior period adjustments to Work in
           Progress                                                      0                  0          (696)          (696)
           Changes in Accounting Policy for
           Intangibles                                                 0                  0           1,703           1,703
           Total Equity as at 30 June 2010                       225,495              1,287         412,515         639,297

           Prior period adjustments
           This reflects an adjustment for transactions previously recognised as assets at 30 June 2010.

           Changes in Accounting Policy

           This reflects an adjustment for intangibles due to the Department changing their accounting policy (refer
           note 3). The transactions adjusted were previously recognised as expenses prior to 30 June 2010.


                                                                                    2011                  2010
                                                                                    $'000                 $'000
     31    Equity
           Retained earnings                                                     395,220               412,515
           Asset revaluation surplus                                             223,121               225,495

           Financial Asset Available-for-Sale Revaluation surplus                  2,395                 1,287
           Total Equity                                                          620,736               639,297

           The asset revaluation surplus is used to record increments and decrements in the fair value of land,
           buildings and libraries to the extent that they offset one another.


     32    Unrecognised Contractual Commitments

           Remuneration Commitments
           Commitments for the payment of salaries and other remuneration under fixed-term employment
           contracts in existence at the reporting date but not recognised as liabilities are payable as follows:

           Within one year                                                          5,718                10,693

           Payable later than one year and not later than five years                8,008                10,677
           Total Remuneration Commitments                                          13,726                21,370

           Amounts disclosed include commitments arising from executive contracts and hourly paid instructors.
           The Department does not offer remuneration contracts greater than 5 years.


Page 156
FINANCIAL PERFORMANCE
NOTES TO THE STATEMENT OF COMPREHENSIVE INCOME


                                                                               2011                       2010
                                                                               $'000                      $'000
      Capital Commitments
      Capital expenditure contracted for at the reporting date but are not recognised as liabilities in the financial
      statements are payable as follows:

      Within one year                                                          1,934                      7,406
      Later than one year and not later than five years                          681                          0
      Total Capital Commitments                                                2,615                      7,406

      The department's capital commitments relate to acquisition and implementation of the Phoenix information
      system & construction works at Berri Trade Centre.


      Other Commitments
      These amounts are due for payment:

      Within one year                                                         28,167                     31,040
      Later than one year and not later than five years                       57,337                     60,710
      Later than five years                                                    1,561                      2,342
      Total Other Commitments                                                 87,065                     94,092

      The Department's other commitments relate to agreements for Productivity Places Program contracts, cleaning
      contracts, and other procurement commitments.


      Operating Leases Commitments
      Commitments in relation to operating leases contracted for at the reporting date but not recognised as
      liabilities are payable as follows:

      Within one year                                                          6,627                      5,925
      Payable later than one year and not later than five years               26,984                     24,761
      Payable later than five years                                            3,660                      9,089
      Total Operating Lease Commitments                                       37,271                     39,775

      The department's operating leases are for office accommodation and equipment. Office accommodation is
      leased from Department for Transport, Energy and Infrastructure. The leases are non-cancellable with some
      leases having the right of renewal.

      Rent is payable in arrears.


                                                                                                                    Page 157
NOTES TO THE STATEMENT OF COMPREHENSIVE INCOME


     33    Contingent Assets and Liabilities
           The department is not aware of any contingent assets.

           There are a number of outstanding personal injury and common law claims not settled as at 30 June
           2011 with an estimated settlement value of $77,350.

           The Minister for Employment, Higher Education and Skills has provided a $3.0 million guarantee to
           Austraining International Pty Ltd which has not been invoked as at 30 June 2011.

           The Minister for Employment, Higher Education and Skills has entered an agreement to provide Le
           Cordon Bleu with a 10 year interest free loan of $7.0 million conditional upon Le Cordon Bleu entering
           into a building contract for the development of Le Cordon Bleu's city training facility.

     34    Transferred functions

           Transferred In

           Under the Public Sector (Reorganisation of Public Sector Operations) Notice 2010 , from 1 July 2010 the
           Bragg Initiative and Royal Institution of Australia (RiAus) functions were transferred from the Department
           of the Premier and Cabinet to the Department of Further Education, Employment, Science and
           Technology. The Bragg Institute transfer included 1 employee and budget funding of $0.2 million. The
           RiAus transfer had no net financial impact.

           On transfer of the Bragg Institute, the Department for Further Education, Employment, Science and
           Technology recognised the following liabilities:

                                                                                $,000
           Payables                                                                 2
           Employee Benefits Liability                                             16
           Total liabilities transferred                                           18


           Total Liabilities assumed by the department as a result of the administrative restructure were at the
           carrying amount of those liabilities in the transferor's Statement of Financial Position immediately prior to
           transfer. The net liability has been charged directly to Equity.


     35    After Balance Day Events
           On 1 July 2011, DFEEST announced the establishment of the Office of TAFE SA. This new office will work
           with an interim TAFE SA Board to help re-direct TAFE SA towards demand-driven funding and increased
           contestability under the Skills for All initiative. 2011-2012 will be a year of transition with the aim to
           establish TAFE SA as a statutory authority from July 2012. The Office will be given substantial autonomy to
           manage the operations of TAFE SA. To highlight the separation between purchaser and provider the
           Office of TAFE SA will report directly to the Minister assisting the Minister for Employment, Higher
           Education and Skills, who will have responsibility for TAFE SA.

           The interim TAFE SA Board will be Chaired by the Chief Executive of DFEEST and include key Corporate
           Executive members as well as external members. The Chief Executive of DFEEST will remain responsible for
           the staffing and financial outcomes of TAFE SA until the proposed establishment of TAFE SA as a statutory
           authority from July 2012.


Page 158
FINANCIAL PERFORMANCE
NOTES TO THE STATEMENT OF COMPREHENSIVE INCOME


36   Remuneration of Board and Committee Members

Members that were entitled to receive remuneration
during the 2010-11 financial year were:

Training and Skills Commission appointed until 31 August   Adult Community Education Reference Group appointed
2010                                                       until 31 August 2010
Prof D Bradley AC (Chair)                                  P Wright (Chair)
P Wright                                                   K Daniel
P Dowd                                                     P Ronan
J Giles                                                    S Schrapel
Prof R Green                                               M Smith
Prof R Harris
Dr M Keating AC
A Smith                                                    Adult Community Education Reference Group appointed
P Vaughan                                                  from 1 September 2010 until 31 August 2012
J Chapman (Deputy to P Vaughn)                             J Giles (Chair)
I Curry (Deputy to J Giles)                                J McCormick
                                                           S Ross
                                                           P Wright
Training and Skills Commission from 1 September 2010
until 31 August 2012
A Smith (Chair)                                            Premier's Science Research Council
Dr J Buchanan                                              Prof D Bursill (Co-chair)
M Silva (Deputy Chair)                                     Dr I Chessell (Resigned December 2010)
A Coker                                                    Prof B Brook
P Dowd                                                     Dr I Gould
J Giles                                                    Dr W Harch
Dr M Keating AC                                            Dr A Koltunow
L Palmer                                                   Prof R Lewis
P Vaughan                                                  Prof A Lopez
I Curry (Deputy to J Giles)                                R McLeod
T Cruickshank (Deputy to P Vaughn) (resigned June          Prof T Monro
2011)                                                      D Mutton
S Powell (Deputy to L Palmer)                              Prof R Norman (Resigned December 2010)
                                                           Dr L Read
                                                           Prof A Rumbold (Resigned December 2010)
Training Regulation Reference Group (previously Quality    Prof P Tharenou
Reference Group) appointed until 31 August 2010            Dr G Todd
A Smith (Chair)
I Curry
D Frith                                                    Audit and Risk Management Committee
G Peak                                                     I McLachlan (Resigned)
K Thiele                                                   W Einarson


Training Regulation Reference Group appointed from 1       Arts Advisory Board
September 2010 to 31 August 2012                           R Archer AO (Chair)
M Silva (Chair)                                            S Bowers
M Aubrey                                                   R Clemente (Resigned November 2010)
I Curry                                                    K Gould
D Frith                                                    S Grieve
D Syme                                                     A Hann
                                                           J Covernton
                                                           J Macdonnell
                                                           A Ford
                                                           G Cobham
                                                           M Hill-Smith
                                                                                                      Page 159
NOTES TO THE STATEMENT OF COMPREHENSIVE INCOME


           The number of members whose remuneration from the entity falls within the following bands is:

                                                                              2011                  2010
                                                                             No. of                No. of
                                                                           members               members
           $1 - $9 999                                                          27                    13
           $30,000 - $39,999                                                     8                     6
           $40,000 - $49,999                                                     1                     1
           $50,000 - $59,999                                                     0                     1
                                                                                36                    21

           Remuneration of board members reflects all costs of performing board/committee member duties
           including sitting fees, superannuation contributions, fringe benefits tax and any other salary sacrifice
           arrangements. The total remuneration received or receivable by members was $0.3 million ($0.3 million).

           Amounts paid to a superannuation plan for board/committee members was $18,069 ($18,689).

           In accordance with the Department of Premier and Cabinet Circular No. 016, government employees did
           not receive any remuneration for board/committee duties during the financial year.

           Unless otherwise disclosed, transactions between members are on conditions no more favourable than
           those that it is reasonable to expect the entity would have adopted if dealing with the related party at
           arm's length in the same circumstances.

                                                                                2011                 2010
                                                                               $'000                 $'000
     37    Reconciliation of cash and cash equivalents - cash at year end as per:
           Cash and cash equivalents disclosed in the Statement of
           Financial Position                                                 64,675               85,981
           Balance as per the Cash Flow Statement                             64,675               85,981


           Reconciliation of Net Cash Provided by Operating Activities to Net Cost of Providing Services

           Net Cash Provided by Operating Activities                               51              49,878
           Depreciation and amortisation                                    (19,299)             (17,854)
           Loss on Sale of Assets                                              (469)                (131)
           Prior Period Adjustments                                                 0                 467
           Restructure                                                           (18)                 140
           Increase in Employee Benefits                                     (3,614)                (218)
           Decrease in Receivables                                             (866)              (2,900)
           (Decrease)/Increase in Inventories                                    (85)                  37
           Decrease in Payables                                                5,209                1,693
           Decrease in Unearned Revenue                                        2,384                4,328
           Decrease in Other Liabilities                                         382                5,626
           Increase in Provisions                                              (952)                (627)
           Revenues from Government                                        (394,688)            (408,633)
           Payments to Government                                             12,643                9,923
           Net Cost of Providing Services                                  (399,322)            (358,271)


Page 160
FINANCIAL PERFORMANCE
NOTES TO THE STATEMENT OF COMPREHENSIVE INCOME


     38   Financial instruments

          Table 38.1 Categorisation of financial instruments
          Details of significant accounting policies and methods adopted including the criteria for recognition, the
          basis of measurement, and the basis on which income and expenses are recognised with respect to
          each class of financial asset, financial liability and equity instrument are disclosed in Note 2 Summary of
          significant Accounting Policies

                                                                                                 2011          2010
                                                                                              Carrying      Carrying
          Category of Financial Assets         Statement of Financial                         amount        amount
          and Financial Liabilities            Position line item                  Note         $'000         $'000
          Financial Assets
          Cash and Cash Equivalents            Cash and cash equivalents            18          64,675        85,981
          Receivables                          Receivables                          19          17,280        18,146
          Held to maturity investments         Investments                          29           4,999         3,891

          Financial Liabilities
          Financial Liabilities at cost        Payables                             24          29,596        41,430
                                               Other liabilities                  27, 28         5,580         8,346
          Total Net Financial Assets at cost                                                    51,778        58,242

          All amounts recorded are carried at cost (not materially different from amortised cost) except for
          employee oncost which are determined via reference to the employee benefit liability to which they
          relate.


          Credit Risk
          Credit risk arises when there is the possibility of the department’s debtors defaulting on their contractual
          obligations resulting in financial loss to the department. The department measures credit risk on a fair
          value basis and monitors risk on a regular basis.

          The department has minimal concentration of credit risk. The department has policies and procedures in
          place to ensure that transactions occur with customers with appropriate credit history. The department
          does not engage in high risk hedging for its financial assets.


          Allowances for impairment of financial assets is calculated on past experience and current and expected
          changes in client credit rating. Currently the department does not hold any collateral as security to any
          of its financial assets. Other than receivables, there is no evidence to indicate that the financial assets are
          impaired. Refer to Note 19 for information on the allowance for impairment in relation to receivables.


                                                                                                                       Page 161
NOTES TO THE STATEMENT OF COMPREHENSIVE INCOME


           The following table discloses the ageing of financial assets, past due, including impaired assets past
           due.

           Table 38.2 Ageing analysis of financial assets

                                                                    Past due by

                                                Overdue for <      Overdue for        Overdue for          Total
                                                  30 days          30 – 60 days        > 60 days
                                                   $’000              $’000              $’000             $’000
           2011
           Not impaired
           Receivables                              13,877              538              2,865            17,280
           Other financial assets                     0                  0                 0                0

           Impaired
           Receivables                                 0                 0                 0                 0
           Other financial assets                      0                 0                 0                 0

           2010
           Not impaired
           Receivables                              14,681              452              3,013            18,146
           Other financial assets                     0                  0                 0                0

           Impaired
           Receivables                                 0                 0                 0                 0
           Other financial assets                      0                 0                 0                 0


Page 162
FINANCIAL PERFORMANCE
NOTES TO THE STATEMENT OF COMPREHENSIVE INCOME


       The following table discloses the maturity analysis of financial assets and financial liabilities.

       Table 38.3: Maturity analysis of financial assets and liabilities

                                                                                      Contractual Maturities

                                                          Carrying         < 1 year         1-5 years       > 5 years
                                                          amount
                                                           $’000             $’000           $’000             $’000

       2011
       Financial assets
       Cash & cash equivalent                              64,675           64,675             0                 0
       Receivables                                         17,280           17,041            239                0
       Other financial assets                               4,999             0                0               4,999
       Total financial assets                              86,954           81,716            239              4,999

       Financial liabilities
       Payables                                            29,596           27,612           1,984              0
       Other financial liabilities                          5,580           5,580              0                0
       Total financial liabilities                         35,176           33,192           1,984              0

       2010
       Financial assets
       Cash & cash equivalent                             85,981           85,981              0                 0
       Receivables                                        18,146           17,898             248                0
       Other financial assets                              3,891              0                0               3,891
       Total financial assets                             108,018          103,879            248              3,891

       Financial liabilities
       Payables                                            41,430           39,407           2,023              0
       Other financial liabilities                          8,346           8,346              0                0
       Total financial liabilities                         49,776           47,753           2,023              0


                                                                                                                        Page 163
NOTES TO THE STATEMENT OF COMPREHENSIVE INCOME


    Liquidity risk
    Liquidity risk arises where the department is unable to meet its financial obligations as they fall due. The
    Department is funded principally from appropriations from the South Australian Government. The Department
    works with the Department of Treasury and Finance to determine the cashflows associated with its
    Government approved program of work and to ensure funding is provided through SA Government
    budgetary processes to meet the expected cashflows.

    The Department settles undisputed accounts within 30 days from the date of the invoice or date the invoice is
    first received. In the event of a dispute, payment is made 30 days from resolution.

    The Department's exposure to liquidity risk is insignificant based on past experience and current assessment of
    risk.

    The carrying amount of financial liabilities recorded in Table 38.1 represents the department's maximum
    exposure to financial liabilities.


     39    Administered Items


           Minister's Salary and Allowances
                                                                                         2011              2010
                                                                                         $'000             $'000
           Administered Expenses
           Employee Benefits                                                               167                266
           Total Administered Expenses                                                     167                266

           Administered Income
           Revenues From SA Government                                                     167                266
           Total Administered Income                                                       167                266

           Net Result                                                                        0                 0


           Minister's Salary and Allowances
           Minister's Salary and allowances represents the amount pursuant to Parliamentary Remuneration Act
           1990.


Page 164
FINANCIAL PERFORMANCE
5.4 Account Payment Performance

The due date is defined as per 11.2 of the Treasurer’s Instruction. Unless there is a discount or a written agreement
between the public authority and the creditor, payment should be within thirty days of the date of the invoice or
claim.


 Particulars                          Number of       Percentage of     Value in $A of        % of
                                     Accounts Paid    Accounts Paid     Accounts Paid       Accounts
                                                      (by Number)                           Paid (by
                                                                                             Value)

 Paid by due date                       63 893              92%         $251 284 935           92%

 Paid within 30 days or less from
                                         4 355              6%           $19 319 106            7%
 due date

 Paid more than 30 days from
                                         1 186              2%              $3 018 502          1%
 due date


5.5 Consultants
Details of consultancy expenditure over $10 000:

The Allen Consulting Group                                  Mineral Resources & Heavy Engineering Skills Centre
To develop a report that examines the extent to which       To prepare a scoping paper: Workforce Study for the
the current standards adequately identify the               Resource Sector in the Eyre Peninsula.
requirements essential to ensuring that providers
registered under the Training and Skills Development Act    SA Centre for Economic Studies
2008 are able to demonstrate delivery of quality            To provide an evidence base for re-prioritising all South
outcomes to domestic and overseas students.                 Australia Works programs and services by examining
                                                            selected programs that illustrates specific examples of
Ferrier Hodgson                                             ‘complementarity’ between Commonwealth and state
Provide financial advice to TAFE SA following the           programs.
appointment of three Chief Financial Officers (one per
TAFE SA Institute).


                                             Amount (excl          Number of
                                                GST)              consultancies
Below $10 000                                    $9 600                 1

Between $10 000 and $50 000                      $62 116                3

Above $50 000                                    $88 240                1
Total                                          $159 956                 5


                                                                                                                        Page 165
Page 166
FINANCIAL PERFORMANCE

5.6 Certification by Departmental Executives


                                               Page 167
5.7 Independent Auditor’s Report


Page 168
FINANCIAL PERFORMANCE


                        Page 169
5.8 Contractual Arrangements                                      5.10 Overseas Travel

The department entered into a contract with SunGard               Departmental employees, including TAFE SA staff,
Pty Ltd in June 2009 for the supply and installation of a new     undertook overseas travel during the last year for the
SIS. The system will manage all aspects in relation to the        following purposes:
administration of students within TAFE SA, including online
enrolment, billing, issuing of parchments and maintenance            -   officially representing the state government via
of student records. The contract expires in 2019.                        ministerial delegations

This contract provides access to a student information               -   attending and presenting at conferences/seminars
system that is compliant with state and Commonwealth laws            -   undertaking quality assurance audits of
for the life of the contract.                                            ‘Transnational’ (Offshore licensed and delivered
                                                                         TAFE SA courses)
                                                                     -   conducting commercial promotion of departmental
                                                                         programs
                                                                     -   undertaking marketing and recruitment to attract
5.9 Fraud                                                                full fee paying overseas students.
                                                                  In 2011, 66 staff travelled overseas at a total cost of
                                                                  $301 637. The countries most visited were Kiribati, Vietnam,
As part of its risk management, the department has
                                                                  Singapore and Hong Kong.
implemented processes for identifying and responding to
the risks of fraud, including any specific risks of fraud that    The biggest sources of revenue for DFEEST were:
have been identified, or account balances, classes of
transactions or disclosures for which a risk of fraud is likely      -   The AusAID Kiribati project with Austraining
to exist.                                                                International, with revenue to date for Phase 1 of
                                                                         $639 000, and a further $350 000 due by June
The department has established an audit and risk review                  2012.
function through its Audit and Risk Management
Committee. This is supported by the department’s Internal            -   A series of small AusAID development programs in
Audit and Risk Management Review Branch.                                 justice and policing for the Pacific Islands completed
                                                                         during 2011-12, generating revenue of
The Internal Audit Program, which is reviewed by the Audit               approximately $120 000.
and Risk Management Committee and approved by the
                                                                     -   The Singapore Enterprise Development
Chief Executive, addresses a number of potential risk areas
                                                                         Consultancy, which will be completed in early
including internal controls over revenue, information and
                                                                         2012, with a total revenue for this project of
asset security and expenditure activity.
                                                                         $1.1 million over 2011-12.
Complementing this work, the Director, Strategic Finance          This does not include the economic multiplier to the state
and Budgets is responsible for ongoing internal reconciling       that factors in the additional spend of overseas students and
controls over departmental revenue and expenditure and            their visiting friends and family.
liaises with the Manager, Internal Audit where abnormal
variances are detected. The Strategic Finance and Budgets
section also works closely with Internal Audit to oversee the
implementation and monitoring of DFEEST’s Financial
Management Compliance Program.
No instances of fraud were found within the department
during the year.


Page 170
FINANCIAL PERFORMANCE


                        Page 171
Page 172
GLOSSARY


           Page 173
ABS    Australian Bureau of Statistics

             AC Arts   Adelaide College of the Arts (TAFE SA)

                ACE    Adult Community Education
              AEICN    Aboriginal Employers Industry Champions Network

                AFL    Australian Football League

                AIIA   Australian Information Industry Association

               AKPA    Apprentice Kickstart Pre-Apprenticeship

               APPC    Access and Participation Principal Committee

           APY Lands   Anangu Pitjantjatjara Yankunytjatjara Lands

                AQF    Australian Qualifications Framework

               AQTF    Australian Quality Training Framework

              ASQA     Australian Skills Quality Authority

             AusAID    Australian Agency for International Development

                BTF    Better TAFE Facilities

              CAPM     Connecting Aboriginal People to Mining

              COAG     Commonwealth of Australian Governments

                CRC    Cooperative Research Centre

              CSIRO    Commonwealth Scientific and Industrial Research Organisation

              DECD     Department of Education and Child Development

             DEEWR     Department of Education, Employment and Workplace Relations

             DFEEST    Department of Further Education, Employment, Science and Technology

                DIC    Department of Immigration and Citizenship

                DPTI   Department of Planning, Transport and Infrastructure

              DSTO     Defence Science and Technology Organisation

             ELICOS    English Language Intensive Courses for Overseas Students

               FCEP    Family Centred Employment Project

                FTE    Full Time Employee

                ICT    Information and Communications Technology


Page 174
GLOSSARY


    IISC   Industry and Indigenous Skills Centre

    LSS    Learner Support Service

 MEGA      Mobile Enterprise Growth Alliance

NASWD      National Agreement for Skills and Workforce Development

   NBN     National Broadband Network

 NCVER     National Centre for Vocational Education Research

    NP     National Partnership

 NPYAT     National Partnership on Youth Attainment and Transitions

   NSAI    Non Self-Accrediting Institution

OHS&W      Occupational Health, Safety and Welfare

    PPP    Productivity Places Program

   PSRC    Premier’s Science and Research Council

   R&D     Research and Development

   RDA     Regional Development Australia

   RTO     Registered Training Organisation

  SACE     South Australian Certificate of Education

   SASP    South Australia’s Strategic Plan

 SATAC     South Australian Tertiary Admissions Centre

SCOTESE    Standing Council on Tertiary Education, Skills and Employment

   SIEC    Sustainable Industries Education Centre

     SIS   Student Information System

  STEM     Science, Technology, Engineering and Mathematics

   TaSC    Training and Skills Commission

 TEQSA     Tertiary Education Quality and Standards Agency

   TIIFT   Training Infrastructure Investment for Tomorrow

   TVSP    Targeted Voluntary Separation Package

   VET     Vocational Education and Training

  YMCA     Young Men’s Christian Association


                                                                           Page 175
Page 176

DFEEST Annual Report 2011

  • 1.
  • 2.
    FOR FURTHER COPIESAND ENQUIRIES PLEASE CONTACT Department of Further Education, Employment, Science and Technology Office of the Chief Executive GPO Box 320 ADELAIDE SA 5001 ABN: 16692317206 Telephone: (08) 8226 3821 Facsimile: (08) 8226 9533 The 2011 Annual Report is available on the department’s website at: http://www.dfeest.sa.gov.au ISSN: 1449-6437 Page 2
  • 3.
  • 4.
    SECTION ONE 7 YEAR IN REVIEW Our Business 8 From the Chief Executive 9 At a Glance: Highlights of 2011 10 Skills for All 12 TAFE SA 14 SECTION TWO 17 ABOUT THE DEPARTMENT Our Priorities 18 Our Structure 20 South Australia’s Strategic Plan 22 DFEEST’s Five Year Strategic Plan 2010-14 24 SECTION THREE 27 OUR PERFORMANCE Workforce Planning 28 Engagement with Industry 32 Providing Opportunities for All 40 Building World-Class Infrastructure 50 Digital Economy and Technology 54 A Focus on Quality 57 Science and Research 64 Tertiary Education 68 National Contributions 78 Page 4
  • 5.
    CONTENTS SECTION FOUR 83 CORPORATE GOVERNANCE AND REPORTING Ministerial Accountability 84 Legislation 84 Boards, Committees and Authorities 85 Governance 87 Asbestos Management in Government Buildings 89 Carers Recognition Act 2005 89 Disability Action Plans 89 Freedom of Information 89 Management of Human Resources 91 Reconciliation 102 Sustainability 103 Urban Design Charter 111 Whistleblowers Protection Act 1993 111 SECTION FIVE 113 FINANCIAL PERFORMANCE Financial Overview 114 Summary of Financial Information 114 Audited General Purpose Financial Report 119 Account Payment Performance 165 Consultants 165 Certification by Departmental Executive 167 Independent Auditor’s Report 168 Contractual Arrangements 170 Fraud 170 Overseas Travel 170 GLOSSARY 173 Page 5
  • 6.
  • 7.
    SECTION ONE YEAR IN REVIEW Page 7
  • 8.
    1.1 Our Business TheDepartment of Further Education, Employment, Science and Technology’s (DFEEST) role is to ensure the development of the state’s workforce to meet industry priorities, to maximise the opportunities for all South Australians to engage in education, training and work, to build a more responsive and flexible training system and to exploit opportunities for South Australia to be at the forefront of research, science, technology and innovation. To do this we manage the training system by providing funding for training, empowering industry, enterprises and individuals to invest in quality training through contracting and regulation, monitoring provider performance and managing vocational education and training (VET) infrastructure. We also help build the tertiary education, science, research and innovative capacity in South Australia by supporting universities and research institutions. DFEEST has undertaken a range of functions in order to meet its objectives and contribute to the achievement of During the reporting period, DFEEST South Australia’s Strategic Plan (SASP) objectives and played a central role in achieving 14 of targets. South Australia’s Strategic Plan targets in the areas of employment, education and These included: training as well as science, technology - the provision of strategic policy advice for and innovation. developing the State’s workforce, in conjunction with the Training and Skills Commission (TaSC) - ensuring high-quality VET is delivered by TAFE institutes under the Office of TAFE SA, private registered training organisations and adult community education providers - regulation of VET providers, non-university higher education providers, and providers of English Language Intensive Courses for Overseas Students - regulation, administration and funding of apprenticeships and traineeships - managing state-funded employment and training support programs - supporting the government’s strategic direction in the higher education sector - raising the profile of South Australia in the international education marketplace - developing policies and strategies, and delivering programs, that create opportunities for Aboriginal people, young people, people with a disability and older workers - provision of strategic advice and delivery of programs in the areas of science, technology and information economy. Page 8
  • 9.
    YEAR IN REVIEW 1.2From the Chief Executive I am pleased to present the 2011 Annual Report for the Department of Further Education, Employment, Science and Technology. 2011 has been an exciting and challenging year with the commencement of transformational reforms to South Australia’s training system through Skills for All. The reforms, when fully implemented, will see funding for an extra 100 000 training places, the removal of fees for many courses, better access to training for many students and a training system that will be able to respond more quickly to student and industry demand. In 2011 DFEEST implemented a number of major initiatives to progress the Skills for All reforms. The centre will be a state-of-the-art facility incorporating the main building trades with a focus on sustainable industries The Office of TAFE SA was established to help prepare and clean technologies. The design was developed during TAFE SA for the new contestable VET sector from 2011 with construction work to commence in 2012. July 2012. In addition, the implementation of 24 other major reform projects commenced including the Throughout 2011 TAFE SA continued its focus on assessment of Skills for All providers which will help providing excellence in training to students from all walks underpin the quality of training that occurs under of life. More than 81 000 students received training during Skills for All. 2011. Over 91 percent of TAFE SA graduates were satisfied with the overall quality of their training, the highest A major initiative was the introduction of the Training satisfaction rating nationally. Guarantee for South Australian Certificate of Education (SACE) Students which helps fund students to undertake Employers also gave very positive feedback with over vocational training while at school and upon completion of 90 percent extremely satisfied with the quality of training their SACE guarantees an ongoing training place. This being delivered by TAFE SA. scheme will be expanded in 2012 with increasing interest from schools and students. It was a great honour that this high standard of training was recognised at the 2011 National Training Awards with I am very pleased and proud of what staff across the TAFE SA Regional winning the award as Large Training department have achieved to date, and look forward to Provider of the Year. seeing the culmination of these efforts when Skills for All goes fully live on 2 July 2012. The department also received recognition for the excellence of its work through the 2011 Premier’s Awards. In April, Adjunct Professor Don Bursill commenced his appointment as Chief Scientist for South Australia and has The first award was for the collaborative work DFEEST did been working with the department and key stakeholders in with AdamMax to provide wireless broadband to fix 50,000 strengthening the links between research and industry. broadband blackspots across the state. In August, the Minister for Science and Information The second Premier’s Award was for the initiative ‘Remote Economy launched 'A Science, Technology, Engineering Indigenous Public Access Project – Oodnadatta’. and Mathematics (STEM) Skills Strategy for South Australia' . None of this would have been possible without the The STEM Skills Strategy is targeted at increasing the uptake dedication and hard work of many staff and the leadership in science, technology, engineering and mathematics of our Ministers in 2011 - Minister Snelling, Minister professions to support the growing demand in our high Kenyon and Premier Weatherill. value emerging industries. During 2011 the department also progressed work on the exciting new $105 million Sustainable Industries Education Raymond Garrand Centre at Tonsley Park. Chief Executive Page 9
  • 10.
    1.3 At AGlance : Highlights of 2011 - 123 800 South Australian students participated in accredited training - 34 400 Apprentices and Trainees participated in training (as at 30 June 2011) - People in Training a 3.9 percent increase on the previous year’s figure - More than 81 000 students were enrolled in TAFE SA - Over $150 million of Commonwealth funding supported South Australian Commonwealth and State employment and training outcomes Relations - The National Agreement for Skills and Workforce Development: Equity and Foundation Skills, driven by DFEEST, was embedded in national policy - Over 1500 people were engaged in community consultations - The Training Guarantee for SACE Students commenced - Learner Support Services trials commenced in TAFE SA Skills for All - Over 1400 subsidised courses have been identified for inclusion on the Subsidised Training List - The Adult Community Education program was expanded to increase learner pathways - Skills for Jobs 2011, a five-year skills and workforce development plan, was launched Training and Skills - Two regional visits, Whyalla and the Riverland, were undertaken Commission - A workforce study on Eyre Peninsula mining projects was released - TAFE SA achieved 91 percent student satisfaction - The $9.4 million Victor Harbor campus was opened and awarded a Civic Trust Award - Construction of the Sustainable Industries Education Centre is one step closer TAFE SA - The new $20.4 million Student Information System was implemented - TAFE SA shone at South Australian Training Awards with TAFE SA Regional winning Large Training Provider of the Year Page 10
  • 11.
    YEAR IN REVIEW - South Australia exceeded National Partnership Agreement targets - $51 million invested for Existing Workers with 14 000 existing worker enrolments approved Productivity Places Program - $16 million invested for Job Seekers with 5 420 job seeker enrolments approved - A $4.5 million boost was allocated to the South Australian Defence industry - $4.6 million was invested to fund 1 223 qualifications in mining - Outback Connect won two Premier’s Awards for AdamMax – Shining the Light on Broadband Blackspots and Remote Indigenous Public Access Project – Oodnadatta Digital Economy and - The National Broadband Network arrived in Willunga with the highest take-up of Technology any region - Port Pirie received a $112 000 boost for broadband services - $5 million invested in a purpose-built Photonics Facility Science and Research - SA STEM Skills Strategy launched - Professor Don Bursill was announced as the new Chief Scientist for South Australia - Over 11 000 people participated in 93 Adult Community Education (ACE) programs delivered by 70 community-based organisations South Australia Works - $6.4 million invested will support 8800 people through South Australia Works - $2.4 million invested in the ACE program to increase learner pathways - $2.6 million of Commonwealth funding was secured for more training and jobs Aboriginal Training and - $1 million funding offered to assist Aboriginal job seekers Employment - Industry Clusters supported 285 Aboriginal people into training or employment - The amended Training and Skills Development Act 2008 was implemented to strengthen regulation Quality - The Vocational Education and Training (Commonwealth Powers) Bill drafted and submitted to Parliament - An International Student Card was launched with SAPOL Page 11
  • 12.
    1.4 Skills forAll Skills for All, announced in late December 2010, is the MORE SUPPORT FOR THE MOST DISADVANTAGED strategic direction for VET in South Australia. The South Australian government will encourage more people than ever to enter training, successfully complete Implementation is planned over four years. When fully that training and gain employment. To achieve this, implemented, Skills for All will bring fundamental changes additional learner support services, which will include to the state’s training system in order to: specialised learning and workplace experience, was trialled - raise the skills level of South Australians for the most disadvantaged. Examples of disadvantaged groups include women returning to work and those facing - increase the number of South Australians with post- generational unemployment. school qualifications - increase workforce participation. Certificate I and II level training, and foundation skills will be fully funded with no course fees, and further concessions To support Skills for All, the South Australian government will continue to be available at Certificate III and IV level for committed an additional $194 million and set an ambitious low-income earners. goal as part of its Jobs Strategy which, with the Productivity Places Program (PPP), to create 100 000 new jobs for the IMPROVED PATHWAYS INTO LEARNING AND WORK state over the six years from 2010-11. Skills for All recognises the importance of ensuring foundation skills are readily accessible to support those In order to achieve this goal, an additional 100 000 training who may experience barriers to training and employment. places in key growth industries has been committed over six years. The state government has doubled funding for foundation skills and committed $6.4 million for the Adult Community The aim is to create a VET system that responds quickly and Education (ACE) sector to create an additional 6000 flexibly to the needs of individuals and industry; a system training places for South Australians who want to boost which is simpler to access and navigate, and supports their literacy and numeracy skills in order to move on to more people to enter training and progress to higher higher level training or find work. qualifications and employment. Pathways from school to further training have also been Key aspects of the reform will be in place by 2 July 2012. improved. The training system now supports school students 16 years and over who are on a VET pathway GOVERNMENT-FUNDED TRAINING PLACES and provides access to the training subsidy for further South Australians aged 16 years and over will be eligible training once they complete school. for a government-funded training subsidy to meet individual needs and industry demand. A SHARED INVESTMENT IN SKILLS The funding structure is being simplified. The overall CLIENT CHOICE OF TRAINING PROVIDER funding provided by government is increasing. There will Students will be able to select the training provider of their be a greater sharing of the costs for higher level training choice from TAFE SA and other approved private training for which, at Diploma and Advanced Diploma levels, providers. To assist South Australians in selecting the providers will be able to offer income-contingent loans. training and provider that is right for them, Skills for All will Maximum and minimum restrictions on course fees will focus on developing resources and information that will prevent providers from overcharging students, while give people access to high-quality information on careers, ensuring that providers cannot offer training at artificially training options and providers. low prices. CLIENTS WILL BE WELL INFORMED MORE SUPPORT FOR INDUSTRY The Skills for All website will build a training information Employers can also access government-endorsed, portal that offers information about Skills for All providers, independent workforce development advisors to help their services and funded training courses. It will link South identify workforce development needs and broker relevant Australians to high-quality information and tools on training and support. careers, occupations and training pathways at one up-to- date and easy-to-navigate website. Skills for All implementation has made good progress and is on track for the 2 July 2012 starting date. Page 12
  • 13.
    YEAR IN REVIEW ANASSURANCE OF QUALITY A RENEWED PARTNERSHIP WITH INDUSTRY From 2012, South Australia will be part of the National VET Under Skills for All, the South Australian government will Regulation system, and will work cooperatively with the work with industry to promote workforce development, Australian Skills Quality Authority (ASQA). Training maximise investment in training and encourage more providers wishing to access public funding will need to people to gain skills through training throughout their meet rigorous criteria to become a Skills for All provider. working lives. The requirements are in addition to meeting the standards under the Australian Quality Training Framework (AQTF) Skills in the Workplace and may mean that not all currently registered training providers will be able to access public funding. This will The Skills in the Workplace program will allow employers in result in training providers that meet the highest standards key target industries to co-invest with government to of quality for students to ensure that South Australia retains improve the skill level of employees at higher qualification its reputation for high-quality education and training. levels and support workforce development. From 2012, the Tertiary Education Quality Standards Skills in the Workplace will offer contestable funding Agency (TEQSA) will have national responsibility for higher designed to raise the skill levels of existing workers and to education provision. address skill demands in key industry sectors. Employer commitment and investment will be key requirements of EMPLOYER RECOGNITION PROGRAM Skills in the Workplace, and government investment in the program will add to, not replace, enterprise investment in DFEEST will establish a new Employer Recognition workforce skills development. Program that publicly acknowledges the critical role employers and businesses play in meeting skill needs and developing the workforce. This new program will help to recognise and reward employers and to assist in the continued development of a culture of training in South Australia. Page 13
  • 14.
    1.5 TAFE SA As South Australia’s largest provider of VET, TAFE SA plays a TAFE SA was also awarded, or contributed to the awarding major role in providing a comprehensive range of courses of the following: to industry, the community and disadvantaged groups. Together, the three TAFE institutes of Adelaide North, - TAFE SA was awarded the National Excellence Award Adelaide South and Regional play a critical role in delivering for Outstanding Contribution to Indigenous on South Australian government priorities, including the Interpreting by the Australian Institute of Interpreters facilitation of an additional 100 000 training places over six and Translators for its delivery of the Diploma in years. Interpreting in the Anangu Pitjantjatjara Yankunytjatjara Lands and other parts of South Australia In 2011, TAFE SA delivered training to over 81 000 students in more than 800 courses across 50 campuses. - A South Australian apprentice carpenter, trained by TAFE SA, was judged as the best apprentice and TAFE SA achieved the highest satisfaction ratings nationally winner of the National Apprentice Carpenter of with over 91 percent of TAFE SA graduates satisfied with the Year the overall quality of their training (National Centre for Vocational Education Research (NCVER) 2011), and - TAFE SA’s Regency International Centre was awarded 95 percent of TAFE SA graduates would recommend the the Servicing Industry Award at the South Australian training they undertook to other people. Premier’s Food Industry Awards which recognises a business for outstanding and innovative service. The A total of 91 percent of employers are satisfied with the centre also won the bronze medal in the Tourism quality of training delivered by TAFE SA to apprentices and Education and Training category at the 2011 South trainees, and 94 percent are satisfied with the quality of Australian Tourism Awards nationally recognised training delivered by TAFE SA (NCVER 2011). - An apprentice from Mount Gambier won a bronze medal at the 41st WorldSkills International Competition The Office of TAFE SA commenced operation in July 2011 held in London as an interim arrangement to progress TAFE SA priorities and to assist TAFE SA to become increasingly independent - A TAFE SA Building Lecturer won the 2011 SafeWork and accountable in preparation for autonomy as a award for the Best Individual Contribution to statutory authority. Ms Elaine Bensted, the Chief Executive, Workplace Health and Safety for his submission on the Office of TAFE SA has been reporting to the TAFE SA 3M™ Peltor™ Lite-Com III™ communication headset Interim Board since July 2011 and held to account for the which controls hazardous noise and has improved outcomes against the Ministerial Charters and Institute safety for lecturers and students. The TAFE SA Building Performance Agreements. program is believed to be the first educational institution in Australia to have used this cutting-edge Fortnightly video-conferences were held for all staff to technology in the form of two-way communication ensure that changes as a result of Skills for All are well headsets to allow lecturers to effectively and safely understood by staff. Campus forums have also been held to communicate with their students in a high-noise provide opportunities for staff to engage in discussion. All training environment areas of TAFE SA’s business are being reviewed to ensure they are appropriate with the move into a new funding - A Glass Glazing Lecturer at Marleston campus won the model in 2012. Glass Glazing Association of South Australia 2011 South Australian Glass Person of the Year Award - TAFE SA Beer brand ‘Campus Brewery’ won two silver Recognition and Awards medals at the 2011 Australian International Beer South Australia was well represented at the 2011 Australian Awards for the beers ‘Nut Brown’ and ‘American Training Awards, with eleven nominations, including six Brown Ale’. These awards showcase premium beer relating to TAFE SA. TAFE SA Regional won the Large and brewing excellence in the Asia-Pacific region. Training Provider of the Year and a TAFE SA student won Vocational Student of the Year. Murray Bridge Veterinary Clinic won Small Employer of the Year with accredited training provided by TAFE SA. TAFE SA was also the national runner-up in both of the VET Teacher/Trainer of the Year and Australian School-based Apprentice of the Year categories. Page 14
  • 15.
    YEAR IN REVIEW Plansfor 2012 2012 is a very important year for TAFE SA, with significant TAFE SA will continue to set the benchmark in Australia in changes being undertaken in the vocational education and terms of student satisfaction and employment outcomes, training system in South Australia as the Skills for All reforms and continue to play a central role in the state’s are introduced. development. TAFE SA as South Australia’s largest provider will play a TAFE SA fosters productivity, prosperity and social inclusion critical role in progressing these reforms and 2011 has through skills development for individuals and industry as a been a year for TAFE SA to ensure it is ready to effectively state government owned entity. TAFE SA will continue to operate in a more competitive demand-driven market. deliver on its goals by: Legislation will be introduced in 2012 to establish TAFE SA - delivering training that provides students every as a Statutory Authority. This will give TAFE SA greater opportunity to achieve their personal, educational autonomy, increased capacity to respond to market needs, and career goals and the opportunity to attract more funding and grow in - engaging with employers, industry and the what will be a much bigger training system . community to continue developing the highly During 2012, TAFE SA will strengthen relationships with skilled workforce they need industries and engagement with employers to deliver the - ensuring our products and services meet the education and training required to develop the highly diverse needs of our students and industry skilled workforce needed by current and emerging industries. - prioritising resources to support our vision, meet market expectations and implement contemporary With the proposed changes, work will continue for methodologies and technologies TAFE SA to remain South Australia’s largest provider of - building relationships to guarantee our vocational education and training and will continue to offer educational delivery is meaningful and current a diverse range of courses, including building, construction and furnishing, manufacturing, engineering and transport, - working with ACE providers to support South community services and health, hospitality and tourism, Australians needing foundation skills. business and finance and primary industries, food TAFE SA looks forward to working with students, staff, and wine. employers, industry and its many stakeholders during 2012 and in the future. Vanessa Corbell - a TAFE SA Floristry student won the State and National Oasis Designz Cup competitions Page 15
  • 16.
  • 17.
    SECTION TWO ABOUT THE DEPARTMENT Page 17
  • 18.
    2.1 Our Priorities Throughskills and innovation, DFEEST provides the OUR VISION underpinning elements for a strong sustainable economy South Australia has the best workforce in Australia. for South Australia, achieved through greater participation and productivity from our workforce. OUR MISSION DFEEST’s priorities include ensuring South Australia has exemplary workforce planning and development practices; To develop the skills and capability of the state’s workforce strong industry partnerships; increased participation in and to maximise the opportunities for all South Australians to learning and work; a state with high quality and excellence engage in work. in tertiary education and training; supporting the state’s environmental sustainability through the development of Our actions to achieve this mission include: skills and technology; supporting world competitive research - supporting the Training and Skills Commission and uptake of new technologies and innovation; all with a (TaSC) in providing strategic advice and continued emphasis on quality and high performance. recommendations to the government on priorities and actions to increase the skills base of the Supporting the South Australian government’s agenda in workforce areas such as Information and Communication Technology (ICT) infrastructure, and the rollout of the National - working with industry, employers, business and Broadband Network (NBN) in identified regions of the state across government to develop the highly skilled is a continuing priority of DFEEST. workforce needed by current and emerging industries In preparation for the ongoing implementation of Skills for - building on our past successes to propel the state All from 2012, the process for identifying and developing its forward with an education and training system that strategic direction was a major priority throughout 2011. is more responsive to industry demands Skills for All, the department’s strategic direction for VET, will position the sector to respond quickly and flexibly to the skill - exploiting opportunities which put South Australia needs of industry and individuals. This includes ensuring that at the national forefront of research and TAFE SA has appropriate governance and funding technology, and innovation development arrangements in place so that it is well prepared for changes - creating more opportunities for Aboriginal people, to the way in which VET is delivered in South Australia. young people, people with disabilities and older people to participate in the workforce and in their communities. Page 18
  • 19.
    ABOUT THE DEPARTMENT OURVALUES DFEEST is striving to become a high-performance learning Openness in decision making by: organisation which attracts, develops and retains a highly - providing reasons for our decisions talented workforce. The department will only achieve this through a strong commitment to our people and core - restricting information only in the public interest values. We will demonstrate this through: and preservation of personal privacy - resolving conflicts Respect for: - being transparent. - the values, beliefs, customs and cultures of individuals and our community Striving for excellence in: - others’ rights, responsibilities and professionalism. - the efficient and effective use of public resources Responsiveness in: - environmental sustainability - providing timely and caring services - embedding equality of access and opportunity - generating innovative and creative - treating people fairly shared solutions - standards of service. - embracing change that improves our effectiveness and efficiency Courage in: - recognising and celebrating effort and achievement. - challenging and being challenged - taking risks - doing things in different ways - taking responsibility for mistakes and learning from them - enforcing our code of conduct. The key priorities for the Department of Further Education, Employment, Science and Technology in 2011 centred on the department’s Strategic Plan 2010-2014 and directly reflected the vision, mission and values of South Australia’s Strategic Kristal West - Plan targets. Aboriginal and Torres Strait Islander Student of the Year 2011 South Australian Training Awards Page 19
  • 20.
    2.2 Our Structure PRODUCTIVITY In order to successfully respond to the objectives of One of the focuses for Skills for All is the need for industry to Skills for All, and to strengthen capacity in science, research increase its productivity through co-investment in training and technology, the structure within the department and workforce development. This is ideally achieved required transformation. through a renewed partnership with education providers, industry, unions, the community and individuals. The organisational restructure was fundamentally about refocusing the department to deliver on the new policy The application of science, research, innovation and digital direction and approach in Skills for All and to deliver on the technologies will also be critical determinants of future Minister’s agenda for advancing science, technology, productivity and growth. engineering and mathematics (STEM) skills as well as for science, research and technology. The following directorates are grouped under the Productivity stream: The realignment of activities also provided an opportunity to achieve administrative efficiencies, minimise duplication, - Traineeship and Apprenticeship Services improve systems and processes and, where possible, - Industry Skills Development economies of scale in areas such as contract management - Digital Economy and Technology and administration to achieve significant budget savings. - Quality, Tertiary Education, Science and Research Skills for All is making significant changes to South (QTESR) (specifically STEM and science Australia’s VET system, and TAFE SA, the state’s public and research). training provider is changing too. Skills for All gives TAFE SA greater autonomy along with increased capacity to respond to changing market needs. PARTICIPATION With TAFE SA having greater autonomy through the Office of TAFE SA, and in the future as a statutory authority, there Skills for All proposes fundamental changes to the way was a need to reconfigure DFEEST Corporate, both in training is accessed. A new directorate, Skills SA, was terms of its relationship with TAFE SA as well as in terms of formed to deliver on Skills for All reforms. Skills SA has a working across the training system, with all education dedicated team of staff to ensure stakeholders have access sectors, industry and employers. to high-quality consumer information on careers and training options. The focus initially is on provision of better The organisational restructure, and the corresponding information to allow a demand-driven model to function changes in the way that DFEEST operates, was designed to and then investment in systems to administer and allocate ensure that the department could deliver on Skills for All funding based on student demand and industry needs. objectives and requirements. Initial structural changes were made from 1 July 2011. The department has a focus on increasing the participation of South Australians in learning, training and work, in The DFEEST Corporate structure has been developed particular people experiencing barriers and disadvantage in around three themes which inform functional groupings: the labour market. - Productivity Directorates under the Participation stream include: - Participation - QTESR (specifically quality of training providers - Policy and Corporate Support. through contracting and support for professional development) - Skills SA - Participation and Equity. Page 20
  • 21.
    ABOUT THE DEPARTMENT POLICYAND CORPORATE SUPPORT Strategic Policy, Resources and Corporate Services Corporate Communications and Finance Skills for All will require changes to the Marketing The key objective of the Strategic tools, resources and infrastructure Corporate Communications and Policy, Resources and Finance area is required to support the new student- Marketing is responsible for managing to ensure highest quality business, centred demand-driven training the communications and marketing economic and labour market analysis system. This will require enhanced needs of DFEEST and for providing to support prompt and informed information management systems strategic media and communications resource allocation by the Chief configured to new funding models. advice to the Chief Executive and the Executive and DFEEST executives, With new systems comes an Minister. thereby focusing alignment between opportunity to review and consolidate DFEEST programs and pursuit of contract management and The role includes responding to strategic targets (both for DFEEST administrative functions. Corporate requests from the media, and initiating and SASP). Services had previously undergone a contact with the media to announce major review to develop a preferred and promote initiatives of DFEEST and Strategic policy, review and evaluation structure that will provide the optimal TAFESA. It also includes providing are brought together in a single systems and arrangements to deliver advice on the development and use directorate to provide strong on the Skills for All reforms and of social media, monitoring trends in integration between policy and achieve efficiencies. communications and marketing, and evaluation, and some economies of managing and marketing events such scale. Individual directorates are For more information about as the South Australian Training responsible for operational policy, Corporate Governance, please refer to Awards and the South Australian operational review and evaluation as page 87. Science Excellence Awards. it relates to implementation. Page 21
  • 22.
    2.3 South Australia’sStrategic Plan South Australia’s Strategic Plan (SASP) outlines a medium to long-term course for the whole of South Australia, and sets out targets under interrelated objectives. At the start of 2011, DFEEST was the lead agency responsible for 14 targets, under the objectives: growing prosperity; fostering creativity and innovation; and expanding opportunity. OBJECTIVE – GROWING PROSPERITY T1.10 Jobs: Better the Australian average employment T4.10 Australian Government resources: Secure growth rate by 2014. (Now target T47). Australian Government research and development resources to 10 percent above T1.11 Unemployment: Maintain equal or lower than South Australia’s per capita share by 2010 the Australian average through to 2014. and increase this share to 25 percent by (Now target T49). 2014, for both public and private spheres. T1.12 Employment participation: Increase the T4.11 Business expenditure: Increase business employment to population ratio, standardised expenditure on research and development to for age differences, to the Australian average. 1.5 percent of GSP in 2010 and increase to 1.9 percent by 2014. (Now target T98). T1.26 Aboriginal unemployment: Reduce the gap between Aboriginal and non-Aboriginal unemployment rates each year. (Now target T51). OBJECTIVE – EXPANDING OPPORTUNITY T1.16 Share of overseas students: Double South Australia’s share of overseas students by 2014. (Now target T90). T6.15 Learning or earning: By 2010, increase the number of 15-19 year olds engaged full-time in school, work or further education/training OBJECTIVE – FOSTERING CREATIVITY AND INNOVATION (or combination thereof) to 90 percent. (Now target T54). T4.6 Commercialisation of research: Increase gross revenues received by South Australian-based T6.19 Non-school qualifications: By 2014, equal or research institutions from licences, options, better the national average for the royalty agreements, assignments, licensed proportion of the labour force with technology and patents by 2010. non-school qualifications. (Now target T95). (Now target T91). T6.20 Higher education: Increase South Australia’s T4.8 Broadband usage: Broadband usage to proportion of higher education students to exceed the Australian national average by 7.5 percent of the national total by 2014. 2010, and be maintained thereafter. (Now target T93). (Now target T57). T6.21 VET participation: Exceed the national T4.9 Public expenditure: By 2010, public average for VET participation by 2010. expenditure on research and development as a proportion of GSP, to match or exceed average investment compared to other Australian states. (Now target T96). Page 22
  • 23.
    ABOUT THE DEPARTMENT RELAUNCHOF THE SASP The 2011 update of the SASP included 100 targets restructured to reflect the visions shared by all South Australians across six priority areas of community, prosperity, environment, health, education and ideas. Since November 2011, DFEEST has had lead responsibility for 17 of the 100 targets detailed in the Plan in the areas of prosperity, education and ideas. While many of the department’s targets have been amended, five new targets have been assigned: T48 Ageing workforce participation: Increase the proportion of older South Australians who are engaged in the workforce by 10 percentage points by 2020. T50 People with disability: Increase by 10 percent the number of people with a disability employed in South Australia by 2020. T55 Apprentices: Increase the number of apprentice completions in trade occupations by 20 percent by 2020. T58 Online business: Increase the proportion of businesses that receive orders online from 24 percent to 40 percent by 2014 and continue growth each year to 2020. T92 Science, technology, engineering and mathematics qualifications: Increase the number of domestic students completing undergraduate qualifications in specified science, technology, engineering and mathematics fields of education by 15 percentage points to 3 600 students per annum by 2020. Page 23
  • 24.
    2.4 Our FiveYear Strategic Plan 2010-14 The department’s Five Year Strategic Plan 2010-14, released in May 2010, provides the strategic direction for the department. The plan maps out seven clear goals that link to SASP targets, and which focus on: 1. EXEMPLARY WORKFORCE PLANNING AND 3. HIGH LEVELS OF PARTICIPATION AND ACHIEVEMENT DEVELOPMENT IN LEARNING AND WORK Our future workforce will be built through a world-class Investing in education, skills and training that leads to system of workforce planning and development based on secure, well-paid jobs is essential to the state’s future understanding and responding to both industry and prosperity through increased productivity, workforce individual demand. participation and social inclusion. Links to SASP Targets T1.10, T1.11, T1.12, T1.26, T6.15, Links to SASP Targets T1.16, T6.15, T6.19, T6.20 and T6.21. T6.19, T6.20 and T6.21. 4. EXCELLENCE IN TERTIARY EDUCATION AND TRAINING 2. STRONG INDUSTRY PARTNERSHIPS Building the capability, quality and capacity of the VET and Strong partnerships ensure employers have people with higher education systems to meet the demands of the right skills at the right time to increase productivity in a individuals and of industry to address South Australia’s rapidly changing and higher skilled economy. future labour supply requirements. Links to SASP Targets T1.10, T1.11, T1.12, T1.26, T4.6, T4.8, Links to SASP Targets T1.10, T6.15, T6.16, T6.19, T6.20 T4.9, T4.10, T4.11, T6.15, T6.19, T6.20 and T6.21. and T6.21. Page 24
  • 25.
    ABOUT THE DEPARTMENT 5.WORLD COMPETITIVE RESEARCH, TECHNOLOGY AND 7. DFEEST IS A HIGH-PERFORMANCE ORGANISATION INNOVATION DFEEST is a highly skilled organisation that provides responsive, effective and efficient services to industry, small The state’s prosperity, economic growth, environmental and medium enterprises, individuals, the community and sustainability and social wellbeing are underpinned by the the government. discovery and application of knowledge to create new and better products, and smarter processes and systems. Links to SASP Targets T1.7, T1.8, T1.9, T2.7, T2.11, T2.12, T3.13 and T4.8. Links to SASP Targets T4.6, T4.8, T4.9, T4.10 and T4.11. 6. SKILLS AND TECHNOLOGY FOR THE STATE’S ENVIRONMENTAL SUSTAINABILITY The long-term economic prosperity of South Australia is inextricably connected to environmental sustainability, investments in research and technological innovations and in building the skills for sustainable development; these things are essential to secure business and employment opportunities from innovative green industries and services. Links to SASP Targets T3.7, T4.6, T4.7, T4.9, T4.10 and T4.11. Page 25
  • 26.
    Joshua Konc - Apprentice of the Year 2011 South Australian Training Awards Page 26
  • 27.
    SECTION THREE OUR PERFORMANCE Page 27
  • 28.
    3.1 Workforce Planning DFEESTStrategic Plan Goal 1 DFEEST continued to refine workforce modelling in Skills for Jobs conjunction with the TaSC as follows: In early December 2011 the TaSC released its annual - supported targeted industries to develop update of the five-year plan for skills and workforce workforce plans development, Skills for Jobs. The plan showed that job openings over the period 2009-10 to 2014-15 will total - facilitated the development and launch of the approximately 163 000, comprising of 69 000 new jobs Resources Industry Workforce Action Plan in due to economic growth and 94 000 due to replacement conjunction with Resources and Energy of those leaving the workforce. Skills Australia - supported the early childhood development The total demand for qualifications over this period is workforce through an analysis of their workforce estimated to reach 299 000 - 95 000 of which are at the requirements, and informed the State Migration Bachelor degree or higher; 51 000 at the Plan through analysis and modelling of Advanced Diploma/Diploma level; 44 000 at the Certificate relevant data. IV level and 70 000 at the Certificate III level. However, more and better job opportunities are vital if The plan was again developed following extensive people are to lead fulfilling, independent lives and generate consultation with industry and regional stakeholders, and future opportunities. Being employed affects income, living includes a detailed analysis on the demand for standards, welfare dependency, social inclusion and social qualifications associated with specialist occupations. The connectedness, and through them, social and economic plan identifies 87 specialist occupations in South Australia, wellbeing, for both individuals and their family members 2. around one-quarter of all occupations in the state. The skills for these occupations are highly specialised and often While strong jobs growth is a sign of a strong and require extended learning over several years. TaSC’s prosperous economy, the quality of available jobs is analysis shows that 33 of these specialist occupations are increasingly important. Higher skilled jobs provide higher likely to have insufficient supply of qualifications over the incomes and greater security for the people who five-year period. This information will be used by DFEEST in hold them. devising its eligible qualifications list and caps and incentives regime under Skills for All reforms. DFEEST also continued to work with a number of industries concerning their workforce planning and development The 2011 plan also highlighted the participation challenge needs. During the year, DFEEST supported the workforce facing South Australia and urged the government to planning activities of a number of industries, including address this challenge through targeting its Skills for All transport and logistics, telecommunications, early investment in areas such as foundation skills, adult childhood, defence and mining industries. community education, and wrap-around services for those who face barriers to training and work. DFEEST continued to coordinate and facilitate joint activities with the network of industry skills boards which provided opportunities to work through policy issues with industries. As part of Skills for All, employers will be able to access government-endorsed, independent workforce development advisors to help identify workforce development needs and broker relevant training and support. 2 ABS 2010, Year Book Australia, 2009-10, cat. no. 1301.0, ABS, Canberra cited in ABS 4125.0 - Gender Indicators, Australia, July 2011 Page 28
  • 29.
    OUR PERFORMANCE Plans for2012 As the government transfers its regulatory powers over to In 2012 the TaSC will continue to hold regional visits ASQA in VET and Tertiary Education Quality and Standards following its successful visits to Whyalla and the Riverland Agency (TEQSA) in higher education in 2012 the TaSC will during 2011. During 2012 the TaSC will also advise the continue to advise the Minister on the extent to which Minister on how the state can maximise employment Skills for All produces quality vocational outcomes. The TaSC participation from the mining expansion, particularly for will also encourage industry to embrace Skills for All and regional communities. partner with government to invest in workforce planning and training. 15 Percent Workforce Participation in Government Construction Procurement From 1 January 2011, government construction contracts require the contractor to ensure that 15 percent of the onsite labour hours on major government building and civil infrastructure projects are undertaken by apprentices, trainees, Aboriginal people and local people who have barriers to employment. DFEEST is working with contractors to provide assistance to meet compliance obligations through measures such as South Australia Works, Skills in the Workplace and Indigenous programs. Projects signed in 2011, and that fall within scope, include DFEEST’s Sustainable Industries Education Centre (SIEC) and the Adelaide Oval Redevelopment. Other projects that were signed prior to 1 January 2011, such as the Seaford Rail Extension and the South Road SuperWay have participation targets built into their contracts. DFEEST’s South Australia Works regional coordinators are working with these contracts to identify training and employment services that will assist them to meet their targets. Women Influencing Defence and Resources Industry project DFEEST collaborated with the defence and resources sectors to foster a community of practice with over 150 women. The Women Influencing Defence and Resources Industry project provided programs aimed at supporting the attraction and retention of female employees in the two industry sectors. Participants attended professional development in leadership and mentoring and were provided with networking opportunities. Page 29
  • 30.
    Employment Growth Thecurrent annual employment growth rate at December 2011 was 0.6 percent in South Australia and 0.1 percent at the national level. At the same time, South Australia’s labour force participation rate was 63.3 percent. Figure 1: Trend total employment growth Source: Australian Bureau of Statistics (ABS) Cat No 6202.0 Figure 2: Labour force participation 66% 65% 64% 63% 63.2% 62% Dec 2011 Projected 61% (Target 65.4 at Jan 2012 ) Trend (Jan 2001 - Dec 2011) 60% 59% 58% Jan-01 Jan-02 Jan-03 Jan-04 Jan-05 Jan-06 Jan-07 Jan-08 Jan-09 Jan-10 Jan-11 Jan-12 Jan-13 Jan-14 Jan-15 Jan-16 Source: ABS Cat No 6202.0 Page 30
  • 31.
    OUR PERFORMANCE Young peoplefull time in school, work or further education/training In November 2011, 85.5 percent of young people aged 15 to 19 in South Australia were engaged full time in either study or employment, or a combination of both. This compares to 84.8 percent at the national level. Figure 3: Youth (15-19 years) learning or earning engagement ratio Source: ABS Cat No 6202.0 Unemployment rates by level of educational attainment In 2006, people with qualifications of Certificate III and above experienced unemployment rates considerably lower than those without higher level qualifications. Figure 4: Unemployment rate census 2006 Source: ABS Population Census 2006 Page 31
  • 32.
    3.2 Engagement withIndustry DFEEST Strategic Plan Goals1, 2 and 3 APPRENTICES AND TRAINEES The traineeship and apprenticeship system is an area in which the department directly engages with industry to develop and maintain South Australia’s skilled workforce. DFEEST is responsible for the regulation of South Australia’s traineeship and apprenticeship system, under delegation from the Training and Skills Commission, and for the provision of subsidies to support the training of trainees and apprentices. Trainee and apprentice activity Traineeship and Apprenticeship Information Service In 2011, more South Australians participated in the The department operates an information service to provide traineeship and apprenticeship system than ever before, advice and information on the traineeship and with an increase in both the number of commencements apprenticeship system to trainees, apprentices, their and completions. The number of early completions employers and the general public. In 2011, the information also increased. service responded to 27 341 phone calls – an average of 525 calls per week. This represents a 5.5 percent increase in - At 30 June 2011, there were an estimated 34 400 trainees and apprentices in training, a 3.9 percent calls from 2010. increase on the previous year’s figure (see Figure 5) Employer Registrations and Employer Visits - In 2010-11, there were an estimated 23 200 traineeship and apprenticeship commencements, The Training and Skills Development Act 2008 requires a 4.5 percent increase on the previous year’s employers to register prior to employing and training figure (see Figure 5) trainees and apprentices. In 2011, 2294 new employers were registered to take on trainees and apprentices. A total - An estimated total of 12 400 trainees and of 16 032 employers were registered in South Australia at apprentices completed their training in the twelve 31 December 2011. months to 30 June 2011, a 4.2 percent increase on the previous year’s figure (see Figure 5) The department works closely with employers and their - The number of existing worker commencements trainees and apprentices and conducted over 4000 and newly commencing workers both increased employer visits in 2011. in 2010-11 (see Figure 6). - The number of early completions experienced a minor increase of 0.4 percent in 2011. Page 32
  • 33.
    OUR PERFORMANCE Figure 5:Trainee and apprentice activity, five years ending 30 June 2011 4 40000 35000 30000 25000 20000 In-Training 15000 Commencements Completions 10000 5000 0 2007 2008 2009 2010 2011 Year Figure 6: Existing worker trainee and apprentice commencements compared to newly commencing workers, five years ending 30 June 2011 4 4 Data for Figures 8 and 9 are sourced from the NCVER Australian VET statistics – Apprentices and trainees June quarter (2011) report. Data for 2011 and in training data for 2010 are estimates. The NCVER may revise these figures in the fu- ture. In training data is provided at 30 June annually; commencement and completion data are provided from the 12 months ending 30 June of each year. Page 33
  • 34.
    User Choice TrainingSubsidies E-Training Plans The department is responsible for the provision of User Registered Training Providers are now able to lodge Choice training subsidies to both public and private training apprenticeship and traineeship training plans online. Online organisations, to support trainees and apprentices with the lodgement has reduced red tape and improved the quality cost of formal training. The User Choice policy has of the information available to the department. historically supported all trade qualifications, a range of traineeships at Certificate II and III Australian Qualifications Apprenticeship Nominal Terms Framework (AQF) levels and a small number of higher level traineeship qualifications. As part of the South Australian DFEEST prepared a consultation paper for the TaSC that government’s election promise to support an additional was used to consult key industry stakeholders about the 100 000 training places over six years and the Skills for All appropriateness of current nominal terms for twelve trade reform, User Choice funding was extended to all existing apprenticeships. The chosen trades have an early worker trainees undertaking Certificate III qualifications in completion rate of 40 percent or more for all completions September 2011. This was followed by the extension of over the period January 2007 to June 2010. The trades training subsidies to new and existing worker trainees who concerned were Bread Baker and Pastry Cook, Butcher, commenced a Training Contract from 7 December 2011 in Cook, Automotive Parts Interpreting (Specialist), Engineering most AQF levels II to VI qualifications. Tradesperson (Fabrication) and (Mechanical), Bricklaying, Carpentry and/or Joinery, Painting and Decorating, Tiling In 2010, 160 registered training organisations (consisting of (Wall and Floor), Hairdressing and Printing Machining. All TAFE SA and privately owned providers) received funding have a nominal term of four years, except for Automotive under a User Choice agreement. A total of $42 million in Parts Interpreting (Specialist), which has a three-year term. contestable funding was provided by the department The TaSC will consider industry feedback in early 2012. during the year to support almost 22 000 trainees. As illustrated in figures 7 and 8, funding for apprentices Institution-based Trade Training Survey and Paper represented 56 percent of student numbers and 70 percent In 2011, DFEEST conducted a survey of institution-based of expenditure, while funding for traineeships represented trade training learners across the state, and included the 44 percent of student numbers and 30 percent of results in an information paper on institutional pathways to expenditure. In general, apprenticeship training is more trade qualifications, prepared for the TaSC. The paper is expensive than traineeship training due to higher intended to assist the TaSC to develop a policy position on infrastructure costs and smaller class sizes. institution-based trade training in South Australia. Supervisor’s Guide Figure 7: Student numbers In 2011, DFEEST launched a comprehensive information package for supervisors of trainees and apprentices. The package consists of a booklet and DVD designed to support supervisors in their day-to-day management, and enable them to work more productively with trainees and apprentices. The Supervisor’s Guide emphasises the need to provide pastoral support and mentoring, which research indicates is vital to the retention of trainees and apprentices, and their completion of traineeships and apprenticeships. A copy of the Supervisor’s Guide was sent to approximately 16 500 registered employers, with additional copies sent to Industry Skills Boards and Australian Apprenticeships Figure 8: Funding ($ million) Centres. The Supervisor’s Guide has also been uploaded onto the Skills for All website, with hard copies available from the department on request. Page 34
  • 35.
    OUR PERFORMANCE Plans for2012 Harmonisation Phoenix In 2011, states and territories agreed, in principle, to the Phoenix, a web-based system assisting in the management harmonisation of training laws and administrative processes of Training Contracts, is expected to be delivered during for traineeships and apprenticeships by 30 June 2014. The 2012-13. This system enables training providers, employers, department has commenced work with other jurisdictions apprentices and trainees to view and manage their own to complete Stage 1 of the implementation plan by information online. 30 June 2012. The Commonwealth government has announced the devolvement of the management of Australian Apprenticeship Support Services to the states and Employer Recognition Program territories in 2014, conditional upon the achievement In 2012 the department will implement an employer of harmonisation. recognition program as part of the Skills for All reforms. The program will encourage and reward employers with an outstanding commitment to training and workforce Mentoring Apprentices and Trainees development, including apprenticeships. Research indicates that the provision of mentoring and pastoral care significantly affects the chances of an apprentice or trainee completing their qualification. DFEEST will work with industry and employers to develop a range of mentoring initiatives targeting disadvantaged groups, as well as apprentices and trainees training in skills shortage areas. Page 35
  • 36.
    UPSKILLING EXISTING WORKERS JobsStrategy Projects Environmental Sustainability As part of its Jobs Strategy, the South Australian As part of the government’s 100 000 Jobs Strategy, government, in partnership with the Commonwealth, has $500 000 has been allocated to sustainable industries committed to creating 100 000 training places over six experiencing rapid growth to provide training in part years from 2010-11, and upskilling existing workers to meet qualifications for existing workers. This includes $200 000 changing workforce needs is a key part of that strategy. for Grid Connect training for solar panel installations with over 185 electricians undertaking the training. A sum of New industries and emerging skill demand sectors have $150 000 will assist Suzlon Energy Australia to devise wind driven the allocation of the additional training places to turbine maintenance training to support their current ensure that South Australia has the right education and workforce and $150 000 has been allocated to the Berri training system. Barmera Council to train staff in the installation of a The department has funded a total of 14 specific projects subsurface irrigation system across 52 hectares of council supporting 1018 people to gain training in a variety of parks and gardens. industry sectors. Productivity Places Program for Existing Workers Plans for 2012 The PPP is a Commonwealth government initiative to Skills in the Workplace is Skills for All’s approach to tailored deliver $156 million of training for existing workers and job training and workforce development responses for seekers in areas of high skills demand. industry. Skills shortages in key industry sectors and In 2011, DFEEST allocated around $44.8 million of PPP companies in the supply chains for critical projects and funding toward almost 12 500 existing worker infrastructure investments will be targeted with training qualifications. Furthermore, from 1 July 2011 an additional subsidies, with small to medium-sized enterprises a $4.2 million of PPP funding supported additional User particular focus. Depending on the size of their workforce, Choice existing worker traineeship positions under businesses will be eligible for up to 90 percent of their Contracts of Training. These PPP-funded trainees are training costs towards qualifications, and skill sets, at undertaking higher level qualifications (Certificate IV and Certificate IV and above to support their employees. Both above) where User Choice funding would not otherwise complete qualifications and tailored combinations of units be available. of competency will be funded. Program design and early implementation was completed by the end of Industry Partnership Program December 2011. The Industry Partnership Program concluded as an individual program in July 2011; however it has been absorbed into the Skills in the Workplace program. The program worked closely with industry sectors to develop a workforce that has the right skills, in the right place and at the right time by creating employment and training opportunities that are industry-led and demand-driven. Skills in the Workplace Projects developed under the Industry Partnership Program will fund training brokered and managed workforce development programs critically required by that recruited, inducted, trained and retained industry for more than underemployed and/or unemployed people in South Australia. 2000 SA workers. Successful proposals, demonstrating matched funding from industry, were funded on a contractual basis. Page 36
  • 37.
    OUR PERFORMANCE ASSISTANCE FORRETRENCHED WORKERS DFEEST supported 194 workers through the Retrenched As at 30 November 2011: Workers Program who were retrenched from Bridgestone - 163 workers had registered to access services and Kimberly-Clark Australia during 2011. - 103 accessed or are accessing training support DFEEST is managing the Labour Market Adjustment - 32 workers who accessed training achieved full program, utilising expertise in the Limestone Coast Career AQF qualifications Development Centre and the National Industry Skills Council, Forestworks. - 60 individuals gained employment. Services include: - skill recognition and career planning - job search assistance - referral for skills and vocational training, as well as licences and tickets which are fully funded under the program - employment brokerage. Page 37
  • 38.
    TAFE SA -INDUSTRY PARTNERSHIPS TAFE SA acknowledges the important contribution industry In 2011, TAFE SA also developed and maintained has in assisting TAFE SA to construct and deliver VET that is relationships with: current and relevant, to develop and maintain a highly - Woolworths and Service Skills SA, with the first ten skilled workforce. Our partnerships with employers are Diploma of Retail Management PPP essential to our success. participants graduating - the Adelaide Health Service Registered Training OneSteel Whyalla Steelworks Organisation and the Department of Health, for the upskilling of weekly paid workers in the Certificate III Over many years TAFE SA has developed a close strategic and IV qualifications in health relationship with the OneSteel Whyalla Steelworks. This partnership has produced many industry-leading VET - the Repatriation General Hospital, Flinders Medical programs and helped to develop OneSteel’s workforce. The Centre and the Calvary Health Care Group, with ‘Critical Safety Training Centre’, located at Whyalla, is a successful Productivity Places Program existing formal partnership with OneSteel who train all of their staff worker funding for the Certificate III, IV, Diploma in the facility using joint resources and staff. Another and Advanced Diploma. partnership initiative with OneSteel is the development of a ‘Technician Certificate’, a tailored trade certificate not only providing a customised solution, but supporting the Regional Development government’s national agenda for higher level qualifications. The delivery of the innovative Smart E-Skills program used existing relationships with Regional Development Australia (RDA) board across the state and built further relationships South Australian Wine Industry with organisations such as Women in Business and The South Australian wine industry is a major contributor to Regional Development in the South East of the state. The the state’s economy in export and tourism earnings. program was jointly marketed and provided opportunities TAFE SA has worked in close partnership with the industry for small to medium-sized enterprises across all industry over many years, developing a noteworthy client list sectors to develop skills in the use of the internet. The including: Yalumba, Constellation Wines, Pernod Ricard, program was delivered through face-to-face workshops, Treasury Wine Estates, Peter Lehmann Wines, Vinpac one-to-one mentoring, and follow-up online services. Smart- International and Angove Family Winemakers; 95 percent of E-Skills was enthusiastically received by participants, resulting students enrolled in Certificate III or higher wine-related in the delivery of the program to 1174 enterprises across qualifications are working within the industry. Training the state. programs are customised to meet industry requirements and currently 39 percent of training is delivered within the workplace. Arts The TAFE SA Adelaide College of the Arts (AC Arts) has an active industry board which represents the arts sector. Industry Reference Groups Members, appointed by the Minister and Chair, participate TAFE SA established industry reference groups regionally to in industry reference panels based on their respective areas provide direct advice on industry skill needs (current and of knowledge. During 2011, AC Arts fostered new emerging) and the relevance and currency of training and partnership arrangements with the Australian Dance assessment processes. These groups include representatives Theatre, the State Theatre Company, Country Arts SA and from industry peak bodies, private registered training the Hill Smith Gallery. One key outcome was the organisations, Job Services Australia providers, not-for-profit opportunity for TAFE SA students to partner with the organisations and small to medium-sized enterprises. Advice Australian Dance Theatre for the performance from these groups provides valuable business intelligence of ‘Worldhood’. that enhances existing quality assurance strategies and ensures informed decision-making processes. Page 38
  • 39.
    OUR PERFORMANCE Engineering andAutomotive Industries Hair and Beauty TAFE SA collaborated with Clipsal to produce a progressive The Limestone Coast Hair and Beauty Competition, electrical engineering program, teaching its apprentices to organised by TAFE SA and in its 18th year, is another use the latest C-Bus Technology. C-Bus is Australia’s market- example of long-standing and successful industry leading energy management system for industrial projects engagement. Each year the competition grows in and residential homes. The TAFE SA School of Electrical participation and audience, attracting an average of 100 Engineering Certificate III curriculum included a C-Bus competitors and an audience of 800. The cost of staging the course for the first time, with the program completed by 56 event is fully covered by sponsors and entrance fees, and apprentices as an elective unit of competency as part of the any profit is used to support students to attend the National students’ off-the-job training. Hair and Beauty Expos. TAFE SA Automotive training introduced the latest Over 20 TAFE SA Hair and Beauty lecturers and students technology and state-of-the-art equipment thanks to Toyota from metropolitan and regional campuses worked Motor Corporation Australia and Kawasaki Australia, who backstage, creating the hair and make-up looks for five of generously donated vehicles to the value of over $100 000. the Adelaide Fashion Festival parades. During the festival, Two top-of-the-range vehicles, a Land Cruiser Prado Kakadu the TAFE SA Fashion program also presented three parades. and the popular Toyota Corolla Ascent, will give Certificate II Sponsored by Attitude Magazine, the parades showcased to Diploma in Automotive Retail Services and Repair the final year Advanced Diploma of Fashion Design and students access to new electrical engine technology and Technology students’ graduation collection. electronic aids. A Kawasaki ER60 motorcycle that uses the latest fuel-injected engine management system, ABS braking system and cassette-type transmission was also donated. Defence TAFE SA welcomed new families of the Australian Defence Force to South Australia at the Defence Community Organisation Welcome Expo, as part of a major relocation of the 7RAR Battalion from Darwin to Adelaide. The expo attracted over 1000 Australian Defence Force members and their families. Over the past two years, TAFE SA has worked with the Australian Submarine Corporation and Air Warfare Destroyer Alliance to establish a pre-employment welder evaluation program. The innovative program was developed to identify specific skill gaps in students, and then conducted targeted training to equip welders with the skills needed to gain employment in the defence industry. Design During December 2011, TAFE SA Visual Merchandising staff and students spent a week at Myer City to assist in the set-up of Christmas displays within the store. This exercise involved not only installing the décor, but also creating merchandising gift stories throughout a range of departments. The store was later judged the ‘best presented Celebrity hairdresser and make-up artist Myer store nationally’. Dale Dorning led TAFE SA’s Hair and Beauty session styling team at the 2011 Adelaide Fashion Festival. Page 39
  • 40.
    3.3 Providing Opportunitiesfor All DFEEST Strategic Plan Goal 3 SOUTH AUSTRALIA WORKS South Australia Works - Working Regions Program engaged Plans for 2012 and supported people who faced barriers to learning, During the 2011-12 financial year, DFEEST will invest training and work by delivering flexible and responsive $6.4 million to implement South Australia Works Action initiatives tailored to the specific needs of individuals, Plans across the whole of the state. Over 10 200 people will communities, regions, industries and employers. participate in SA Works regional projects. Of these, over Career development services provided through the 5650 will participate in employment programs with over department’s regional program supported and assisted 2940 gaining a job, and 4550 will progress along pathways individuals to make informed choices about education, to employment, including learning, training and skills training and work, and facilitated planned pathways and development. Projects will provide opportunities for people successful transitions to learning and work. to access training and a combination of case management, In 2010-11, DFEEST, through regional projects, provided mentoring and post-employment support while gaining over 7600 learning, skills development training and work valuable work experience, and benefitting from employers’ opportunities to people facing difficulty entering the commitments to provide jobs. workforce, with over 3800 people gaining employment. Regional strategic planning, strengthened by the development of evidence-based three-year Strategic Plans, provided a robust response to the labour force needs of local labour markets. Over 800 people, including representatives from industry, communities and government, attended stakeholder forums to identify priority areas which increased participation in learning, training and work. In addition, DFEEST, in conjunction with Commonwealth Department of Education, Employment and Workplace Relations (DEEWR), facilitated a Regions Forum attended by over 120 regional partners and stakeholders to align Commonwealth, state and local/regional efforts on training and workforce participation. DFEEST’s regional coordinators worked with the South Australia Works networks to respond to each region’s unique learning, training and employment challenges. The networks bring together the three tiers of government, employers, industry, education and training providers, the non-government sector and community organisations, enabling decision-making in local communities. The establishment of six Career Development Practitioner networks in the Barossa, Limestone Coast, Kangaroo Island, Riverland, Northern and Southern Adelaide has enhanced the existing 17 regional career development services. The services support and complement the locally tailored participation projects delivered in state government regions. Page 40
  • 41.
    OUR PERFORMANCE ABORIGINAL TRAININGAND EMPLOYMENT DFEEST’s Aboriginal employment programs build the Aboriginal Access Centre capacity of employers to increase and sustain the Through the Aboriginal Access Centre, TAFE SA provided employment of Aboriginal people, and build the capacity of Aboriginal people with access to VET and supported Aboriginal people to gain and sustain employment. This students from unemployment to VET to employment. activity responds to the COAG and SASP targets which aim The Aboriginal Access Centre, in partnership with mining to halve the gap in employment outcomes between company OZ Minerals (Prominent Hill), has successfully Aboriginal and non-Aboriginal people by 2018. developed and delivered numerous customised Aboriginal The unemployment rate for Aboriginal people in South pre-employment training programs. These programs have Australia was 26.6 percent in 2010, compared to the produced 51 mining graduates, 40 of whom are now unemployment rate for non-Aboriginal people of locally employed by OZ Minerals. In recognition of these 5.2 percent. (see figure 9). achievements, OZ Minerals was recently presented with the 2011 South Australia Premier’s Social Inclusion in Mining DFEEST Aboriginal participation brokers have a visible and Energy Award for Excellence in Community Programs. presence on the ground in regions and local communities that have high numbers of Aboriginal people who are TAFE SA has also partnered with ETSA Utilities and the disengaged from and not participating in learning, training Aboriginal Access Centre to develop an industry-specific or work. The brokers facilitated strategic and operational training facility at Port Augusta. The ETSA Training Facility solutions to local training and employment needs, in was created to provide training for ETSA powerline worker particular, to prepare Aboriginal people for local jobs apprentices and is aimed at increasing base-level training for identified by employers. Under the Workforce Participation Aboriginal and non-Aboriginal people in the region, and in Government Construction Procurement Policy, ‘up to more specifically to increase opportunities for those students 2 percent’ of the total labour hours were allocated to to be employed by ETSA Utilities. Aboriginal people on government construction projects. Aboriginal Apprenticeship Mentoring The Aboriginal Apprenticeship Mentoring program worked with private providers, Group Training Organisations, Job Network Providers, employment service providers and RTOs to identify and place Aboriginal participants into employment. Twelve apprentices, 25 trainees, and 11 school-based participants have been placed to date. Figure 9: Unemployment rates for Aboriginal and non-Aboriginal South Aus- tralians Page 41
  • 42.
    Aboriginal Employers IndustryChampions Network Learning and Employment Outcomes DFEEST, in partnership with the Commonwealth DFEEST improved learning and employment outcomes for government, engaged with industry to support Aboriginal 2409 Aboriginal people by providing support, job training, employment and training, with the key objective to develop work placements, recruitment leadership training, career and support an industry-led strategy. enhancement, traineeships and apprenticeships. Of the Twenty-six senior business leaders across the state 2409 Aboriginal people who participated in DFEEST work participated in the Aboriginal Employers Industry programs, 1218 gained employment. Champions Network (AEICN), which promotes and In 2011, there were 4953 Aboriginal VET students in South supports this work. The Minister for Employment, Higher Australia, 3.5 percent of total VET students. This was higher Education and Skills sponsors this group, which includes than the population share of 1.7 percent and represented a prominent business and community leaders. significant increase in participation of almost 20 percent Industry clusters, established by the AEICN in 2010, in the since 2003. areas of Retail, Advanced Manufacturing, Community Four percent of all participants in PPP were Aboriginal and/ Services, Hospitality, Professional Services, Sports and or Torres Strait Islander people. As at June 2011, six percent Recreation, and Energy and Water have attracted of all PPP Job Seeker enrolments have been Aboriginal $1.8 million in Commonwealth and state funding. participants as well as three percent of PPP Existing The industry clusters have built the capacity of employers Worker enrolments. and industry to increase and sustain the employment of Aboriginal people. Connecting Aboriginal People to Mining Plans for 2012 (CAPM) is another example of the collaborative approach taken with industry. In 2010-11, CAPM assisted 41 DFEEST will continue to deliver programs, services and Aboriginal people to gain employment at OZ Minerals, Iluka, support to Aboriginal people, with a greater focus on BHP Billiton and with contractors supporting the pathways to learning, training and workforce participation. mining sector. Over 1310 Aboriginal people will participate in employment programs, with 856 to gain a job, and a further 1300 will participate in learning, training and skill development National Partnership Agreement on Remote Indigenous programs. Through the PPP, 2.5 percent of participants will Public Internet Access be Aboriginal and/or Torres Strait Islanders. Through the Commonwealth of Australian Governments To achieve the SASP target, an additional 520 Aboriginal (COAG) National Partnership Agreement on Remote people will need to gain and sustain employment every year Indigenous Public Internet Access (2009-2013), Indigenous in the South Australian workforce, and a further 250 will people in two remote communities, Oodnadatta and need to undertake training (2008-2018). Marree, have been provided with improved community based telecommunications, internet access, and training in computer and internet use. Services in Yalata, Amata and Mimili in the Anangu Pitjantjatjara Yankunytjatjara (APY) Lands will be in place by April 2012. Pika-Wiya Learning Centre In the area of Aboriginal health, TAFE SA has worked for many years in collaboration with various communities and groups. A particularly strong partnership has been with Pika-Wiya Learning Centre at Port Augusta, a service which provides learning opportunities and support for Aboriginal people to develop employment in the health industry. Tauondi Aboriginal College The Tauondi Aboriginal College, an independent, Aboriginal owned and operated organisation, funded by DFEEST, provided 752 Aboriginal people with accredited or non- accredited training and played a significant role in building the confidence, capacity and capability of the state’s Aboriginal community. Page 42
  • 43.
    OUR PERFORMANCE BUILDING FAMILYOPPORTUNITIES PROGRAM ABILITIES FOR ALL The Building Family Opportunities program, a four-year Abilities for All, a partnership program with Bedford social inclusion ‘demonstration program’ (2010-2014) Industries and community centres, targets participants with funded through the Department of the Premier and a disability who are disconnected from their communities, Cabinet, breaks the cycle of long-term family joblessness and have multiple barriers to learning and employment, have demonstrates that intensive case management can result in low literacy and numeracy skills and need assistance to education, training and employment outcomes for achieve their true potential. disadvantaged families. Participants were provided with a combination of A range of government and non-government agencies accredited and non-accredited training, work experience refer families to the program. Intensive case management is and on-the-job training; high and complex needs were provided to families with complex needs in three local addressed through wrap-around services and support. government areas by three non-government organisations: Welfare dependent, hard-to-reach learners were engaged UnitingCare Wesley in Port Adelaide Enfield, Centacare on a pathway to training and employment. Participants, Catholic Family Services in Playford and UnitingCare Wesley ranging from 18 to 65 years, had a physical, intellectual or a in Port Augusta. psychiatric disability, limited schooling, specific learning The program brought together long-term jobless families, difficulties including low literacy and numeracy levels, and local community organisations, government and employers lacked the confidence and life management skills to and found solutions to complex issues that prevent families participate in mainstream training activities. from participating in employment. In 2010-11, 217 people with a disability participated in the The program has attracted an additional $1.5 million from program, 75 gained employment and 203 completed a the Commonwealth government’s Family Centred Certificate II in Business or Community Services. Employment Project (FCEP) and will assist an additional 65 families living in the western region over three years (2010-2013). Plans for 2012 In the first 18 months, the program has improved the lives The Abilities for All program will provide 160 people with of over 330 highly complex jobless families, which consisted disability a combination of accredited training, learner of over 1000 individual family members, including children support and work experience, with 70 participants to gain a and dependents; the majority of these were single parent job. families. 112 families identified as Aboriginal, comprising 77 percent of families in Port Adelaide Enfield, 57.5 percent An e-learning trial through community centres located in of families in Port Augusta and 34 percent of families Port Pirie, Port Augusta and Berri will enable 15 participants in Playford. to access electronic training packages and complete a Certificate II in Business or Community Services. An across-government Senior Coordination Group, with representation from state government and the Commonwealth government will continue to address systemic issues, with Local Coordination Groups ensuring that issues specific to disadvantaged families in the local community are addressed throughout the duration of the program. Plans for 2012 The target of working with 400 families during 2010-2014 increased to 465 families when the Commonwealth government invested $1.5 million FCEP funding to expand the program at Port Adelaide. A minimum of 40 percent will be single parent families, 30 percent will be couple parent families and 30 percent will be Aboriginal families. Page 43
  • 44.
    ADULT COMMUNITY EDUCATION ACEis the community learning gateway for people wanting Plans for 2012 to participate in learning and further training and who face The ACE program will continue to provide an important social and economic barriers to formal participation. ACE outreach pathway for attracting and re-engaging people provided learning programs in a supportive community who are disengaged/disadvantaged because of low levels setting, and delivered accredited training and non- of literacy and numeracy skills, and not ready or able to accredited learning programs for working-age adults participate in institutional learning. (17 years and over) through not-for-profit community-based organisations. There will be 14 290 people participating in ACE programs, including 2200 people in foundation skills programs, funded The ACE program funded training that promoted through the Jobs Strategy. foundational skills development and increased literacy and numeracy skills. All delivery through ACE had a vocational The ACE sector will be further strengthened as a fourth intent with increased focus on articulated pathways into sector of education, and will build on the ability of the sector VET. A comprehensive approach to digital literacy to engage marginalised population groups, and enable foundation skills addressed the barriers to online more training to be delivered to more people experiencing participation through the community. barriers to participation in their local community. This will include development of a new curriculum used for the In 2010-11, 11 470 people participated in 93 ACE projects. delivery of non-accredited and accredited training through Funding allocated through a competitive grants process the ACE sector, and supporting the professional supported accredited courses, non-accredited learning and development of ACE providers, particularly through training workforce development delivered by not-for-profit in Certificate IV in Language, Literacy and Numeracy community-based education and training providers. Assessment and Certificate IV in Training and Assessment. ACE program funding supported: - Multi-Literacies projects, which focused on a range of key literacies (e.g. prose literacy, finance literacy, computer literacy) SKILLING JOB SEEKERS THROUGH THE PRODUCTIVITY - Foundation Skills projects, which delivered PLACES PROGRAM accredited training that addressed barriers to As mentioned previously, the PPP delivers training for successful participation by individuals in formal existing workers and job seekers in areas of high skill education, training and work demand. - Transitions projects, which featured partnerships The 2011 Job Seeker round was allocated in December between community organisations and TAFE SA 2010, with $13.85 million allocated to fund over 4500 that assisted adults to make successful transitions qualifications. To date 81 percent of students have enrolled from non-formal to formal learning and and 35 percent of students have obtained a achievement of a post-school qualification final qualification. - Workforce Development projects, which increased the capacity of the ACE sector to deliver training through professional development. At least $6.4 million 2010 Jobs Strategy funding, invested over the six years, will increase the delivery of foundation skills and the development of stronger pathways between ACE and the VET system. The Remote Indigenous Public Internet Access Project in Oodnadatta expanded opportunities for remotely located Aboriginal communities to participate in the digital economy. The project provided free public computer and internet access and a training program. Page 44
  • 45.
    OUR PERFORMANCE TAFE SA- LEARNING PATHWAYS under a VET in Schools Agreement in partnership with industry, and schools purchasing directly from TAFE SA. Learning pathways are an important part of ensuring individuals have the assistance to help them succeed in their In November 2010, the Commonwealth government chosen field. TAFE SA has numerous partnerships in place allocated funding to construct a purpose-built training with schools and universities to provide direction and to facility at Umuwa on the APY Lands. The facility, due for maximise opportunities for students. completion in 2012, will be used by eight schools with students receiving training in weekly blocks. During 2011, TAFE SA aims to maximise educational outcomes for all consultative and collaborative negotiation was ongoing learners and particularly for those who need additional between TAFE SA, DECD (the lead agency on the project) support to succeed in education and training. A significant and the Anangu schools to further develop the range and amount of activity occurred during 2011 to assist learners to depth of VET on the APY Lands in readiness for the Trade achieve their potential. Training Centre. In 2011, TAFE SA provided training for APY TAFE SA Information and Student Services provides ongoing Lands school-based staff with 12 completing the information, support and career counselling to the school Certificate IV in Training and Assessment, further enhancing sector through a number of presentations held each year the delivery of VET pathway offerings. including Career Expo’s, Open Days and one-to-one career In 2011, TAFE SA purchased, through a Commonwealth guidance. TAFE SA continually promote pathways between government grant worth $745 000, a new range of mobile the education sectors and actively engage with higher mining equipment to equip TAFE SA with up-to-date education to create and facilitate pathways for exiting TAFE training tools for the mining and civil industries. The multi- SA students to ensure they take advantage of the purpose equipment included a Skid-Steer, Front-End Loader, articulation and credit arrangements with the Forklift and Back-Hoe made fully mobile with a truck. The university sector. equipment can be transported around the state to train The annual TAFE SA Open Day, held in August, provided wherever demand is. Collaborating with regional schools, prospective students with the opportunity to obtain the mining equipment is able to be used by eligible school information on courses and speak with lecturers. This year students at Trade Training Centres. the Open Day coincided with Tertiary Week, with the three TAFE SA also had a long-term partnership with the Young South Australian universities also conducting open Men’s Christian Association (YMCA) and in 2011 they invited day activities. TAFE SA Workplace Education Services to help deliver the In Semester 2, 2011, a range of VET Tasters was purchased first accredited training component of the South Australian by the Department of Education and Child Development Youth Parliament Program since the first program was held (DECD) with funding received from the Commonwealth in the Legislative Council in 1995. Participants gained Department of Education, Employment and Workplace valuable TAFE SA training in public speaking, Bill Relations (DEEWR) Partnership Broker Eyre Futures. development and parliamentary process and etiquette. The TAFE SA, in using a mix of face-to-face and online accredited training in two units of competency ‘Work methodology, was able to offer training in Conservation Effectively with Others’ and ‘Communicate in the and Land Management, and Community Services and Workplace’ enabled participants to complete SACE Health. Negotiations are still underway to provide training components. TAFE SA received excellent feedback from for some school-based trainers. YMCA for its responsiveness and flexibility within a very tight timeline to participate in the program. The Riverland Trade Training Centre, which opened on 17 November 2011, was conceived by a consortium of the Learner Support Services (LSS), being trialled by TAFE SA four Riverland schools: Glossop, Waikerie, Renmark and lecturers as part of Skills for All, aims to address students in Loxton. The consortium chose TAFE SA as a partner and vocational programs who are at risk of non-completion and allocated $4 million to the acquisition of new equipment who are experiencing significant barriers that impact on and refurbishment of the existing Manufacturing, their learning. The service provides students with the Engineering and Transport workshop at Berri. The funds will necessary support to be successful in their studies and links enable the delivery of full Certificate III qualifications in them with relevant agencies (where necessary) to address Engineering, Electrical and Automotive trades, enabling personal issues that may be providing a barrier to learning. apprentices to complete their trades locally. The ultimate These services may include an assessment of requirements, result: a smoother transition from school to school-based personal support, advocacy within and external to TAFE SA, apprenticeship to full apprenticeship without any travel learning case management, study skills support, career costs to the city for training. planning/guidance, work placements and transition support. Schools across the APY Lands have embraced the opportunity to access and incorporate VET in their curriculum offerings. VET is offered in a range of ways on the APY Lands including: delivery by the school under a VET in Schools Agreement arrangement with TAFE SA, offered Page 45
  • 46.
    TAFE SA hasalso implemented a cutting-edge Applied Blokes-On-The-Block – Playford Alive Program Learning Model as a collaborative approach between This 13-week program targeted at long-term unemployed program lecturers and Language, Literacy and Numeracy men is designed to focus on the developmental needs of lecturers. The model provides targeted language, literacy the individuals. Participants designed, planned and created and numeracy services to students with specific learning a sustainable garden in the front yard of a Housing SA needs. This model has meant that often two lecturers are property in the Playford Alive development. This initiative working with a group of students simultaneously, providing served as a tool for engaging the local community to learn students with technical training expertise as well as practice about sustainable gardening practices for potential and positive learning support. Success of the model is implementation in their own residences. Literacy and evidenced by an increase in completion rates. numeracy support for all participants was provided by TAFE SA is working closely with a number of key TAFE SA and specialist lecturers were brought in for the stakeholders in the northern Adelaide region, including the gardening and landscaping components. City of Playford, the Land Management Corporation, the Northern Connections Office and DFEEST, through South Indigenous Horse Skill Training Australia Works in the Regions, to look at training opportunities for targeted groups in a number of areas. This pilot program offered by TAFE SA’s Horse Skill Centre, in These target groups include young people who are out of partnership with the RDA Murraylands and Riverland Board, school and not participating in learning, training and Aboriginal Access Centre and the Murray Bridge Racing employment; mature aged people; Aboriginal people; Club, delivered successful outcomes with all students people with a disability; women; migrants and refugees. completing their Certificate I in Racing. Participants were provided with pastoral care mentors, along with practical components delivered at the Murray Bridge Racing Club. Woolworth’s Pre-employment Program Woolworths contracted DFEEST and TAFE SA to establish a pre-employment program for new supermarkets opened in the northern suburbs. This program commenced in May 2011 with 40 participants and an expected 20 employment opportunities. The program is also supported by DEEWR and is an excellent example of local networks collaborating to provide a positive outcome for the community. Powerful Pathways for Women Established to provide female job seekers from the northern Adelaide region with opportunities to gain a suite of qualifications, this program offered a potential pathway to employment through the 2011 ETSA apprenticeship intake. Further educational pathways were also planned as a key target for the program. Participants undertook the Certificate I in Electro-technology, Certificate I in Information Technology and Certificate II in Women’s Education. Page 46
  • 47.
    OUR PERFORMANCE TAFE SAalso developed and maintained relationships with: During 2011, a number of initiatives were implemented to provide support for students with disabilities, including: - Interwork Ltd, Woolworths, South Australia Works, Northern Futures and the Wyatt Benevolent - an AC Arts Dance lecturer was placed with the Institution to deliver a retail pre-employment Restless Dance Company. This lecturer program targeted at people with disabilities in choreographed a series of performances northern Adelaide accompanied by several Bachelor of Performing Arts dance students; one of the performances held - The Migrant Resource Centre, with 35 PPP was nominated to tour Papua New Guinea in 2012 participants completing the Certificate II in Retail - a film and television lecturer delivered the - The Adelaide Women’s Prison with 10 PPP Certificate II in Media to two highly successful participants completing the Certificate II in Retail disabled students - The Lyell McEwin Health Service by membership of - an AC Arts Acting lecturer provided work the Aboriginal Cadetship Reference Group; with placement opportunities for disabled persons the first Indigenous student from this program wanting to observe acting voice and speech classes graduating in September 2011. and rehearsal sessions. TAFE SA Community Services and Health had a partnership A further example of improving access and equity outcomes with the Reynella Neighbourhood Centre to deliver the is a program to train Aboriginal nurses on the Eyre Certificate III Community Services Work for 15 volunteers at Peninsula. This project, a partnership between TAFE SA, the the centre. The delivery was a partnership of TAFE SA Aboriginal Access Centre, state and Commonwealth lecturers and centre staff, qualified as assessors. All governments, the Regional Health Services and job service volunteers completed their qualification with several providers, not only increases the number of Aboriginal transitioning to continue their studies in Certificate IV health professionals within the community, but also Community Services and some gaining entry to university to provides invaluable role models to assist in improving the study social work. overall health of Aboriginal people in the region. TAFE SA Community Services and Health also had an TAFE SA has provided English language services to migrants Auspice Agreement with the Hackham West Community under the Adult Migrant English Program with the Centre to deliver the Certificate III Children’s Services for Commonwealth Department of Immigration and Citizenship 15 volunteers at the crèche at the centre. Course delivery (DIC) since 2003. In July 2011, TAFE SA was advised they was a partnership of TAFE SA lecturers and centre staff, were successful in being the only provider to offer this qualified as assessors. All volunteers have completed training for migrants under a new contract until 2014. their qualification. TAFE SA partnered with ZeroWaste SA to develop a TAFE SA has delivered ‘Apply First Aid’ to students learning teaching resource for non-English speaking people called English as a Second Language since 2004 and now has a ‘Recycle Right’. An increased number of residents have partnership with the Australian Red Cross to deliver the come from countries where recycling simply does not exist training, through gaining accreditation for some lecturing or where they may not have bins. Recycle Right helps to staff as Red Cross trainers. More than 500 students from improve householders’ knowledge of what can and cannot many nationalities have gained a certificate in First Aid. The be placed into the kerbside recycling and green organics course has provided pathways to employment and further bins and the correct preparation of items before they are study as well as enabling students to assist their ethnic placed in the recycling bin. TAFE SA was involved in piloting communities and ensure the safety of their families. the materials with nine classes of students learning English as a second language. During 2011, the TAFE SA Apprentice Kickstart Pre-Apprenticeship project saw 75 disadvantaged people TAFE SA and the Australian Football League (AFL) charity work towards a mechanical and engineering organisation, Ladder, are collaborating to provide training in trade apprenticeship. cookery and hospitality to formerly homeless youths, which will enable them to source employment opportunities in the AC Arts supported and encouraged TAFE SA Arts lecturers industry. Participants undertake training at TAFE SA in to broaden their connection with the disability community. hospitality and basic cookery and also gain work placements at Adelaide’s leading hotels and restaurants. Students receive mentoring from past and present AFL players and elite female athletes as part of the program. The students will gain training in the Certificate II in Hospitality and basic cookery level, which links into the skill shortages in the hospitality industry in kitchen and food services areas. Page 47
  • 48.
    TAFE SA 2010Statistics 1 Figure 9: TAFE SA Students by Major Course Field of Education 1 Please note that 2011 data had not yet been finalised at time of the report being prepared Page 48
  • 49.
    OUR PERFORMANCE Figure 10:TAFESA Students by Age Group Figure 11: TAFE SA Students by Australian Qualifications Framework Level Page 49
  • 50.
    3.4 Building World-ClassInfrastructure DFEEST Strategic Plan Goals 4 and 6 The vocational training needs of South Australians are The development will also see the Business Services and changing over time as a result of changes in the economy Health and Community Services programs (at both the and community. Accordingly, there is a need for changes Panorama and Adelaide City campuses in 2011) to TAFE SA program delivery to ensure that training consolidate at the Adelaide City campus in the heart of the demand is matched with supply. central business district, ultimately creating a centre for excellence in Business Services. In addition to improved There are also changes to the VET system underway with accessibility, students who currently study business at the Skills for All that will mean that more funds will be made ageing and inefficient Panorama campus will reap the contestable with an increased level of competition for benefits of studying in a modern facility that will enhance publicly funded training. their learning experience. The contemporary design of the new learning spaces at the Adelaide City campus will Consequently, the department, together with TAFE SA, provide student facilities that are modern, comfortable and must adapt and respond to these changes, which require incorporate the latest technology. program consolidation and infrastructure development. International Student Services, who currently do not have a To ensure that the state’s training infrastructure is up to presence on the ground floor, will be relocated in a date, since 2008 the South Australian government (in refurbished area that meets the specific needs of the combination with Commonwealth funds) has made the workgroup in an easily accessible location. single biggest investment ever in TAFE SA, committing more than $200 million to upgrades and new facilities. The focus for these infrastructure investments is to ensure RIVERLAND TRADE TRAINING CENTRE TAFE SA can meet changing demand and compete in the The Berri TAFE SA campus recently opened its Trade new vocational training system, including: Training Centre. This is part of the Riverland Trade Training - developing centres of excellence for specific Centre, a consortium of the four Riverland Schools, industries to include access to the most up-to-date Waikerie, Renmark, Loxton and Glossop, in partnership equipment and industry specialists all in the one with TAFE SA. location. Examples include industries such as Building at Tonsley Park and Hospitality at Regency The upgrade of the TAFE SA Berri Campus workshop will give full apprenticeship opportunities in Automotive, - improving local and regional campuses to provide Fitting/Machining, Fabrication Welding and Electrical, all ready access for students and to provide a focus now offered locally reducing the need to travel to Adelaide for training and advice for the community. This for training. A state-of-the-art renewable energy centre, includes having the information and resources with solar and wind power training, is also a feature. necessary to assist new and continuing students as well as acting as assessment and referral The facilities will herald a new era in cooperation between centres. the four Riverland High Schools, TAFE SA Regional and other training providers that promises to bring considerable benefits to school students and local industry in the Riverland. ADELAIDE CITY An example is the new development at the Adelaide City campus in existing under-utilised space that offers a ‘shop front’ service to students. This incorporated the creation of a new Client Services area providing a shopfront at the Currie Street entrance for current and prospective students to obtain career path and course information, vocational preparation, and recognition of prior learning advice as well as being able to enrol in TAFE SA. Page 50
  • 51.
    OUR PERFORMANCE INDUSTRY ANDINDIGENOUS SKILLS CENTRE PROGRAM SUSTAINABLE INDUSTRIES EDUCATION CENTRE (SIEC) DFEEST helped applicants in South Australia to secure A further response to ageing TAFE SA infrastructure $1.5 million funding in 2011 through the Commonwealth involved $125 million provided by the South Australian Industry and Indigenous Skills Centre (IISC) program government to establish the Sustainable Industries (formerly known as the National Training Infrastructure Education Centre (SIEC) at the 58-hectare Tonsley Park Program). The program consists of two streams: (i) Industry Redevelopment site. Skills Centres; and (ii) VET Infrastructure for Indigenous People. The project encompasses three key elements: 1. Consolidation of metropolitan Building and The Commonwealth government, through DEEWR, Construction training delivery at the Tonsley Park competitively funded the program on a financial year basis Redevelopment site to the value of $11 million, with a matching industry 2. Divestment of campuses at Panorama, O’Halloran contribution for successful IISC applicants. Hill, and Marleston The primary purpose of the program is to fund the 3. Consolidation of non-Building and Construction building, refurbishing and expansion of VET training programs from divested campuses at other facilities, including the purchase of mobile and simulation metropolitan campuses. equipment to deliver accredited VET that directly leads to and supports the development of state-identified industry SIEC will consolidate Building and Construction programs and community VET skills requirements. from five metropolitan campuses into a single delivery point, incorporating shared learning and support spaces The projects approved this year were the Construction with universities and industry partners. This is the first time a Industry Training Centre, Kalka and Career tripartite approach has been taken for a TAFE SA facility in Employment Group. South Australia, and possibly Australia. The SIEC is on schedule for training delivery to commence at Tonsley Park from early 2014. Its purpose is to improve MOUNT GAMBIER sustainability research and design through linkages between our universities, education and training services, DFEEST and TAFE SA opened the Solar and Domestic and the Building and Construction industry that relies on Wind Turbine Installation and Grid Connect Training both sectors. SIEC will transform training in the building, Centre at Mount Gambier in August 2011. This training construction and water industries and open the way to facility was established in response to local industry incorporating more sustainable products, processes and demand and TAFE SA’s commitment to environmental technology into future building projects. sustainability. The centre offers facilities for electrical contractors wanting to gain the necessary training to install The facility layout and infrastructure, both essential solar panels and domestic wind turbines. The training site components of the learning framework, will be used to allows for the installation of solar systems on a range of maximise opportunities for: roof types, and incorporates three domestic wind turbines - cross-curriculum collaboration and multi-skilling which suit a range of applications in regional South Australia. Regional students in building and construction - thematic interdisciplinary approaches to complex and pre-vocational electrical students were heavily involved problem solving in the production of the training centre. - the use of ICT to support innovative approaches to teaching and learning. The innovative educational vision of SIEC requires an appropriate infrastructure, one that will essentially reshape the delivery of education and training to the Building and Construction industries in the state. In this new model: - co-located programs will maximise synergy and opportunities for innovation between trades - new partnerships and advisory arrangements will ensure industries and enterprises have input into SIEC’s management and are able to provide advice on training and workforce development needs Page 51
  • 52.
    - high-speed fibre network will provide an IT-rich VICTOR HARBOR TAFE SA CAMPUS environment which will support: The new Victor Harbor TAFE SA Campus, officially opened - increased accessibility in March 2011, provides a hub for around 550 students in - links to a network of existing courses including enrolled nursing, aged care, disability services, business administration, hospitality and community educational providers services work. The position of the campus adjacent to the - extensive e-learning resources, thus Victor Harbor High School, Victor Harbor Council Library promoting autonomy and and Encounter Centre enhances the existing self-directed learning educational precinct. - there will be space for industry to demonstrate new products and services and deliver The state-of-the-art facilities include sustainable design as a sustainability related training programs centrepiece of the construction methodology. The campus includes energy efficient innovations such as an extensive - industry’s onsite presence will facilitate stronger use of solar panels and energy efficient lighting and has a TAFE SA/enterprise connections and enhance strong emphasis on water conservation. It was no surprise trainer understanding of enterprise needs that the Victor Harbor TAFE SA campus was awarded the - flexible design principles will allow areas to be Civic Trust Award - Urban category in November 2011. reconfigured as teaching and learning needs change. The SIEC is not simply a building in which learning occurs; it is an educational tool designed to demonstrate clean technologies and to inspire and intrigue those who observe its inner workings. The core of the building will be transparent, enabling learners (and visitors) to watch the intricacies of the pipe and electrical infrastructure. Learners will be able to physically interact with their surroundings by intervening in its operation and monitoring the impact of their actions on building performance. Key features of the design of this world-class facility include: - demonstrator elements - spatial efficiency / shared spaces - minimised recurrent costs. Page 52
  • 53.
    OUR PERFORMANCE The Victor Harbor TAFE SA campus was awarded the Australian Civic Trust Award – Urban Category in November 2011. Page 53
  • 54.
    3.5 Digital Economyand Technology DFEEST Strategic Plan Goal 5 A range of ICT-related projects were completed in 2011 Priorities for 2012 with the following achievements: Priorities relating to digital economy and technology align - Premier’s Award in the category of Growing with the primary drivers of the Information Economy Prosperity: AdamMax – Shining the Light on Agenda 2009-2014, the ‘3Cs’ (Connectivity, Capability and Broadband Blackspots Content). They contribute to the achievement of a number of SASP targets and address recommendations of the - Premier’s Award in the category of Expanding report by 2009 Thinker in Residence, Dr Genevieve Bell, Opportunity: Remote Indigenous Public Access entitled ‘Getting Connected, Staying Connected: Exploring Project – Oodnadatta South Australia’s Digital Futures’. The Digital Economy - AdamMax: Completion of the AdamMax Project priorities acknowledge and complement the department’s providing fixed wireless broadband access to wide focus on productivity and participation in blackspot areas in metropolitan Adelaide employment and training as set out in the Skills for All - Mid North Broadband Project: Providing strategy. broadband access to the Mid North of South Australia with a fixed wireless solution The priorities have been developed in the context of the new SASP 2011 targets: - The gap between South Australian broadband usage and the national average was reduced to - Target 57: Broadband Access – the proportion of one percentage point South Australian premises with access to broadband services delivered by fibre technology - Successful completion of Mobile Enterprise meets the national average by 2020 Growth Alliance (MEGA) 2011 Digital Entrepreneurship Program - Target 58: Online Business – Increase the proportion of businesses that receive orders online - Successful trials of the ForwardIT website and from 24 percent to 40 percent and continue High Speed Broadband eBusiness Program growth each year to 2020. in Willunga - Release of the Willunga pre-NBN Baseline Study Report - Development of a Digital Economy Strategy for Northern Adelaide Region Councils (Playford, Salisbury and Tea Tree Gully). The National Broadband Network was successfully ‘switched on’ in Willunga. Page 54
  • 55.
    OUR PERFORMANCE ENSURING EVERYSOUTH AUSTRALIAN HAS ACCESS TO PROMOTING DIGITAL LITERACY AS FOUNDATION SKILLS BROADBAND FOR ALL SOUTH AUSTRALIANS The South Australian government recognises that The South Australian government recognises that whilst broadband is the ‘utility’ of the 21st century and that all digital connectivity is important, it alone is not sufficient to South Australians are entitled to broadband connectivity. create a vibrant economy and an engaged community. DFEEST is committed to maximising the benefits of the The future prosperity of South Australia, and the wellbeing NBN rollout scheduled to take place over the next nine of its citizens, is predicated on having a broader-based years, with a particular emphasis on achieving the highest knowledge-driven economy with a better educated and possible extent of fibre, and recognising the particular trained workforce and, a competent and confident society challenge of optimising broadband quality and speed in in the skills that are demanded by the global digital regional areas. It will do this by working collaboratively with economy. This has been recognised in the South Australian the Commonwealth government, local governments and government’s Skills for All reforms for South Australia. RDA, NBN Co, industry and communities. There are two key areas that need to be addressed. In 2012, DFEEST will: These are: - develop a whole-of-state Position Statement on - creating trust and confidence so that South broadband and the NBN Australians can maximise their interaction with the online world and unlock the true economic and - conduct an Economic Impact Study; making the social value of online engagement case for fibre or best possible technology deployment in regional areas of economic and - improving the digital literacy of all citizens. social significance In early 2012, DFEEST will work with the VET sector on skills - provide an appropriate whole-of-government for the digital economy and with Skilled Workforce response to the Commonwealth government’s Advisors on the use of ICT for productivity. DFEEST will also Convergence Review which examines policy and develop the digital literacy skills content and methodology regulatory frameworks that apply to the for the Industry/Enterprises sector. converged media and communications landscape in Australia. In 2010-11, the difference that historically existed between the national and South Australian use of broadband, for internet-connected households, was reduced to just one percentage point. This result represents a highly positive change from the longstanding situation of the state’s usage being approximately ten percentage points below the national average. Figure 12: Broadband use in householdsHouseholds Broadband Use in 100% 91% 92% 90% 86% 81% Broadband as % of Connections 80% 78% 68% 68% 70% 60% 57% 50% 47% SA 40% Aust 36% 28% 30% 19% 20% 10% 0% ABS 2004-2005 ABS 2005-2006 ABS 2006-2007 ABS 2007-2008 ABS 2008-2009 ABS 2010-2011 Source: ABS Cat No 8146.0 Page 55
  • 56.
    BUILDING A DIGITALECONOMY POWERED BY DEVELOPING BEST PRACTICE AND MODELS FOR INNOVATION AND ICT LOCALISED DIGITAL ECONOMIES The South Australian government recognises that ICT plays DFEEST recognises the need to engage with regional a central role in driving economic productivity and global authorities, key industry users and promoters of ICT services competitiveness of all South Australian industries and that as well as business and community users to develop the ICT industry in particular can contribute much to ‘flagship’ examples of flourishing localised digital economies achieving these objectives. DFEEST will work in partnership for others to emulate. In 2012, DFEEST will partner with the with the ICT industry to foster the innovative application of Australian Information Industries Association to leverage new technologies in the sectors that are driving our state’s National Digital Economy Strategy funding (Digital Hubs & economy. In 2012, DFEEST will conduct an Adelaide Enterprises). Wireless Network feasibility study, partner with the Australian Information Industries Association (AIIA) to run DFEEST continues to assist councils to become NBN ready. the ‘Seeding ICT Innovation’ Forum and work with key An example is the development of a Digital Economy South Australian industry sectors to identify digital economy Strategy for the Northern Adelaide Region in partnership opportunities within the sector. with Playford, Salisbury and Tea Tree Gully councils. The document will provide a template for similar strategies for other South Australian councils. BUILDING HIGHER ORDER SKILLS CAPABILITY AND SMART CONTENT TO UNDERPIN THE STATE’S DIGITAL ECONOMY POSITIONING SOUTH AUSTRALIA TO TAKE ADVANTAGE The South Australian government recognises the need to OF OTHER INITIATIVES work with and through industry, businesses and other stakeholders to develop programs to support skilling DFEEST recognises that its actions alone are not sufficient to through training for both enterprises and individuals to drive achieve the above outcomes and collaboration is essential. economic productivity. E-business programs continue to We are committed to working with the community, industry explore opportunities for South Australian businesses to and all levels of government to implement a number of access high-end technology skills and basic digital literacy digital economy initiatives that create valuable opportunities skills to enhance opportunities for business and industry. for South Australia. In 2012, DFEEST will coordinate ‘Green IT’ activities with the AII Sustainability taskforce in MEGA, a workshop program designed, presented and collaboration with Technology Industry Association’s Green mentored by industry to develop skills and knowledge in Task Force, participate in and provide input into National digital content and applications was run in 2011 with Digital Economy working groups, provide South Australian 22 participants pitching seven new concepts for digital government representation and input on the products or services. Commonwealth government’s Senior Officials Working Group on Digital Productivity and provide input to the Commonwealth and State Regional Taskforce on digital economy issues and opportunities. Page 56
  • 57.
    OUR PERFORMANCE 3.6 AFocus on Quality DFEEST Strategic Plan Goals 4 and 7 REGULATION Throughout 2011, the delivery of higher education (other Non self-accrediting institutions than that provided by the state universities), VET, and Over the last two decades, non self-accrediting higher educational services to overseas students was regulated education institutions (NSAIs) have become an integral under the Training and Skills Development Act 2008 (the part of the higher education sector in South Australia. The Act). The Act provides the basis for ensuring that sector offers diversity and contributes to the state’s education and training providers, and the courses they objective of increasing the number of international deliver, are quality assured under national education and students in South Australia, as well as the national training standards. Data on regulatory activity across these objective of increasing the number of individuals with a three sectors is presented in tables 1-5 starting on page 76. higher education qualification. The sector comprises approximately 30 NSAIs registered in South Australia or The department manages the registration of education operating in the state under mutual recognition provisions. and training providers under Part 3 of the Act through a These include: two overseas universities - Carnegie Mellon delegation from the TaSC. The assessment of applications University and University College London; TAFE SA; and for registration and the monitoring of compliance with three self-accrediting institutions - Australian College of standards are managed by the department with the Theology, Australian Film Television and Radio School and engagement of personnel from industry, occupational Melbourne College of Divinity. licensing bodies, the three state universities and other stakeholders as required. In 2011, the department undertook a comparative analysis of course offerings and student enrolment data collected from South Australian NSAIs in 2008-2010. The results of the study were reported to the Higher Education Transition to national regulation Registration and Accreditation Board and the TaSC to On 1 July 2011 the Commonwealth Vocational Education inform them on NSAI’s performance. and Training (VET) Regulator Act 2011 came into effect and ASQA commenced operations. To allow ASQA jurisdictional operation in South Australia, the South Australian government was required to refer its previous VET registration and compliance monitoring and regulatory powers to the Commonwealth. This was done assessment through the Vocational Education and Training The number of registered providers in the domestic VET (Commonwealth Powers) Bill 2011 (the Bill) which was sector fell from 324 in 2010 to 308 in 2011. This came introduced into State Parliament late in 2011. The Bill, about through a 23 percent reduction in the number of transferring all regulatory activity to ASQA, is due for approvals from the previous calendar year and the transfer completion by April 2012. of seven providers to the ASQA because their principal place of business was not in South Australia. Twenty three The year 2011 was also the final year of the state’s role in providers withdrew their registration to deliver to regulating higher education (other than universities which domestic students and three providers had their are self-accrediting). From 2012, regulating higher registration cancelled. education will be undertaken by the national regulatory body, TEQSA, which was also established in July 2011 At the beginning of the year, 11 providers had their following passage of the Commonwealth’s Tertiary registration under the Act managed by the National Audit Education Quality Standard Agency Act. and Registration Agency through delegated authority from the TaSC. The closure of this agency, following the establishment and commencement of operations of ASQA in a number of states and territories, resulted in responsibility for the management of these registered providers being transferred back to the department on 1 July 2011. Page 57
  • 58.
    There was asmall reduction in the total number of The department receives and investigates complaints made providers registered to deliver training to overseas students about registered providers operating in South Australia. As from 71 to 68. Two applications for initial registration to at 1 January 2011 the department had a total of 37 deliver training to overseas students were approved; one complaints open. A further 22 written complaints were was refused. Two providers had their registration cancelled received during the year. These complaints were and three providers voluntarily withdrew their registration. investigated by the department to determine whether the registered provider was operating in compliance with the The department maintained a targeted program of Training and Skills Development Act 2008 and its monitoring audits to ensure that providers were operating conditions of registration. Four of these complaints were in compliance with all regulatory requirements. In a referred to other registering bodies interstate for further number of cases, joint audits were conducted with DIC investigation. As at 31 December 2011 the department and DEEWR. had closed 45 of these complaints. Page 58
  • 59.
    OUR PERFORMANCE RECOGNITION DATA Table 1 : VET REGISTRATION 2009 2010 2011 Summary Total Registered Training Organisations (RTOs) registered in SA for domestic delivery 327 324a 308 RTOs also delivering Higher Education courses 16 15 13 RTOs with delegated powers b 3 3 3 Approvals Initial registration 40 22 17 Renewal of registration 41 24 31 Extension to scope of registration 146 157 162 TOTAL 227 203 210 Qualifications added to TAFE SA scope of registration under delegation 203 272 188 Refusals, Cancellations and Suspensions RTOs who expired or voluntarily withdrew registration 17 22 23 RTOs who transferred to another registering body 0 0 7 RTOs who had registration cancelled by registration authority 0 3 3 RTOs who had registration suspended by registration authority 0 0 0 RTOs who had registration refused by registration authority:  Initial registration 4 3 4  Extension to scope of registration 2 1 7  Renewal of registration 0 0 0 Audit Activity: Number of audits conducted Initial registration 43 27 17 Renewal of registration 39 21 23 Extension to scope of registration 58 66 43 Monitoring 28 40 61 TOTAL 168 154 144 a Total figure inclusive of eleven RTOs that had their auditing and registration managed by National Audit and Registration Agency. These RTOs were transferred back to SA in 2011 in preparation for transfer to the new national regulator Australian Skills Quality Authority b The three TAFE SA institutes have delegated powers to vary scope of registration and to accredit Crown copyright courses. Page 59
  • 60.
    Table 2 :VET ACCREDITATION 2009 2010 2011 Summary Total accredited courses 174 122 126 Approvals Courses accredited 15 5 14 Courses accredited (TAFE SA under delegated authority) 6 8 10 Training package qualifications endorsed nationally 204 150 290 New qualifications made available through traineeships or apprenticeships in 82 139 110 South Australia Table 3 : HIGHER EDUCATION REGISTRATION 2009 2010 2011 Summary Higher education providers registered in SA for domestic delivery 32 32 30 Higher education providers who also deliver VET courses 16 15 13 Approvals Initial registration 2 2 1 Variation to scope of registration 12 9 11 Refusals, Revocations and Withdrawals Higher education providers who voluntarily withdrew registration 2 2 3 Higher education providers who had registration cancelled by registration 0 0 0 authority Higher education providers who had registration suspended by registration 0 0 0 authority Higher education providers who had registration refused by registration authority  Initial registration 0 0 1  Variation of registration 0 0 2  Renewal of registration 0 0 0 Table 4 : HIGHER EDUCATION ACCREDITATION 2009 2010 2011 Summary Total current accredited courses 332 342 352 Approvals Courses accredited 82 21 59 Page 60
  • 61.
    OUR PERFORMANCE Table 5: OVERSEAS RECOGNITION 2009 2010 2011 Summary Registered providers delivering only VET courses to overseas students 47 43 40 Registered providers delivering only higher education courses to overseas 11 10 12 students Registered providers delivering VET and higher education courses to 9 8 2 overseas students Registered providers delivering only English Language Intensive Courses 5 3 3 to Overseas Students (ELICOS) Registered providers delivering VET and higher education and ELICOS 3 5 6 Registered providers delivering ELICOS and VET courses to overseas 2 1 4 students Registered providers delivering ELICOS and higher education courses to 1 1 1 overseas students Total registered providers approved to deliver courses to overseas 78 71 68 students Approvals Initial registration 17 7 2 Renewal of registration 7 2 2 Extension to scope of registration 41 20 20 Refusals, Revocations and Withdrawals RTOs who voluntarily withdrew registration 0 11 3 RTOs who had registration cancelled by registration authority 0 3 2 RTOs who had registration suspended by registration authority 0 0 0 RTOs who had registration refused by registration authority:  Initial registration 1 3 1  Extension to scope of registration 1 0 1  Renewal of registration 0 0 1 Audit Activity: Number of audits conducted Initial registration 18 11 2 Renewal of registration 6 2 2 Extension to scope of registration 25 7 9 Monitoring 9 26 15 TOTAL 58 46 28 Page 61
  • 62.
    SUPPORTING QUALITY Building thecapability of the VET workforce was a major A number of new measures to support quality were focus for the department throughout 2011. The focus on introduced through revised Guidelines for Registered quality was driven in part through Skills for All, which Training Organisations approved by the Minister under the among other things aims to build the capacity of the VET Training and Skills Development Act 2008. These measures system to support the expansion of the market and to required Registered Training Organisations (RTOs) to, ensure its ongoing quality. Increasing the quality and amongst other things: capability of the VET systems was also a national focus in - apply to the TaSC for approval to deliver VET to 2011 through the release of a number of significant reports school students. Over 40 applications were such as the Productivity Commission’s Report; Skills assessed and approved by 1 January 2012 Australia’s Road Map to Prosperity; and L.H. Martin’s, Quality of the VET Workforce. A capability framework is - submit a Special Purpose Financial report based also being developed by the Innovation and Business Skills on financial data from certified accounts from the Australian Industry Skills Council for VET practitioners which previous two financial years. This report was will be underpinned by the recently endorsed Diploma of developed by an internationally recognised Vocational Education and Training. These qualifications accounting and risk management firm to assist the and frameworks provide a focus for continuing the department to assess the financial health of RTOs professional development in the sector. - appoint a suitably qualified and experienced person as an Accountable Officer to provide To support these initiatives, the department provides a educational leadership to its trainers and assessors. targeted professional development program for training providers that addresses contemporary education, training The department, in conjunction with TAFE SA, conducted and workforce development practice. This also includes a successful pilot of the Training Guarantee for SACE distribution of 11 editions of E-news to 1700 stakeholders. Students scheme for over 200 students. The scheme, which will commence fully in mid-2012, is designed to assist SACE In 2011, 15 contemporary VET practice workshops were students start on a relevant Certificate III pathway, which held involving 409 VET practitioners. An additional six they will finish with a Skills for All training provider after information sessions were held which focused on: Skills for completing their SACE studies. All; Training Guarantee for South Australian Certificate of Education (SACE) students; International Education Forum; and TEQSA transition. A total of 1192 people attended these sessions. Plans for 2012 Other events under the Capability Building Series included: Although, regulation of the VET sector will transfer to ASQA in 2012, the department will continue to drive - Building Capability Assessment program which excellence and quality in South Australia through ran several workshops and work-based projects Skills for All reforms. This will be achieved through - Building Foundation Skills for the Future, which procurement and contracting systems that have a strong included two Language, Literacy and Numeracy focus on quality as well as continuing to build the provider programs with 40 participants attending four capability of providers through targeted workshops professional development. - The New Directions in VET program which The department developed robust selection criteria and focussed on training organisations as businesses, assessment processes to assess applicants to be Skills for All provided RTOs with the opportunity to undertake providers. Once enrolments commence from 2 July 2012 a business health check. The program attracted the department will monitor the quality of services 19 RTOs as participants provided by Skills for All training providers through a range - Implementation sessions were facilitated for the of data including information exchanged with the national Diploma of Vocational Education and Training regulator. Where necessary, the department will conduct which involved four workshops attended by audits to confirm that providers are complying with their 14 people. contractual obligations. Page 62
  • 63.
    OUR PERFORMANCE TAFE SAAND QUALITY TAFE SA prides itself on being the number one provider of The process for TAFE SA admissions through the South quality VET in South Australia. TAFE SA plays a major role in Australian Tertiary Admissions Centre (SATAC) has providing a comprehensive range of courses and services continued to be refined during 2011 to provide a more to industry, the community and disadvantaged groups. streamlined service for prospective students and to assist TAFE SA in maximising the number of student offers. A The 2011 NCVER Student Outcomes Survey focused on significant improvement is the ability for programs to the students’ employment outcomes, benefits of training, remain open on the SATAC and TAFE SA websites, satisfaction and improved employment status in Australia. allowing applications and offers to be made to programs The publication reported on results from a national survey with vacancies all year round. In Semester 1, 2011, 16 198 of students who completed their VET during 2010. applications were made to TAFE SA courses, an increase of 5.75 percent from 2010. In Semester 2 2011, 9279 In 2011, a high number of South Australia’s VET graduates applications were made, an increase of 39.39 percent reported that they were satisfied with the overall quality of from 2010. their training, with: The Student Information System (SIS), a package of - 91.2 percent of government-funded TAFE SA software products that will provide modern and flexible graduates satisfied, the highest figure of all the web-based services to TAFE SA students and staff, was states and territories partially implemented in June 2011. 21 000 students - 77.5 percent of all TAFE SA graduates employed enrolled in Semester 2 2011, and work will continue in after training, an increase of 0.2 percentage points 2012 on the development and testing of the ‘system’. on the 2010 figure (77.3 percent) and above the Monitoring and recording details and student information national average of 77.1 percent for those with special needs will also be a useful feature of SIS. - 74.9 percent of government-funded TAFE SA graduates employed after training In 2011, the TAFE SA website continued to support the - of all TAFE SA graduates who were employed needs of students and business with traffic on the website after training in 2011, 78.5 percent reported that continuing to increase with 2.98 million visits to the site. their training was relevant to their current job and 72.8 percent reported at least one job-related As South Australia moves into a new contestable training benefit. These figures were above the national market, TAFE SA sees that maintaining a high-quality average of 77.0 percent and 72.7 percent training outcome is essential. Performance indicators respectively. around student satisfaction, employer satisfaction and module completions are critical for TAFE SA and will The NCVER also runs a survey of employers, namely the continue to be in 2012. Employers Use and Views of the Vocational Education and Training System. A figure of 91 percent of employers were satisfied with the quality of training delivered by TAFE SA to apprentices and trainees, and 94 percent were satisfied with the quality of nationally recognised training delivered by TAFE SA (NCVER 2011). Page 63
  • 64.
    3.7 Science andResearch DFEEST Strategic Plan Goal 5 Innovation underpins South Australia’s productivity and SOUTH AUSTRALIA’S CHIEF SCIENTIST business competitiveness and the state’s capacity to respond Adjunct Professor Don Bursill was appointed Chief Scientist to a variety of environmental and social challenges. Equally for South Australia in April 2011, replacing Dr Ian Chessell as important, innovation contributes to the state’s social who held the position from March 2008 up to December wellbeing in terms of health, education and quality of life, 2010. resulting in a stronger community, economic prosperity and the delivery of better government services. Professor Bursill commenced his tenure with a round of discussions with the three South Australian universities to South Australia’s public expenditure on research and gain their views on the strategic development of the state’s development (R&D) as a proportion of Gross State Product research sector and how it can better engage with industry. (GSP) has continually risen from 1.04 percent in 2002-03 to He also established an Early Career Researcher Network in 1.18 percent in the 2008-09 Australian Bureau of Statistics conjunction with the Royal Institution of Australia. This (ABS) reporting period. This compares to an average network provides an opportunity for young researchers to national investment in R&D of 0.81 percent of GSP for discuss their own experiences and pass on their expertise to 2008-09. others and promote collaboration across research institutions. Expenditure by the Defence Science and Technology Organisation (DSTO) and the Commonwealth Scientific and Industrial Research Organisation (CSIRO) contributes to the State’s achievements in R&D. Figure 13: South Australian Public Expenditure on R&D, as a % of GSP 2002-2009 (including a comparison to average national investment in R&D) Page 64
  • 65.
    OUR PERFORMANCE PREMIER’S SCIENCEAND RESEARCH FUND SUPER SCIENCE FUNDING The Premier’s Science and Research Fund facilitates A sum of $3.8 million over four years (2010-11 to 2013- investment in key science and research areas that have a 2014) was allocated to support recipients who received demonstrable potential to generate significant and funding from the Commonwealth government’s Super sustainable economic, social and/ or environmental Science Fund. benefits for the state. These Super Science funding recipients included: An internal review of the Fund commenced in 2011, with an expected outcome to be a re-launch of the Fund with - Ian Wark Research Institute (University of South new investment categories. The South Australian Research Australia) and Flinders University for the purchase Fellowships, outlined below, will be retained as a leading and operation of nano-tomography computer investment strategy in order to expand the state’s equipment as part of the South Australian node of research talent. the Australian National Fabrication Facility In 2011, the Fund awarded $1.1 million to the South - Institute for Photonics and Advanced Sensing Australian Research and Development Institute for the (University of Adelaide) for optical fibre research Macroalgal Aquaculture project. This project assists with the equipment that will aid the development of the next development of the culture of two taxa of macroalgae with generation of sensors that have a wide range of market potential in optimised production systems at a proof applications such as non-invasive monitoring of -of-concept scale utilising nutrient-enriched waste water embryos and devices to remotely identify corrosion streams. in aircraft - Australian Wine Research Institute to enhance their metabolomics research services to support RESEARCH FELLOWSHIPS AND SCHOLARSHIPS bioscience research across a range of fields, Funding for three new Fellowships was provided in 2011 including enabling wine producers to have greater in the areas of clean technology, minerals processing and control over wine quality and characteristics experimental physics. These positions are part-funded by the state government for three years with matching - Adelaide Proteomics Centre (University of Adelaide funding provided by the universities. and SA Pathology) is investing to enhance their analytical capabilities to support research into the Professional Development Scholarships for Women, valued fight against diseases such as cancer and the at $15 000 each, were also awarded to six outstanding development of therapeutics to treat these diseases. early to mid-career researchers working in science, technology, engineering and mathematics. The scholarships are used to help build and extend the recipients’ research profile via exposure to the national and international research community. Page 65
  • 66.
    SCIENCE EXCELLENCE AWARDS CO-OPERATIVE RESEARCH CENTRES (CRCs) Since 2005, the South Australian Science Excellence DFEEST currently provides $1.2 million annually to 12 Co- Awards (the Awards) have recognised and rewarded operative Research Centres (CRCs) to support the excellence in science and acknowledged commitment and involvement of state government agencies in these skill in raising public awareness of science. Award national centres. In 2011, the Commonwealth government categories had been modestly amended over the years to provided $148 million for six CRC applicants, two of which recognise the teaching of science and school, tertiary and DFEEST is supporting through the state government’s community levels, and highlight collaboration CRC Assistance Program. with industry. These CRCs are: After an internal review in early 2011, the Awards were - Automotive Australia 2020 CRC (previously Auto renewed to not only maintain the prestige of the Awards, CRC), which received $26 million to position but to bring far greater attention to emerging scientists and Australia as a leading international manufacturer researchers, particularly PhDs and early career STEM and technology provider for low-emission professionals in local employment; and to support the transport solutions. The South Australian node is quality of STEM teaching at school and tertiary levels. based at the University of South Australia. In November 2011, Awards were presented to 10 - CRC for Low Carbon Living received $28 million researchers and educators, with joint winners in the and will provide government and industry with category of Early Career STEM Educator. Other Award social, technological and policy tools to overcome categories included: identified market barriers preventing adoption of cost-effective low carbon products and services, - Scientist of the Year while maintaining industry competitiveness and - PhD Research Excellence – Health improving quality of life. The South Australian and Medical Sciences node, based at the University of South Australia, will link with the state government’s Integrated - PhD Research Excellence – Life Design Commission. or Environmental Sciences - PhD Research Excellence – Physical Sciences/ Mathematics/Engineering - Early Career STEM Professional - Early Career STEM Educator – Tertiary. In 2011, an evaluation of the renewed Awards deemed them to be a success. Knowledge gained through the feedback and experience highlighted further improvements could to be made with the timing of the Awards in 2012. Page 66
  • 67.
  • 68.
    3.8 Tertiary Education DFEESTStrategic Plan Goals 4 and 7 In addition to its regulatory role, the department provides important policy and program support to ensure sustainable growth in the state’s tertiary education system, especially in areas of strategic importance to the state. A key consideration is the number and types of linkages across the education and training system, most notably in the area of school to post-school pathways. TAFE–UNIVERSITY CREDIT TRANSFER AND ARTICULATION SUPPORTING HIGHER EDUCATION POLICY PATHWAYS DEVELOPMENT AND IMPLEMENTATION Head Collaboration Agreements were signed between South Australia’s publicly funded universities play a crucial TAFE SA and Charles Darwin University, Flinders University, role in supporting and promoting the state’s economic and the University of Adelaide and the University of South social prosperity. The sector continues to operate in an Australia during 2011. These agreements are designed to increasingly deregulated and globalised market with local, strengthen established relationships between TAFE SA and national and international competition for students, staff each of the universities and to deliver increased and resources. collaborative educational offerings and pathways to South Australians. The last 12 months has been a period of intense consultation with the sector on a range of issues arising During 2011, TAFE SA registered 176 new specific credit from the creation of the TEQSA through to issues involving transfer and articulation agreements. The 563 agreements the implementation of the Commonwealth government’s promoted on the TAFE SA website, as at December 2011, reform agenda for higher education. The department’s cover both qualifications currently available for enrolment participation in these high-level discussions is ongoing and previous versions of qualifications where credit is still through the Ministerial Council for Tertiary Education and awarded by the university. Employment and its Senior Officials Committee. During 2011, 63 003 page views (up from 42 299 in 2010) The department also provides input to Commonwealth were recorded across credit transfer and articulation pages government reviews and inquiries, and in 2011 provided on the TAFE SA website. submissions to the following reviews: - Strategic Review of the Student Visa Program (the Knight Review) in consultation with Education Adelaide, the DECD (International Office), the NEW PRIVATE UNIVERSITY Office of the Training Advocate, Immigration SA and Multicultural SA. The Review’s terms of In October 2011, the South Australian government reference were developed with a view to approved an application from Laureate International enhancing the quality, integrity and Universities to establish a private university in Adelaide. competitiveness of the international education Torrens University Australia is only the third private sector, as well as strengthening the integrity of the university in Australia and is expected to deliver academic Student Visa Program programs to Australian and international students from 2013 onwards. - Commonwealth government’s Base Funding Review of Higher Education, which is investigating the principles that should underpin public investment in higher education - Review of Higher Education Access and Outcomes for Aboriginals and Torres Strait Islanders. Page 68
  • 69.
    OUR PERFORMANCE RESEARCH PROJECTS SCIENCE, TECHNOLOGY, ENGINEERING AND MATHEMATICS STRATEGY Several research projects were commissioned in 2011, two of which were facilitated through the ABS State In August 2011, the Minister for Science and Information Consultancy Fund. Economy launched ‘A Science, Technology, Engineering and Mathematics Skills Strategy for South Australia’ (STEM These research projects included: Skills Strategy). - an investigation into the participation of low socio- The need for STEM skills in our growing defence, mining, economic status students in tertiary education in bioscience, clean-tech, food production and other South Australia in response to national and state industries is outpacing the supply of skilled workers. For all targets. This project is due to be finalised early South Australians to reap the benefits of these high-value in 2012 emerging industries and the digital economy, it is critical - a feasibility investigation for South Australia that we all work together to attract and develop a meeting the Commonwealth government target workforce with stronger skills in the STEM occupations. of 40 percent of 25 to 34 year olds having a completed bachelor degree or higher by 2025. Addressing these demands requires concerted and focused Copies of the report have been provided to action, and this is the aim of the STEM Skills Strategy. The each university strategy establishes: - meeting with university representatives to identify - policy and program priorities for government ongoing work and opportunities for collaboration investment in STEM in achievement of state and national targets - an Executive Reference Group chaired by - a further research project initiated in 2011 which is Raymond Spencer, Chair of the Economic investigating the number of female school and Development Board and including executives from tertiary graduates with STEM qualifications in South relevant government departments Australia and their participation in related STEM - a Cabinet Taskforce that includes Ministers occupations. The purpose of this project is to: responsible for Science and Information Economy, - obtain a current South Australian profile of Education, Trade, Defence Industries, Mineral female participation and retention rates in Resources, and Employment, Higher Education STEM fields of education at both the senior and Skills. secondary schooling and university levels of education The STEM Skills Strategy also outlines the suite of government programs to improve skills in science and - investigate the transition patterns of female mathematics, including substantial investment in students with completed year 12 STEM school professional development and training for the state’s subjects into a university STEM bachelor teachers, a range of enhancement and enrichment qualification and from bachelor degree to activities for school students, and support for VET and STEM post-graduate study and into university students including scholarships. the workforce - establish a current profile of females working About 150 key industry representatives attended the STEM in STEM-related industries in South Australia. Skills Strategy launch, and workshops were held for providers of STEM enhancement and enrichment activities. A report on the project will be released during 2012. In addition to the launch in 2011, DFEEST began the evaluation of new and existing STEM programs (e.g. community-based science awareness programs) against identified STEM Skills policy and program criteria. DFEEST officers also began meeting with South Australian universities to form closer collaborative ties with education providers. Page 69
  • 70.
    TAFE SA LEARNINGPATHWAYS In 2011, TAFE SA continued to work with South Australian There are three study pathway options for students: universities to identify and establish credit transfer - successful students will have guaranteed entry to a agreements that acknowledged the completion of relevant range of Flinders University courses and comparable studies at TAFE SA. At the end of 2011, international students could access 104 established credit - students can elect to undertake Diploma or pathways into degrees in most study areas including Advanced Diploma studies within TAFE SA and Agriculture and Biology, Art and Design, Building and thereby opt for direct entry to Flinders University Furnishing, Business and Marketing, Community and through successful completion of their studies at Health, Education and Languages, Electrical and Certificate IV or higher level Electronics, Engineering and Transport, Food and Wine, - students will be referred to TAFE SA courses suited Hair and Beauty, Hospitality and Tourism as well as to their capabilities and vocational aspirations. Information Technology. In order to assist in addressing major skills shortages in the A partnership arrangement developed between TAFE SA regional health sector, TAFE SA partnered with local and Flinders University will see greater accessibility to a industry, schools and the Department of Health to create university education for students who may have the regional ‘Pathways to Nursing’ program. Through this considered further study impossible. The special entry locally driven program, students not only complete their scheme gives TAFE SA students at Adelaide City and SACE, but gain valuable industry skills and qualifications, Noarlunga campuses the option to enrol mid-year in with 95 percent of graduating students securing Foundation Studies at Flinders University. This partnership employment as care workers in local organisations. The will strengthen study pathways for students to move from continued success of the program was recognised when it vocational education to higher education, giving TAFE SA was awarded the 2010 Coorong District Council Australia students the strategies and skills needed for success at Day Award for School Programs. university. Students will be enrolled with Flinders University and registered with DEEWR which will fund student fees An agreement between TAFE SA and the University of whilst staff from Flinders University and TAFE SA will Adelaide will give Aboriginal and Torres Strait Islander collaborate on the delivery. University mentored TAFE SA students pathways to a university law degree. The lecturers will deliver 75 percent of the program on TAFE SA agreement will give students completing a Certificate IV in campuses with the final 25 percent of the program Legal Services entry into the Bachelor of Laws program at delivered by Flinders University Student Learning Centre the University from 2012 onwards. The new study staff at Flinders University. pathway, known as the ‘Aboriginal Law Program’ is the collaborative effort of TAFE SA, the Aboriginal Access Centre working with the Law Society of South Australia, the President of the Law Council of Australia, Allianz Insurance and the University of Adelaide. The Law Society of South Australia has also agreed to provide additional funding to support the Indigenous Law Studies project in 2012. Page 70
  • 71.
    OUR PERFORMANCE STUDENT SCHOLARSHIPS SENIOR SECONDARY TO POST-SCHOOL PATHWAYS - TRAINING GUARANTEE FOR SACE STUDENTS In 2011, the first round of the South Australian government Defence Scholarships was implemented, with 50 The Training Guarantee for SACE Students is a new scholarships of $5000 awarded to students undertaking a scheme which commenced in Semester 2, 2011. It enables defence-related honour degree or degree with honours at eligible senior secondary school students to commence a the University of Adelaide, Flinders University and the Certificate III completion pathway while still at school as an University of South Australia. integrated part of their senior secondary studies (SACE or equivalent). The scheme subsidises students to undertake The scholarships were designed to ensure long-term accredited training at an RTO in prescribed qualifications supply of quality skills and a vibrant workforce to meet the and guarantees them a place with that RTO to complete needs of the defence industry in South Australia. the qualification after secondary schooling is completed. While the number of awarded scholarships fell short of the A total of 201 students from 51 schools across the state 75 available, it is expected that the 2012 round will be participated in the scheme undertaking training at TAFE SA oversubscribed. across 40 different qualifications, ranging from construction and furniture making, community services and health, to We are also undertaking a detailed research project to tourism and hospitality. Approximately two-thirds were at track participation in STEM study and careers longitudinally. Certificate II level, and one-third at Certificate III level. The research includes data from the SACE Board, International Baccalaureate Organisation, SATAC, the There are two distinct phases in implementing the scheme. University of Adelaide, Flinders University and the University During Phase 1 (July 2011 – June 2012) TAFE SA is the of South Australia. principal provider and a small number of selected private RTOs will commence delivery during Semester 1, 2012. The project will provide a more comprehensive Phase 2 (i.e. from 1 July 2012), of the scheme will see full understanding of the patterns of female participation in implementation as part of Skills for All. STEM areas of learning and work, and the critical transition points between school and university student, and from university studies into the workplace. The research is designed to identify at which of these critical transition points women cease to participate in STEM study or work. Once completed, the research will be made publicly available. Page 71
  • 72.
    INTERNATIONAL EDUCATION International StudentEnrolment Trends Launch of the International Student Card As at November 2011, international student enrolments in In February 2011, the Minister launched the International South Australia had decreased by 8.9 percent compared to Student Card which is designed to provide international the same period in 2010. This decline is lower than the students with easy access to key contacts for the South national average which contracted by 9.4 percent based Australia Police, the Office of the Training Advocate and on national Australian Education International statistics, all Education Adelaide. education sectors inclusive. Based on the same set of Australian Education International figures, 31 190 international students studied in South Australia compared to 554 764 nationally, representing a market share of Health and Wellbeing of International Students 5.6 percent. The top three source countries remained in DFEEST has partnered with SA Health and Multicultural SA the same order as the previous year: China, India and to undertake a project through the Health in All Policies Malaysia. With the support of Education Adelaide, the initiative on the Health and Wellbeing of International department continued to promote South Australia as an Students. With a focus on international students from the international student destination despite challenges to the VET sector, the project’s priority has been to assess the market felt across Australia. health and wellbeing of international students, and their knowledge of and ability to access health services in South Australia. Student Roundtable The intended outcome is to identify the health and In 2011, the inaugural International Student Roundtable wellbeing needs of international students, the structures was established to provide a forum for discussing issues and services that are available to address these needs, and around international student education, safety, community opportunities to improve international students’ and social engagement and to identify opportunities that information, support and access to these services. enhance the experience of international students studying in South Australia. Membership of the Roundtable includes The project’s findings and recommendations will be international students from a range of education sectors completed during 2012. and countries, along with supporting agencies and government representatives. The Roundtable is chaired by Ms Leesa Vlahos, Parliamentary Secretary to the Premier, on behalf of the Minister for Employment, Higher Education and Skills. The Roundtable provided a mechanism for international students to advise the South Australian government on their key issues of concern. They also influenced the national agenda, with three international student Roundtable representatives from South Australia attending the National Roundtable in Canberra in August 2011. Since February 2011, more than 16 000 cards have been distributed to international students. It is anticipated a further 12 000 cards will be distributed each year and will be included with the StudyAdelaide student guides and satchels. Page 72
  • 73.
    OUR PERFORMANCE TAFE SAInternational Activity In 2011, TAFE SA instigated a number of initiatives to attract international students: TAFE SA’s international activities, including the delivery of programs to international students (both onshore and Student Ambassador Program offshore) is an important function that supports the overall goals of TAFE SA and the South Australian government. With the recruitment of seven international students as International students integrated into classes and campus ambassadors, TAFE SA was the first VET provider in life enrich the learning experience, broaden perspectives Australia to introduce an International Student Ambassador through shared ideas and experiences, contribute program. Recruitment was through a selection process and significantly to the growth of the community, and provide the ambassadors represent a wide range of nationalities additional funds for building better facilities and employing and courses studied. The aim of the International Student quality staff. Ambassador program, which supports the Council of Australian Governments’ (COAG) International Student The year 2011 continued to be a challenging year in the Strategy and responds to the Study Adelaide Brand Health international education industry in Australia. The strong survey, is to: value of the dollar made Australia more expensive as a study destination, and changes to the Skilled Migration - build a quality, enriched international student program, the Student Visa program, work rights post-study, experience and meet student needs and negative press about international student treatment - increase international student engagement and continued to deter some prospective students. ABS data build an active student community published at the end of the year showed education as an export for Australia was valued at $15.8 billion in 2010-11, - create activities and opportunities for interaction a 15 percent decrease compared to 2009-10. specifically for international students to foster friendships, find support groups and build confidence At the end of 2011, TAFE SA had 164 courses registered for delivery to international students including 23 new courses - provide insights into international student at all levels ranging from Certificate II, III and IV to Diploma, experiences, wants and needs to aid TAFE SA Advanced Diploma and Bachelors, in areas of Advertising, strategic planning of student support, recruitment Automotive, Banking, Business, Children’s Services, and marketing Hospitality, Information Technology, Language - develop ambassadors into advocates for TAFE SA Development, Mining, Sport and Recreation, Tourism and through the provision of personal development Veterinary studies. opportunities. Most TAFE SA international students who complete a The program also harnesses the power of word of mouth program at TAFE SA continue on to further degree studies recommendations for recruitment. A survey of current at one of the local universities. TAFE SA programs provide TAFE SA international students indicated that almost an excellent bridge for transition into undergraduate 50 percent of TAFE SA’s students hear about TAFE SA degrees. through word of mouth from family and/or friends, indicating that word of mouth and personal recommendations are powerful international student recruitment tools. Page 73
  • 74.
    International Student AmbassadorBlog Some examples of these efforts include: Since its introduction in early 2011, the International TAFE SA presence on Facebook Student Ambassador blog continued to be popular, recording more than 49 000 views. Web analysis shows The TAFE SA International Facebook page now has more that viewers spend a substantial time on the blog page and than 24 000 ‘likes’ or ‘fans’. This places TAFE SA move from this page to viewing the rest of the website, International at number seven in the top 10 highest including TAFE SA course information. The blog continues Facebook fans of university and VET providers in Australia. to act as an important recruitment tool, introducing TAFE SA is the only VET provider in the top ten. potential students to real student experiences and harnessing word of mouth recommendations and the Short Marketing Films authentic voice of international students. In 2011, TAFE SA undertook the development and production of a suite of short marketing films for recruitment purposes. The real student experiences of the TAFE SA International Student Ambassador team were TAFE SA identity on QQ.com chosen as the focus of these films. QQ.com (the Chinese equivalent to Facebook) now incorporates a TAFE SA identity to recruit students. A TAFE SA staff member is available on QQ each week to communicate with potential students in Mandarin. This has TAFE SA has a strong commitment to its international led to a significant number of students being recruited students, ensuring a comprehensive suite of services is through this channel since the QQ platform was launched. provided to meet their educational, personal and community needs. Some examples of this work include: In 2011, TAFE SA pursued an aggressive growth strategy that saw a changed focus from overseas travel in favour of International Student Aid a greater emphasis on digital (online) marketing, increasing marketing reach to over 163 countries. A number of aid and scholarship programs continued to work with TAFE SA to support students who would not normally have the opportunity to study a vocational Overseas travel was biased towards ensuring that growth education program in Australia. In 2011: was aggressive yet balanced and the composition of overseas students diversified. TAFE SA participated in - Eighteen students were sponsored by the Saudi various country recruitment exhibitions and agent events Arabian Cultural Mission to study English, Nursing across a total of nine regions including China, Vietnam, and Business Studies South Korea, Malaysia, Philippines, Hong Kong, Taiwan, Thailand and Latin America. - Nine students were supported by the Australian Agency for International Development (AusAID) scholarships from Laos, Timor-Leste, Papua New The greater emphasis in digital efforts resulted in students Guinea and the Solomon Islands to study from nine new country regions including Armenia, Congo, Geoscience, Tourism, Human Resource Israel, Mauritius, Nigeria, Russian Federation, Slovakia, Management, Food Technology and Children’s Uganda and the Ukraine. TAFE SA also experienced an Services increase in the number of students from Saudi Arabia purely from digital marketing efforts. - Seven students from Indonesia, Bhutan, Laos, Nepal, Papua New Guinea, and Pakistan received Endeavour Awards to study Veterinary Nursing, Engineering, Community Services, Automotive Technology and IT - Becas Chile sponsored two students to study Frontline Management and Mining programs. Page 74
  • 75.
    OUR PERFORMANCE International StudentServices provide a more direct engagement between the universities and TAFE SA; this enhanced the quality and The Admissions staff attend to all prospective student credibility of the programs being delivered at the University enquiries about the application process, programs and of Industry in Hanoi and in Ho Chi Minh City. transition to life in Adelaide, and specialised welfare staff guide students through their study by ensuring they are suitably orientated to their new environment, have the TAFE SA also engaged with Austraining International support they need through their studies to reach their Pty Ltd, partnering in bids for AusAID-funded projects for potential, and have many opportunities to engage with two significant programs in East Timor and Kiribati. The East their colleagues and the broader Adelaide community. Timor project involved delivery of trade expertise for local East Timor trainers through a series of visits by highly skilled TAFE SA trade lecturers. The objective of the project was to build the capacity of East Timor to deliver its own skills Student Events training and therefore strengthen their capacity to rebuild In 2011, international students participated in a broad infrastructure and enhance the skills of the local population. range of social and interactive events including Karaoke, Love Adelaide International Dinners, International Students In 2011, the Kiribati Technical VET Strengthening Program Parties, Dance and Open Mic competitions, Ice Skating, saw nine short-term advisers from TAFE SA living in Kiribati Victor Harbor Team Building, Deep Creek Conservation in 2011 for periods of approximately 40 days each visit. Park bush walks, The Amazing Great Race, Orientation BBQ They provided expertise in educational programs of with Multicultural Youth South Australia, Lawn Bowls, carpentry, auto mechanical, electro-technology, Volleyball, and City and Precinct bus tours. These events accounting, business administration, information promote social interactions and provide opportunities for technology and English language. Other advisers provided students to participate in off-campus activities, meet other expertise in Technical VET Policy and Apprenticeship Policy. students including domestic students and expand their This program is set to grow in 2012 to include auspicing social networks. arrangements and extend through to 2015. There have also been a number of other smaller AusAID- Study Tours funded projects in Samoa and Tonga operated through TAFE SA’s Justice Department and Hospitality sector, which As well as recruiting students to study full award programs, have been successful and provide further evidence of TAFE SA attracts numerous groups each year for short TAFE SA’s ability to provide meaningful and quality study tours that provide an exciting combination of cultural engagement with international organisations to build and educational experiences which are delivered across capacity. the state. These tours take advantage of the beautiful and amazing sights that South Australia has to offer, blended with state-of-the-art facilities and industry trained The collaborations with Austraining International Pty Ltd educational expertise at TAFE SA. In 2011, the Regency across a variety of activities demonstrates TAFE SA’s capacity campus hosted two study tours from Kia Ping and Tam Shui to provide a broad range of services across a complex Vocational Culinary Colleges in Taiwan. Set to grow variety of disciplines in a timely and effective manner. significantly in 2012, study tours from Korea, Taiwan, Hong Continued engagement with similar types of projects in the Kong, Indonesia and India have already been confirmed. future will further enhance TAFE SA’s reputation at local, national and international levels. TAFE SA engaged with universities, colleges and government to deliver programs in the areas of business, The TAFE SA Legal and Justice Studies program travelled to hairdressing, hospitality, information technology, nursing New Zealand to deliver a one week Train the Trainer and tourism to over 1000 students across Asia in countries Program for judicial trainers from the Pacific Forum Island including Vietnam, China, Sri Lanka, Hong Kong and Countries. This is an AusAID-funded initiative as part of the Singapore. Auspicing arrangements continue to deliver Pacific Judicial Development Program. Justice and Policing AQTF-accredited programs to hundreds of students in Studies (part of TAFE SA’s Legal and Justice Studies Vietnam in the areas of banking, business and information program) have won a contract with the Australian technology. The management of these auspicing Commonwealth Court to deliver three one-week Train the arrangements were significantly modified during 2011 to Trainer programs interstate. Page 75
  • 76.
    The year 2011also provided the opportunity to conduct an EDUCATION AND TRAINING extensive review that led to significant changes in how Education and training is vital for sustaining a strong transnational business operates at TAFE SA. workforce with solid economic growth and rising living Recommendations from the review led to more stringent standards. Education and training is designed to improve management of transnational education and improvement worker productivity and skill relevance, which in turn leads of processes to mitigate risk and increase quality of future to greater economic production3. offshore projects. This renewed focus on quality management ensures compliance to requirements, protection for students’ rights, ensures programs meet Non-school qualifications expectations, and the department’s reputation as a quality provider of vocational education is strengthened. All Data shows that the proportion of people with non-school Transnational Business processes and procedures qualifications is growing, in South Australia and for (including due diligence, contract management and quality Australia as a whole, and that the South Australian level has assurance) have been or are in the process of being revised been gradually approaching the national level. The gap to ensure more robust management. has narrowed from 4.2 percentage points in 2001, to 3.5 percentage points in 2011. In 2010, the gap was 2.4 percentage points. Plans for 2012 The department will continue to monitor national reforms in both vocational and higher education in terms of quality assurance, qualification frameworks, funding models and international education, responding to and driving the agenda as appropriate. The department, in partnership with Education Adelaide continues to build the reputation of South Australia as an international education destination, ensuring international students receive a quality education and have a positive experience in South Australia. Figure 14: Proportion of the labour force withof the labour force with non-school qualifications, Proportion non-school qualifications, South Australia and Australia South Australia and Australia 65 60 Per cent 55 50 Source: 45 2001 2002 2003 2004 2005 2006 2007 2008 2009 2010 2011 ABS Cat No 6227.0 South Australia 49.1 51.1 51.1 54.9 52.9 54.1 55.5 56.6 58.1 58.9 58.5 Australia 53.3 54.5 55.0 57.0 56.9 58.2 58.1 59.3 60.3 61.3 62.0 3 The Allen Consulting Group (2004). The Vocational Education and Training System: Key Issues for Large Enterprises. A report prepared for the Business Council of Australia Page 76
  • 77.
    OUR PERFORMANCE The proportionof people aged 20-64 who did not have qualifications at Certificate III level or above has been declining in South Australia and for Australia as a whole with the gap between the South Australian and national levels remaining relatively the same. In South Australia, the population aged 20 to 64 who did not have qualifications at Certificate III level or above has declined from 62.6 percentage points in 2001 to 49.4 percentage points in 2011. Figure 15: 20-64 year old population without qualification at Certificate III level or above Source: ABS Cat No 6227.0 Vocational education and training The VET participation rate of the South Australian working population, aged 15 to 64 years, has remained fairly constant since 2003. In 2010, the South Australian participation rate was 0.6 percentage points lower than the national rate. Figure 16: VET participation rates, South Australian and Australia VET participation rates, South Australia and Australia 14 13 12 Per cent 11 10 9 8 2001 2002 2003 2004 2005 2006 2007 2008 2009 2010 South Australia 13.0 13.2 11.4 11.3 11.3 10.9 11.1 11.2 10.9 11.0 Australia 12.2 12.2 12.2 11.3 11.4 11.4 11.3 11.3 11.1 11.6 Source: (Commonwealth) Department of Education, Employment and Workplace Relations (DEEWR), Annual National Report of the Australian Vocational and Technical Education System, National Centre for Vocational Education Research (NCVER), ABS Cat No 3201.0 Page 77
  • 78.
    3.9 National Contributions DFEESTStrategic Plan Goals 4 and 7 DFEEST plays an active role in engaging with the Commonwealth government to achieve positive outcomes for the state. NEGOTIATIONS FOR THE NEW NATIONAL AGREEMENT ACCESS AND PARTICIPATION PRINCIPAL COMMITTEE AND NATIONAL PARTNERSHIPS The Access and Participation Principal Committee (APPC) Negotiations have commenced with the Commonwealth has lead responsibility ‘to provide advice on matters relating and other state and territory governments for a new to impediments to access tertiary education and National Agreement for Skills and Workforce Development employment particularly amongst disadvantaged groups (NASWD) and associated National Partnership (NP) to and consider strategies to increase participation in tertiary replace the current Agreement and NPs. The revised education and employment’. NASWD, to be considered by COAG in early 2012, will provide the direction and framework for training and skills In 2011, the APPC’s advice to national training and development over the coming years, and emphasise joint employment senior officers and Standing Council on accountability of the states, territories and the Tertiary Education, Skills and Employment (SCOTESE) Commonwealth in meeting clear and transparent targets. included: Subject to endorsement by COAG, the new NASWD and - Development of national principles and priorities NP will implement a national training entitlement to for VET equity policy and funding, including increase participation in training leading to employment; consideration of the needs of regional and remote improve industry engagement and VET information communities, through working with the National transparency; support disadvantaged learners; improve VET Equity Advisory Council, an independent foundation skills; promote better consumer information advisory body to national ministers, on improving (including through the national MySkills website); maintain outcomes for equity groups in VET support for the public provider; strengthen enterprise - Working with the Commonwealth to improve workforce skills and development and improve pathways employability of low-skilled individuals through across the tertiary sector. identifying barriers to joined up employment services and training provision Linked reforms include external accreditation of registered - Commissioning independent research on support training providers by the national regulator and the models to assist disadvantaged groups that introduction of an income-contingent loans scheme for informed the APPC’s advice on best practice in people undertaking further training at the diploma and wrap-around service delivery for at-risk groups advanced diploma level. Work is also progressing on longer-term goals such as the introduction of a national - Approving the National Foundation Skills Strategy. Unique Student Identifier, improved partnerships between Job Service Australia and Disability Employment Service providers, and closer harmonisation of the Australian Apprenticeship system. Plans for 2012 South Australia has commenced a number of the reforms covered by the new NASWD and NP, and will seek to link Commonwealth government funding to progress towards reform goals and ensure a continuous funding stream for current and future training commitments. Page 78
  • 79.
    OUR PERFORMANCE NATIONAL PARTNERSHIPAGREEMENT ON NATIONAL PARTNERSHIP ON YOUTH ATTAINMENT AND PRE-APPRENTICESHIP TRAINING TRANSITIONS South Australia secured $3.6 million in Commonwealth Through the National Partnership on Youth Attainment funding in 2010-2011 under the National Partnership and Transitions (NPYAT), agreed by COAG in July 2009, Agreement on Pre-Apprenticeship Training between the governments are working collaboratively to better engage Commonwealth and South Australian governments to young people in education and training; achieve deliver the Apprentice Kickstart Pre-Apprenticeship (AKPA) improvements in the numbers of young people making project. The project, which concluded in November 2011, successful transitions from schooling into further education, primarily targeted school leavers and Indigenous job training or employment; and lift qualification levels. seekers and aimed to increase the number of apprentices in skills shortage areas through pre-apprenticeship training. The South Australian Implementation Plan, outlining how South Australia will implement the NP, was agreed in Through the AKPA project, 604 participants commenced a March 2010 and the Minister for Employment, Higher pre-apprenticeship course – exceeding the DEEWR Education and Skills and the Minister for Education and requirement of 500 commencements by 20.8 percent. Nine Child Development are jointly responsible for this plan. registered training organisations delivered 44 courses during the life of the project, with 418 participants Two key outcomes of the NPYAT are to achieve a national successfully completing the training. As a result of the AKPA Year 12 or equivalent attainment rate of 90 percent by project, 174 participants gained an apprenticeship, while 2015, and to provide an education or training entitlement an additional 81 gained employment. to young people aged 15 to 24 (initially referred to as the ‘Youth Compact’). DFEEST and DECD have collaborated to implement the Youth Compact, and have especially concentrated on increasing the range of opportunities for young people to take up training programs either as part of their schooling or as a full-time student at TAFE SA. Out of this collaboration has evolved the Training Guarantee for SACE Students scheme, a program within Skills for All, through which senior secondary students are supported to commence Certificate III completion pathways as part of their schooling program, and finish their studies when they leave school. A trial of the scheme commenced on 1 July 2011 with a little over 200 students participating in a range of TAFE SA programs (at Certificate II and III levels). Plans for 2012 The trial is being extended from 1 January 2012 to include selected private providers, with in excess of 600 students anticipated to be involved. The scheme will be fully rolled out from 1 July 2012. Page 79
  • 80.
    TRANSITION TO NATIONALREGULATION FOR HIGHER NATIONAL BOARD/COMMITTEE PARTICIPATION EDUCATION AND VOCATIONAL EDUCATION DFEEST has representation on 14 national committees to South Australia is in the process of transitioning to national continue engagement with the Commonwealth regulation for both vocational education and higher government. These committees are: education. - Access and Participation Committee On 1 July 2011 the Commonwealth Vocational Education - Commonwealth State and Territory Advisory and Training (VET) Regulator Act 2011 came into effect Council on Innovation and ASQA commenced operations. To enable ASQA - Data and Performance Measurement Principal jurisdictional operation in South Australia, the state Committee government was required to refer its regulatory powers to the Commonwealth. As a result, the Vocational Education - Flexible Learning Advisory Group and Training (Commonwealth Powers) Bill 2011 was - Higher Education Standards Panel introduced into State Parliament late in 2011 and the Bill is expected to be passed in early 2012. - Joint Committee on International Education - Ministerial Council for Tertiary Education and The year 2011 was also the final year of the state’s role in Employment regulating higher education (other than universities which now Standing Council on Tertiary Education, Skills are self-accrediting). From 2012, regulating higher and Employment education will be undertaken by the national regulatory - National Broadband Network Liaison Group body, TEQSA, which was also established in July 2011 following passage of the Commonwealth’s Tertiary - National Centre for Vocational Education Research Education Quality Standard Agency Act. - National Centre for Vocational Education Research - Audit Committee Once the Vocational Education and Training - National Resources Sector Employment Taskforce (Commonwealth Powers) Bill 2011 passes the South Australian Parliament, the process to transfer all regulatory - National Senior Officials Committee activity to ASQA will commence and is expected to be - National Skills Standards Council completed by 30 June 2012. - Tertiary Education, Quality and Pathways Principal Committee. Page 80
  • 81.
    OUR PERFORMANCE Zoe Dick - Trainee of the Year 2011 South Australian Training Awards Page 81
  • 82.
  • 83.
    SECTION FOUR CORPORATE GOVERNANCE AND REPORTING Page 83
  • 84.
    4.1 Ministerial Accountability 4.2 Legislation The Minister is accountable to the South Australian public As at 31 December 2011, the department was responsible for the delivery of efficient and effective services that for administering the following legislation: respond to training, employment and workforce needs. - Construction Industry Training Fund Act 1993 - Construction Industry Training Fund Regulations 2008 CURRENT ACCOUNTABILITY - Flinders University of South Australia Act 1966 Hon Tom Kenyon MP From 22 October 2011 - Public Corporations (Bio Innovation SA) Regulations 2001 Minister for Employment, Higher Education and Skills - Public Corporations (Education Adelaide) Minister for Science and Information Economy Regulations 1998 - Public Corporations (Playford Centre) Regulations 1996 PREVIOUS ACCOUNTABILITY - Technical and Further Education Act 1975 Hon John Snelling MP 25 Mar 2010 – 21 Oct 2011 - Technical and Further Education Regulations 1999 - Technical and Further Education (Vehicles) Minister for Employment, Training and Further Education Regulations 1998 Minister for Science and Information Economy - Training and Skills Development Act 2008 Hon Tom Kenyon MP 23 Jun 2011 to 21 Oct 2011 - Training and Skills Development Regulations 2008 Minister Assisting the Minister for Employment, Training - University of Adelaide Act 1971 and Further Education - University of South Australia Act 1990 Hon Jay Weatherill MP 8 Feb 2011 to 21 Oct 2011 Minister for Science and Information Economy Page 84
  • 85.
    CORPORATE GOVERNANCE ANDREPORTING 4.3 Board, Committees and Authorities BOARDS, COMMITTEES AND AUTHORITIES ADMINISTERED BY DFEEST Training and Skills Commission Office of the Training Advocate The Training and Skills Development Act 2008 establishes The Office of the Training Advocate provides a public the TaSC and outlines its functions. contact point to respond to questions or complaints about the training system. The current commission, appointed on 1 September 2010, has nine members and two deputy members appointed by In this context the training system comprises higher the Governor. It is chaired by Mr Adrian Smith, who has education, VET, apprenticeships and traineeships, adult been a commission member since 2003. community education and education services for overseas students. The commission is the peak advisory body to the state government on skills and workforce development priorities, The office is an independent statutory authority established and is responsible for the preparation and annual update under the Training and Skills Development Act 2008 and of a Five-Year Plan for Skills and Workforce Development in operates in accordance with a Charter of Functions. These South Australia. The plan is the principal instrument by functions are designed to enhance consumer protection which the commission provides its advice to the Minister for by improving access and effective participation in Employment, Higher Education and Skills. employment and skill formation opportunities, and to contribute to strategies which raise the quality and In developing its advice to the Minister the commission is responsiveness of the training system in South Australia. required, under the Act, to consult with a wide range of The functions are established to: stakeholders, including groups representing industry, - promote employment, education and training employees, education and training providers, industry skills boards and training advisory bodies, government and the - provide independent complaint handling community. - provide advocacy Digital Economy Strategy Group - provide information and advice - monitor the training system. The Digital Economy Strategy Group oversees the government’s role in the activities resulting from the Genevieve Bell report, the Digital Economy Strategy Group (DESG) was created. The group provides strategic input and direction to the Minister for Science and Information Economy on ways to position the state to take maximum advantage of the digital economy Page 85
  • 86.
    Premier’s Science andIndustry Council BOARDS AND COMMITTEES REPRESENTED BY DFEEST (formerly the Premier’s Science and Research Council) DFEEST has representation on the following state The Premier’s Science and Research Council was established committees to continue its engagement with industry, by the government in 2002 to provide independent advice tertiary education providers, science and research on strategies to optimise the contribution of the state’s institutions and digital economy institutions. capabilities in science, research and innovation to South Australia’s overall development. - Aboriginal Employment Industry Champions Network Under the leadership of the Council’s Co-Chair, Chief - Bio Innovation SA Scientist Adjunct Professor Don Bursill, the Council re- - Chief Executives Group on Aboriginal Affairs examined its previous practices and priorities during 2011 and set an agenda for the future that focuses more clearly - COAG Implementation Reporting and Evaluation on developing the state’s science and research capabilities in Group the critical area of adaptation to industry. This is in - Education Adelaide accordance with the recommendations to revitalise manufacturing as proposed by the ‘Thinker in Residence’ - Education Adelaide - Audit Committee Professor Göran Roos and in the establishment of the - Every Chance for Every Child Senior Officers Group Department for Manufacturing, Innovation, Trade, Resources and Energy. The Council has also taken steps to - Government Planning and Coordination Group link its activities more closely with the program of the - Green Futures Economic Development Board in line with the change - Higher and Further Education Task Group of emphasis. - InnovateSA Board Now known as the Premier’s Science and Industry Council, it - Invest SA Board better reflects current South Australian government priorities - Maritime Skills Centre on industry engagement. - Resources and Engineering Skills Alliance Science, Technology, Engineering and Mathematics - SABRENet Executive Reference Group - SACE Review Implementation Steering Committee The Science, Technology, Engineering and Mathematics (STEM) Executive Reference Group was established in 2011 - SA NBN Taskforce to oversee the implementation of the whole-of-government - Senior Management Council STEM Skills Strategy. The reference group is responsible for: - South Australian Tertiary Admissions Centre - making joint decisions on the funding of new or - Southern Suburbs Coordination Group continuing STEM programs - Teach SA Reference Group - making recommendations to Cabinet on policies and programs to improve the supply of South - Teacher Education Taskforce Australians with STEM skills - Training Guarantee for SACE Students - monitoring and reporting annually against STEM Reference Group goals and targets. - University Aspiration Project Advisory Committee The reference group is chaired by Mr Raymond Spencer, Chair of the Economic Development Board, meets every two months, and is administratively supported by the department. Page 86
  • 87.
    CORPORATE GOVERNANCE ANDREPORTING 4.4 Governance DFEEST CORPORATE GOVERNANCE The department’s corporate governance obligations are Budget and Finance Executive Committee prescribed in the Public Sector Act 2009 and the Technical The Budget and Finance Executive Committee is an expert and Further Education Act 1975. These Acts establish committee providing financial governance over the general management aims, personnel management and department's resources. The committee monitors the employee conduct standards. The Chief Executive of the department's performance against fiscal targets for the department is responsible for observance of these aims current financial year. It regularly reviews the department's and standards. financial strategies and the performance of the current year’s operating and capital budgets. It considers options The department maintains a governance framework that and advises the Chief Executive on the department's integrates strategic management, leadership and financial strategies and options to mitigate budget risk in accountability in the way it manages its people and the current financial year. resources to achieve the best performance of its functions. Information and Communications Technology Strategy In 2011 the department’s governance structure Committee encompassed the following: The purpose of the Information and Communications Technology Strategy Committee is to set the department’s Corporate Executive strategic directions for Information and Communications Corporate Executive is a high-level decision-making and Technology, to monitor the implementation of Information leadership group in the department. Its primary role is to and Communications Technology strategies across the ensure the successful achievement of the department’s agency, to drive value for money in Information and strategic planning and portfolio outcomes and it has Communications Technology investment and to ensure responsibility for maintaining the effectiveness of these compliance to the Information and Communications governance mechanisms. Technology governance framework. Executive Forum Infrastructure and Facilities Strategy Committee Executive Forum consists of the executive leaders The Infrastructure and Facilities Strategy Committee responsible for the achievement of departmental objectives. provides strategic guidance for the integrated planning The forum also has a role in providing strategic discussion, and management of all government-owned infrastructure collaboration and shared vision for the agency. requirements across the department, and the development of strategic infrastructure plans for its portfolios. Audit and Risk Management Committee The Audit and Risk Management Committee provides assurance and assistance to the Chief Executive to undertake his statutory responsibilities; this committee is an integral part of the department’s framework for governance. Page 87
  • 88.
    Occupational Health andSafety Committee TAFE SA GOVERNANCE The Occupational Health and Safety Committee provides TAFE SA Interim Board leadership in Injury Prevention and Injury Management for The TAFE SA Interim Board was established in July 2011 to the department’s directorates and contributes to the prepare TAFE SA for new governance arrangements as a establishment, implementation, monitoring and review of statutory authority. The key responsibilities for the board Injury Prevention and Management Systems come from the framework set out in Public Corporations Act within directorates. 1993, section 12. In particular: The committee works collaboratively and within the strategic - performance of commercial operations in guidance of the department’s Strategic Occupational Health, accordance with prudent commercial principles and Safety and Injury Management Committee. use of best endeavours to achieve a level of profit consistent with its functions People and Culture Committee - efficient and effective performance of non- commercial functions in accordance with the The People and Culture Committee provides strategic Ministerial Charter. guidance for the prioritisation, planning and management of all organisational development requirements across the department and the implementation of the People and The board comprises members of the DFEEST Corporate Culture Plan. Executive, a senior representative from the Department of Treasury and Finance and three external members. Strategic Procurement Committee TAFE SA Institute Councils The Strategic Procurement Committee oversees procurement operations within the department to advance the State The TAFE SA Institute Councils are established by the Minister Procurement Act objective of advancing government for Employment, Higher Education and Skills for each of the priorities by a system of procurement for public authorities three institutes of TAFE SA under the Technical and Further directed towards: Education Act 1975. The councils advise, monitor performance and provide supplementary funding for the - obtaining value for money in the expenditure of institutes’ operations. public money - providing for ethical and fair treatment TAFE SA Executive of participants TAFE SA Executive is the peak decision-making body for all - ensuring probity, accountability and transparency in strategic issues relating to TAFE SA. Membership consists of procurement operations. the Chief Executive, Office of TAFE SA and the three institute Managing Directors. Sustainable Industries Education Centre Board The Sustainable Industries Education Board oversees the SIEC TAFE SA Adelaide North Institute Executive project which is the development of a Sustainable Industries Management Team Education Centre on the Land Management Corporation managed development at Tonsley Park. It includes all The TAFE SA Adelaide North Institute Executive Management associated capital developments, divestments, program Team is responsible for supporting the role, function and movements and realisation of operating savings required to responsibilities of the Managing Director. deliver the benefits of the SIEC business case in an efficient, cost-effective and timely manner. TAFE SA Adelaide South Institute Executive Committee The TAFE SA Adelaide South Institute Executive Management Team is responsible for the development of business strategy, direction and monitoring the performance of the institute and responsibilities and function of the Managing Director. TAFE SA Regional Executive Operations Committee The TAFE SA Regional Executive Operations Committee supports the Managing Director, TAFE SA Regional in the execution of the role, functions and responsibilities of the position. It is the peak decision-making body of the institute. Page 88
  • 89.
    CORPORATE GOVERNANCE ANDREPORTING 4.5 Asbestos Management in 4.8 Freedom of Information Government Buildings The Freedom of Information Act 1991 (the Act) confers on Asbestos management reporting has been modified. As each member of the public a legally enforceable right to be such, each agency is now required to provide asbestos given access to documents held by the government, subject management information to the Department of Planning, only to such restrictions as are reasonably necessary for the Transport and Infrastructure (DPTI), which will be proper administration of the government and the incorporated into an annual across-government report on preservation of personal privacy. It also enables members of asbestos management. There is no longer a need to report the public to apply for the amendment of records on asbestos management in agencies’ annual reports. concerning their personal affairs if the records are DFEEST complied with this modification and forwarded its incomplete, incorrect, misleading or out of date. asbestos management report on to DPTI in October 2011. The structure and functions of the department are described elsewhere in this report. These functions affect the public through the direct delivery 4.6 Carers Recognition Act 2005 of the education, training, and employment services, as well as through the purchase of such services from private and DFEEST promotes the Carers Recognition Act 2005 and the community providers; the accreditation of training courses; Carers Charter on its intranet to ensure all employees have the registration of training providers; the investigation of an awareness and understanding of this information. complaints about training organisations and accredited Information is also incorporated into the new DFEEST online courses; the management of contracts of training; facilitation induction package. Communication occurs through Human and development of the skills in the state; the Resource units across the department and on intranet sites. encouragement of science, technology and innovation- based industries; and the uptake and usage in the community of online technologies and other ways of enhancing the economy of South Australia. 4.7 Disability Action Plans The public can participate in the department’s policy TAFE SA Disability Access Plans are now used for all students development in a number of ways. Some of these ways with a disability or medical condition who require additional include membership of TAFE SA councils and other boards support. This allows for consistency as well as the ability to and committees, as well as responding to calls for public track trends and ensure students do not have to reapply consultation on particular issues. when moving campuses. Provision has been made under the SIS to greatly improve dissemination of information to The department holds correspondence and administrative students with disabilities in a much more timely fashion. records including: - personnel records Ongoing improvements to physical access are constantly monitored. In 2010-11, $100 000 in additional funding - accounts records across TAFE SA was allocated for addressing items identified - payroll records through the access audits conducted in 2009. Access upgrades included improved toilet facilities and installation - supply records of more electronic doors. - facilities management records - students’ records in TAFE SA institutes In addition, access improvements were made as part of major works on the following campuses: Tea Tree Gully, - student services records Whyalla, Victor Harbor, Regency and Adelaide City. - records relating to accredited training courses - complaints made about registered training providers and contracts of training - contracts - records relating to grants of funding - surveys and statistics. Page 89
  • 90.
    Records are heldin a variety of media including paper, Public access to documents microfiche and electronic formats. Information and explanatory documents about courses, contracts of training, The public can access documents and seek amendment to course accreditation and training organisation registration, documents under the Act. youth services, science, innovation and information economy are available free of charge from the An application under the Act must be made in writing, following websites: specifying that they are made under the Act, include an address in Australia to which correspondence may be sent - TAFE SA: www.tafe.sa.edu.au and be accompanied by the prescribed application fee. A - Skills SA: www.skills.sa.gov.au waiver or remission of a fee applies in cases where the applicant satisfies an agency that he or she is a concession - Information on accreditation, registration and card holder or the payment of the fee or charge would contracts of training, the South Australian cause financial hardship to the person. traineeship and apprenticeship system: www.dfeest.sa.gov.au Freedom of Information applications should be - Higher Education accreditation: www.aqf.edu.au addressed to: - Adult Community Education grants: www.skills.sa.gov.au Senior Consultant Freedom of Information, Privacy - User Choice Policy located under the User Choice and Intellectual Property submenu: www.training.sa.gov.au Legislation and Delegations Unit Department of Further Education, Employment, - Training and Skills Commission guidelines: Science and Technology www.tasc.sa.gov.au GPO Box 320 - Science, Innovation and Information Economy ADELAIDE SA 5001 information: www.dfeest.sa.gov.au - General DFEEST information: www.dfeest.sa.gov.au Telephone enquiries can be made on (08) 8226 3276. Access requests in 2011 During the 2011 calendar year, the department processed 42 Freedom of Information applications under the Act. Page 90
  • 91.
    CORPORATE GOVERNANCE ANDREPORTING 4.9 Management of Human Resources WORKFORCE DATA EMPLOYEE NUMBERS, GENDER AND STATUS The following data is based on records from the Human All data has been sourced from employer records. Unless Resource Information System, Empower, for persons otherwise stated, data relates to the final pay period in June identified as being employed on 30 June 2011. 2011. Hourly paid instructors are excluded from most data tables The following tables depict the total number of employees as they are employed under different conditions and including persons and Full-Time Equivalent (FTE) reported accordingly. To combine hourly paid instructors’ employees. data with regular staff information would result in data distortion. Total number of employees Persons 3 411 Full-Time Equivalents 3 082.5 As at 30 June 2011 excluding HPIs and casuals Gender Persons % Persons FTEs % FTEs Male 1 312 38.5 1 268.9 41.2 Female 2 099 61.5 1 813.5 58.8 Totals 3 411 100 3 082.5 100 As at 30 June 2011 excluding HPIs and casuals Number of persons who were recruited to and separated from the department Separated from the department 393 Recruited to the department 418 Over Financial Year 2010-11 excluding HPIs and casuals Page 91
  • 92.
    Number of personsat 30 June 2011 On Leave Without Pay 140 Excluding HPIs and casuals Age Bracket Female Male Total % of Total Workforce Benchmark 15 - 19 years 5 2 7 0.2 6.4 20 - 24 years 53 13 66 1.9 10.3 25 - 29 years 110 55 165 4.8 10.8 30 - 34 years 194 89 283 8.3 10.1 35 - 39 years 209 117 326 9.6 10.1 40 - 44 years 274 140 414 12.1 11.3 45 - 49 years 293 175 468 13.7 11.5 50 - 54 years 377 241 618 18.1 11.4 55 - 59 years 351 246 597 17.5 9.2 60 - 64 years 184 182 366 10.7 5.7 Over 65 years 49 52 101 3 3.3 TOTAL 2 099 1 312 3 411 100 100 Source: Australian Bureau of Statistics Australian Demographic Statistics, 6291.0.55.001 Labour Force Status (ST LM8) total from Supertable, SA as at June 2010 As at 30 June 2011 excluding HPIs and casuals Page 92
  • 93.
    CORPORATE GOVERNANCE ANDREPORTING Number of employees by salary bracket Salary Bracket Female Male $1 - $50,399 621 132 $50,400 - $64,099 321 142 $64,100 - $82,099 829 742 $82,100 - $103,599 279 252 $103,600 + 49 44 As at 30 June 2011 excluding HPIs and casuals As at 30 June 2011 excluding HPIs and casuals Number of executives by gender and classification Classification Tenure Female Male EM-C Y 6 3 EXEC ULE N 0 1 SAES-1 N 15 11 SAES-2 N 2 4 Total 23 19 As at 30 June 2011 Page 93
  • 94.
    Status of employeesin current position (excluding hourly paid instructors) Ongoing Short-Term Long-Term Other Total Contract* Contract (Casuals) Male 1 132 155 25 17 1 329 Female 1 714 354 31 78 2 177 Total 2 846 509 56 95 3 506 * Short-term contracts are under two years; long-term contracts are over two years As at 30 June 2011 including casual employees Status of FTE employees in current position (excluding hourly paid instructors) Ongoing Short-Term Long-Term Other (Casuals) Total Contract Contract Male 1 102.20 141.82 24.90 5.1 1 274.0 Female 1 484.79 300.54 28.20 28.5 1 842 Total 2 586.99 442.36 53.10 33.6 3 116 As at 30 June 2011 including casual employees Hourly Paid Instructors In total, 1 849 individual hourly paid instructors (as 218.6 full-time equivalent) provided 209 864 teaching hours at a cost of $12.9 million. Page 94
  • 95.
    CORPORATE GOVERNANCE ANDREPORTING ABORIGINAL AND/OR TORRES STRAIT ISLANDER EMPLOYEES Male Female Total % of Agency %Target* 24 41 65** 1.9 2.0 *Target set by SASP ** as at 5 January 2012 APPRENTICES, TRAINEES AND CADETS Male Female Apprentices 1 0 Trainees 1 7 Cadets 0 2 CULTURAL AND LINGUISTIC DIVERSITY Male Female Total % of % SA Agency Community Number of employees born overseas 92 148 240 7 20.3 Number of employees who speak 61 71 132 3.9 12.2 language(s) other than English at home Benchmarks from ABS Publication Basic Community Profile (SA) Cat No. 2001.0 As at 30 June 2011 excluding HPIs and casuals GRADUATE PROGRAM Male Female Graduates 8 7 Page 95
  • 96.
    NUMBER OF EMPLOYEESWITH AN ONGOING DISABILITY This table indicates the number of employees who have self-identified as having an ongoing disability. Male Female Total % of Agency 16 15 31 0.9 As at 30 June 2011 excluding HPIs and casuals NUMBER OF EMPLOYEES WITH A DISABILITY REQUIRING WORKPLACE ADAPTATION Male Female Total % of Agency 3 2 5 0.15 As at 30 June 2011 excluding HPIs and casuals LEAVE MANAGEMENT The following table depicts the average days taken per FTE There is a 2 percent increase in leave from 2009-10 to 2010 (excluding hourly paid instructors and casuals) over the -11. A further investigation of the data reveals that 2010-2011 Financial Year. Sick Leave is inclusive of Family although there were more employees in 2010-11 who Carer’s Leave. took no sick leave, those who did take sick leave took slightly more sick leave. As DFEEST’s employee population The types of leave contained within Special Leave With Pay ages, more employees are experiencing sickness that results include Paid Maternity Leave, Adoption Leave, in long-term absences. As a result, the average sick leave Miscellaneous Special Leave and Workers per FTE increases. Compensation Leave. 07-08 08-09 09-10 10-11 Sick Leave 7.6 8.2 8.2 8.4 Special Leave with Pay 2.3 2.5 3.2 3.2 Average Leave Days taken per FTE over each Financial Year Page 96
  • 97.
    CORPORATE GOVERNANCE ANDREPORTING The data below has been extracted from an employee PERFORMANCE DEVELOPMENT climate survey, known as BULB. DFEEST is currently in the A job capability framework was developed in 2011 to process of developing a system to provide a fit-for-purpose identify the essential capabilities required for DFEEST to be performance coaching and professional development a high-performing organisation. The framework describes recording system that supports individual staff, the competency requirements of: communication; positive management and corporate needs. The new system will working relationships; business excellence; achieve results; be operational by the end of 2012, and provide an strategic and operational thinking; and technical expertise. accurate data set to facilitate statutory, tactical and strategic Funding was then allocated to professional development business intelligence needs. activities that will build the capacity of staff at all levels against the capability framework. Leadership and Management Training Expenditure Leadership and management training is funded across the Performance Coaching department by DFEEST Corporate Services, individual DFEEST and TAFE SA placed a stronger focus on directorates and TAFE SA institutes. Funds are allocated to performance development in 2011, commissioning a new Capacity Building and programs of activity are negotiated Performance Coaching Framework, which included a annually, based on the business needs and future revised policy, procedure and supporting templates for directions of the agency. DFEEST has a strong Leadership TAFE Act, Public Sector Act and South Australian Executive and Management Development Program that has specific Service executives. programs for management, leadership and executive development. To support the rollout of the Performance Coaching Framework, mandatory training commenced in October The majority of TAFE SA employees are TAFE Act lecturers; 2011 and was delivered to DFEEST and TAFE SA executives therefore staff development expenditure is spent and line managers to assist in building the capability of our predominantly in the areas of teaching and learning to managers and leaders to hold the conversations that are ensure lecturers have the relevant knowledge and skills to essential to creating a performance culture. maintain educational and industry currency. An evaluation of lecturer capabilities in the areas of VET and industry It was vital to the success of the performance coaching currency commenced in 2010. This program will be training that the rollout commenced at executive level. finalised in all three institutes in 2012 and the resulting Executive leadership and commitment to performance evidence will inform development programs over the coaching is critical to building a performance culture in following two years. DFEEST. Training and Development Total Cost % of Total Salary Expenditure Total training and development expenditure $3 731 587 2 Total leadership and management development expenditure $294 603 0.2 Accredited Training Packages The accredited training packages in the table below are sourced from the Public Service Training Package. Classification Number of Accredited Training Packages ASO3 – ASO5 PSP51104 - Diploma of Government BSB51407 - Diploma of Project Management (Capacity Building) ASO6 and above – Leadership BSB51107 - Diploma of Management Development Program BSB61407 - Advanced Diploma of Management (Capacity Building) ASO2 and above PSP40104 - Certificate IV in Government (DFEEST Graduate Program) BSB40807 - Certificate IV in Frontline Management (Capacity Building) Page 97
  • 98.
    Leadership and ManagementCapability Development System Program # of Development Mentoring/coaching Project participants workshops 1-2 day Mentoring/coaching Management Group 17 workshops by middle-level Development Program Project each month manager 1-2 day Mentoring by a Leadership Group 21 workshops departmental Development Program Project each month executive Leadership Action Individual executive 2 day workshops Individual Learning Teams 14 coaching sessions every 6-8 weeks Project Program (six) Total 52 Management Development Program Leadership Action Learning Teams Program The Management Development Program is an accredited The Leadership Action Learning Teams Program is aimed learning program pitched at existing and next generation at developing employees who have been identified as managers. The aim of the program is to equip employees high-potential future executives. It is aligned to the South with operational management skills, such as how to deliver Australian Executive Services competency framework. This effective client services, how to manage resources, how to program is based on implementing behavioural change manage risk and change, increase understanding of within participants through group and individual coaching. government compliance, as well as how to It also provides each participant with the opportunity and manage people. support to implement a strategic project in their work area. The program is most suitable for those who already have a Leadership Development Program management qualification, or those who are seeking coaching on their leadership style, as it is not aligned to The Leadership Development Program is an accredited a qualification. program targeting both high-potential and current leaders. It aims to equip participants with strategic thinking skills, knowledge of how to facilitate change, increase self-awareness of leadership behaviours, understand how to engage and inspire people, as well as comprehend the context of leading in the broader South Australian government. Page 98
  • 99.
    CORPORATE GOVERNANCE ANDREPORTING Voluntary Flexible Working Arrangements This table depicts the various components of voluntary Staff employed under the TAFE Act and Weekly Paid Act flexible working arrangements which are utilised by are not entitled to utilise the full suite of Voluntary Flexible departmental staff. Working Arrangements available to Public Sector Act employees. Male Female Total Purchased leave 1 0 1 Flexitime 207 599 806 Compressed weeks 3 7 10 Part-time job share 1 12 13 Working from home 3 6 9 Flexitime and working from home 3 9 12 Flexitime and compressed weeks 6 7 13 Flexitime and compressed weeks and working from 2 0 2 home Flexitime and part-time job share 0 20 20 Flexitime and part-time job share and working from 0 1 1 home Flexitime and purchased leave 1 4 5 Total 227 665 892 Page 99
  • 100.
    WORKPLACE HEALTH ANDSAFETY During the 2010-11 financial year, DFEEST continued to Significant investment continued in 2010-11 for the build upon and further improve previous years’ positive TAFE SA machine management program with an extra workplace health and safety results. $500 000 being allocated to fast-track safety outcomes from the project. To date, approximately $3.5 million has DFEEST’s Strategic Plan 2010-2014, Goal 7 DFEEST is a high been spent on improving safety of plant and equipment so -performance organisation states that DFEEST’s workforce that students and staff are safe. Improvement was also will have a healthy and safe environment in which to work. achieved in the prevention of psychological injuries with This is aligned to SASP Target 21 - Greater safety at work only 12 new injuries compared to 22 in the previous year. (achieve the nationally agreed target of 40 percent reduction in injury by 2012), Target 13 - Work/life balance The year 2011 saw DFEEST being critically assessed in (improve the quality of life of all South Australians through OHS&W and Injury Management with a WorkCover maintenance of a healthy work/life balance) and Target 86 Evaluation. As a result of improvements and refinement of - Psychological wellbeing (equal or lower than the DFEEST’s management system, DFEEST was awarded Australian average for psychological distress by 2014). Level 2 under the Natural Consequences Model for Self- Insurers. This achievement recognises that DFEEST has a For the financial year, DFEEST’s performance in workplace mature management system that is continually improving. health and safety continues to significantly improve. TAFE SA provides training in all high-risk industries and There will be substantial challenges faced by DFEEST in TAFE SA’s commitment to the safety and wellbeing of staff 2012 with the introduction of the pending Workplace and students is held in the highest regard. Health and Safety Act, Skills for All reforms and the establishment of TAFE SA as a Statutory Authority. In the 2010-11 financial year, DFEEST recorded 55 new injuries. This was a 32 percent reduction from the previous financial year. Of the 55 new injuries there was a 24 percent reduction in those incurring lost time (25 WORKFORCE RELATIONS injuries) compared to the previous year. Total costs of A high level of industrial and employee relations advice and workers compensation reduced by $408 174 (13 percent support to management and human resource staff has reduction) from the previous financial year. continued to be provided in an efficient and timely manner. During 2011, DFEEST was again recognised at the SafeWork SA Awards with Mr Jorgen Andersen winning A total of 49 staff disciplinary or grievance-related matters the category Best Individual Contribution to Workplace were investigated with 43 being satisfactorily completed Health and Safety. This is now the fourth time an employee and the others still pending. of DFEEST has won an occupational health, safety and welfare (OHS&W) award and demonstrates the commitment and contribution of DFEEST employees to a safe work environment. Page 100
  • 101.
    CORPORATE GOVERNANCE ANDREPORTING * OCCUPATIONAL HEALTH, SAFETY AND INJURY MANAGEMENT 2010-11 2009-10 2008-09 1 OHS Legislative Requirements (includes incidents involving students, contractors and visitors) Number of notifiable occurrences pursuant to OHS&W Regulations 9 (2 from students & 4 11 (4 from students 7 (3 from students) Division 6.6 from contractors) and 3 from contractors) Number of notifiable injuries pursuant to OHS&W Regulations Division 5 (1 from student & 2 1 (student) 1 6.6 from contractors) Number of notices served pursuant to OHS&W Act s35, s39 and s40 3 (1 from contractor) 4 (3 from students) 12 (relate to 4 incidents) 2 Injury Management Legislative Requirements Total number of new claimants who participated in the rehabilitation 24 30 23 program Total number of employees rehabilitated and reassigned to alternative 0 2 2 duties Total number of employees rehabilitated back to their original work 7 6 4 3 WorkCover Action Limits Number of open claims as at 30 June 2010 123 163 182 Percentage of workers compensation expenditure over gross annual 0.0109 0.0123 0.0137 remuneration 4 Number of Injuries Number of new workers compensation claims in the financial year 55 81 74 Number of fatalities, lost time injuries, medical treatment only (F) 0 0 0 (LTI) 33 27 25 (MTO) 48 47 30 Total number of whole working days lost 6 397 6 141 8 198 5 Cost of Workers Compensation Cost of new claims for the financial year $439 273 $440 677 $417 802 Cost of all claims excluding lump sum payments $2 011 885 $1 957 661 $2 328 242 Amount paid for lump sum payments (s42, s43, s44) $691 886 $1 154 284 $726 837 Total claims expenditure $2 703 771 $3 111 945 $3 055 079 Total amount recovered from external sources (s54) $180 000 $147 937 $0.00 Budget allocation for workers compensation $3 000 000 $3 200 000 $3 200 000 Actuarial (Outstanding) Liability $9 025 481 $8 091 903 $7 411 427 6 Trends **Injury frequency rate for new lost-time injury/disease for each million 4.6 5.9 4.9 hours worked Most frequent cause (mechanism) of injury Body Stressing Body Stressing Body Stressing Most expensive cause (mechanism) of injury Mental Stress Mental Stress Mental Stress * Occupational Health Safety and Injury Management Reporting is based on financial year as determined by the Australian Standard. Prior to 2006/07 re- porting was based on Calendar Year as determined by the TAFE Act. ** Based on Lost Time Flag (i.e. ≥ 1 day or shift. Page 101
  • 102.
    4.10 Reconciliation The departmentworks closely with Reconciliation SA and The department’s commitment to working collaboratively other South Australian government agencies to achieve with Aboriginal communities to develop an updated the government’s commitment to Reconciliation. Reconciliation Statement resulted in the signing and launch of the Reconciliation Statement by Kaurna Aboriginal The department’s commitment was symbolised by Elders. The department further committed to distributing employees placing their hand print on canvas during copies of the signed and framed Reconciliation Statement Reconciliation Week 2010. The “Future Generations” and Acknowledgement banner to 18 TAFE SA campuses canvasses, where employees’ children placed their hand located within the recognised traditional Kaurna lands. As print, were launched during Reconciliation Week 2011 as a such, the department is engaging with recognised gesture of an intention towards a collaborative journey to traditional owners in areas where TAFE SA campuses are unite in the true spirit of Reconciliation. The canvasses are located. displayed in the main reception area on Level 4, 11 Waymouth Street. A new Reconciliation Action Committee was established to include a broader cross-section of employees and The department facilitated a variety of cultural activities and representation across all directorates to promote, events to celebrate Aboriginal culture during Reconciliation investigate and implement appropriate activities across the Week 2011. Tauondi College hosted tours of its museum department. The department committed considerable for the department’s staff, which was an excellent funds to build a culturally inclusive environment which will opportunity to gain insight into Aboriginal culture and promote decision-making that is inclusive of Aboriginal history. Tauondi also provided ten pieces of student people and to monitor the activities in the Reconciliation artwork for the department to showcase. The department Action Plan. was extremely fortunate to host an Artist-in-Residence, with staff afforded an opportunity to observe and interact with Work continues on the Aboriginal Employment Strategy the artist regarding his cultural background and artwork. 2010-2015 – Building a Culturally Inclusive Workforce which aims to increase the participation of Aboriginal people in the department’s workforce. Page 102
  • 103.
    CORPORATE GOVERNANCE ANDREPORTING 4.11 Sustainability (incorporating Energy Efficiency Action Plans and Greening of Government Operations) The sustainability reporting is aligned to the DFEEST Strategic Plan 2010-2014, the whole-of-government Energy Efficiency Action Plan and the Greening of Government Operations plans, which are all linked to various targets in the State Strategic Plan, of which the following objectives, goals and aims are as follows. ENERGY EFFICIENCY Year being reported Energy Use (GJ) GHG Emissions (t/CO2e) Business Measure MJ/m 2010-11 167 651 25 260 386 2009-10 177 337 29 860 405 Energy Consumption Targets Base year 2000-2001 156 222 49 878 376 Target for 2010-11 132 191 42 425 304 Target for 2014-15 122 524 38 584 282 Corporate 2010-11 2 135 426 217 2009-10 2 353 548 224 TAFE SA Adelaide North 2010-11 83 353 12 420 458 2009-10 93 697 14 934 505 TAFE SA Adelaide South 2010-11 54 221 7 903 385 2009-10 53 486 9 251 384 TAFE SA Regional 2010-11 27 942 4 511 273 2009-10 27 801 5 127 272 Notes: - Energy use is expressed in gigajoules (GJ) and is the sum of all fuel types used in our facilities (electricity, natural and bottled gas) for that period. - Greenhouse Gas Emissions are expressed in tonnes of Carbon Dioxide equivalent, which is a combination of six recognised greenhouse gases; (Carbon Dioxide CO2, Methane CH4, Nitrous Oxide N2O, Hydrofluorocarbons HFCs, Perfluorocarbons PFCs and Sulphur Hexafluoride SF6). - The key performance indicator for energy efficiency is energy intensity; the amount of energy consumed per unit of a given business measure. DFEEST uses the net size of all of our facilities in m 2. This is a common measure used across many agencies. - It is acknowledged that portfolio structures change over time. Therefore the portfolio baseline will represent the structure of the portfolio in the given reporting period. Page 103
  • 104.
    SIGNIFICANT ENERGY MANAGEMENTACHIEVEMENTS Overall, the department’s results in relation to energy TAFE SA Adelaide North Institute efficiency are below target, yet they are a considerable TAFE SA Adelaide North Institute reduced its energy improvement over the previous reporting period (2009-10). consumption by 11 percent compared to the previous There has been a net decrease in energy use of 5.5 percent reporting period. This was a result of a number of across the department. Of the three TAFE SA institutes, two initiatives including: have increased their energy use: TAFE SA Adelaide South by 1.4 percent and TAFE SA Regional by 0.5 percent. TAFE - Regency Cogeneration Unit has undergone SA Adelaide North reduced its energy use by 11 percent. repairs which has affected its ongoing operations. This unit operates on natural gas and when The ageing of TAFE SA facilities and increased operational provides heat and electrical power to business outcomes contribute towards increased the site, reducing our need to purchase electricity energy consumption. from the grid However, DFEEST has endeavoured to improve its energy - Lighting: further rollout of the Axion Emergency performance and some of the initiatives are detailed below. Lighting System to Regency and Tea Tree Gully campuses. This system replaces emergency lighting with low wattage LED lighting Corporate DFEEST - Participated in Earth Hour 2011 through DFEEST’s occupation in the 5-star green City Central reviewing energy requirements for their campuses (11 Waymouth Street, Adelaide) consumed 9.3 percent less and increasing the awareness amongst staff of our energy compared to the previous reporting period. A environmental impacts number of initiatives contributed to this success: - TAFE SA Renewable Energy Centre working in partnership with Royal Rewinds Mechanical and Earth Hour 2011 Engineering installed a three kilowatt wind turbine A review of the building management systems across as part of the renewable energy project. Corporate DFEEST and all TAFE SA institutes to maximise energy efficiencies was conducted, and staff were encouraged to acknowledge our impacts on the environment as part of the department’s participation in TAFE Adelaide South Institute Earth Hour 2011. Over 134 countries participated in this TAFE SA Adelaide South Institute increased its energy international awareness-raising event. consumption by 1.4 percent compared to the previous reporting period. To counter this increase, the institute has National Australian Built Environment Rating System – implemented the following initiatives: City Central Energy Rating DFEEST is the largest tenant in City Central (occupies 6 - Noarlunga: an $8.7 million upgrade included a levels) and in February 2011 the building was awarded a 5- 15 kWh solar power generation system with star rating for base building energy efficiency. DFEEST 84 solar panels. This system has generated undertook a lighting control system review in late 2010 to 35 100 kWh’s since July 2010. 1600 light fittings ensure maximum efficiency of the tenancies lighting. were upgraded to energy efficient T5 lights and additional LED downlights were installed in the ICT John Reynella Restaurant DFEEST ICT has been instrumental in strongly reducing ICT-related energy usage through new ‘virtual’ equipment - Participated in Earth Hour 2011 through (blade servers) replacing inefficient ICT components. The reviewing energy requirements for their campuses floor level ICT is located on realised a 13.5 percent and increasing the awareness amongst staff of our reduction in energy usage, whilst three of the other floor environmental impacts. levels reduced their energy usage by an average of 5 percent. A focus on printer settings and equipment utilisation such as automatic power shutdown of PCs, and newer more efficient PCs and monitors have all contributed to reducing energy consumption. Page 104
  • 105.
    CORPORATE GOVERNANCE ANDREPORTING TAFE SA Regional Initiatives planned for 2011-12 TAFE SA Regional increased its energy consumption by Sustainability initiatives for 2011-12 include: 0.5 percent compared to the previous reporting period. To counter this increase, the institute has implemented the - Adelaide: A $3.8 million refurbishment of the following initiatives: ground floor area into a client services area includes energy efficient lighting and updated - Berri: existing solar power generation system of air-conditioning 1.5 kWh has generated an estimated 3 200 kWh’s - Berri: Additions of 54 solar panels (10 kWh) to this financial year the existing solar power generation system - Gawler: A $100 000 project was completed to are planned install energy efficient T5 and LED lighting - Murray Bridge: the second stage refurbishment of throughout the campus the Library and Client Services areas will include - Mount Gambier: existing solar power generation replacement of inefficient lighting with more system of 14.5 kWh has generated an estimated efficient T5 lighting. Additions of 54 solar panels 19 000 kWh’s this financial year (10 kWh) to the existing solar power generation system are planned - Murray Bridge: a $300 000 project was completed as a first stage in consolidating the Library and - Whyalla: Two 1.5 kWh solar power generation Client Services areas, including upgrades to more systems are planned. efficient lighting. An existing solar power generation system of 1.5 kWh has generated an estimated 3200 kWh’s this financial year - Victor Harbor: existing solar power generation system of 22.7 kWh has generated an estimated 26 500 kWh’s this financial year - Participated in Earth Hour 2011 through reviewing energy requirements for their campuses and increasing the awareness amongst staff of our environmental impacts. Page 105
  • 106.
    WATER USAGE DFEEST’s waterconservation measures for TAFE SA Regional - Specific Water 2010-11 have been outstanding. The Conservation Initiatives department consumed 4.6 percent less water Urrbrae campus: ongoing development of than during the previous period; however, water capture, storage and reuse to toilet water-related costs increased by 9.2 percent. blocks, nursery, aquaculture and local piggery Since 2002-03 the department has reduced its onsite. Development this year has been water consumption by 39 percent. towards connecting the two wetlands at this site in order to provide back-up water to the Extensive use of native vegetation replacing TAFE SA nursery/toilets and for irrigation. lawn areas throughout TAFE SA campuses across all institutes has been instrumental in TAFE SA is investigating potential alternative achieving these results. Ongoing replacement water supplies such as recycled water (e.g. the of water furniture in kitchens, toilets and Barker Inlet Stormwater Reuse Scheme). general wet areas to water-efficient taps, showerheads and toilet ware (supporting the Water for Good Action 37 and SASP Target 75) across the three institutes has also contributed towards this outstanding result. DFEEST Total Water Consumption 2010-11 Water Consumption (Kilolitres = Year being reported 2010-11 % of use Expenditure $ 1 KL = 1,000 litres) Institutes Northern 106 552 64% 519 182 Regional 25 450 15% 236 450 Southern 34 912 21% 331 341 Total 166 914 100% 1 086 973 Base year 2002-03 Water Consumption (Kilolitres) % of use Expenditure $ Institutes Northern 145 871 54% 325 890 Regional 65 907 26% 177 258 Southern 59 723 20% 326 278 Total 271 501 100% 829 426 DFEEST Target for year being reported 235 717 DFEEST Target for 2014 235 357 Page 106
  • 107.
    CORPORATE GOVERNANCE ANDREPORTING WASTE MANAGEMENT DFEEST has undergone an extensive review of waste The tender anticipates diverting waste from landfill across management across all sites to consolidate waste our many waste streams in as many sites as possible. The management under one contract. It is anticipated the new waste products diverted from landfill are anticipated to be contract will provide auditable reporting of all waste integrated in established recycling centres across the state. streams, contributing towards SASP Target 67: Zero Waste – The new waste contract is expected to commence in early reduce waste to landfill by 35 percent by 2020 (baseline; 2012. 2002-03). Milestone of 25 percent by 2014. Page 107
  • 108.
    FLEET MANAGEMENT DFEEST continuesto offset all carbon emissions from our A new reduction target of carbon emission (grams per km) long-term vehicle fleet with Greenfleet Australia. Since was announced by the Premier in early 2011. Our emission 2008, this collaboration has offset over 6200 tonnes of reduction target is a 10 percent reduction from 2009-10 carbon emissions through the planting of over base year – 248.1 gm/km to 223.2 gm/km by 2014-15. 23 000 trees. Each agency has a specific target. For this reporting period we are committed to offset an The table below demonstrates the emission offsets from additional 1045 tonnes of carbon emissions and this our long-term vehicle fleet. Our total fleet was reduced by equates to $5.52 per vehicle per month. four vehicles overall, of which 123 vehicles are classed as green/low-emission vehicles, which represents 58 percent Additionally from 2009-10 we reduced the kilometres of the total fleet from 2009-10. Our four-cylinder fleet has travelled by 3.9 percent, fuel usage by 6 percent, number increased by 23 vehicles, and represents 26 percent of our of vehicles by 1.8 percent, tonnes of carbon emissions by total fleet. 1.1 percent and increased fuel cost by 0.8 percent. Emissions CO2 (grams) Fuel Expenditure ($) Number of Vehicles Fuel Usage (Litres) Total km travelled Emissions (t/CO2) per km 2010 - 2011 213 438 703 $467 131 1 045 245.31 3 951 046 Unleaded (All) 212 512 525 Diesel 112 873 326 LPG/Dual Fuel 113 318 194 123 Green/low-emission vehicles (58%) Total 438 703 1 045 Greenfleet carbon offset information Number of trees 3 899 Total Cost $14 106 $5.52 per vehicle per $66.22 per vehicle per Cost per vehicle per month & year month year Page 108
  • 109.
    CORPORATE GOVERNANCE ANDREPORTING TAFE SA SUSTAINABILITY INITIATIVES TAFE SA has a pivotal role to play in the development of TAFE SA delivered a five-day environmental compliance sustainable South Australian workforces through the course for the Environmental Protection Authority and provision of training programs and services that meet the other government agencies during 2011. This is a new current and future needs of key stakeholder groups. intensive environmental compliance course which is being TAFE SA also has a vital role to play in the creation and offered by TAFE SA. distribution of innovative products, processes and practices across its areas of industry focus. During 2011, TAFE SA launched a Carbon Accounting short course specifically developed to improve literacy and TAFE SA is a party to the South Australian VET Sector numeracy skills relating to the challenges of sustainability Agreement with the Minister for Sustainability, Environment and climate change. The short course consists of two units and Conservation. The purpose of the agreement is to offered in a three-day workshop environment designed for show leadership and cooperation in responding to climate students and professionals with a background in disciplines change through skills development for South Australia’s including sustainability, environmental management, workforce. To this end, the Regional GreenPrint supports accounting and policy. the TAFE SA Sustainability and Action Plan 2009-2012, the South Australian VET Sector Agreement and the National Funding for 180 students was allocated from the PPP for VET Sector Sustainability and Action Plan to guide TAFE SA’s Diploma of Sustainability. Developed by TAFE SA, environmentally sustainable development. the Diploma recognises the need to: A team of TAFE SA Electrical and Engineering students - build a common understanding of sustainability designed and produced the solar car SolarSpirit Australia, across all sectors of private and public activity to which competed in the 2011 World Solar Challenge in build capacity for development and October 2011. implementation of sustainability programs - develop a common understanding of the During 2011, the TAFE SA Bachelor of Visual Arts concepts and language of sustainability (Printmaking Studio) sought to achieve four core actions: Reduce, Reuse, Recycle and Recover. The print studio uses a - introduce the latest techniques for implementing number of consumables which are expensive and with a sustainability programs. change in practice by collecting and reusing supplies, Both private and public VET sector employees, business, funding and waste have been reduced, for example toxic industry and government (e.g. SA Water, Department of waste substances in the studio are being converted to Environment and Natural Resources) enrolled in the solvent products using vegetable oil. Diploma, as well as representatives from the private sector in ‘green’ industries, small business owners and staff seeking to improve business performance. SolarSpirit Australia, the sole South Australian entrant in the 2011 World Solar Challenge, successfully completed the 3000 kilometres from Darwin to Adelaide. Page 109
  • 110.
  • 111.
    CORPORATE GOVERNANCE ANDREPORTING 4.12 Urban Design Charter 4.13 Whistleblowers Protection Act 1993 Urban design is integrated within DFEEST’s core systems DFEEST appointed five responsible officers within the and procedures. Consultants, contractor tenders and major department for the purposes of the Whistleblowers contracts are managed on behalf of the department by Protection Act 1993. The department received three DPTI. DFEEST has supported DPTI in the preparation of whistleblower-related allegations during the year. One is policies, including the impact of our presence in the local being investigated, one was reviewed by the department community, with a view to integrating with the urban fabric and deemed not to be a whistleblowers complaint and the so that a positive contribution is made. complainant of the third is reconsidering their concerns. To initiate the engagement of consultants to undertake design work, DFEEST collaborates with DPTI to define and/ or request specific urban design principles associated with the project or request their investigation, including: - ecologically sustainable development initiatives to be considered - specific site issues such as cultural, political and heritage issues - corporate parameters (relevant policies, standards and guidelines) - specific consultant services required (e.g. tree audits, traffic management surveys, disability access, Indigenous/cultural issues). DFEEST interacts and communicates with the community through TAFE SA institutes and campuses. With respect to major projects, the Public Works Committee and DPTI work on behalf of the department to ensure exposure to a wide range of community views and scrutiny. Page 111
  • 112.
  • 113.
    SECTION FIVE FINANCIAL PERFORMANCE Page 113
  • 114.
    5.1 Financial Overview 5.2 Summary of Financial Information On a comparative basis to 2009-10, expenses decreased by NET RESULT $2.1 million (or 0.4 percent) in 2010-11 relating primarily to The change in the Net Result from a $40.4 million surplus in a $7.7 million decrease in employee expenses and partly 2009-10 to a $17.3 million deficit in 2010-11 is attributable offset by a $2.2 million increase in grants and subsidies and mainly to a decrease in Commonwealth government a $1.8 million increase in supplies and services. The grants of $38 million (including a $30 million decrease in decrease in employee expenses was primarily attributable capital grants for TIIFT and BTF) and a decrease in net to a reduction in Targeted Voluntary Separation Package revenues from the South Australian government of (TVSP) costs. $17 million. The South Australian government net revenue DFEEST’s income excluding ‘Revenues from Government’ decrease relates primarily to a reduction in 2010-11 of decreased by $43.2 million (or 24.0 percent) in 2010-11, appropriation transfers from contingency provisions for driven by a $37.4 million decrease in Commonwealth once-off items, TVSPs and programs which reached their revenue. This decrease related primarily to the 2010-11 milestones. completion of two short-term Commonwealth Programs titled Training Infrastructure Investment for Tomorrow (TIIFT) and Better TAFE Facilities (BTF). BTF and TIIFT were two components of the Commonwealth’s Teaching and Learning Capital Fund and essentially one year capital programs with the majority of revenue paid in instalments during 2009-10, except the final 5 percent which was paid in 2010-11 following the acquittal of all projects to the Commonwealth. The tables provided in this section set out a summary of the actual results for the 2010-11 financial year. The detailed financial statements reflecting actual results for 2010-11 are presented under ’Financial Information’. Actual Actual 2010-11 2009-10 $’000 $’000 Statement of Comprehensive Income Expenses 535 685 537 789 Income 136 363 179 518 Net Cost of Providing Services 399 322 358 271 Revenues from Government 382 045 398 710 Net Result (17 277) 40 439 Page 114
  • 115.
    FINANCIAL PERFORMANCE OPERATING REVENUES Totaloperating revenues for 2010-11, including revenues from government were $518.4 million. The principal source of funding for DFEEST relates to state government appropriations which in 2010-11 amounted to $382 million. Other operating revenues included Commonwealth grants of $28.3 million and $95.2 million from Student and other Fees and Charges. The chart to the right depicts an overview of revenue sources for 2010-11. OPERATING EXPENSES Employee Benefits of $282.9 million amounted to 53 percent of total 2010-11 operating expenses of $535.7 million. Grants and subsidies expenses totalled $74.6 million including $24.0 million for employment programs, $22.4 million for science and information economy programs, $12.1 million for vocational education and training programs and $11.2 million for Tertiary Student Transport Concessions. The other major component of operating expenses (supplies and services) amounted to $158.0 million. Included in this category were $45.5 million for funding to non-TAFE providers for vocational education and training, $20.5 million for information technology infrastructure and communication, $20.5 million for minor works, maintenance and equipment, $17.7 million for fees for contracted services and $10.7 million for printing and consumables. A further $19.3 million was charged to Depreciation and Amortisation expense. The chart to the right depicts an overview of operating expenses for 2010-11. Page 115
  • 116.
    OVERVIEW OF OPERATINGEXPENSES 2010-11 The following table depicts how expenditure was applied to the following activities in accordance with approved strategic priorities: $ Million Employment and Skills Formation – Vocational Education and Training 443.5 Provision of post-secondary VET by TAFE SA and other registered training organisations including: - resource allocation of contestable and non-contestable funds; - funding of apprenticeships and traineeships; - support for post-secondary training and education; and - providing state and national policy advice. Employment and Skills Formation – Learning, Workforce Participation Development and Workforce Development 54.6 Addressing the state’s economic development and social inclusion objectives by: - providing opportunities for people to participate in employment, training, skills development, and adult community education; - meeting the current and future labour and skill needs of industry; and - providing state and national policy advice. Science, Technology and Innovation – Science and Innovation 15.2 Provision of high-level strategic advice to the Minister on maximising economic, environmental and social benefits from the state’s scientific research and innovation by: - identifying strategic priorities for state government investment; - raising awareness and understanding of the benefits of science and innovation amongst government, business and the community; - facilitating coordinated and strategic bids for Commonwealth grants; and - facilitating coordination of education and research activity with end-user (industry) requirements to maximise the benefits for South Australia. Science, Technology and Innovation – Bioscience Industry Development 6.9 Development of the bioscience industry through providing assistance in business development, finance, infrastructure and marketing. Page 116
  • 117.
    FINANCIAL PERFORMANCE $ Million Employment and Skills Formation – Regulatory Services 6.7 Administering the state’s further education and training system through: - provision of registration, accreditation and approval services for registered training organisations; - quality oversight of the state vocational education system, through the Training and Skills Commission; - administration of apprenticeships and traineeship system; and - providing state and national policy advice. Employment and Skills Formation – International and Higher Education 4.2 Supporting the development of Adelaide as a centre for education, international education and South Australian education exports including the provision of marketing services, analysis and student and community support. Provision of high-level strategic policy advice to the Minister on higher education policy and planning. Science, Technology and Innovation – Information Economy 2.8 Provision of high-level strategic policy advice to the Minister and government on the information economy and the ICT sector that: - raises awareness and understanding of the information economy among government, business, industry and education providers; - develops strategy and facilities programs and projects relevant to promoting the information economy; and - facilitate bids for significant Commonwealth grants. Science, Technology and Innovation – Technology Investment 1.8 Provision of seed capital and business guidance to innovative companies commercialising research and development. Total 535.7 Page 117
  • 118.
    SUSTAINABLE BUDGET COMMISSION The department had constructive engagement with the Overview of Savings Task Sustainable Budget Commission process during 2010. This Forward Estimates Savings Task for the department ($ 000) engagement resulted in budget measures of $45 million to are: be achieved by 2013-14, which are a combination of expenditure, revenue and asset sales. Number of 2010-11 2011-12 2012-13 2013-14 measures Budget Estimate Estimate Estimate 2010-11 Budget measures Included in enhanced monitoring 14 10 476 22 456 37 960 42 155 2008-09 Mid-Year Budget Review Full-time 1 587 1 798 2 445 2 494 Equivalent target Total 15 11 063 24 254 40 405 44 649 Associated Full-Time Equivalent Reduction 106.0 146.1 170.5 221.5 Detail and total as per the 2010-11 Budget Measures Statement. Overview of Implementation Plan Budget measures are a combination of expenditure The department’s priority in implementation planning efficiencies, asset sales, revenue measures and grant/ will be to both meet budget requirements and deliver service rationalisation. on the government’s objective of increasing skill levels in the labour force. Page 118
  • 119.
    FINANCIAL PERFORMANCE 5.3 AUDITEDGENERAL PURPOSE FINANCIAL REPORT STATEMENT OF COMPREHENSIVE INCOME - YEAR ENDED 30 JUNE 2011 Note 2011 2010 $'000 $'000 EXPENSES Employee Benefits 5 282,907 290,632 Supplies and Services 6 157,975 156,180 Grants and Subsidies 7 74,553 72,305 Depreciation and Amortisation 8 19,299 17,854 Net Loss from the Disposal of Non-Current Assets 15 469 131 Other Expenses 9 482 687 Total EXPENSES 535,685 537,789 INCOME Commonwealth Grants 11 28,386 65,792 Student and Other Fees and Charges 12 95,231 100,607 Other Grants and Contributions 13 8,305 9,889 Investment Income 14 323 11 Other Income 16 4,118 3,219 Total INCOME 136,363 179,518 NET COST OF PROVIDING SERVICES 399,322 358,271 REVENUES FROM/PAYMENTS TO SA GOVERNMENT Revenues from SA Government 17 394,688 408,633 Less Payments to SA Government 17 12,643 9,923 Total REVENUES FROM/PAYMENTS TO SA GOVERNMENT 382,045 398,710 NET RESULT (17,277) 40,439 OTHER COMPREHENSIVE INCOME Changes in property, plant and equipment asset revaluation surplus (2,374) 0 Change in Financial Assets Available-for-sale revaluation surplus 29 1,108 685 Total COMPREHENSIVE RESULT (18,543) 41,124 THE NET RESULT AND COMPREHENSIVE RESULT ARE ATTRIBUTABLE TO THE SOUTH AUSTRALIAN GOVERNMENT AS OWNER Page 119
  • 120.
    STATEMENT OF FINANCIALPOSITION - AS AT 30 JUNE 2011 Note 2011 2010 $'000 $'000 CURRENT ASSETS Cash and Cash Equivalents 18 64,675 85,981 Receivables 19 17,041 17,898 Inventories 23 887 972 Non-current assets classified as held for sale 20 1,578 0 Total CURRENT ASSETS 84,181 104,851 NON-CURRENT ASSETS Receivables 19 239 248 Investments 29 4,999 3,891 Property, Plant and Equipment 21 635,681 650,691 Intangibles 22 15,895 9,909 Total NON-CURRENT ASSETS 656,814 664,739 TOTAL ASSETS 740,995 769,590 CURRENT LIABILITIES Payables 24 27,612 39,407 Employee benefits 25 27,777 23,898 Provisions 26 2,101 1,934 Unearned Revenue 27 4,827 7,211 Other Current Liabilities 28 753 1,135 Total CURRENT LIABILITIES 63,070 73,585 NON-CURRENT LIABILITIES Payables 24 1,984 2,023 Employee benefits 25 48,114 48,379 Provisions 26 7,091 6,306 Total NON-CURRENT LIABILITIES 57,189 56,708 TOTAL LIABILITIES 120,259 130,293 NET ASSETS 620,736 639,297 EQUITY Retained Earnings 31 395,220 412,515 Financial Asset Available-for-Sale Revaluation surplus 31 2,395 1,287 Asset revaluation surplus 31 223,121 225,495 Total EQUITY 620,736 639,297 The Total Equity is attributable to the SA Government as owner UNRECOGNISED CONTRACTUAL COMMITMENTS 32 CONTINGENT ASSETS AND LIABILITIES 33 Page 120
  • 121.
    FINANCIAL PERFORMANCE STATEMENT OFCHANGES IN EQUITY - YEAR ENDED 30 JUNE 2011 Available-for-Sale Financial Asset Revaluation Revaluation Retained Earnings Surplus Surplus Asset Total Note $'000 $'000 $'000 $'000 Balance at 30 June 2009 225,495 602 370,929 597,026 Error Correction 0 0 (550) (550) Changes in accounting policy 3 0 0 400 400 Restated balance at 30 June 2009 225,495 602 370,779 596,876 Net Result for 2009-10 0 0 40,439 40,439 Change in Financial Assets available-for-sale 0 685 0 685 Total comprehensive result 2009-10 0 685 40,439 41,124 Net assets transferred as a result of an administrative restructure 0 0 140 140 Balance at 30 June 2010 225,495 1,287 411,358 638,140 Changes in Accounting Policy 3 0 0 1,303 1,303 Error Correction 0 0 (146) (146) Restated balance at 30 June 2010 225,495 1,287 412,515 639,297 Net Result for 2010-11 0 0 (17,277) (17,277) Change in Financial Assets available-for-sale 29 0 1,108 0 1,108 Loss on revaluation of library during 2010-11 (2,374) 0 0 (2,374) Total comprehensive result 2010-11 (2,374) 1,108 (17,277) (18,543) Net assets received as a result of an administrative restructure 34 0 0 (18) (18) Balance at 30 June 2011 223,121 2,395 395,220 620,736 All changes in equity are attributable to the SA Government as owner Page 121
  • 122.
    FINANCIAL PERFORMANCE STATEMENTOF CASH FLOWS - YEAR ENDED 30 JUNE 2011 2011 2010 $'000 $'000 Inflows Inflows Note (Outflows) (Outflows) CASH FLOWS FROM OPERATING ACTIVITIES CASH OUTFLOWS Employee benefit payments (277,944) (291,016) Payments for supplies and services (182,142) (177,081) Payments of grants and subsidies (74,553) (72,305) GST paid to the ATO (4,215) (4,126) Other payments (292) (835) Cash used in operations (539,146) (545,363) CASH INFLOWS Commonwealth grants 28,386 65,792 Student and other fees and charges 96,519 97,878 Other grants and contributions 8,305 9,831 Interest received 38 11 GST recovered from the ATO 19,650 18,566 Dividends received 285 0 Other receipts 3,969 4,453 Cash generated from operations 157,152 196,531 CASH FLOWS FROM SA GOVERNMENT: Receipts from SA Government 394,688 408,633 Payments to SA Government (12,643) (9,923) Cash generated from SA Government 382,045 398,710 Net cash provided by (used in) operating activities 37 51 49,878 CASH FLOWS FROM INVESTING ACTIVITIES Cash Outflows Purchase of property, plant and equipment (15,811) (34,418) Purchase of intangibles (5,557) (7,338) Cash used in investing activities (21,368) (41,756) Cash Inflows Proceeds from the sale of property, plant and equipment 11 613 Cash generated from investing activities 11 613 Net cash provided by (used in) investing activities (21,357) (41,143) CASH FLOWS FROM FINANCING ACTIVITIES Cash Outflows Cash transferred as a result of restructuring activities 0 (542) Net cash provided by (used in) financing activities 0 (542) NET INCREASE (DECREASE) IN CASH AND CASH EQUIVALENTS (21,306) 8,193 CASH AND CASH EQUIVALENTS AT 1 JULY 2010 85,981 77,788 CASH AND CASH EQUIVALENTS AT 30 JUNE 2011 18 64,675 85,981 Page 122
  • 123.
    DISAGGREGATED DISCLOSURES -EXPENSES AND INCOME - YEAR ENDED 30 JUNE 2011 Employment and Skills Formation Science, Technology and Innovation Learning, Workforce Vocational Participation & International Bioscience Education Workforce Regulatory and Higher Science and Information Industry Innovation and Training Develop Services Education Innovation Economy Development Investment Total $'000 $'000 $'000 $'000 $'000 $'000 $'000 $'000 $'000 Expenses Employee benefits 253,907 18,588 5,638 1,565 2,492 717 0 0 282,907 Supplies and services 148,931 5,972 1,058 1,020 509 485 0 0 157,975 Grants and subsidies 20,430 30,039 0 1,630 12,217 1,579 6,882 1,776 74,553 Depreciation and Amortisation 19,299 0 0 0 0 0 0 0 19,299 Net Loss on disposal of assets 469 0 0 0 0 0 0 0 469 Other expenses 450 15 12 2 2 1 0 0 482 Total Expenses 443,486 54,614 6,708 4,217 15,220 2,782 6,882 1,776 535,685 Income Commonwealth grants 19,722 8,621 1 0 0 42 0 0 28,386 Student and other fees and charges 94,461 93 654 9 10 4 0 0 95,231 Other grants and contributions 5,003 3,126 1 0 175 0 0 0 8,305 Investment income 295 18 5 2 2 1 0 0 323 Other income 3,688 92 38 82 145 73 0 0 4,118 Total Income 123,169 11,950 699 93 332 120 0 0 136,363 Net Cost of Providing Services 320,317 42,664 6,009 4,124 14,888 2,662 6,882 1,776 399,322 Revenues from/payments to SA Government Revenues from SA Government 311,668 46,918 6,009 4,092 14,702 2,641 6,882 1,776 394,688 Payments to SA Government (12,643) 0 0 0 0 0 0 0 (12,643) Net Result (21,292) 4,254 0 (32) (186) (21) 0 0 (17,277) Page 123
  • 124.
    DISAGGREGATED DISCLOSURES -ASSETS AND LIABILITIES - YEAR ENDED 30 JUNE 2011 Page 124 Employment and Skills Formation Science, Technology and Innovation Learning, Workforce Vocational Participation & International Bioscience General/ Education Workforce Regulatory and Higher Science and Information Industry Innovation Not and Training Develop Services Education Innovation Economy Development Investment attributable Total $'000 $'000 $'000 $'000 $'000 $'000 $'000 $'000 $'000 $'000 Assets Cash & Cash Equivalents 0 0 0 0 0 0 0 0 64,675 64,675 Receivables 12,529 66 154 1 4 0 0 0 4,526 17,280 Inventories 887 0 0 0 0 0 0 0 0 887 Non-current Assets Held for Sale 1,578 0 0 0 0 0 0 0 0 1,578 Investments 0 0 0 4,999 0 0 0 0 0 4,999 Property, Plant & Equipment 634,977 444 141 39 61 19 0 0 0 635,681 Intangibles 15,895 0 0 0 0 0 0 0 0 15,895 Total Assets 665,866 510 295 5,039 65 19 0 0 69,201 740,995 Liabilities Payables 20,218 1,483 92 22 455 462 0 0 6,864 29,596 Employee Benefits 67,630 5,340 1,619 302 838 162 0 0 0 75,891 Provisions 0 0 0 0 0 0 0 0 9,192 9,192 Unearned Revenue 4,827 0 0 0 0 0 0 0 0 4,827 Other Liabilities 464 5 0 1 0 0 0 0 283 753 Total Liabilities 93,139 6,828 1,711 325 1,293 624 0 0 16,339 120,259 Net Assets 572,727 (6,318) (1,416) 4,714 (1,228) (605) 0 0 52,862 620,736
  • 125.
    DISAGGREGATED DISCLOSURES -EXPENSES AND INCOME - YEAR ENDED 30 JUNE 2010 Employment and Skills Formation Science, Technology and Innovation Learning, Vocational Workforce International Bioscience In- Education Development Regulatory and Higher Science and Information dustry Devel- Technology and Training & Employment Services Education Innovation Economy opment Investment Total $'000 $'000 $'000 $'000 $'000 $'000 $'000 $'000 $'000 Expenses Employee benefits 270,987 11,326 4,067 872 1,483 1,897 0 0 290,632 Supplies and services 148,810 4,856 1,279 222 528 485 0 0 156,180 Grants and subsidies 29,454 15,471 360 1,617 13,362 2,898 7,556 1,587 72,305 Depreciation and Amortisation 17,854 0 0 0 0 0 0 0 17,854 Net Loss on disposal of assets 122 5 2 0 1 1 0 0 131 Other expenses 651 18 13 1 2 2 0 0 687 Total Expenses 467,878 31,676 5,721 2,712 15,376 5,283 7,556 1,587 537,789 Income Commonwealth grants 65,068 573 4 1 44 102 0 0 65,792 Student and other fees and charg- es 99,974 118 512 0 1 2 0 0 100,607 Other grants and contributions 8,619 1,266 1 2 0 1 0 0 9,889 Investment income 11 0 0 0 0 0 0 0 11 Other income 2,894 0 184 18 90 33 0 0 3,219 Total Income 176,566 1,957 701 21 135 138 0 0 179,518 Net Cost of Providing Services 291,312 29,719 5,020 2,691 15,241 5,145 7,556 1,587 358,271 Revenues from/payments to SA Government Revenues from SA Government 339,750 29,845 5,870 4,281 15,062 4,682 7,556 1,587 408,633 Payments to SA Government (9,923) 0 0 0 0 0 0 0 (9,923) Net Result 38,515 126 850 1,590 (179) (463) 0 0 40,439 Page 125
  • 126.
    DISAGGREGATED DISCLOSURES -ASSETS AND LIABILITIES - YEAR ENDED 30 JUNE 2010 Page 126 Employment and Skills Formation Science, Technology and Innovation Learning, Vocational Workforce International Bioscience General/ Education Development & Regulatory and Higher Science and Information Industry Technology Not and Training Employment Services Education Innovation Economy Development Investment attributable Total $'000 $'000 $'000 $'000 $'000 $'000 $'000 $'000 $'000 $'000 Assets Cash & Cash Equivalents 0 0 0 0 0 0 0 0 85,981 85,981 Receivables 12,232 0 637 4 2 22 0 0 5,249 18,146 Inventories 972 0 0 0 0 0 0 0 0 972 Non-current Assets Held for Sale 0 0 0 0 0 0 0 0 0 0 Investments 0 0 0 3,891 0 0 0 0 0 3,891 Property, Plant & Equipment 650,497 115 39 6 15 19 0 0 0 650,691 Intangibles 9,909 0 0 0 0 0 0 0 0 9,909 Total Assets 673,610 115 676 3,901 17 41 0 0 91,230 769,590 Liabilities Payables 26,443 1,947 55 109 15 142 0 0 12,719 41,430 Employee Benefits 66,939 2,942 1,306 178 407 505 0 0 0 72,277 Provisions 0 0 0 0 0 0 0 0 8,240 8,240 Unearned Revenue 7,211 0 0 0 0 0 0 0 0 7,211 Other Liabilities 1,031 5 1 0 0 0 0 0 98 1,135 Total Liabilities 101,624 4,894 1,362 287 422 647 0 0 21,057 130,293 Net Assets 571,986 (4,779) (686) 3,614 (405) (606) 0 (0) 70,173 639,297
  • 127.
    FINANCIAL PERFORMANCE NOTES TOTHE STATEMENT OF COMPREHENSIVE INCOME 1. Agency Objectives and Funding (a) Objectives To develop the skills and capability of the state’s workforce and to maximise the opportunities for all South Australians to engage in work. The portfolio plays a central role in achieving 14 of South Australia’s Strategic Plan targets in the areas of employment, education and training, and science, technology and innovation. The Department of Further Education, Employment, Science and Technology (the Department) undertakes a range of functions in order to meet its objectives and contribute to the achievement of South Australia’s Strategic Plan objectives and targets. This includes:  in conjunction with the Training and Skills Commission, the provision of strategic policy advice for developing the state’s workforce;  ensuring high quality vocational education and training (VET) delivered by TAFE institutes, private registered training organisations and adult community education providers;  regulation of VET organisations, university and non-university higher education providers, and providers of English language intensive courses for overseas students;  regulation, administration and funding of apprenticeships and traineeships;  managing State funded employment and community development programs;  supporting the Government’s strategic direction in the higher education sector;  raising the profile of South Australia in the international education market place;  developing policies and strategies, and delivery of programs, that create opportunities for Aboriginal people, young people, people with a disability and older workers; and  provision of strategic advice and delivery of programs in the areas of science, technology, information economy and innovation policy. (a) Funding The Department is predominantly funded by State Government appropriations supplemented by Commonwealth grants. In addition income is generated from sales and fee for service. These include:  student fees and charges;  training for various organisations;  sale of curriculum material;  hire of facilities and equipment. The financial activities of the Department are primarily conducted through a Special Deposit Account with the Department of Treasury and Finance pursuant to Section 8 of the Public Finance and Audit Act 1987. The Special Deposit Account is used for funds provided by State Government appropriation, Commonwealth grants and revenues from fees and charges. Page 127
  • 128.
    NOTES TO THESTATEMENT OF COMPREHENSIVE INCOME (a) Principles of Consolidation Associates Associates are all entities over which the Department has significant influence but not control, generally accompanying a shareholding of between 20 percent and 50 percent of the voting rights. The Minister for Employment, Training and Further Education has a 100% interest in Austraining International Pty Ltd. Although the Minister has control over Austraining it is not considered part of the Department’s operations. The Department cannot influence the decisions of Austraining, nor can the Department dominate the financial and operational policies of Austraining. Consequently, Austraining has not been consolidated in the accounts. The value of Austraining is shown in the Statement of Financial Position under Investments. Details of the investment in Austraining International Pty Ltd are set out in Note 29. The Minister for Employment, Training and Further Education has a 25% interest in SABRENet. SABRENet was registered on 28 September 2005 as a non-profit company limited by guarantee and has been recognised by the ATO as a tax exempt entity. The founding members are the three South Australian Universities and the South Australian Government. The objects for which the company was established are to be a non-profit institution to further the use of advanced data networking for the conduct of research and education in South Australia for the benefit of South Australia and for the purposes of economic and social advancement in Australia generally. While the Minister has significant influence over SABRENet, his interest in SABRENet is limited to his use of SABRENet’s asset (the network). That is, the Minister receives no return for its interest in SABRENet. SABRENet is not accounted for using the equity method as the Minister does not have access to the residual assets of the entity. Institute Councils are established under section 28 of the Technical and Further Education (TAFE) Act. The council works with the directors of the TAFE institutes in the development of the business plans and monitors the performance of the institutes. At 30 June 2011 the three institute councils held an aggregate balance of $1.4 million. This balance is held in an interest-bearing section 21 deposit account with the Department of Treasury and Finance. Joint Venture Entities The Department has a 25% interest in the South Australian Tertiary Admissions Centre (SATAC). The interests in this joint venture are not considered to be material to the Department’s core activities. Consequently, they have not been taken up in the accounts on an equity basis as per AASB 131 Interests in Joint Ventures. SATAC is a joint venture of the three South Australian universities and the Minister for Education, Training and Employment. SATAC receives and processes undergraduate and postgraduate applications for admission to TAFE SA, Charles Darwin University and the three universities in South Australia. Page 128
  • 129.
    FINANCIAL PERFORMANCE NOTES TOTHE STATEMENT OF COMPREHENSIVE INCOME 2. Summary of Significant Accounting Policies (a) Statement of Compliance The financial statements are general purpose financial statements. The accounts have been prepared in accordance with relevant Australian Accounting Standards and Treasurer's Instructions and Accounting Policy Statements promulgated under the provision of the Public Finance and Audit Act 1987. Except for AASB 2009-12, which the department has early adopted, Australian Accounting standards and interpretations that have recently been issued or amended but are not yet effective have not been adopted by the department for the reporting period ending 30 June 2010. These are outlined in Note 3. (b) Basis of Preparation The preparation of the financial statements requires:  the use of certain accounting estimates and requires management to exercise its judgement in the process of applying the Department’s accounting policies. The areas involving a higher degree of judgement or where assumptions and estimates are significant to the financial statements are outlined in the applicable notes;  accounting policies are selected and applied in a manner which ensures that the resulting financial information satisfies the concepts of relevance and reliability, thereby ensuring that the substance of the underlying transactions or other events are reported;  compliance with accounting policy statements issued pursuant to section 41 of the Public Finance and Audit Act 1987. In the interest of public accountability and transparency the Accounting Policy Statements require the following note disclosures, that have been included in these financial statements: (a) revenues, expenses, financial assets and liabilities where the counterparty/transaction is with an entity within the SA Government as at reporting date, classified according to their nature. A threshold of $100 000 for separate identification of these items applies; (b) expenses incurred as a result of engaging consultants (as reported in the Statement of Comprehensive Income); (c) employees whose normal remuneration is equal to or greater than the base executive remuneration level (within $10 000 bandwidths) and the aggregate of the remuneration paid or payable or otherwise made available, directly or indirectly by the entity to those employees; and (d) board/committee member and remuneration information, where a board/committee member is entitled to receive income from membership other than a direct out-of-pocket reimbursement; (e) employee targeted voluntary separation package information. The Department’s Statement of Comprehensive Income, Statement of Financial Position and Statement of Changes in Equity have been prepared on an accrual basis and are in accordance with historical cost convention, except for certain assets that have been valued in accordance with the valuation policy applicable. The Statement of Cash Flows has been prepared on a cash basis. The financial statements have been prepared based on a twelve month period and presented in Australian currency. The accounting policies set out below have been applied in preparing the financial statements for the year ended 30 June 2011 and the comparative information presented for the year ended 30 June 2010. Page 129
  • 130.
    NOTES TO THESTATEMENT OF COMPREHENSIVE INCOME (c) Reporting Entity The Department is a government department of the State of South Australia, established pursuant to the Public Sector Act 2009. The Department is an administrative unit acting on behalf of the Crown. The financial statements and accompanying notes reflect the use of assets, liabilities, revenues and expenses controlled or incurred by the Department in its own right. Transactions and balances relating to administered resources are not recognised as departmental income, expense, assets and liabilities. As administered items are insignificant in relation to the department’s overall financial performance and position, they are disclosed in summary in Note 39 Administered Items. Except as otherwise disclosed, administered items are accounted for on the same basis and using the same accounting policies as for departmental items. (d) Transferred Functions The Public Sector (Reorganisation of Public Sector Operations) Notice 2010 (dated 1 July 2010) declared that:  The Bragg Institute and Royal Institution of Australia (RiAus) was transferred from the Department of Premier and Cabinet to the Department of Further Education, Employment, Science and Technology, effective 1 July 2010 (refer to Note 34). (e) Comparative Information The presentation and classification of items in the financial statements are consistent with prior periods except where specific accounting standards and/or Accounting Policy Statements has required a change. Where presentation or classification of items in the financial statements has been amended, comparative amounts have been reclassified unless reclassification is impracticable. The restated comparative amounts do not replace the original financial statements for the preceding period. (f) Income and Expenses Income and expenses have been classified according to their nature and have not been offset unless required or permitted by a specific accounting standard, or where offsetting reflects the substance of the transaction or other event. Income Income is recognised to the extent that it is probable that the flow of economic benefits to the Department will occur and can be reliably measured. The following are specific recognition criteria:  Income from fees and charges is derived from the provision of goods and services to other SA government agencies and to other clients and is recognised when invoices are raised.  Income from disposal of non-current assets is recognised when control of the asset has passed to the buyer and determined by comparing proceeds with carrying amount.  Income from grants is recognised upon receipt of funding.  Interest income is recognised as it accrues. Dividend income is recognised only when it is declared.  Contribution income is recognised when control of the contribution or the right to receive the contribution and the income recognition criteria are met.  Appropriations for program funding are recognised as revenues when the Department obtains control over the funding. Control over appropriations is normally obtained upon their receipt. Payments to the SA Government include the return of surplus cash pursuant to the cash alignment policy. Page 130
  • 131.
    FINANCIAL PERFORMANCE NOTES TOTHE STATEMENT OF COMPREHENSIVE INCOME Expenses Expenses are recognised to the extent that it is probable that the flow of economic benefits from the Department will occur and can be reliably measured. The following are specific recognition criteria: Employee benefit expense Employee benefit expense includes all costs related to employment including wages and salaries and leave entitlements. These are recognised when incurred. In regards to superannuation expenses, the amount charged to the Statement of Comprehensive Income represents the contributions made by the Department to the superannuation plan in respect of current services of current departmental staff. The Department of Treasury and Finance centrally recognises the superannuation liability in the whole of government financial statements. Grant expenses Grants are amounts provided by the Department to entities for capital, specific or recurrent purposes and the name or category reflects the use of the grant. The grants given are usually subject to terms and conditions set out in the contract, correspondence, or by legislation. The grants are paid when the conditions set out in the contract or correspondence are met. (g) Current and Non-Current Classification Assets and liabilities are characterised as either current or non-current in nature. Assets and liabilities that are sold, consumed or realised as part of the normal operating cycle even when they are not expected to be realised within twelve months after the reporting date have been classified as current assets or current liabilities. All other assets and liabilities are classified as non-current. Where asset and liability line items combine amounts expected to be realised within twelve months and more than twelve months, the Department has separately disclosed the amounts expected to be recovered or settled after more than twelve months. (h) Events after the end of the reporting period Note disclosure is made about events between 30 June and the date the financial statements are authorised for issue where the events relate to a condition which arose after 30 June and which may have a material impact on the results of subsequent years (refer to Note 35). (i) Cash and cash equivalents Cash and cash equivalents in the Statement of Financial Position include cash at bank and on hand. For the purposes of the Statement of Cash Flows, cash and cash equivalents includes cash at bank and cash on hand. Cash is measured at nominal value. Page 131
  • 132.
    NOTES TO THESTATEMENT OF COMPREHENSIVE INCOME (j) Receivables Receivables include amounts receivable from trade, prepayments and other accruals. Trade receivables arise in the normal course of providing goods and services to other agencies and to the public. Trade receivables are generally receivable within 30 days after the issue of an invoice or the goods/services have been provided under a contractual arrangement. The recoverability of trade receivables is reviewed on an ongoing basis. Debts that are known to be uncollectible are written off when identified. An allowance for doubtful debts is raised when there is objective evidence that the Department will not be able to collect the debt. (k) Inventory Inventories include goods and other property held either for sale or distribution at no or nominal cost in the ordinary course of business. Inventories held for distribution at no or nominal consideration, are measured at cost and adjusted when applicable for any loss of service potential. Inventories held for sale are measured at the lower of cost or their net realisable value. Cost is assigned to low volume inventory items on a specific identification of cost basis. Inventories comprise of learning modules, food and wine, wine making equipment, books, stationery, hair and beauty products and timber supplies. The amount of any inventory write-down to net realisable value/replacement cost or inventory losses is recognised as an expense in the period the write-down or loss occurred. Any write-down reversals are recognised as an expense reduction. Bases used in assessing loss of service potential for inventory held for distribution at no or minimal cost include current replacement cost and technological or functional obsolescence. (l) Non-Current assets held for sale Non-current assets are classified as held for sale and stated at the lower of their carrying amount and fair value less costs to sell if their carrying amount will be recovered principally through a sale transaction rather than through continuing use. This condition is regarded as met only when the sale is highly probable and the asset’s sale is expected to be completed one year from the date of classification. Non-current assets classified as held for sale are presented separately from the other assets in the Statement of Financial Position. (m) Property, Plant and Equipment Non-current assets are initially recorded at cost or at the value of any liabilities assumed, plus any incidental cost involved with the acquisition. Non-current assets (excluding land) are subsequently measured at fair value less accumulated depreciation. Where assets are acquired for no consideration, or minimal value, they are recorded at their fair value in the Statement of Financial Position. However, if the assets are acquired at no or nominal value as part of a restructure of administrative arrangements then the assets are recognised at book value, ie the amount recorded by the transferor public authority immediately prior to the restructure. Componentisation of complex assets is only performed when the complex asset’s fair value at the time of acquisition is greater than $1 million. Page 132
  • 133.
    FINANCIAL PERFORMANCE NOTES TOTHE STATEMENT OF COMPREHENSIVE INCOME Revaluation of non-current assets All non-current assets are valued at written down current cost (a proxy for fair value); and revaluation of non-current assets or group of assets is only performed when its fair value at the time of acquisition is greater than $1 million and estimated useful life is greater than three years. Every three years, the Department revalues its land, buildings, improvements and libraries. However, if at any time management considers that the carrying amount of an asset materially differs from its fair value, then the asset will be revalued regardless of when the last valuation took place. Non-current assets that are acquired between revaluations are held at cost until the next valuation, where they are revalued to fair value. Any revaluation increment is credited to the asset revaluation surplus, except to the extent that it reverses a revaluation decrement of the same asset class previously recognised as an expense, in which case the increase is recognised as income in the Statement of Comprehensive Income. Any revaluation decrement is recognised in the Statement of Comprehensive Income as an expense, except to the extent that it offsets a previous revaluation increment for the same asset class, in which case the decrease is debited directly to the asset revaluation surplus to the extent of the credit balance existing in the revaluation surplus for that asset class. The valuation methodology applied to specific classes of non-current assets under revaluations is as follows: Land Land is recorded on the basis of existing use market value. The most recent valuations for land were conducted as at 30 June 2009 by Liquid Pacific and Valcorp Aust Pty Ltd, independent valuers, on the basis of existing use market value. Buildings and Improvements Buildings and improvements are valued at written down current cost. The building data provided in the statements relates specifically to buildings, paved areas, utility reticulation, fencing, sheds and other site infrastructure assets. The most recent valuations for building and infrastructure assets were conducted as at 30 June 2009 by Liquid Pacific and Valcorp Aust Pty Ltd, independent valuers, on the basis of written down current cost. Buildings under construction are recorded as work in progress and are valued at cost. Library Collection The library collection is recorded at replacement value. The most recent valuation was carried out as at 30 June 2011 by the Australian Valuation Office, an independent valuer, on the basis of depreciated replacement cost (a proxy for fair value). Plant and Equipment Items of plant and equipment are recorded at fair value less accumulated depreciation. All Plant and Equipment assets with a value of $10,000 or greater are capitalised. Items under $10,000 are recorded in the Statement of Comprehensive Income as an expense in the accounting period in which they are acquired. Page 133
  • 134.
    NOTES TO THESTATEMENT OF COMPREHENSIVE INCOME Intangibles An intangible asset is an identifiable non-monetary asset without physical substance. Intangible assets are measured at cost. Following initial recognition, intangible assets are carried at cost less any accumulated amortisation and any accumulated impairment losses. The useful lives of intangible assets are assessed to be either finite or indefinite. The department only has intangible assets with finite lives. The amortisation period for the intangible assets is reviewed on an annual basis. The acquisition of or internal development of software is capitalised only when the expenditure meets the definition criteria (identifiability, control and the existence of future economic benefits) and recognition criteria (probability of future economic benefits and cost can be reliably measured) and when the amount of expenditure is greater than or equal to $10,000. All research and development costs that do not meet the capitalisation criteria outlined in AASB 138 are expensed. (n) Impairment All non-current assets are tested for indications of impairment at each reporting date. Where there is an indication of impairment, the recoverable amount is estimated. An amount by which the asset’s carrying amount exceeds the recoverable amount is recorded as an impairment loss. For revalued assets an impairment loss is offset against the asset revaluation surplus. (o) Depreciation and amortisation of Non-Current Assets Non-current assets are systematically depreciated/amortised using the straight-line method of depreciation over their useful lives. Amortisation is used in relation to intangible assets such as software, while depreciation is applied to tangible assets such as property, plant, equipment and libraries. All assets are depreciated/amortised from the first day of the acquisition month. This method is considered to reflect the consumption of their service potential. The Department reviews useful lives of assets annually. Land and non-current assets held for sale are not depreciated. Depreciation/amortisation is calculated on a straight line basis over the estimated useful life of the following classes of assets as follows: Useful life (Years) Buildings 15 - 60 Improvements 5 - 25 Paved areas 40 - 50 Computing and communication equipment 1 - 20 Other plant and equipment 1 - 47 Library collection 12 - 15 Intangibles 10 - 15 Page 134
  • 135.
    FINANCIAL PERFORMANCE NOTES TOTHE STATEMENT OF COMPREHENSIVE INCOME (p) Payables Payables include creditors, accrued expenses and employment on-costs. Creditors represent the amounts owing for goods and services received prior to the end of the reporting period that are unpaid at the end of the reporting period. Creditors include all unpaid invoices received relating to the normal operations of the Department. Accrued expenses represent goods and services provided by other parties during the period that are unpaid at the end of the reporting period and where an invoice has not been received. All payables are measured at their nominal amount, are unsecured and are normally settled within 30 days from the date of the invoice or date the invoice is first received. Employee benefit on-costs include superannuation contributions, workers compensation and payroll tax with respect to outstanding liabilities for salaries and wages, long service leave and annual leave. Payroll tax is a State tax levied on total gross salary paid plus (non-cash) benefits and employer superannuation contributions. The estimated amount of payroll tax payable in respect of employee benefits liabilities is also shown as a payable in the Statement of Financial Position. Any increase or decrease in the level of required payroll tax provision is charged as an increase or decrease in the payroll tax expense in the Statement of Comprehensive Income. The payroll tax liability is only payable when employee benefits are paid. The Department makes contributions to several State Government and externally managed superannuation schemes. These contributions are treated as an expense when they occur. There is no liability for payments to beneficiaries as they have been assumed by the respective superannuation schemes. The only liability outstanding at balance date relates to any contributions due but not yet paid to the South Australian Superannuation Board and externally managed schemes. (q) Employee Benefit and Employment Related Liabilities Liabilities have been established for various employee benefits arising from services rendered by employees to balance date. Employee benefits include entitlements to wages and salaries, long service leave, annual leave and non-attendance days. Long-term benefits are measured at present value and short-term employee benefits are measured at nominal amounts. Non-attendance days are accrued annually for employees engaged under the Technical and Further Education Act 1975 but are non-cumulative. Employment related expenses include on-costs such as employer superannuation and payroll tax on employee entitlements together with the workers’ compensation insurance premium. These are reported under Payables as on-costs on employee benefits (refer Note 24). Salaries, wages, annual leave and non-attendance days Liabilities for salaries and wages are measured as the amount unpaid at the reporting date at remuneration rates current at reporting date. The annual leave liability is expected to be payable within twelve months and is measured at the undiscounted amount expected to be paid. In the unusual event where salary and wages and annual leave are payable later than 12 months, the liability will be measured at present value. Page 135
  • 136.
    NOTES TO THESTATEMENT OF COMPREHENSIVE INCOME Long service leave The liability for long service leave is recognised after an employee has completed six and a half years of service. An actuarial assessment of long service leave undertaken by the Department of Treasury and Finance based on a significant sample of employees throughout the South Australian public sector determined that the liability measured using the short hand method was not materially different from the liability measured using the present value of expected future payments. This calculation is consistent with the Department’s experience of employee retention and leave taken. Sick leave Sick leave is not provided for in the financial report, as it is non-vesting and the average sick leave taken in future years by employees is estimated to be less than the annual entitlement for sick leave. (r) Financial Assets (Investment) In accordance with AASB 139 other financial assets are classified into the following specified categories: financial assets 'at fair value through profit or loss', 'held-to-maturity' investments, 'available-for-sale' financial assets, and 'loans and receivables'. The classification depends on the nature and purpose of the financial assets and is determined at the time of initial recognition. Available-for-sale financial assets Certain shares held are classified as being available-for-sale and are stated at fair value less impairment. Gains and losses arising from changes in fair value are recognised directly in the available-for-sale revaluation surplus, until the investment is disposed of or is determined to be impaired, at which time the cumulative gain or loss previously recognised in the available-for-sale revaluation surplus is included in profit or loss for the period. This category includes investments classified as ‘available-for- sale’ and any investments that do not fit the definitions for inclusion in any of the categories contained in AASB 139. Consequently it should not be assumed that the Department has plans to dispose of these assets. (s) Provisions A liability has been reported to reflect unsettled workers compensation claims. The workers compensation provision is based on an actuarial assessment performed by the Public Sector Workforce Relations Division of the Department of the Premier and Cabinet. Provisions are recognised when the Department has a present obligation as a result of a past event, it is probable that an outflow of resources embodying economic benefits will be required to settle the obligation and a reliable estimate can be made of the amount of the obligation. When the department expects some or all of a provision to be reimbursed, the reimbursement is recognised as a separate asset but only when the reimbursement is virtually certain. The expense relating to any provision is presented in the Statement of Comprehensive Income net of any reimbursement. Provisions are measured at the present value of management’s best estimate of the expenditure required to settle the present obligation at the Statement of Financial Position date. If the effect of the time value of money is material, provisions are discounted for the time value of money and the risks specific to the liability. Page 136
  • 137.
    FINANCIAL PERFORMANCE NOTES TOTHE STATEMENT OF COMPREHENSIVE INCOME (t) Leases The Department has entered into a number of operating lease agreements, as lessee, for buildings and other facilities where the lessors effectively retain all risks and benefits incidental to ownership of the items held under the operating leases. Operating lease payments are recognised as an expense in the Statement of Comprehensive Income on a straight-line basis over the lease term. The straight-line basis is representative of the pattern of benefits derived from the leased assets. Details of commitments of current non-cancellable operating leases are disclosed at Note 32. (u) Accounting for Taxation The Department is not subject to income tax. The Department is liable for payroll tax, fringe benefits tax, goods and services tax (GST), emergency services levy and local government rate equivalents. Income, expenses and assets are recognised net of the amount of GST except:  when the GST incurred on a purchase of goods or services is not recoverable from the Australian Taxation Office, in which case the GST is recognised as part of the cost of acquisition of the asset or as part of the expense item applicable; and  receivables and payables, which are stated with the amount of GST included. The net amount of GST recoverable from, or payable to, the Australian Taxation Office is included as part of receivables or payables in the Statement of Financial Position. Cash flows are included in the Statement of Cash Flows on a gross basis and the GST component of cash flows arising from investing and financing activities, which is recoverable from, or payable to, the Australian Taxation Office is classified as part of operating cash flows. Unrecognised Contractual Commitments and contingencies are disclosed net of the amount of GST recoverable from, or payable to the Australian Taxation Office. If GST is not payable to, or recoverable from the Australian Taxation Office, the commitments and contingencies are disclosed on a gross basis. (v) Financial Guarantees At the time a financial guarantee contract is issued, it is recognised as a liability initially measured at fair value. If there is a material increase in the likelihood that the guarantee may have to be exercised, the financial guarantee is measured at the higher of the amount determined in accordance with AASB 137 Provisions, Contingent Liabilities and Contingent Assets and the amount initially recognised less cumulative amortisation, where appropriate. In the determination of fair value, consideration is given to the following factors:  the overall capital management / prudential supervision framework in operation;  the protection provided by the State Government by way of funding should the probability of default increase;  the probability of default by the guaranteed party; and  the likely loss to the Department in the event of default. The Department has reviewed its financial guarantees and determined that there is no material liability to be recognised for financial guarantee contracts as at 30 June 2011 (there was no material liability recognised for financial guarantee contracts in 2010). Whilst no liability has been recognised for financial guarantee contracts, further note disclosures relating to financial guarantees are contained at Note 33 Contingent Assets and Liabilities. Page 137
  • 138.
    NOTES TO THESTATEMENT OF COMPREHENSIVE INCOME (w) Unrecognised contractual commitments and contingent assets and liabilities Commitments include those operating, capital and outsourcing commitments arising from contractual or statutory sources and are disclosed at their nominal value. Contingent assets and contingent liabilities are not recognised in the Statement of Financial Position, but are disclosed by way of a note and, if quantifiable, are measured at nominal value. Unrecognised contractual commitments and contingencies are disclosed net of the amount of GST recoverable from, or payable to the Australian Taxation Office. If GST is not payable to, or recoverable from the Australian Taxation Office, the commitments and contingencies are disclosed on a gross basis. (x) Rounding All amounts in the financial statements and accompanying notes have been rounded to the nearest thousand dollars ($’000). 3. Changes in Accounting Policies In accordance with the amendments to APS 4.8 within Accounting Policy Framework II General Purpose Financial Statements Framework, effective 1 July 2010, the Department has disclosed all employees whose normal remuneration is equal to or greater than the base executive level remuneration. Previously APS 4.8 within APF II required the Department to disclose all employees whose normal remuneration was equal to or greater than $100,000. This change is reflected in Note 5. During 2010-11 the Department changed various asset policies to improve alignment with the Department of Treasury and Finance’s Accounting Policy Framework III Asset Accounting Framework. These changed policies have resulted in the recognition of intangible assets above $10,000 for the period ending 30 June 2011 as well as the recognition of intangible assets above $10 000 in prior periods. The impact on prior periods has been disclosed within the Statement of Changes in Equity. Except for AASB 2009-12, which the department has early-adopted, the Australian accounting standards and interpretations that have recently been issued or amended but are not yet effective, have not been adopted by the department for the period ending 30 June 2011. The department has assessed the impact of the new and amended standards and interpretations and considers there will be no impact on the accounting policies or the financial statements of the department. Page 138
  • 139.
    FINANCIAL PERFORMANCE NOTES TOTHE STATEMENT OF COMPREHENSIVE INCOME 4. Activities and sub-activities Activities - Employment and Skills Formation Description/Objective: To strengthen the economic prosperity and social well-being of South Australians through strategic employment, skills formation and workforce development. Sub-activities - Vocational Education and Training Provision of post secondary vocational education and training (VET) by TAFE SA and other registered training organisations including:  resource allocation of contestable and non-contestable funds;  funding of apprenticeships and traineeships;  support for post secondary training and education; and  providing state and national policy advice. Sub-activities - Learning, Workforce Participation Development and Workforce Development Addressing the State’s economic development and social inclusion objectives by:  providing opportunities for people to participate in employment, training, skills development, and adult community education;  meeting the current and future labour and skill needs of industry; and  providing state and national policy advice. Sub-activities - Regulatory Services Administering the state’s further education and training system through:  provision of registration, accreditation and approval services for registered training organisations;  quality oversight of the state vocational education system, through the Training and Skills Commission;  administration of apprenticeships and traineeship system; and  providing state and national policy advice Sub-activities - International and Higher Education Supporting the development of Adelaide as a centre for education, international education and South Australian education exports including the provision of marketing services, analysis and student and community support. Provision of high-level strategic policy advice to the Minister on higher education policy and planning. Page 139
  • 140.
    NOTES TO THESTATEMENT OF COMPREHENSIVE INCOME Activities - Science, Technology and Innovation Description/Objective: Provides the Government’s principal strategic focus for science, technology, information economy and innovation policy development and program delivery that links government, business, industry and education sectors. Sub-activities - Science and Innovation Provision of high level strategic advice to the Minister on maximising economic, environmental and social benefits from the State’s scientific research and innovation by:  identifying strategic priorities for State Government investment;  raising awareness and understanding of the benefits of science and innovation amongst government, business and the community;  facilitating coordinated and strategic bids for Commonwealth grants; and  facilitating coordination of education and research activity with end-user (industry) requirements to maximise the benefits for South Australia. Sub-activities - Information Economy Provision of high level strategic policy advice to the Minister and Government on the information economy and the ICT sector that:  raises awareness and understanding of the information economy among government, business, industry and education providers;  develops strategy and facilities programs and projects relevant to promoting the information economy; and  facilitate bids for significant Commonwealth grants. Sub-activities – Bioscience Industry Development Development of the bioscience industry through providing assistance in business development, finance, infrastructure and marketing. Sub-activities – Innovation Investment Provision of seed capital and business guidance to innovative companies commercialising research and development. Page 140
  • 141.
    FINANCIAL PERFORMANCE NOTES TOTHE STATEMENT OF COMPREHENSIVE INCOME 2011 2010 $'000 $'000 5 Employee Benefits Salaries and Wages (including Annual Leave) 227,305 222,387 Superannuation 23,888 23,543 Payroll Tax 13,020 12,942 Long Service Leave 10,340 8,876 Workers’ Compensation 3,730 3,827 Targeted Voluntary Separation Payments 3,681 18,006 Other Employee Related Costs 943 1,051 282,907 290,632 Targeted Voluntary Separation Packages (TVSP's) Amount paid to these employees: TVSP's 3,681 18,006 Annual Leave and Long Service Leave Accrued paid during the Period 1,178 5,233 4,859 23,239 Funding from the Department of Treasury and Finance (refer note 17) 3,307 9,152 Net amount paid to employees 1,552 14,087 Number of Employees who were paid TVSPs during the report- ing period 36 161 2011 2010 Remuneration of Employees The number of employees whose remuneration received or receivable falls within the following bands: $127,500 to $130,699* 0 2 $130,700 to $140,699 15 5 $140,700 to $150,699 6 4 $150,700 to $160,699 4 8 $160,700 to $170,699 2 4 $170,700 to $180,699 5 3 $180,700 to $190,699 2 2 $190,700 to $200,699 0 2 $200,700 to $210,699 2 2 $210,700 to $220,699 1 0 $220,700 to $230,699 4 2 $230,700 to $240,699 1 1 $260,700 to $270,699 2 1 $270,700 to $280,699 0 1 $280,700 to $290,699 0 1 $300,700 to $310,699Δ 1 0 $310,700 to $320,699 0 1 $320,700 to $330,699O 2 1 Page 141
  • 142.
    NOTES TO THESTATEMENT OF COMPREHENSIVE INCOME 2011 2010 ΔO $340,700 to $350,699 1 1 $350,700 to $360,699ΔO 1 2 $360,700 to $370,699Δ 2 0 $380,700 to $390,699O 0 1 $450,700 to $460,699Δ 1 0 Total number of employees 52 44 * This bandwidth has been included for the purposes of reporting comparative figures based on the executive base level remuneration rate for 2009-10. Δ This bandwidth includes employees that have received TVSP's during 2010-11. O This bandwidth includes employees that have received TVSP's during 2009-10. The table includes all employees who received remuneration equal to or greater than the base executive remuneration level during the year. Remuneration of employees reflects all costs of employment including salaries and wages, superannuation contributions, separation packages, fringe benefits tax and any other salary sacrifice benefits. The total remuneration received by these employees for the year was $10.3 million ($8.7 million). For 2010-2011, the above figures include six non-executive employees (five in 2009-10) who took a Targeted Voluntary Separation Package (TVSP's) during the year. The total remuneration received by these employees for the year was $2.2 million ($1.7 million). For 2010-11, the above figures include 4 non-executive employees (one in 2009-10) who received leave paid on termination payments during the year and were not paid TVSP's. Accounting Policy Change In accordance with the revised Accounting Policy Framework II General Purpose Financial Statements Framework, the department has changed its accounting policy and now discloses all employees who receive remuneration equal to or greater than the base executive remuneration level rather than all employees who have received remuneration equal or greater than $100,000. The impact of this change in accounting policy is the number of employees disclosed (including TVSP's) has reduced by 260 for 2011 and 218 for 2010. Page 142
  • 143.
    FINANCIAL PERFORMANCE NOTES TOTHE STATEMENT OF COMPREHENSIVE INCOME 2011 2010 $'000 $'000 6 Supplies and Services Funding to Non-TAFE Providers for Vocational Education and Training 45,474 41,731 Printing and Consumables 10,667 11,737 Minor Works, Maintenance and Equipment 18,731 19,076 Information Technology Infrastructure and Communication 20,498 17,730 Fees - Contracted Services (Including Consultants) 17,710 18,642 Trainee & Apprenticeship Reimbursements 733 996 Utilities 7,251 7,601 Cleaning 9,398 9,699 Vehicle and Travelling Expenses 6,742 6,717 Rentals and Leases 6,233 6,193 Books, Materials and Copyright 3,031 3,501 SATAC and Student Support 1,932 2,113 Other 9,575 10,444 Total Supplies and Services 157,975 156,180 Supplies and Services Provided by Entities Within the SA Government Funding to Non-TAFE Providers for Vocational Education and Training 2,381 712 Minor Works, Maintenance and Equipment 15,072 13,986 Information Technology Infrastructure and Communication 3,716 3,142 Fees - Contracted Services (Including Consultants) 8,089 8,476 Utilities 1,357 1,335 Cleaning 7,986 8,404 Vehicle and Travelling Expenses 2,878 3,005 Rentals and Leases 4,267 4,252 Other 538 562 46,284 43,874 The total supplies and services amount disclosed includes GST amounts not-recoverable from the ATO due to the Department not holding a valid tax invoice or payments relating to third party arrangements. Consultancy The number and dollar amount of Consultancies paid/payable (included in supplies and services) that fell within the following bands: # # Below $10,000 1 10 5 21 Between $10,000 and $50,000 3 62 4 129 Above $50,000 1 88 1 57 Total paid/payable to the consultants engaged (GST excl) 160 207 Page 143
  • 144.
    NOTES TO THESTATEMENT OF COMPREHENSIVE INCOME 2011 2010 $'000 $'000 7 Grants and Subsidies Employment Programs 24,029 22,116 Vocational Education and Training Programs 12,125 8,223 Science and Information Economy Programs 22,444 25,250 Tertiary Student Transport Concessions 11,157 10,965 National Training Infrastructure Program 2,135 4,526 Other Specific Grants 2,663 1,225 Total Grants and Subsidies 74,553 72,305 Grants and Subsidies Paid/Payable to Entities Within the SA Government Employment Programs 1,787 4,022 Vocational Education and Training Programs 80 1,919 Science and Information Economy Programs 11,179 12,048 Tertiary Student Transport Concessions 11,157 10,965 National Training Infrastructure Program 128 107 Other Specific Grants 974 312 25,305 29,373 8 Depreciation and Amortisation Buildings and Improvements 14,481 13,283 Plant and Equipment 2,275 2,300 Library 2,282 2,235 Intangibles 261 36 Total Depreciation and Amortisation 19,299 17,854 9 Other Expenses Audit Fees (refer note 10) 290 283 Allowance for Doubtful Debts and Debt Write-offs 190 394 Other 2 10 Total Other Expenses 482 687 10 Auditor's Remuneration Audit Fees Paid/Payable to the Auditor-General's Department 260 247 Other Audit fees 30 36 Total Auditor's Remuneration Paid/Payable 290 283 No other services were provided by the Auditor-General’s Department. Page 144
  • 145.
    FINANCIAL PERFORMANCE NOTES TOTHE STATEMENT OF COMPREHENSIVE INCOME 2011 2010 $'000 $'000 11 Commonwealth Grants Productivity Places Program 8,437 26,907 Pre-Apprenticeship Training 3,493 0 Language Literacy & Numeracy Delivery Statewide 3,322 0 Indigenous Employment Programs (IEP) Projects 2,610 0 National Training Infrastructure Program 1,540 1,228 Australian Flexible Learning Framework 1,498 0 Group Training Scheme 1,189 1,311 Training Infrastructure Investment for Tomorrow (TIIFT) 935 17,765 Better TAFE Facilities 732 13,903 Aged Care Workforce 689 0 National VET Data Strategy Action Group 500 500 Remote Indigenous Public Internet Access 42 42 Targeting Skills Needs in Regions 0 170 Skills Sub Group 0 895 TAFE Fee Waivers for Childcare Qualifications 580 640 Other Specific Commonwealth Revenue 2,819 2,431 Total Commonwealth Grants 28,386 65,792 2010-11 Commitments The Productivity Places Program received $8.4 million of Commonwealth revenue in 2010-11 which was fully spent. As part of the Pre-Apprenticeship Training Program, $3.5 million was received in 2010-11 to deliver the AKPA project under the National Partnership Agreement on Pre-Apprenticeship Training, of which $1.8 million is committed to be spent in 2011-12. The Language Literacy & Numeracy Delivery Statewide Program received $3.3 million of Commonwealth revenue in 2010-11 which was fully spent. The Indigenous Employment Programs Projects received $2.6 million of Commonwealth contributions in 2010-11 of which a commitment exists to spend the funding in the 2011-12 and 2012-13 financial years. The purpose of the funding is for six Aboriginal projects - Mentoring Aboriginal Apprentices; Mentoring Aboriginal People in Mining; Try a Trade Workshops; Pre-Employment Training; Up-skilling Indigenous Workers; Industry Clusters Training Support. The National Training Infrastructure Program received $1.5 million of Commonwealth contributions in 2010-11 which is committed to be spent in 2011-12 and out years. The committed funds are for the provision and development of skills centres and capital equipment. The Aged Care Workforce Program received $0.7 million in 2010-11 of which $0.5 million is committed to be spent in 2011-2012 as part of providing Personal Care Workers opportunities to upgrade their qualifications. The National VET Data Strategy Action Group received $0.5 million in 2010-11, of which a commitment exists to spend $0.4 million for the agreed projects of the Action Group during 2011-12 financial year. The committed funds are for the purpose of progress work of the National VET Data Strategy. Page 145
  • 146.
    NOTES TO THESTATEMENT OF COMPREHENSIVE INCOME 2009-10 Commitments The Productivity Places Program received $26.9 million of Commonwealth revenue in 2009-10, of which a commitment exists to spend $19.6 million in the 2010-11 financial year. The National Training Infrastructure Program received $1.2 million of Commonwealth contributions in 2009-10 of which a commitment exists to spend $1.2 million in the 2010-11 financial year. The committed funds are for the provision and development of skills centres and capital equipment. DFEEST has received $1.3 million of Commonwealth revenue for the Group Training Scheme in the financial year, $0.2 million of which will be incurred in the 2010-11 financial year. The National VET Data Strategy Action Group received a $0.5 million one-off grant, of which a commitment exists to utilise $0.3 million for the agreed projects of the Action Group during 2010-11 financial year. The committed funds are for the purpose of progress work of the National VET Data Strategy. The Skills Sub Group received a $0.9 million one-off grant, of which a commitment exists to spend $0.8 million for projects which align to national priorities. DFEEST has received $42,000 of Commonwealth revenue for the Remote Indigenous Public Internet Access in the financial year, $17,000 of which will be incurred in the 2010-11 financial year. 2011 2010 $'000 $'000 12 Student and Other Fees and Charges Sales/Fee for Service Revenue 57,697 63,370 Student Enrolment Fees and Charges 32,059 33,696 Other User Fees and Charges 5,475 3,541 Total Fees and Charges Received/Receivable 95,231 100,607 Fees and Charges Received/Receivable from Entities Within the SA Government Sales/Fee for Service Revenue 1,782 1,345 Student Enrolment Fees and Charges 1,874 931 Other User Fees and Charges 563 189 4,219 2,465 13 Other Grants and Contributions Grants and Subsidies Revenue 3,065 4,458 Miscellaneous Contributions 733 854 Donations 49 59 Grants from Entities Within the SA Government 4,458 4,518 Total Other Grants and Contributions 8,305 9,889 14 Investment Income Dividends (refer note 17) 285 0 Interest from Entities External to the SA Government 38 11 Total Investment Income 323 11 Page 146
  • 147.
    FINANCIAL PERFORMANCE NOTES TOTHE STATEMENT OF COMPREHENSIVE INCOME 2011 2010 $'000 $'000 15 Net (Loss)/Gain on Disposal of Non-Current Assets Land and Buildings Proceeds from Disposals 0 560 Less: Net Book Value of Assets Disposed (245) (419) (245) 141 Plant and Equipment Proceeds from Disposals 11 53 Less: Net Book Value of Assets Disposed (235) (325) (224) (272) Total Assets Total Proceeds from Disposal 11 613 Less: Net Book Value of Assets Disposed (480) (744) Total Net Loss on disposal of Non-Current Assets (469) (131) 16 Other Income Reimbursement of Travel 107 0 Recoup of Salaries 201 859 Insurance Recoveries 311 0 Grant Recoveries 579 0 Sundry Income 2,920 2,360 Total Other Income 4,118 3,219 17 Revenues from/Payments to SA Government Revenues from SA Government Appropriations from Consolidated Account Pursuant to the Appropriation Act 382,039 372,944 Accrual Appropriation 9,177 11,563 Appropriation Transfers from Contingency1 3,472 24,126 394,688 408,633 Payments to SA Government Return of Surplus Cash Pursuant to Cash Alignment Policy (11,221) (9,923) Other payments to Consolidated Account 2 (1,422) 0 (12,643) (9,923) Total Revenues from/Payments to SA Government 382,045 398,710 1 Includes an amount of $3.3 million (9.2 million) for funding of TVSP payments (Refer to note 5) 2 Includes payments to DTF for dividends received and land sales Page 147
  • 148.
    NOTES TO THESTATEMENT OF COMPREHENSIVE INCOME 2011 2010 $'000 $'000 18 Cash and Cash Equivalents Deposits with the Treasurer 59,823 51,707 Special Deposit Account with the Department of Treasury and Finance 4,798 34,209 Cash on Hand 54 65 Total Cash and Cash Equivalents 64,675 85,981 Deposits with the Treasurer Comprises funds held in the Accrual Appropriation Excess Funds Account. The balances of these funds are not available for general use (i.e. funds can only be used in accordance with the Treasurer's/Under Treasurer's approval). Interest rate risk Cash on hand is non-interest bearing. Deposits at call and with the Treasurer earn interest at a floating interest rate, based on daily bank deposit rates. The carrying amount of cash and cash equivalents represents fair value. 19 Receivables Current Fees and Charges Receivable 13,230 13,111 Less: Allowance for Doubtful Debts (2,076) (2,471) Prepayments 1,322 1,602 GST Recoverable from ATO 4,201 5,523 Other Receivables 364 133 Total Current Receivables 17,041 17,898 Non-Current Workers compensation receivable 239 248 Total Non-current Receivables 239 248 Total Receivables 17,280 18,146 Receivables from SA Government Entities Receivables 983 1,492 Workers Compensation Receivable 239 248 Prepayments 14 0 1,236 1,740 Page 148
  • 149.
    FINANCIAL PERFORMANCE NOTES TOTHE STATEMENT OF COMPREHENSIVE INCOME Movement in the allowance for doubtful debts The allowance for doubtful debts (allowance for impairment loss) is recognised when there is objective evidence (i.e. calculated on past experience and current and expected changes in client credit rating) that a receivable is impaired. An allowance for impairment loss has been recognised in 'other expenses' in the Statement of Comprehensive Income for specific debtors and debtors assessed on a collective basis for which such evidence exists. 2011 2010 $'000 $'000 Carrying amount at the beginning of the period 2,471 2,204 Increase in the allowance 192 420 Amounts written off (587) (153) Carrying amount at the end of the period 2,076 2,471 Interest rate risk Receivables are raised for all goods and services provided for which payment has not been received. Receivables are normally settled within 30 days. Trade receivables, prepayments and accrued revenues are non-interest bearing. Other than as recognised in the allowance for doubtful debts, it is not anticipated that counterparties will fail to discharge their obligations. The carrying amount of receivables approximates net fair value due to being receivable on demand. There is no concentration of credit risk. (a) Maturity analysis of receivables - Please refer to table 38.3 in Note 38. (b) Categorisation of financial instruments and risk exposure information - Please refer to note 38. 20 Non-Current Assets Held for Sale Land at Fair Value 1,578 0 1,578 0 During 2010-11 land at the old Victor Harbor site was identified as surplus to requirements. It is anticipated that the land at Victor Harbor will be sold by 30 June 2012. Page 149
  • 150.
    NOTES TO THESTATEMENT OF COMPREHENSIVE INCOME 2011 2010 $'000 $'000 21 Property, Plant and Equipment Land and Buildings Land at Fair Value 154,212 155,790 Buildings and Improvements at Fair Value/Cost 938,489 924,378 Accumulated Depreciation (481,473) (468,325) Construction Work in Progress 2,065 12,562 613,293 624,405 Plant and Equipment Plant and Equipment at Cost (Deemed Fair Value) 33,457 32,498 Accumulated Depreciation (17,891) (17,149) 15,566 15,349 Libraries Libraries at Valuation 21,660 29,877 Accumulated Depreciation (14,838) (18,940) 6,822 10,937 Total Property, Plant and Equipment 1,149,883 1,155,105 Total Accumulated Depreciation at the end of the period (514,202) (504,414) Total Property, Plant and Equipment 635,681 650,691 Valuation of Libraries The valuation of Libraries was performed by Kim Adams and Ian Noble independent valuers from Aus- tralian Valuation Office as at 30 June 2011. Impairment There were no indications of impairment of property and plant and equipment assets at 30 June 2011. Page 150
  • 151.
    NOTES TO THESTATEMENT OF COMPREHENSIVE INCOME Reconciliations Reconciliations of the carrying amount of each class of non-current assets at the beginning and end of the current financial year are set out below: 1 July 2010 Net revaluation 30 June 2011 Carrying Increment/ Other Move- Carrying amount Additions Disposals (decrement) ments Depreciation amount $’000 $’000 $’000 $’000 $’000 $’000 $’000 2011 Land at fair value 155,790 0 0 0 (1,578) 0 154,212 Buildings and improvements 456,053 0 (245) 0 15,689 (14,481) 457,016 Plant & Equipment 15,349 2,727 (235) 0 0 (2,275) 15,566 Construction work in progress 12,562 5,482 0 0 (15,979) 0 2,065 Libraries at valuation 10,937 541 0 (2,374) 0 (2,282) 6,822 Sub Total 650,691 8,750 (480) (2,374) (1,868) (19,038) 635,681 1 July 2009 Net revaluation 30 June 2010 Carrying Increment/ Other Move- Carrying amount Additions Disposals (decrement) ments Depreciation amount $’000 $’000 $’000 $’000 $’000 $’000 $’000 2010 FINANCIAL PERFORMANCE Land at fair value 154,715 1,075 0 0 0 0 155,790 Buildings and improvements 440,851 0 0 0 28,485 (13,283) 456,053 Plant & Equipment 15,405 2,569 (325) 0 0 (2,300) 15,349 Construction work in progress 1,621 39,426 0 0 (28,485) 0 12,562 Libraries at valuation 12,583 589 0 0 0 (2,235) 10,937 Total 625,175 43,659 (325) 0 0 (17,818) 650,691 Page 151
  • 152.
    NOTES TO THESTATEMENT OF COMPREHENSIVE INCOME Page 152 2011 2010 $'000 $'000 22 Intangibles Computer Software 14,910 717 Accumulated amortisation (297) (36) Intangible Work in Progress 1,282 9,228 Total Computer software 15,895 9,909 The computer software predominantly relates to the department's Student Information System (SIS) with a remaining useful life of 10 years and carrying amount of $12.8 million. The department has a $1.06 million contractual commitment for the acquisition of Phoenix in 2011-2012. Impairment There were no indications of impairment on intangible assets at 30 June 2011. Reconciliations 1 July 2010 Net revaluation 30 June 2011 Carrying Increment/ Other Carrying amount Additions Disposals (decrement) Movements Amortisation amount $'000 $'000 $'000 $'000 $'000 $'000 $'000 Intangibles 681 0 0 0 14,193 (261) 14,613 Intangibles work in progress 9,228 6,247 0 0 (14,193) 0 1,282 Total 9,909 6,247 0 0 0 (261) 15,895 1 July 2009 Net revaluation 30 June 2010 Carrying Increment/ Other Carrying amount Additions Disposals (decrement) Movements Amortisation amount $'000 $'000 $'000 $'000 $'000 $'000 $'000 Intangibles 0 717 0 0 0 (36) 681 Intangible Work in Progress 881 8,347 0 0 0 0 9,228 Total 881 9,064 0 0 0 (36) 9,909
  • 153.
    FINANCIAL PERFORMANCE NOTES TOTHE STATEMENT OF COMPREHENSIVE INCOME 2011 2010 $'000 $'000 23 Inventories Current Inventories Held for Sale 492 513 Inventories Held for Distribution 395 459 Total Inventories 887 972 24 Payables Current Creditors 12,999 23,294 Accrued Expenses 9,833 11,729 Employment On-Costs 4,711 4,276 Other 69 108 Total Current Payables 27,612 39,407 Non-Current Employment on-costs 1,984 2,023 Total Non-current Payables 1,984 2,023 Total Payables 29,596 41,430 Payables to SA Government Entities Creditors 3,319 12,925 Accrued Expenses 5,656 8,406 Employment On-costs 6,695 6,299 15,670 27,630 As a result of an actuarial assessment performed by the Department of Treasury and Finance, the average factor for the calculation of employer superannuation cost on-cost has changed from the 2010 rate of 10.8 percent to 10.3 percent. These rates are used in the employment oncost calculation. Interest rate and credit risk Creditors are raised for all amounts billed but unpaid and accruals are raised where goods and services are received but an invoice has not yet been received. Sundry Creditors are normally settled within 30 days. Employment on-costs are settled when the respective employee benefit that they relate to is discharged. All payables are non-interest bearing. The carrying amount of payables represents fair value due to the amounts being payable on demand. (a) Maturity analysis of payables - Please refer to table 38.3 in Note 38. (b) Categorisation of financial instruments and risk exposure information - Please refer to note 38. Page 153
  • 154.
    NOTES TO THESTATEMENT OF COMPREHENSIVE INCOME 2011 2010 $'000 $'000 25 Employee Benefits Current Annual Leave 10,031 9,559 Long Service Leave 7,301 4,848 Accrued Salaries and Wages 5,213 4,451 Non-Attendance Days 5,232 5,040 Total Current Employee Benefits 27,777 23,898 Non-Current Employee Benefits Long Service Leave 48,114 48,379 Total Non-Current Employee Benefits 48,114 48,379 Total Employee Benefits 75,891 72,277 The total current and non-current employee benefits (i.e. aggregate employee benefit plus related on- costs) for 2011 is $32.4 million and $50.1 million respectively. As a result of an actuarial assessment performed by the Department of Treasury and Finance, the benchmark for the measurement of long service leave liability has changed from the 2010 benchmark 7 years to 6.5 years. The net financial effect of the changes in the current financial year is an increase in the long service leave liability of $0.4 million and employee benefit expense of $0.4 million. The impact on future periods is impracticable to estimate as the benchmark is calculated using a number of assumptions – a key assumption is the long-term discount rate. With current conditions, the long-term discount rate is experiencing significant movement. 26 Provisions Current Workers Compensation 2,101 1,934 2,101 1,934 Non-Current Workers Compensation 7,091 6,306 7,091 6,306 Total Provisions 9,192 8,240 Carrying amount at 1 July 8,240 7,613 Additional provisions recognised 952 627 Carrying amount at 30 June 9,192 8,240 A liability has been reported to reflect unsettled workers compensation claims. The workers compensation provision is based on an actuarial assessment performed by the Public Sector Workforce Relations Branch of the Department of the Premier and Cabinet. These claims are expected to be settled within the next financial year. Page 154
  • 155.
    FINANCIAL PERFORMANCE NOTES TOTHE STATEMENT OF COMPREHENSIVE INCOME 2011 2010 $'000 $'000 27 Unearned Revenue Unearned Revenue SA Govt Entities 0 278 Unearned Revenue Non-SA Govt Entities 4,827 6,933 4,827 7,211 28 Other Liabilities Current Deposits 655 1,037 Other Liabilities 98 98 Total Other Liabilities 753 1,135 29 Investments - Austraining International Pty Ltd Contributed Capital in Subsidiary Company (Austraining) 400 400 Share of Retained Profit 100% 100% Retained Profits Attributable to Subsidiary Company Balance at 1 July 3,891 3,206 Share of Operating Profit After Income Tax 1,108 685 Total Investments 4,999 3,891 Austraining International Pty Ltd Austraining International Pty Ltd, which has a reporting date of 30 June, is controlled by the Minister for Employment, Higher Education and Skills. Its principal activity is to secure international contracts for work in vocational education and training. The current investment value is based on unaudited financial statements as at 30 June 2011. Page 155
  • 156.
    NOTES TO THESTATEMENT OF COMPREHENSIVE INCOME Financial Asset Available-for- Asset Sale Revaluation Revaluation Retained 30 Adjustments to Equity Surplus surplus Earnings TOTAL $'000 $'000 $'000 $'000 Balance at 1 July 2009 225,495 1,287 411,508 638,290 Prior period adjustments to Work in Progress 0 0 (696) (696) Changes in Accounting Policy for Intangibles 0 0 1,703 1,703 Total Equity as at 30 June 2010 225,495 1,287 412,515 639,297 Prior period adjustments This reflects an adjustment for transactions previously recognised as assets at 30 June 2010. Changes in Accounting Policy This reflects an adjustment for intangibles due to the Department changing their accounting policy (refer note 3). The transactions adjusted were previously recognised as expenses prior to 30 June 2010. 2011 2010 $'000 $'000 31 Equity Retained earnings 395,220 412,515 Asset revaluation surplus 223,121 225,495 Financial Asset Available-for-Sale Revaluation surplus 2,395 1,287 Total Equity 620,736 639,297 The asset revaluation surplus is used to record increments and decrements in the fair value of land, buildings and libraries to the extent that they offset one another. 32 Unrecognised Contractual Commitments Remuneration Commitments Commitments for the payment of salaries and other remuneration under fixed-term employment contracts in existence at the reporting date but not recognised as liabilities are payable as follows: Within one year 5,718 10,693 Payable later than one year and not later than five years 8,008 10,677 Total Remuneration Commitments 13,726 21,370 Amounts disclosed include commitments arising from executive contracts and hourly paid instructors. The Department does not offer remuneration contracts greater than 5 years. Page 156
  • 157.
    FINANCIAL PERFORMANCE NOTES TOTHE STATEMENT OF COMPREHENSIVE INCOME 2011 2010 $'000 $'000 Capital Commitments Capital expenditure contracted for at the reporting date but are not recognised as liabilities in the financial statements are payable as follows: Within one year 1,934 7,406 Later than one year and not later than five years 681 0 Total Capital Commitments 2,615 7,406 The department's capital commitments relate to acquisition and implementation of the Phoenix information system & construction works at Berri Trade Centre. Other Commitments These amounts are due for payment: Within one year 28,167 31,040 Later than one year and not later than five years 57,337 60,710 Later than five years 1,561 2,342 Total Other Commitments 87,065 94,092 The Department's other commitments relate to agreements for Productivity Places Program contracts, cleaning contracts, and other procurement commitments. Operating Leases Commitments Commitments in relation to operating leases contracted for at the reporting date but not recognised as liabilities are payable as follows: Within one year 6,627 5,925 Payable later than one year and not later than five years 26,984 24,761 Payable later than five years 3,660 9,089 Total Operating Lease Commitments 37,271 39,775 The department's operating leases are for office accommodation and equipment. Office accommodation is leased from Department for Transport, Energy and Infrastructure. The leases are non-cancellable with some leases having the right of renewal. Rent is payable in arrears. Page 157
  • 158.
    NOTES TO THESTATEMENT OF COMPREHENSIVE INCOME 33 Contingent Assets and Liabilities The department is not aware of any contingent assets. There are a number of outstanding personal injury and common law claims not settled as at 30 June 2011 with an estimated settlement value of $77,350. The Minister for Employment, Higher Education and Skills has provided a $3.0 million guarantee to Austraining International Pty Ltd which has not been invoked as at 30 June 2011. The Minister for Employment, Higher Education and Skills has entered an agreement to provide Le Cordon Bleu with a 10 year interest free loan of $7.0 million conditional upon Le Cordon Bleu entering into a building contract for the development of Le Cordon Bleu's city training facility. 34 Transferred functions Transferred In Under the Public Sector (Reorganisation of Public Sector Operations) Notice 2010 , from 1 July 2010 the Bragg Initiative and Royal Institution of Australia (RiAus) functions were transferred from the Department of the Premier and Cabinet to the Department of Further Education, Employment, Science and Technology. The Bragg Institute transfer included 1 employee and budget funding of $0.2 million. The RiAus transfer had no net financial impact. On transfer of the Bragg Institute, the Department for Further Education, Employment, Science and Technology recognised the following liabilities: $,000 Payables 2 Employee Benefits Liability 16 Total liabilities transferred 18 Total Liabilities assumed by the department as a result of the administrative restructure were at the carrying amount of those liabilities in the transferor's Statement of Financial Position immediately prior to transfer. The net liability has been charged directly to Equity. 35 After Balance Day Events On 1 July 2011, DFEEST announced the establishment of the Office of TAFE SA. This new office will work with an interim TAFE SA Board to help re-direct TAFE SA towards demand-driven funding and increased contestability under the Skills for All initiative. 2011-2012 will be a year of transition with the aim to establish TAFE SA as a statutory authority from July 2012. The Office will be given substantial autonomy to manage the operations of TAFE SA. To highlight the separation between purchaser and provider the Office of TAFE SA will report directly to the Minister assisting the Minister for Employment, Higher Education and Skills, who will have responsibility for TAFE SA. The interim TAFE SA Board will be Chaired by the Chief Executive of DFEEST and include key Corporate Executive members as well as external members. The Chief Executive of DFEEST will remain responsible for the staffing and financial outcomes of TAFE SA until the proposed establishment of TAFE SA as a statutory authority from July 2012. Page 158
  • 159.
    FINANCIAL PERFORMANCE NOTES TOTHE STATEMENT OF COMPREHENSIVE INCOME 36 Remuneration of Board and Committee Members Members that were entitled to receive remuneration during the 2010-11 financial year were: Training and Skills Commission appointed until 31 August Adult Community Education Reference Group appointed 2010 until 31 August 2010 Prof D Bradley AC (Chair) P Wright (Chair) P Wright K Daniel P Dowd P Ronan J Giles S Schrapel Prof R Green M Smith Prof R Harris Dr M Keating AC A Smith Adult Community Education Reference Group appointed P Vaughan from 1 September 2010 until 31 August 2012 J Chapman (Deputy to P Vaughn) J Giles (Chair) I Curry (Deputy to J Giles) J McCormick S Ross P Wright Training and Skills Commission from 1 September 2010 until 31 August 2012 A Smith (Chair) Premier's Science Research Council Dr J Buchanan Prof D Bursill (Co-chair) M Silva (Deputy Chair) Dr I Chessell (Resigned December 2010) A Coker Prof B Brook P Dowd Dr I Gould J Giles Dr W Harch Dr M Keating AC Dr A Koltunow L Palmer Prof R Lewis P Vaughan Prof A Lopez I Curry (Deputy to J Giles) R McLeod T Cruickshank (Deputy to P Vaughn) (resigned June Prof T Monro 2011) D Mutton S Powell (Deputy to L Palmer) Prof R Norman (Resigned December 2010) Dr L Read Prof A Rumbold (Resigned December 2010) Training Regulation Reference Group (previously Quality Prof P Tharenou Reference Group) appointed until 31 August 2010 Dr G Todd A Smith (Chair) I Curry D Frith Audit and Risk Management Committee G Peak I McLachlan (Resigned) K Thiele W Einarson Training Regulation Reference Group appointed from 1 Arts Advisory Board September 2010 to 31 August 2012 R Archer AO (Chair) M Silva (Chair) S Bowers M Aubrey R Clemente (Resigned November 2010) I Curry K Gould D Frith S Grieve D Syme A Hann J Covernton J Macdonnell A Ford G Cobham M Hill-Smith Page 159
  • 160.
    NOTES TO THESTATEMENT OF COMPREHENSIVE INCOME The number of members whose remuneration from the entity falls within the following bands is: 2011 2010 No. of No. of members members $1 - $9 999 27 13 $30,000 - $39,999 8 6 $40,000 - $49,999 1 1 $50,000 - $59,999 0 1 36 21 Remuneration of board members reflects all costs of performing board/committee member duties including sitting fees, superannuation contributions, fringe benefits tax and any other salary sacrifice arrangements. The total remuneration received or receivable by members was $0.3 million ($0.3 million). Amounts paid to a superannuation plan for board/committee members was $18,069 ($18,689). In accordance with the Department of Premier and Cabinet Circular No. 016, government employees did not receive any remuneration for board/committee duties during the financial year. Unless otherwise disclosed, transactions between members are on conditions no more favourable than those that it is reasonable to expect the entity would have adopted if dealing with the related party at arm's length in the same circumstances. 2011 2010 $'000 $'000 37 Reconciliation of cash and cash equivalents - cash at year end as per: Cash and cash equivalents disclosed in the Statement of Financial Position 64,675 85,981 Balance as per the Cash Flow Statement 64,675 85,981 Reconciliation of Net Cash Provided by Operating Activities to Net Cost of Providing Services Net Cash Provided by Operating Activities 51 49,878 Depreciation and amortisation (19,299) (17,854) Loss on Sale of Assets (469) (131) Prior Period Adjustments 0 467 Restructure (18) 140 Increase in Employee Benefits (3,614) (218) Decrease in Receivables (866) (2,900) (Decrease)/Increase in Inventories (85) 37 Decrease in Payables 5,209 1,693 Decrease in Unearned Revenue 2,384 4,328 Decrease in Other Liabilities 382 5,626 Increase in Provisions (952) (627) Revenues from Government (394,688) (408,633) Payments to Government 12,643 9,923 Net Cost of Providing Services (399,322) (358,271) Page 160
  • 161.
    FINANCIAL PERFORMANCE NOTES TOTHE STATEMENT OF COMPREHENSIVE INCOME 38 Financial instruments Table 38.1 Categorisation of financial instruments Details of significant accounting policies and methods adopted including the criteria for recognition, the basis of measurement, and the basis on which income and expenses are recognised with respect to each class of financial asset, financial liability and equity instrument are disclosed in Note 2 Summary of significant Accounting Policies 2011 2010 Carrying Carrying Category of Financial Assets Statement of Financial amount amount and Financial Liabilities Position line item Note $'000 $'000 Financial Assets Cash and Cash Equivalents Cash and cash equivalents 18 64,675 85,981 Receivables Receivables 19 17,280 18,146 Held to maturity investments Investments 29 4,999 3,891 Financial Liabilities Financial Liabilities at cost Payables 24 29,596 41,430 Other liabilities 27, 28 5,580 8,346 Total Net Financial Assets at cost 51,778 58,242 All amounts recorded are carried at cost (not materially different from amortised cost) except for employee oncost which are determined via reference to the employee benefit liability to which they relate. Credit Risk Credit risk arises when there is the possibility of the department’s debtors defaulting on their contractual obligations resulting in financial loss to the department. The department measures credit risk on a fair value basis and monitors risk on a regular basis. The department has minimal concentration of credit risk. The department has policies and procedures in place to ensure that transactions occur with customers with appropriate credit history. The department does not engage in high risk hedging for its financial assets. Allowances for impairment of financial assets is calculated on past experience and current and expected changes in client credit rating. Currently the department does not hold any collateral as security to any of its financial assets. Other than receivables, there is no evidence to indicate that the financial assets are impaired. Refer to Note 19 for information on the allowance for impairment in relation to receivables. Page 161
  • 162.
    NOTES TO THESTATEMENT OF COMPREHENSIVE INCOME The following table discloses the ageing of financial assets, past due, including impaired assets past due. Table 38.2 Ageing analysis of financial assets Past due by Overdue for < Overdue for Overdue for Total 30 days 30 – 60 days > 60 days $’000 $’000 $’000 $’000 2011 Not impaired Receivables 13,877 538 2,865 17,280 Other financial assets 0 0 0 0 Impaired Receivables 0 0 0 0 Other financial assets 0 0 0 0 2010 Not impaired Receivables 14,681 452 3,013 18,146 Other financial assets 0 0 0 0 Impaired Receivables 0 0 0 0 Other financial assets 0 0 0 0 Page 162
  • 163.
    FINANCIAL PERFORMANCE NOTES TOTHE STATEMENT OF COMPREHENSIVE INCOME The following table discloses the maturity analysis of financial assets and financial liabilities. Table 38.3: Maturity analysis of financial assets and liabilities Contractual Maturities Carrying < 1 year 1-5 years > 5 years amount $’000 $’000 $’000 $’000 2011 Financial assets Cash & cash equivalent 64,675 64,675 0 0 Receivables 17,280 17,041 239 0 Other financial assets 4,999 0 0 4,999 Total financial assets 86,954 81,716 239 4,999 Financial liabilities Payables 29,596 27,612 1,984 0 Other financial liabilities 5,580 5,580 0 0 Total financial liabilities 35,176 33,192 1,984 0 2010 Financial assets Cash & cash equivalent 85,981 85,981 0 0 Receivables 18,146 17,898 248 0 Other financial assets 3,891 0 0 3,891 Total financial assets 108,018 103,879 248 3,891 Financial liabilities Payables 41,430 39,407 2,023 0 Other financial liabilities 8,346 8,346 0 0 Total financial liabilities 49,776 47,753 2,023 0 Page 163
  • 164.
    NOTES TO THESTATEMENT OF COMPREHENSIVE INCOME Liquidity risk Liquidity risk arises where the department is unable to meet its financial obligations as they fall due. The Department is funded principally from appropriations from the South Australian Government. The Department works with the Department of Treasury and Finance to determine the cashflows associated with its Government approved program of work and to ensure funding is provided through SA Government budgetary processes to meet the expected cashflows. The Department settles undisputed accounts within 30 days from the date of the invoice or date the invoice is first received. In the event of a dispute, payment is made 30 days from resolution. The Department's exposure to liquidity risk is insignificant based on past experience and current assessment of risk. The carrying amount of financial liabilities recorded in Table 38.1 represents the department's maximum exposure to financial liabilities. 39 Administered Items Minister's Salary and Allowances 2011 2010 $'000 $'000 Administered Expenses Employee Benefits 167 266 Total Administered Expenses 167 266 Administered Income Revenues From SA Government 167 266 Total Administered Income 167 266 Net Result 0 0 Minister's Salary and Allowances Minister's Salary and allowances represents the amount pursuant to Parliamentary Remuneration Act 1990. Page 164
  • 165.
    FINANCIAL PERFORMANCE 5.4 AccountPayment Performance The due date is defined as per 11.2 of the Treasurer’s Instruction. Unless there is a discount or a written agreement between the public authority and the creditor, payment should be within thirty days of the date of the invoice or claim. Particulars Number of Percentage of Value in $A of % of Accounts Paid Accounts Paid Accounts Paid Accounts (by Number) Paid (by Value) Paid by due date 63 893 92% $251 284 935 92% Paid within 30 days or less from 4 355 6% $19 319 106 7% due date Paid more than 30 days from 1 186 2% $3 018 502 1% due date 5.5 Consultants Details of consultancy expenditure over $10 000: The Allen Consulting Group Mineral Resources & Heavy Engineering Skills Centre To develop a report that examines the extent to which To prepare a scoping paper: Workforce Study for the the current standards adequately identify the Resource Sector in the Eyre Peninsula. requirements essential to ensuring that providers registered under the Training and Skills Development Act SA Centre for Economic Studies 2008 are able to demonstrate delivery of quality To provide an evidence base for re-prioritising all South outcomes to domestic and overseas students. Australia Works programs and services by examining selected programs that illustrates specific examples of Ferrier Hodgson ‘complementarity’ between Commonwealth and state Provide financial advice to TAFE SA following the programs. appointment of three Chief Financial Officers (one per TAFE SA Institute). Amount (excl Number of GST) consultancies Below $10 000 $9 600 1 Between $10 000 and $50 000 $62 116 3 Above $50 000 $88 240 1 Total $159 956 5 Page 165
  • 166.
  • 167.
    FINANCIAL PERFORMANCE 5.6 Certificationby Departmental Executives Page 167
  • 168.
  • 169.
  • 170.
    5.8 Contractual Arrangements 5.10 Overseas Travel The department entered into a contract with SunGard Departmental employees, including TAFE SA staff, Pty Ltd in June 2009 for the supply and installation of a new undertook overseas travel during the last year for the SIS. The system will manage all aspects in relation to the following purposes: administration of students within TAFE SA, including online enrolment, billing, issuing of parchments and maintenance - officially representing the state government via of student records. The contract expires in 2019. ministerial delegations This contract provides access to a student information - attending and presenting at conferences/seminars system that is compliant with state and Commonwealth laws - undertaking quality assurance audits of for the life of the contract. ‘Transnational’ (Offshore licensed and delivered TAFE SA courses) - conducting commercial promotion of departmental programs - undertaking marketing and recruitment to attract 5.9 Fraud full fee paying overseas students. In 2011, 66 staff travelled overseas at a total cost of $301 637. The countries most visited were Kiribati, Vietnam, As part of its risk management, the department has Singapore and Hong Kong. implemented processes for identifying and responding to the risks of fraud, including any specific risks of fraud that The biggest sources of revenue for DFEEST were: have been identified, or account balances, classes of transactions or disclosures for which a risk of fraud is likely - The AusAID Kiribati project with Austraining to exist. International, with revenue to date for Phase 1 of $639 000, and a further $350 000 due by June The department has established an audit and risk review 2012. function through its Audit and Risk Management Committee. This is supported by the department’s Internal - A series of small AusAID development programs in Audit and Risk Management Review Branch. justice and policing for the Pacific Islands completed during 2011-12, generating revenue of The Internal Audit Program, which is reviewed by the Audit approximately $120 000. and Risk Management Committee and approved by the - The Singapore Enterprise Development Chief Executive, addresses a number of potential risk areas Consultancy, which will be completed in early including internal controls over revenue, information and 2012, with a total revenue for this project of asset security and expenditure activity. $1.1 million over 2011-12. Complementing this work, the Director, Strategic Finance This does not include the economic multiplier to the state and Budgets is responsible for ongoing internal reconciling that factors in the additional spend of overseas students and controls over departmental revenue and expenditure and their visiting friends and family. liaises with the Manager, Internal Audit where abnormal variances are detected. The Strategic Finance and Budgets section also works closely with Internal Audit to oversee the implementation and monitoring of DFEEST’s Financial Management Compliance Program. No instances of fraud were found within the department during the year. Page 170
  • 171.
  • 172.
  • 173.
    GLOSSARY Page 173
  • 174.
    ABS Australian Bureau of Statistics AC Arts Adelaide College of the Arts (TAFE SA) ACE Adult Community Education AEICN Aboriginal Employers Industry Champions Network AFL Australian Football League AIIA Australian Information Industry Association AKPA Apprentice Kickstart Pre-Apprenticeship APPC Access and Participation Principal Committee APY Lands Anangu Pitjantjatjara Yankunytjatjara Lands AQF Australian Qualifications Framework AQTF Australian Quality Training Framework ASQA Australian Skills Quality Authority AusAID Australian Agency for International Development BTF Better TAFE Facilities CAPM Connecting Aboriginal People to Mining COAG Commonwealth of Australian Governments CRC Cooperative Research Centre CSIRO Commonwealth Scientific and Industrial Research Organisation DECD Department of Education and Child Development DEEWR Department of Education, Employment and Workplace Relations DFEEST Department of Further Education, Employment, Science and Technology DIC Department of Immigration and Citizenship DPTI Department of Planning, Transport and Infrastructure DSTO Defence Science and Technology Organisation ELICOS English Language Intensive Courses for Overseas Students FCEP Family Centred Employment Project FTE Full Time Employee ICT Information and Communications Technology Page 174
  • 175.
    GLOSSARY IISC Industry and Indigenous Skills Centre LSS Learner Support Service MEGA Mobile Enterprise Growth Alliance NASWD National Agreement for Skills and Workforce Development NBN National Broadband Network NCVER National Centre for Vocational Education Research NP National Partnership NPYAT National Partnership on Youth Attainment and Transitions NSAI Non Self-Accrediting Institution OHS&W Occupational Health, Safety and Welfare PPP Productivity Places Program PSRC Premier’s Science and Research Council R&D Research and Development RDA Regional Development Australia RTO Registered Training Organisation SACE South Australian Certificate of Education SASP South Australia’s Strategic Plan SATAC South Australian Tertiary Admissions Centre SCOTESE Standing Council on Tertiary Education, Skills and Employment SIEC Sustainable Industries Education Centre SIS Student Information System STEM Science, Technology, Engineering and Mathematics TaSC Training and Skills Commission TEQSA Tertiary Education Quality and Standards Agency TIIFT Training Infrastructure Investment for Tomorrow TVSP Targeted Voluntary Separation Package VET Vocational Education and Training YMCA Young Men’s Christian Association Page 175
  • 176.