Download to read offline

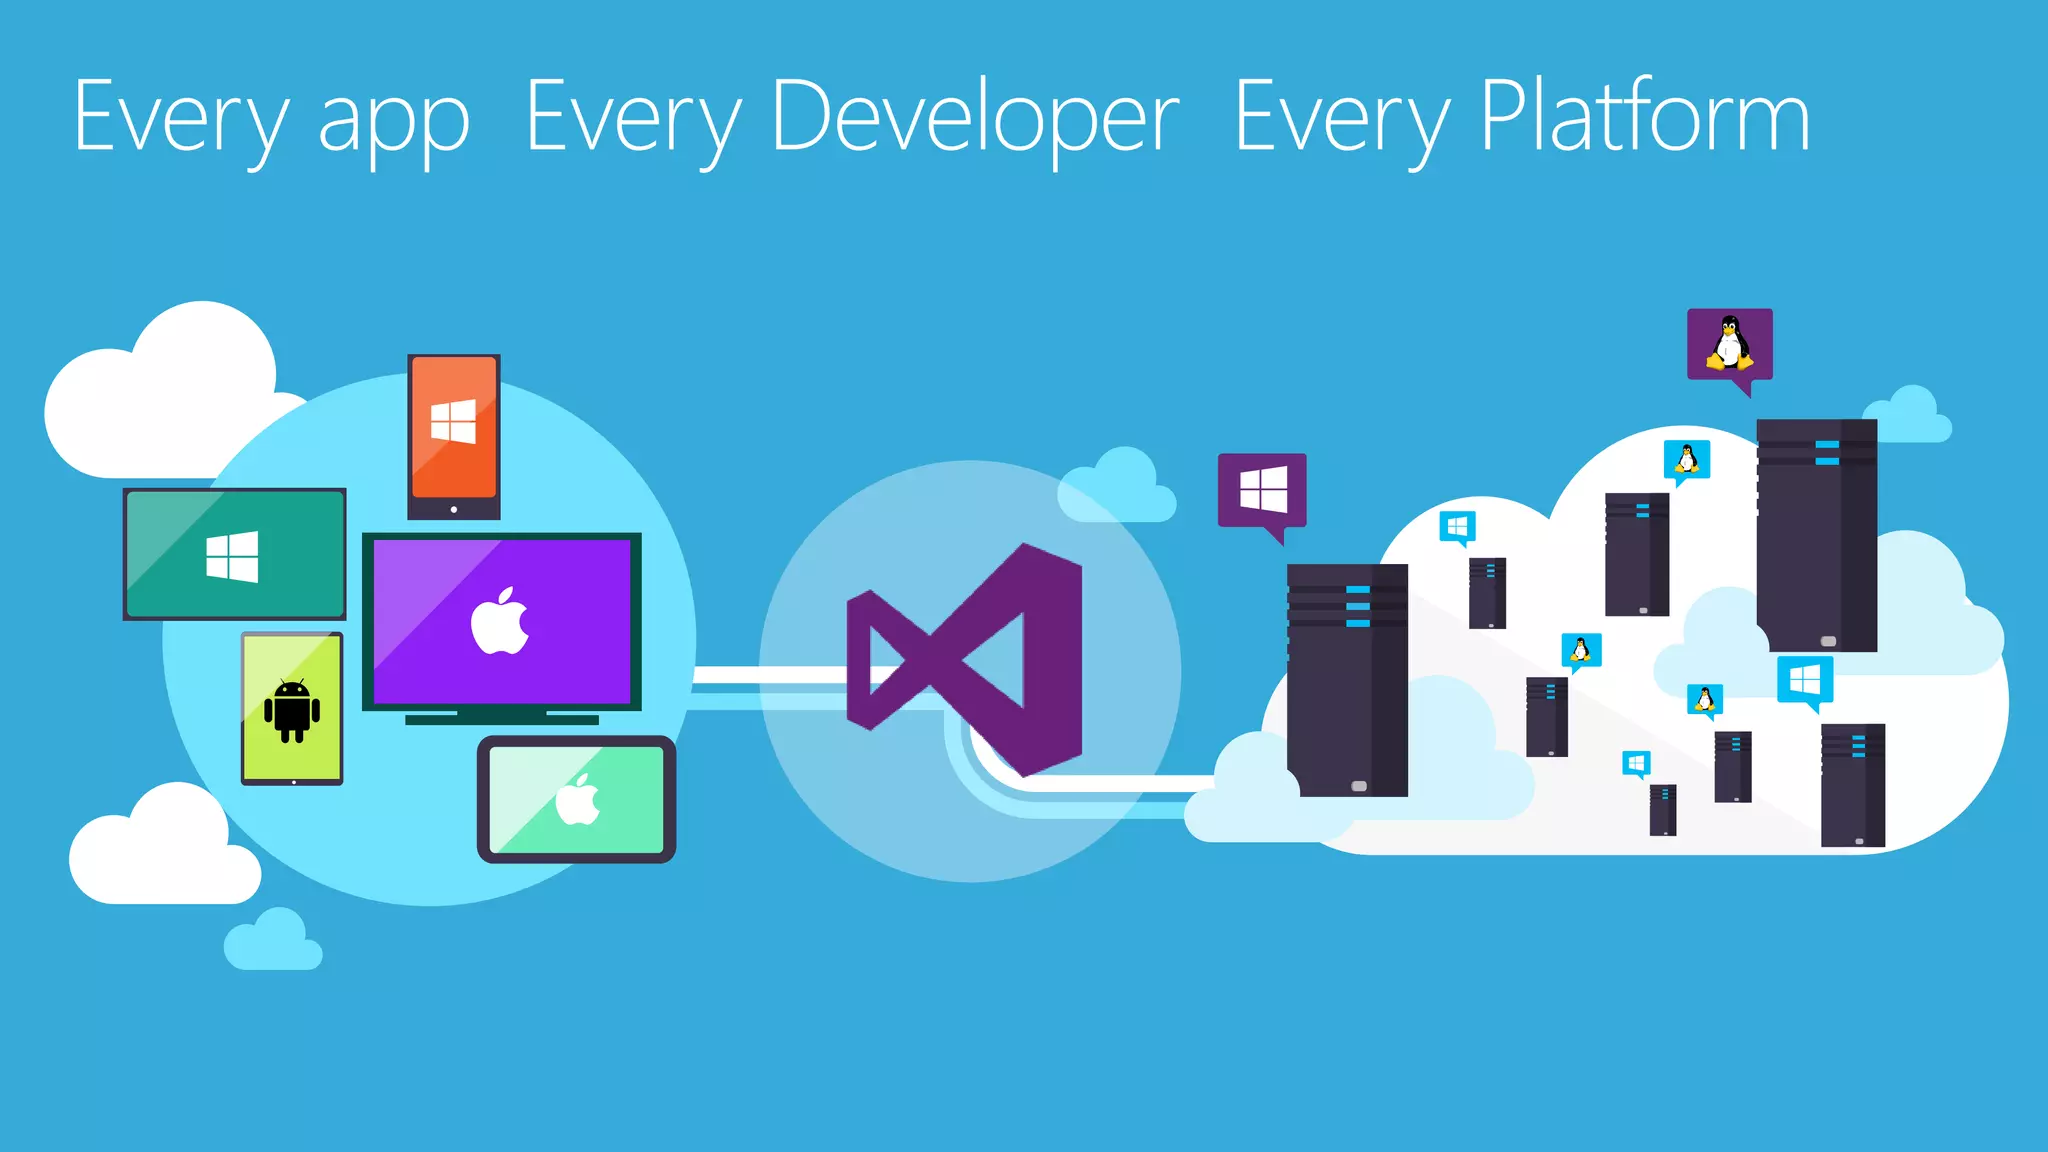
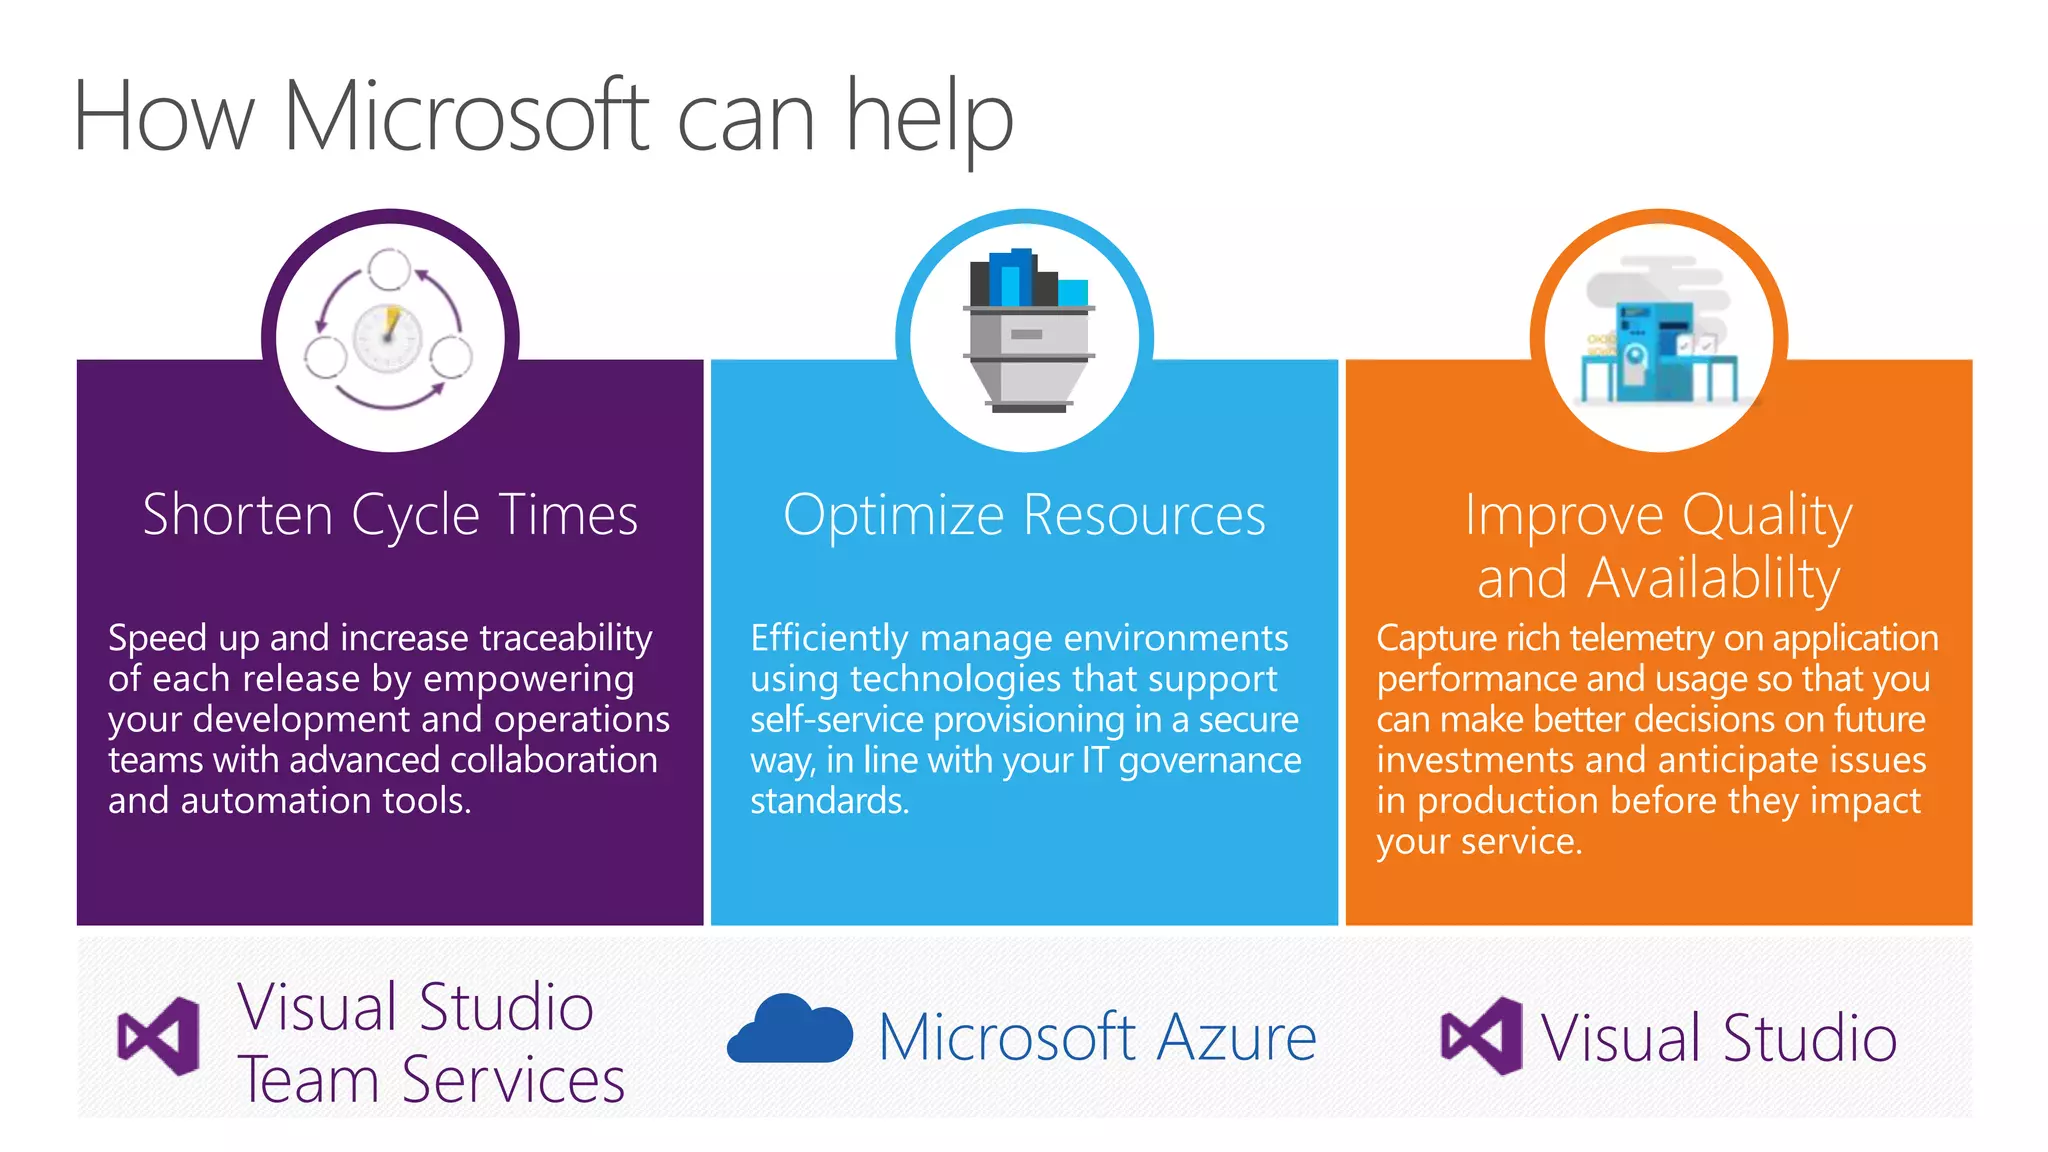
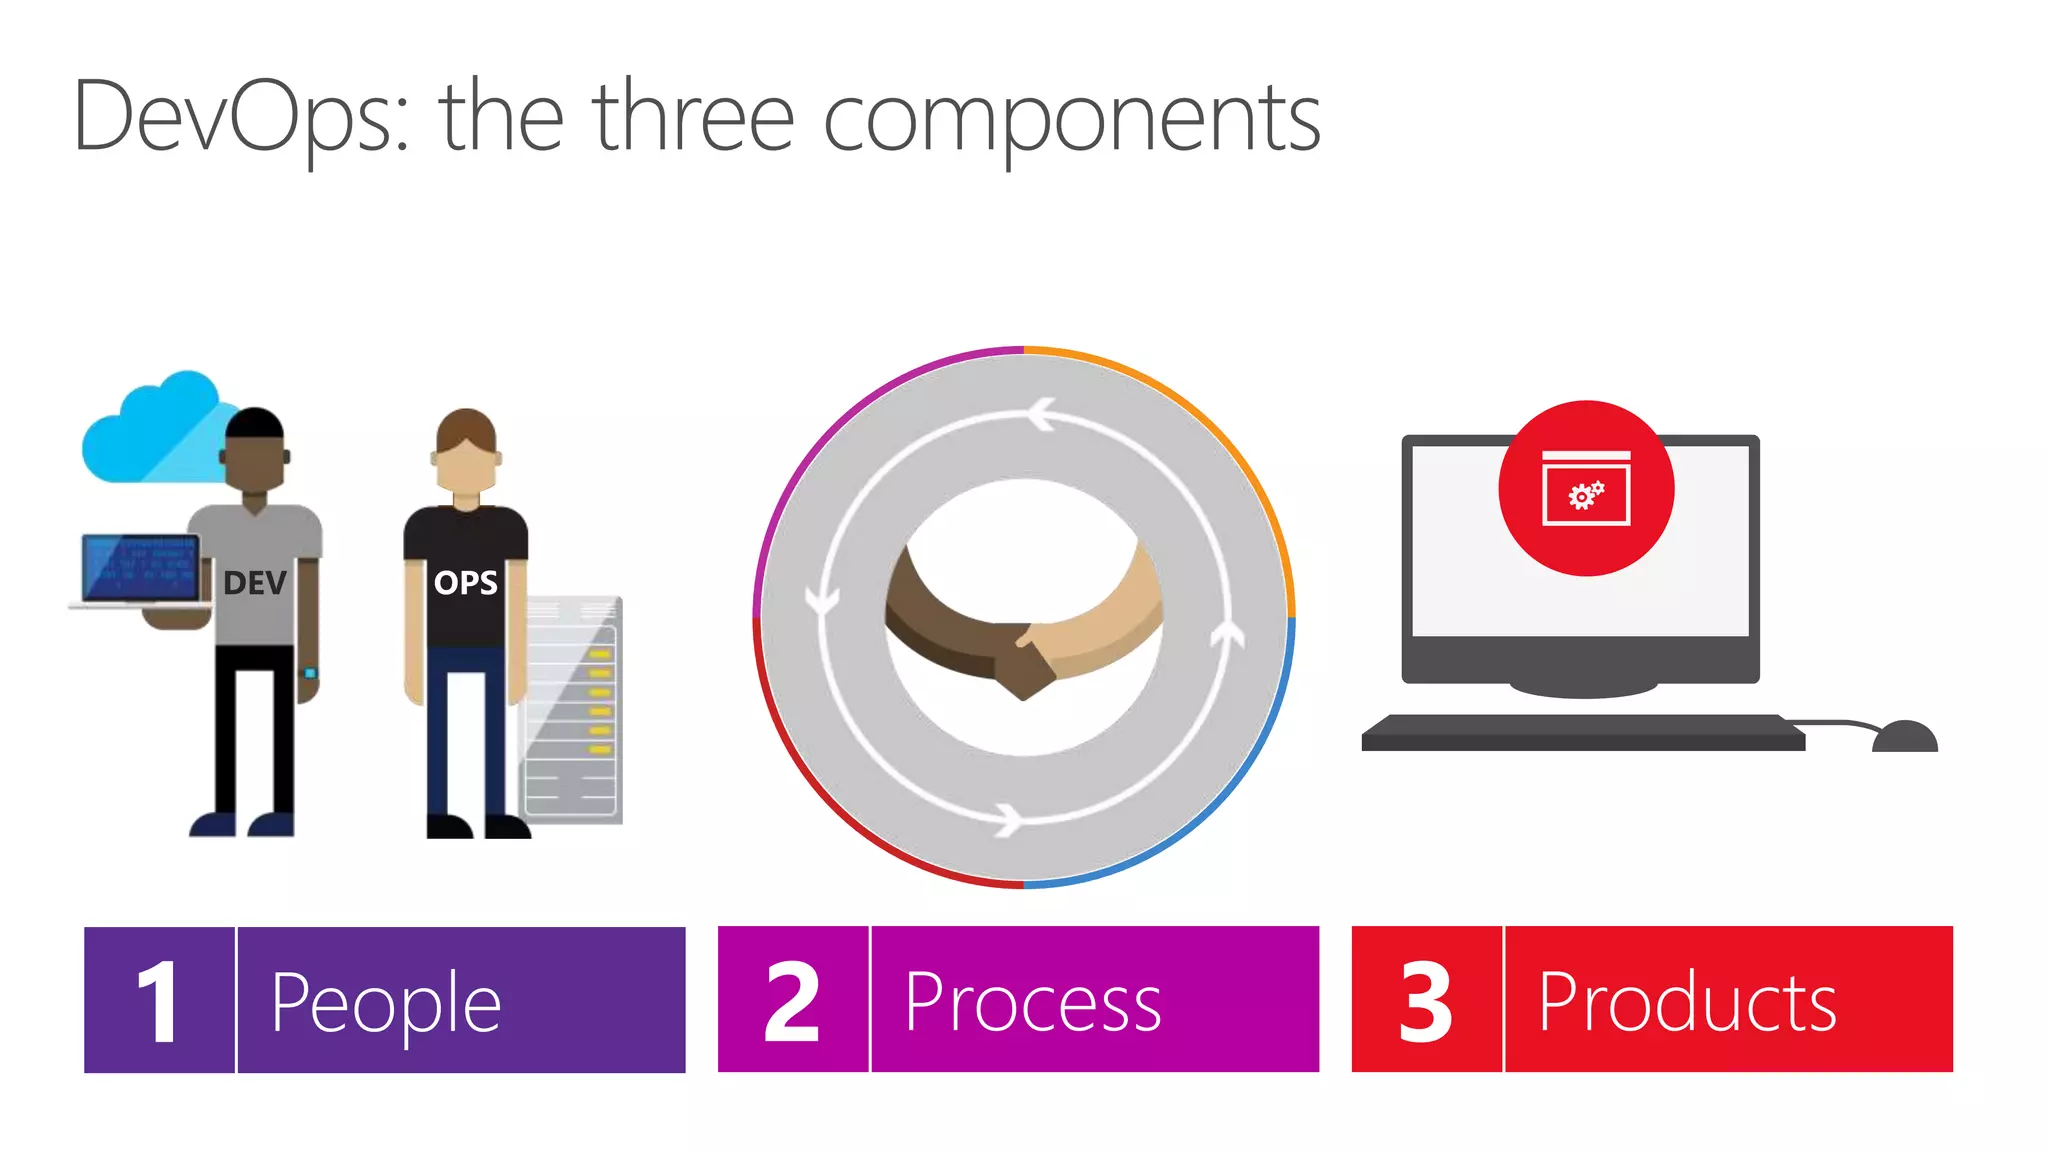
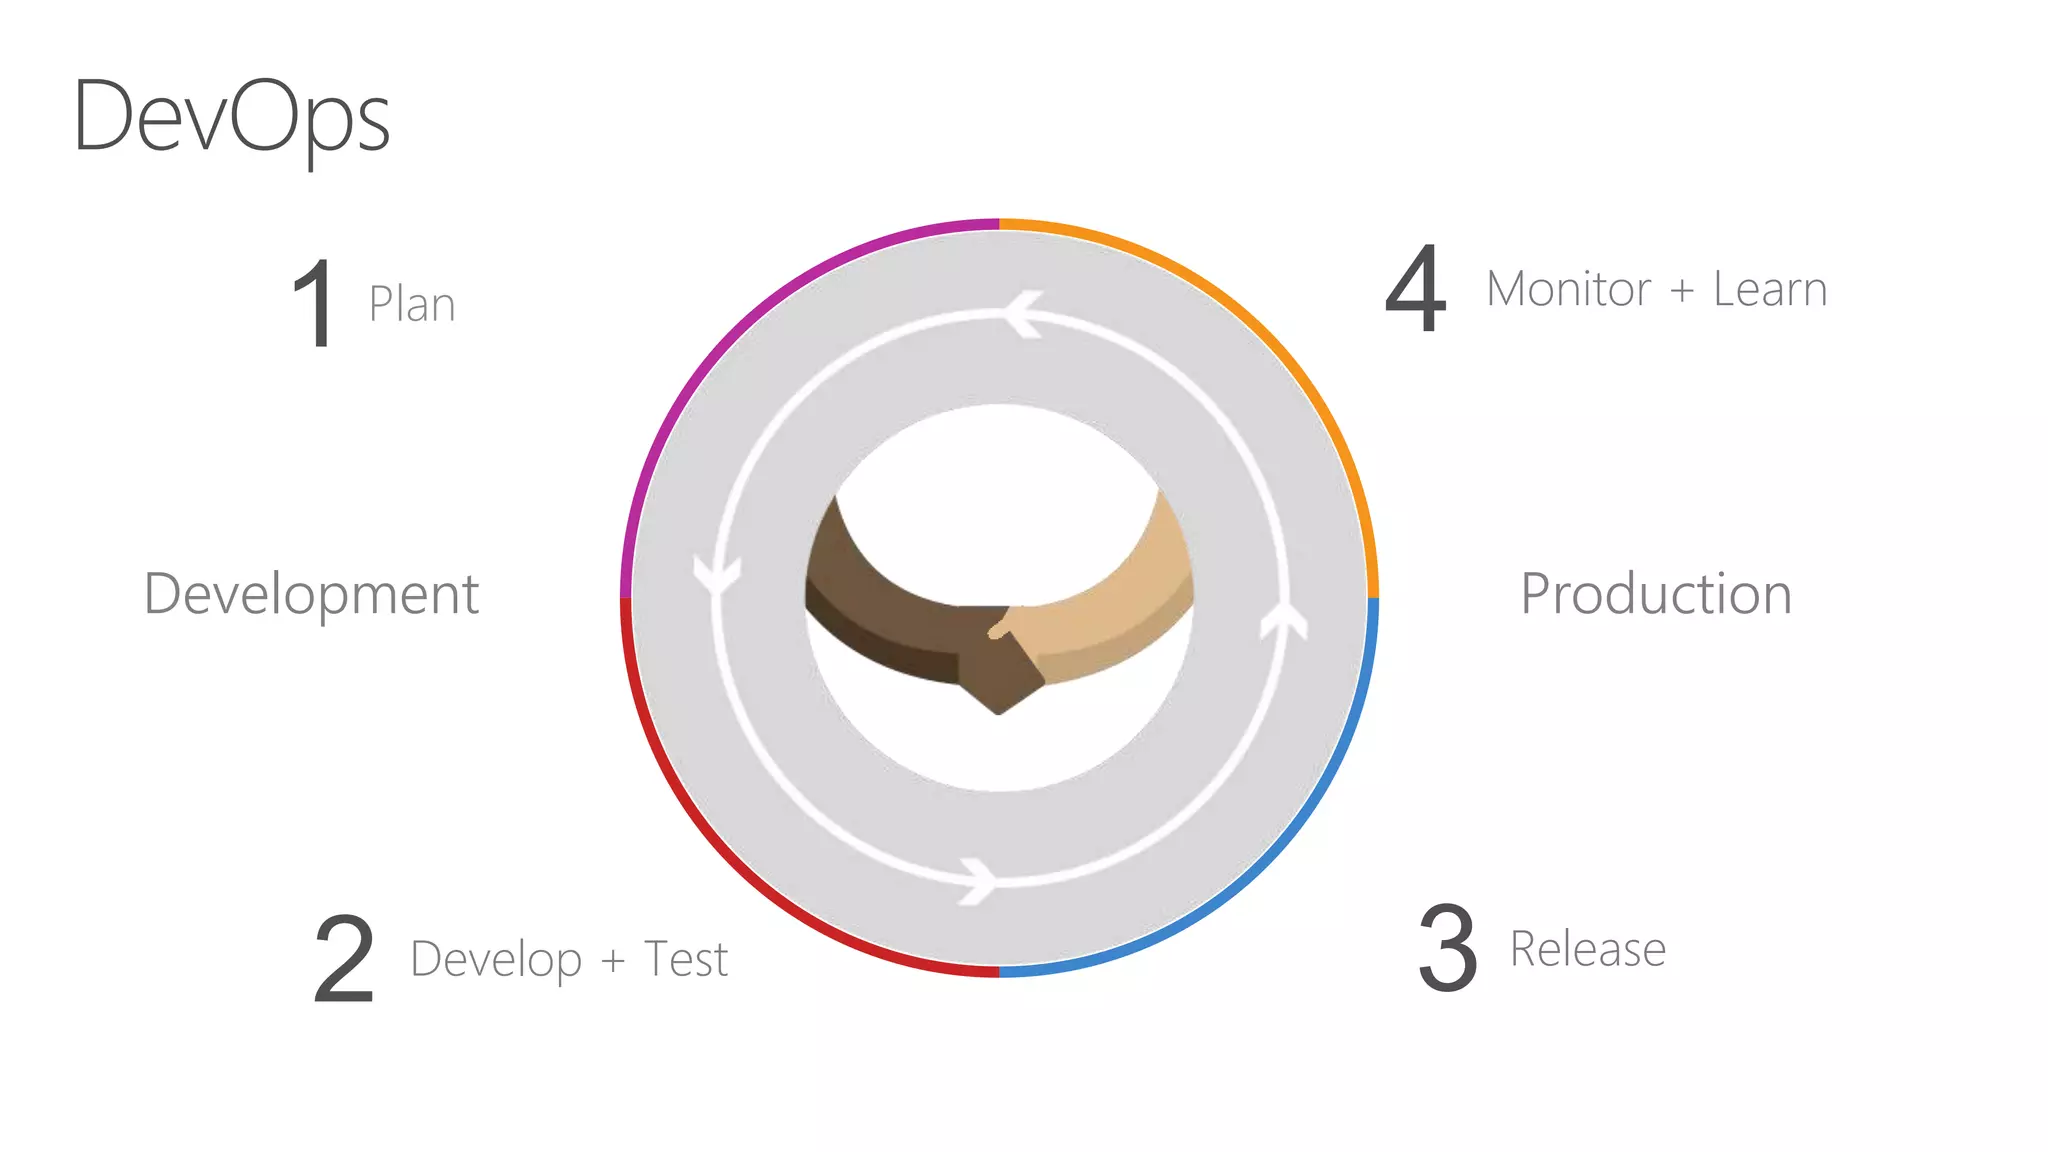
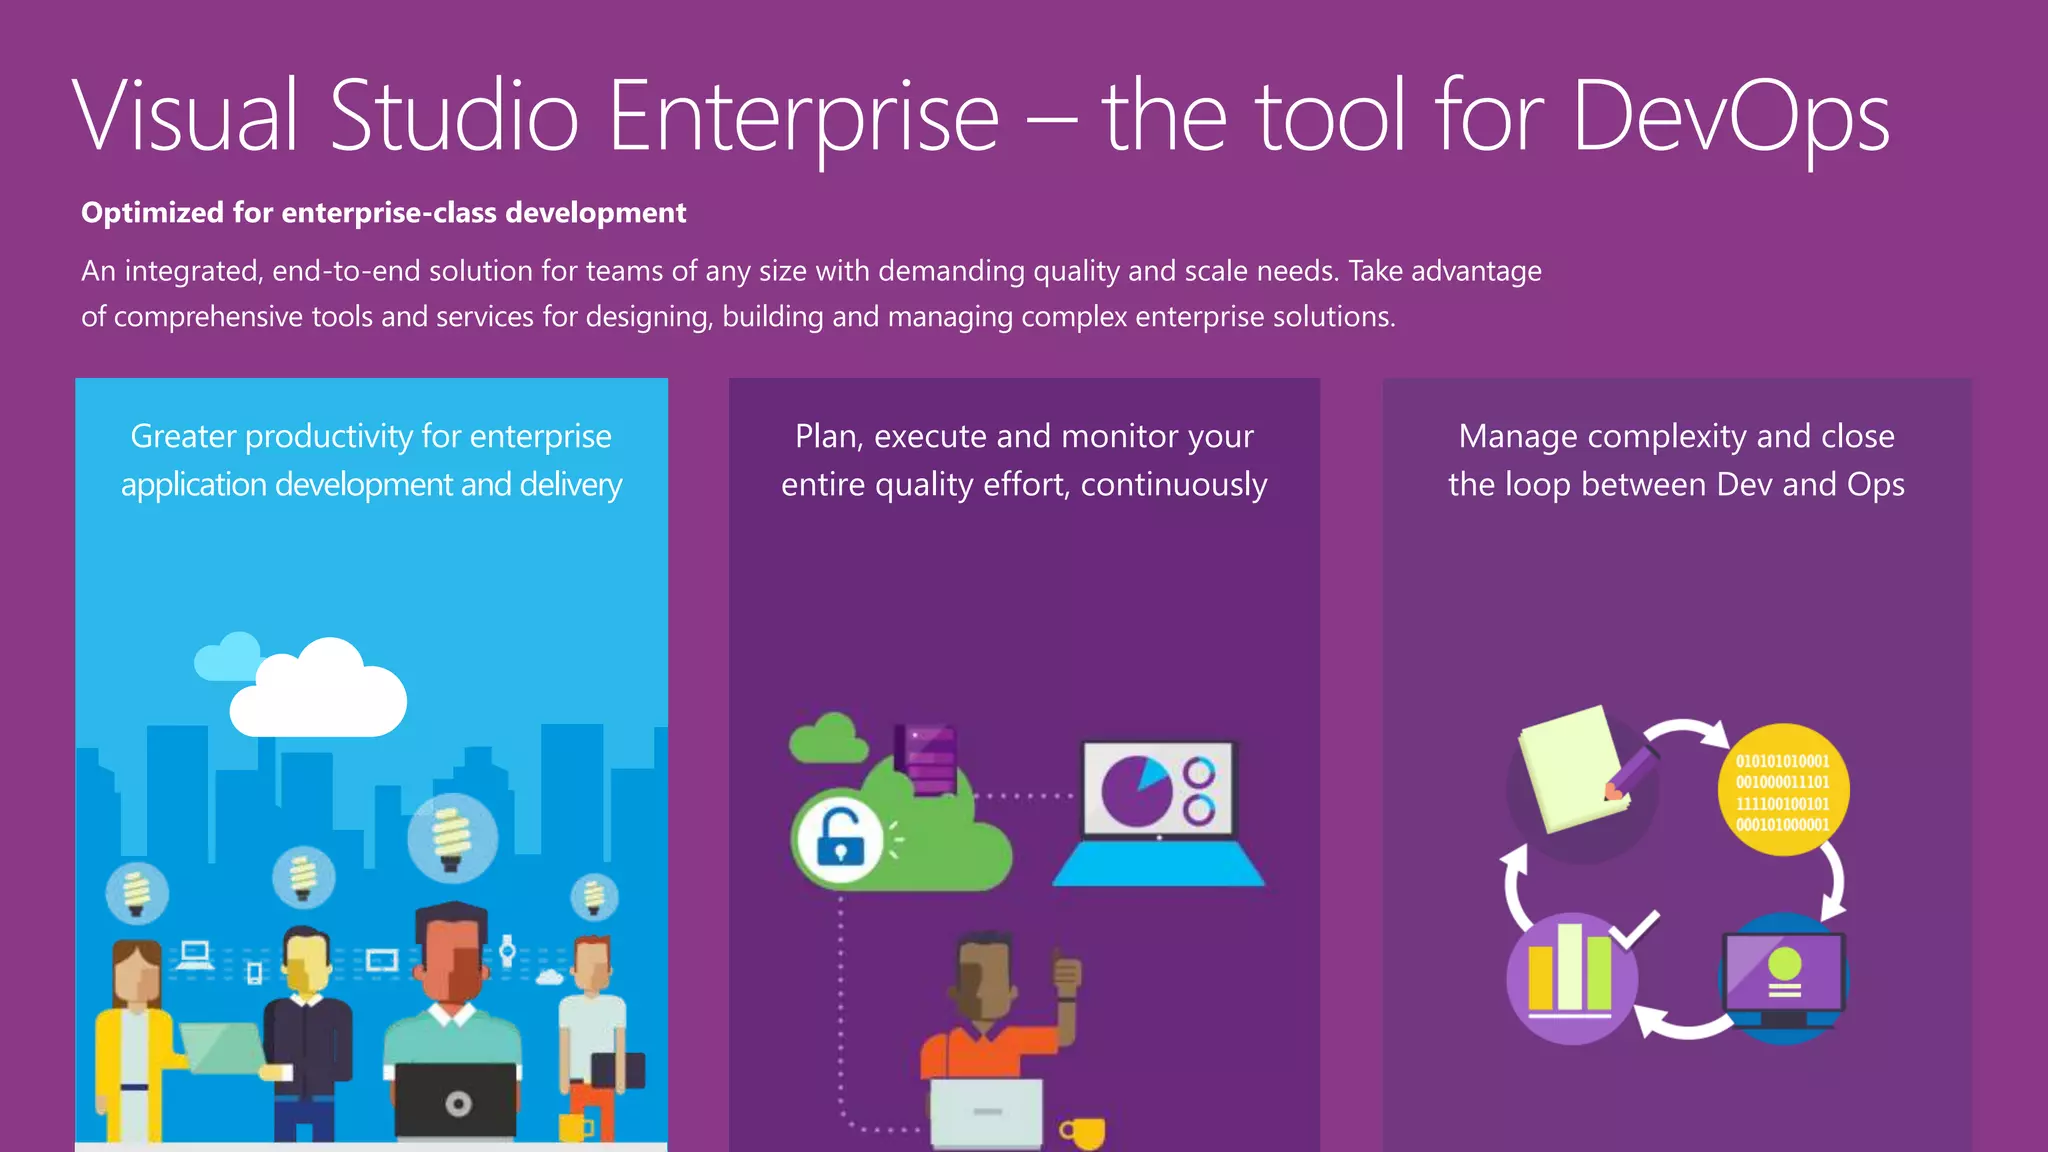
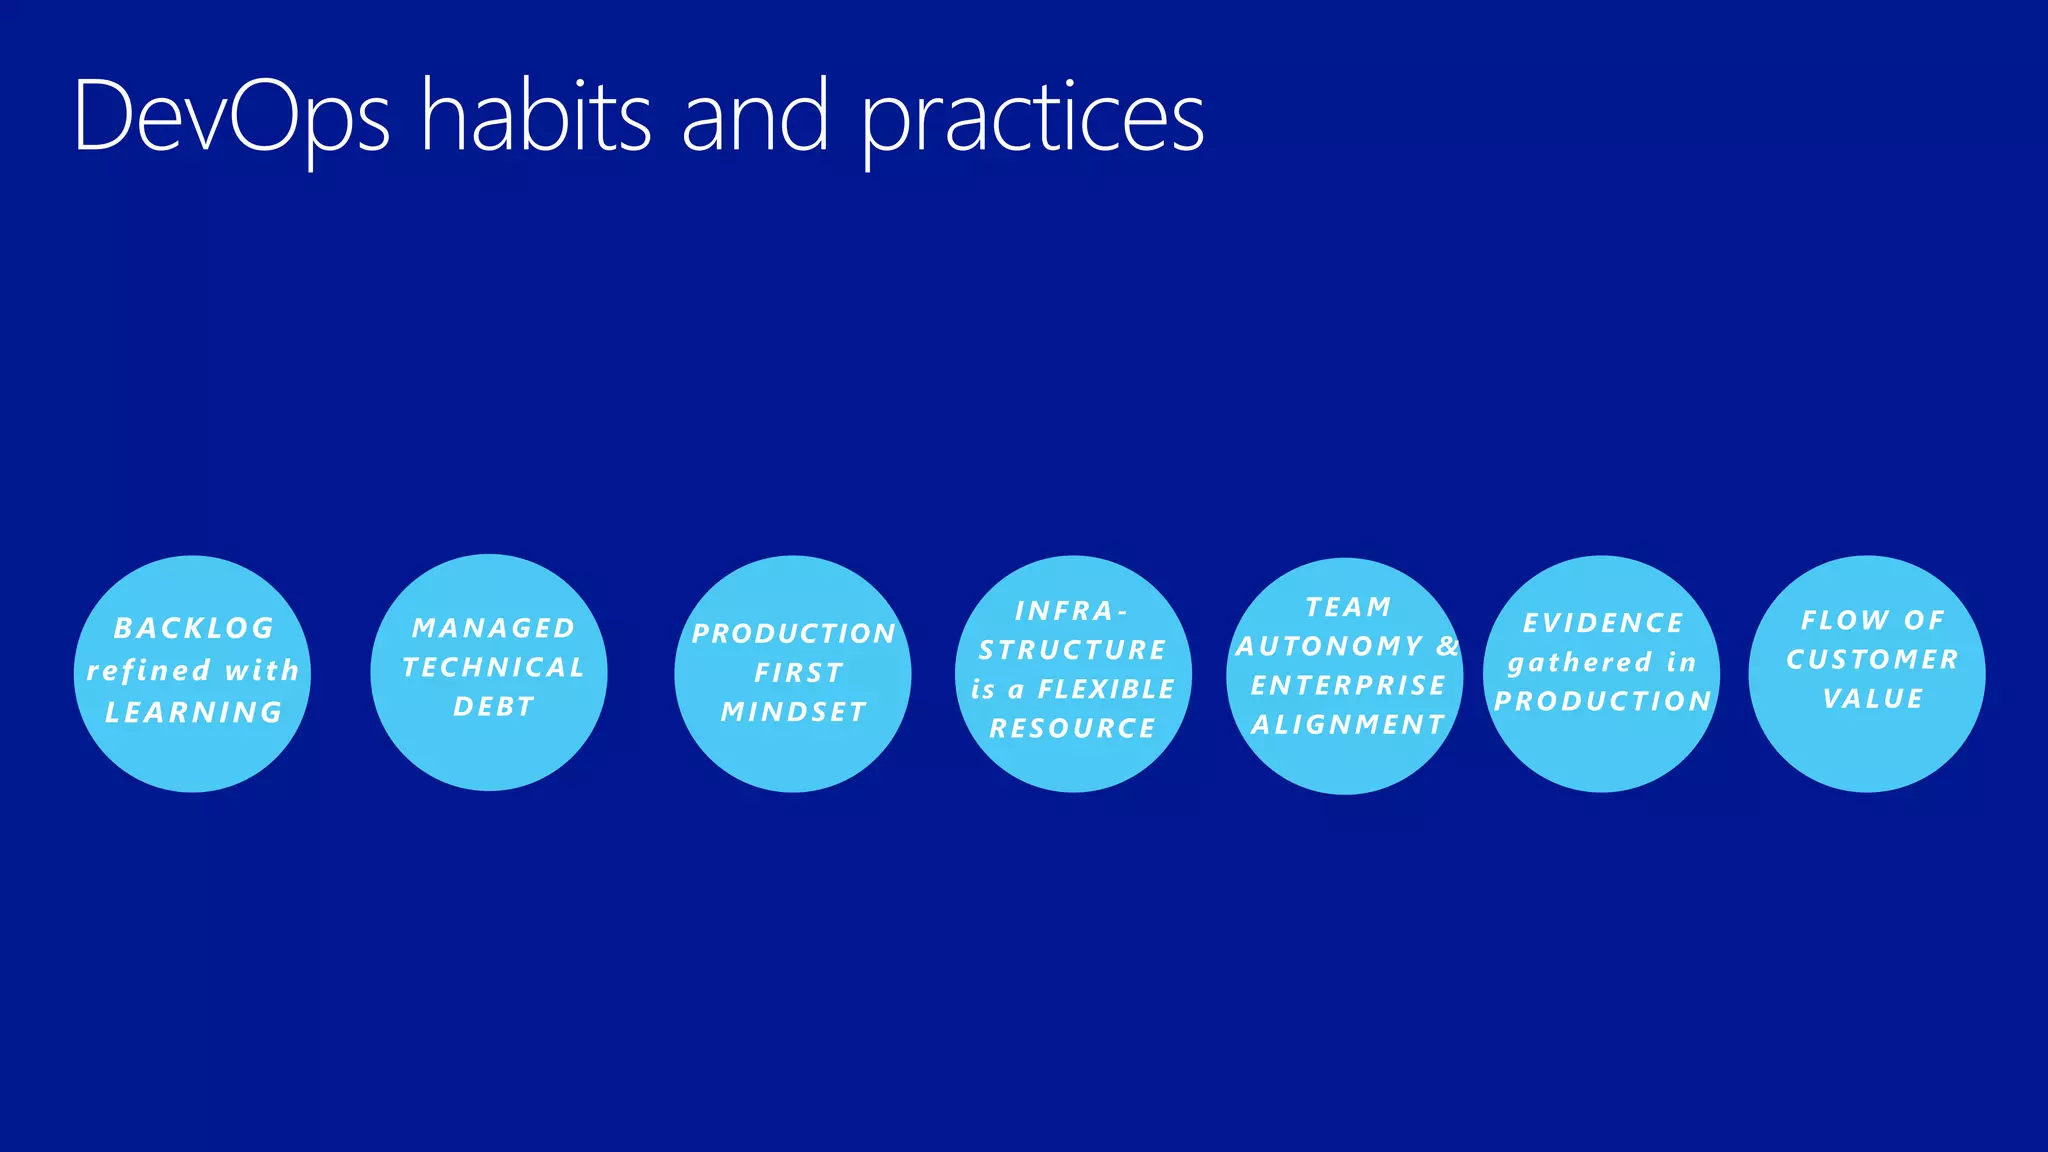
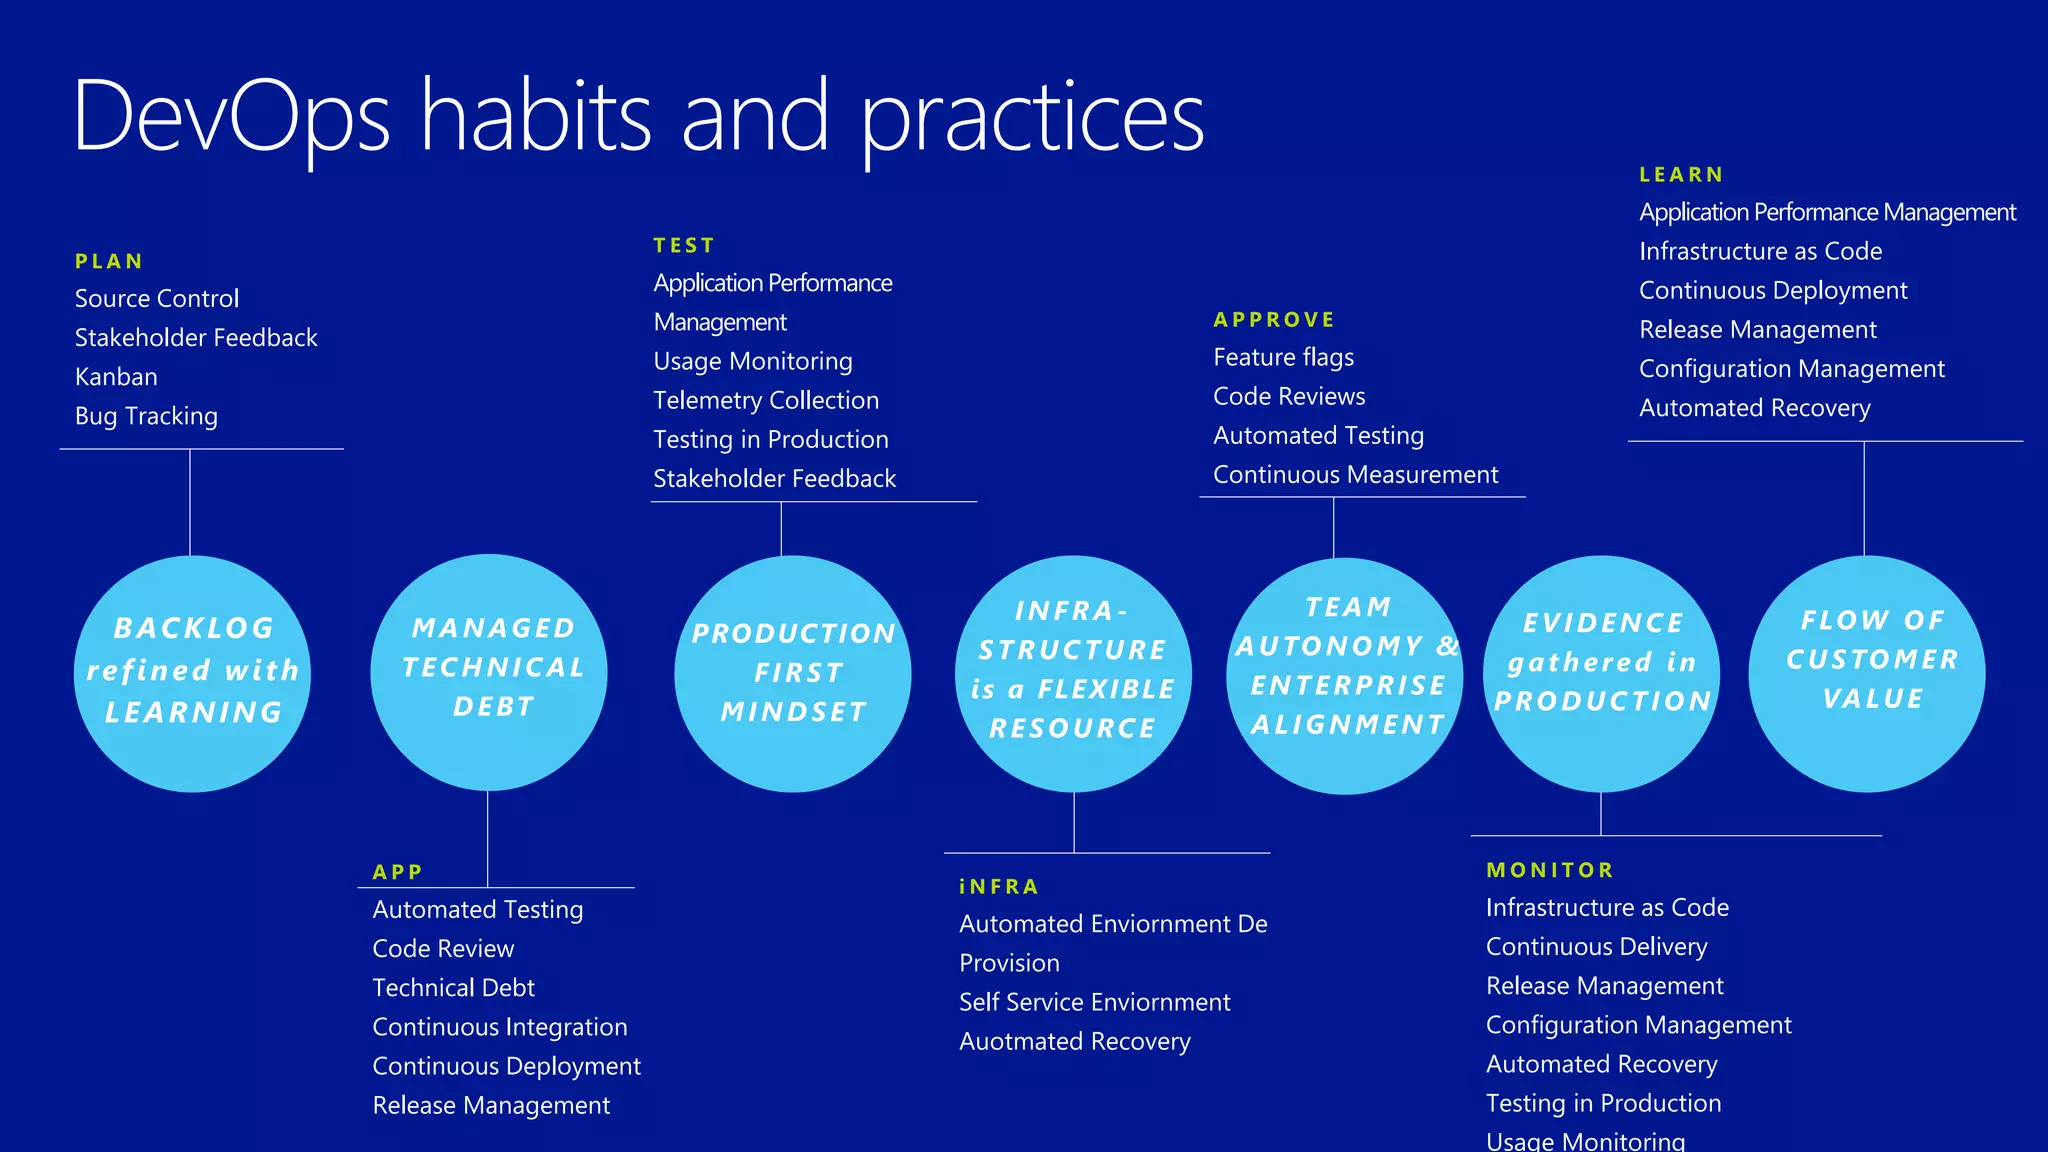


Visual Studio provides integrated tools to support DevOps practices like continuous integration, delivery, deployment and monitoring across the development and production environments. It allows teams to plan, develop, test and release applications while optimizing resources, managing technical debt, and gaining insights from evidence in production to refine future work.