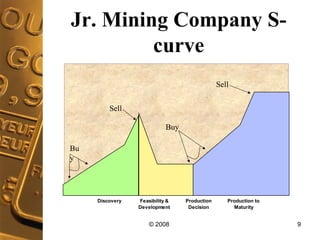
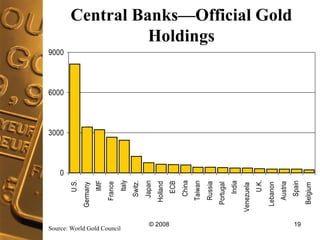
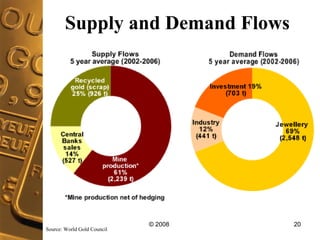
Gold Miners & Gold!  Where Next? Scott V. Nystrom, Ph.D. February 9, 2008 2008 ValueForum InvestFest
Outline of Presentation Topics What is Gold? How Can I Invest in Gold? How Should I Pick Gold Mining Stocks? Gold Stocks, Supply & Demand What Drives the Price of Gold?
What is Gold? Rare and precious metal The only yellow metal  Will never rust or tarnish (only metal that forms no oxide film on it's surface in air at normal temperatures) Non-toxic to humans Durable, portable, low weight to value, divisible  Melting point: 1,064.43°C (1,337.58°K, 1,947.97°F)  Boiling point: 2,807.0°C (3,80.15°K, 5,084.6°F)  Gold may be alloyed with various other metals—silver (Ag), copper (Cu), zinc (Zn), nickel (Ni), platinum (Pt), palladium (Pd), tellurium (Te), and iron (Fe). Source: USGS,  Mineral Commodity Profiles—Gold , 2002.
How Can I Invest in Gold? Physical  Coins Bars/Ingots Shot Mutual Funds/ETFs Mining Stocks
Gold Related Mutual Funds/ETFs Mutual Funds There are 21 families of gold related mutual funds with about 50 separate gold mutual funds See:  http://www.eaglewing.com/fundlist.html Physical Gold ETF State Street's streetTRACKS Gold Shares (NYSE:  GLD ) iShares Comex Gold Trust (AMEX:  IAU )  Gold Miners ETF Van Eck's Market Vectors Gold Miners ETF (AMEX:  GDX )  Gold Futures ETF PowerShares DB Gold Fund (AMEX:  DGL )
What are the Stages of  Mining Companies? Discovery Feasibility Construction Preproduction Production Mature
Gold Mining Company Tiers Top Tier (1 mil oz. + production) Newmont, Barrick, Anglogold, Gold Fields, Goldcorp, Harmony, Freeport-McMoran, Newcrest, Kinross, IAMGOLD, Polyus, Yamana Mid  Tier (> 100k < 1 mil oz. production) Northgate, Western, Centerra, DRDGold, Golden Star, Randgold, Minefinders. Jr. Tier (6 months to production or < 100k oz.) Claude, Crystallex, European Minerals, Gold-Ore, Jinshan, Metanor, MDN, Nevsun,  Discovery Tier (identifying reserves)
Top 10 Gold Companies by Market Cap ($ in billions) 1.1 m 1.2 m 1.6 m 4.0 m 5.7 m 1.0 m 1.6 m 5.3 m 2.3 m 8.1 m 2007 Prod 14 m 64 m 46 m 88 m 66 m 17 m 33 m 94 m 42 m 135 m P+P  Reserves $300 oz $320 oz $360 oz $415 oz $330 oz -$150 oz $108 oz $415 oz $150 oz $350 oz 2007 Prod Costs $8.4 Buenaventura BVN 10 $160 TOTAL …………………………………………………. OPYGY KGC GFI AU AUY NCMGY NEM GG ABX Symbol 9 8 7 6 5 4 3 2 1 $8.9 Polyus $11.8 Kinross Gold $12.6 Gold Fields $13.1 AngloGold $14.1 Yamana  $14.6 Newcrest $23.5 Newmont  $25.6 Goldcorp $40.0 Barrick Market Cap Company
Jr. Mining Company S-curve Sell Sell Buy Buy
Share Price along S-Curve
Junior Miners are Risky Source: Company reports and CIBC World Markets Inc. Average Share Price Impact: By Event Type Property Ownership Dispute Major Exploration Disappointment Exchange Issues Social/Env. Concerns/Delay Operating Disappointment Feasibility Disappointment Major Project Delay
Mining Stock Due Diligence Experienced management, honest, & passionate Increasing reserves Increasing production/cash flow Low production costs  Unhedged in era of rising gold price Politically safe region Possible buy out candidate Price of gold forecast
Investment Strategy for Jr. Miners Don’t concentrate your capital in a single gold mining stock.  Buy several  well-researched  plays. Set a target price & stick to a disciplined sell strategy. Scale-in on the way up & scale-out on the way down if price declines for no reason. If a resource doesn’t prove up or management fails to execute — sell or avoid the stock. Be prepared for extreme volatility. Be patient, markets are slow to recognize value.
Valuing Jr. Gold Miners $350 $634 oz $350 oz $280 oz $325 oz $450 oz < $9 oz 2008 Prod Costs $280m $290m $50m $91m $72m $65m $440m ~Market Cap 55k/100k For sale 40/80 k  50k? 170/275 k 60/75 k 149/149 k 2008/2009 Prod in ounces 12k 55 k  0 35k+ 69 k 20 k  0  2007 Prod in ounces Canada 1.6m SGRCF San Gold Resources Eritrea 1.4 m NSU Nevsun Canada 0.6 m (M&I) MEAOF Metanor Resources Tanzania ?-Barrick MDNNF MDN Inc. Brazil 2.9 m (M+I) JAG Jaguar Mining Sweden 2.1 m (M+I) GREXF Gold-Ore Resources Kazahkstan/ 11% 2.2 m EPMCF European Minerals Mine Site/ Hedge % P+P Reserves Symbol Company Name
Major Gold Discoveries over 3 Million Ounces Source: Newmont Gold
World Gold Mining Production 1970-2010 est Source: USGS
Annual Gold Production vs. Au Ever Mined 1970-2010 est Source: USGS & WGC
Physical Gold Stocks Source: World Gold Council
Central Banks—Official Gold Holdings Source: World Gold Council
Supply and Demand Flows Source: World Gold Council
Gold—Consumer Demand India
What is Driving Price of Gold? Higher Gold Price Weaker US$ Growing National Debt Higher Budget Deficits as Baby Boomers Retire Higher Gold Price Gold as hedge against inflation Gold as money, not commodity Higher Inflation Expectations Higher Gold Price More hoarding & lower supply Reduce sales of gold Central banks  Effect Cause Higher Gold Price Weaker US$ Extraordinary global liquidity Low interest rates in Japan; PBOC; ECB; US Repos+Euro$  Higher Gold Price Falling gold production No new exploration Low POG in 90s Higher Gold Price High exports/ US$ Surplus Yuan peg to the US$ China  Higher Gold Price High exports/ US$ Surplus High Oil Prices Oil Exporters Higher Gold Price Weaker US$ Negative Real Interest Rates Slowing GDP/ impending Rate cuts

Gold Miners And Gold Where Next Final

  • 1.
    Gold Miners &Gold! Where Next? Scott V. Nystrom, Ph.D. February 9, 2008 2008 ValueForum InvestFest
  • 2.
    Outline of PresentationTopics What is Gold? How Can I Invest in Gold? How Should I Pick Gold Mining Stocks? Gold Stocks, Supply & Demand What Drives the Price of Gold?
  • 3.
    What is Gold?Rare and precious metal The only yellow metal Will never rust or tarnish (only metal that forms no oxide film on it's surface in air at normal temperatures) Non-toxic to humans Durable, portable, low weight to value, divisible Melting point: 1,064.43°C (1,337.58°K, 1,947.97°F) Boiling point: 2,807.0°C (3,80.15°K, 5,084.6°F) Gold may be alloyed with various other metals—silver (Ag), copper (Cu), zinc (Zn), nickel (Ni), platinum (Pt), palladium (Pd), tellurium (Te), and iron (Fe). Source: USGS, Mineral Commodity Profiles—Gold , 2002.
  • 4.
    How Can IInvest in Gold? Physical Coins Bars/Ingots Shot Mutual Funds/ETFs Mining Stocks
  • 5.
    Gold Related MutualFunds/ETFs Mutual Funds There are 21 families of gold related mutual funds with about 50 separate gold mutual funds See: http://www.eaglewing.com/fundlist.html Physical Gold ETF State Street's streetTRACKS Gold Shares (NYSE: GLD ) iShares Comex Gold Trust (AMEX: IAU ) Gold Miners ETF Van Eck's Market Vectors Gold Miners ETF (AMEX: GDX ) Gold Futures ETF PowerShares DB Gold Fund (AMEX: DGL )
  • 6.
    What are theStages of Mining Companies? Discovery Feasibility Construction Preproduction Production Mature
  • 7.
    Gold Mining CompanyTiers Top Tier (1 mil oz. + production) Newmont, Barrick, Anglogold, Gold Fields, Goldcorp, Harmony, Freeport-McMoran, Newcrest, Kinross, IAMGOLD, Polyus, Yamana Mid Tier (> 100k < 1 mil oz. production) Northgate, Western, Centerra, DRDGold, Golden Star, Randgold, Minefinders. Jr. Tier (6 months to production or < 100k oz.) Claude, Crystallex, European Minerals, Gold-Ore, Jinshan, Metanor, MDN, Nevsun, Discovery Tier (identifying reserves)
  • 8.
    Top 10 GoldCompanies by Market Cap ($ in billions) 1.1 m 1.2 m 1.6 m 4.0 m 5.7 m 1.0 m 1.6 m 5.3 m 2.3 m 8.1 m 2007 Prod 14 m 64 m 46 m 88 m 66 m 17 m 33 m 94 m 42 m 135 m P+P Reserves $300 oz $320 oz $360 oz $415 oz $330 oz -$150 oz $108 oz $415 oz $150 oz $350 oz 2007 Prod Costs $8.4 Buenaventura BVN 10 $160 TOTAL …………………………………………………. OPYGY KGC GFI AU AUY NCMGY NEM GG ABX Symbol 9 8 7 6 5 4 3 2 1 $8.9 Polyus $11.8 Kinross Gold $12.6 Gold Fields $13.1 AngloGold $14.1 Yamana $14.6 Newcrest $23.5 Newmont $25.6 Goldcorp $40.0 Barrick Market Cap Company
  • 9.
    Jr. Mining CompanyS-curve Sell Sell Buy Buy
  • 10.
  • 11.
    Junior Miners areRisky Source: Company reports and CIBC World Markets Inc. Average Share Price Impact: By Event Type Property Ownership Dispute Major Exploration Disappointment Exchange Issues Social/Env. Concerns/Delay Operating Disappointment Feasibility Disappointment Major Project Delay
  • 12.
    Mining Stock DueDiligence Experienced management, honest, & passionate Increasing reserves Increasing production/cash flow Low production costs Unhedged in era of rising gold price Politically safe region Possible buy out candidate Price of gold forecast
  • 13.
    Investment Strategy forJr. Miners Don’t concentrate your capital in a single gold mining stock. Buy several well-researched plays. Set a target price & stick to a disciplined sell strategy. Scale-in on the way up & scale-out on the way down if price declines for no reason. If a resource doesn’t prove up or management fails to execute — sell or avoid the stock. Be prepared for extreme volatility. Be patient, markets are slow to recognize value.
  • 14.
    Valuing Jr. GoldMiners $350 $634 oz $350 oz $280 oz $325 oz $450 oz < $9 oz 2008 Prod Costs $280m $290m $50m $91m $72m $65m $440m ~Market Cap 55k/100k For sale 40/80 k 50k? 170/275 k 60/75 k 149/149 k 2008/2009 Prod in ounces 12k 55 k 0 35k+ 69 k 20 k 0 2007 Prod in ounces Canada 1.6m SGRCF San Gold Resources Eritrea 1.4 m NSU Nevsun Canada 0.6 m (M&I) MEAOF Metanor Resources Tanzania ?-Barrick MDNNF MDN Inc. Brazil 2.9 m (M+I) JAG Jaguar Mining Sweden 2.1 m (M+I) GREXF Gold-Ore Resources Kazahkstan/ 11% 2.2 m EPMCF European Minerals Mine Site/ Hedge % P+P Reserves Symbol Company Name
  • 15.
    Major Gold Discoveriesover 3 Million Ounces Source: Newmont Gold
  • 16.
    World Gold MiningProduction 1970-2010 est Source: USGS
  • 17.
    Annual Gold Productionvs. Au Ever Mined 1970-2010 est Source: USGS & WGC
  • 18.
    Physical Gold StocksSource: World Gold Council
  • 19.
    Central Banks—Official GoldHoldings Source: World Gold Council
  • 20.
    Supply and DemandFlows Source: World Gold Council
  • 21.
  • 22.
    What is DrivingPrice of Gold? Higher Gold Price Weaker US$ Growing National Debt Higher Budget Deficits as Baby Boomers Retire Higher Gold Price Gold as hedge against inflation Gold as money, not commodity Higher Inflation Expectations Higher Gold Price More hoarding & lower supply Reduce sales of gold Central banks Effect Cause Higher Gold Price Weaker US$ Extraordinary global liquidity Low interest rates in Japan; PBOC; ECB; US Repos+Euro$ Higher Gold Price Falling gold production No new exploration Low POG in 90s Higher Gold Price High exports/ US$ Surplus Yuan peg to the US$ China Higher Gold Price High exports/ US$ Surplus High Oil Prices Oil Exporters Higher Gold Price Weaker US$ Negative Real Interest Rates Slowing GDP/ impending Rate cuts