Design Scheme for Superstructure of 70m Approach Bridge Using Upward Moving Scaffolding Method - 修0616.pptx
1.
CCCC Wuhan HarborEngineering
Design & Research Institute Co.,
Ltd., June 2025
Superstructure Scheme Design for TMFS
(Traveling Movable Formwork System )
– 70m Approach Bridge of Salvador Bridge
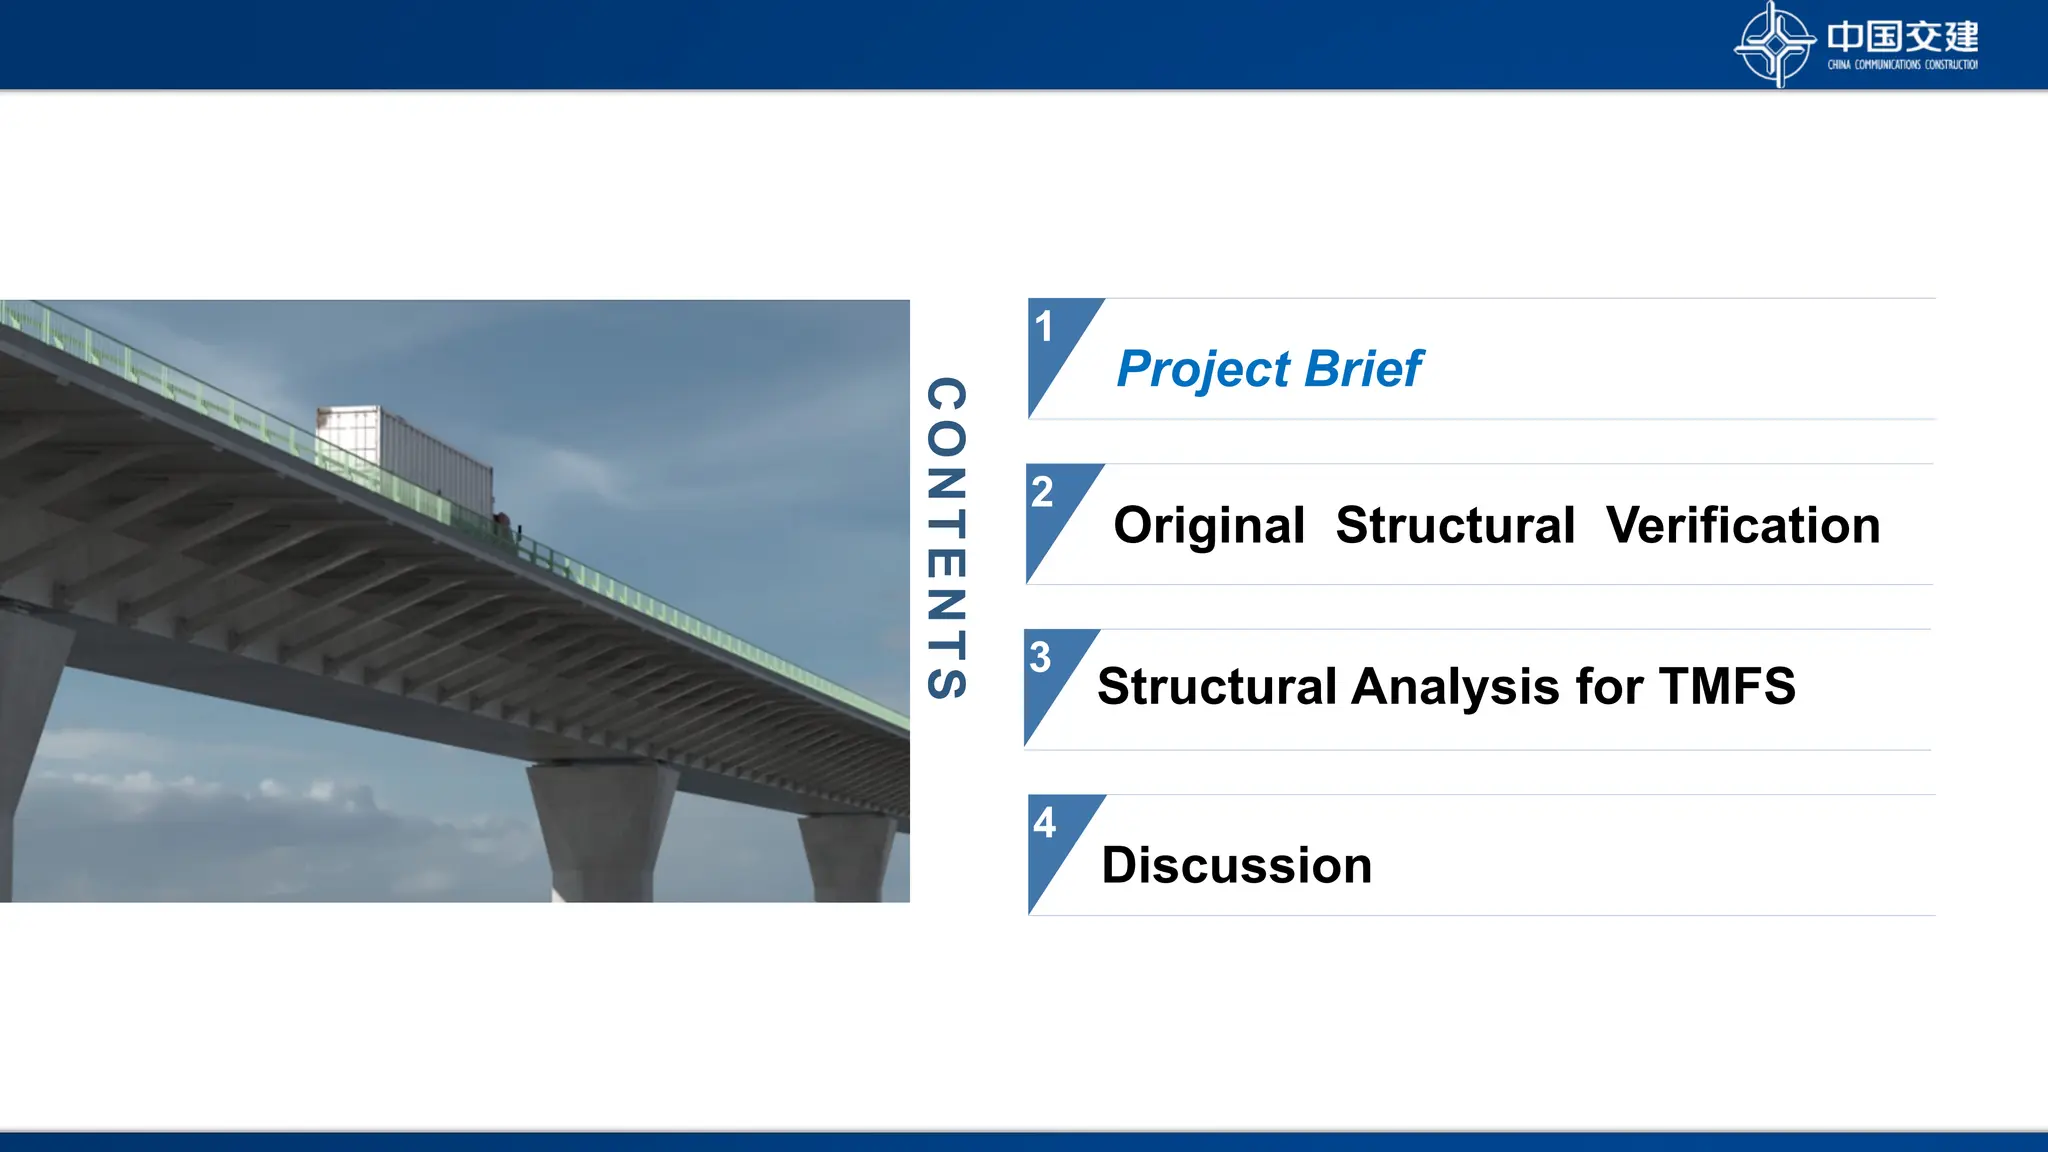
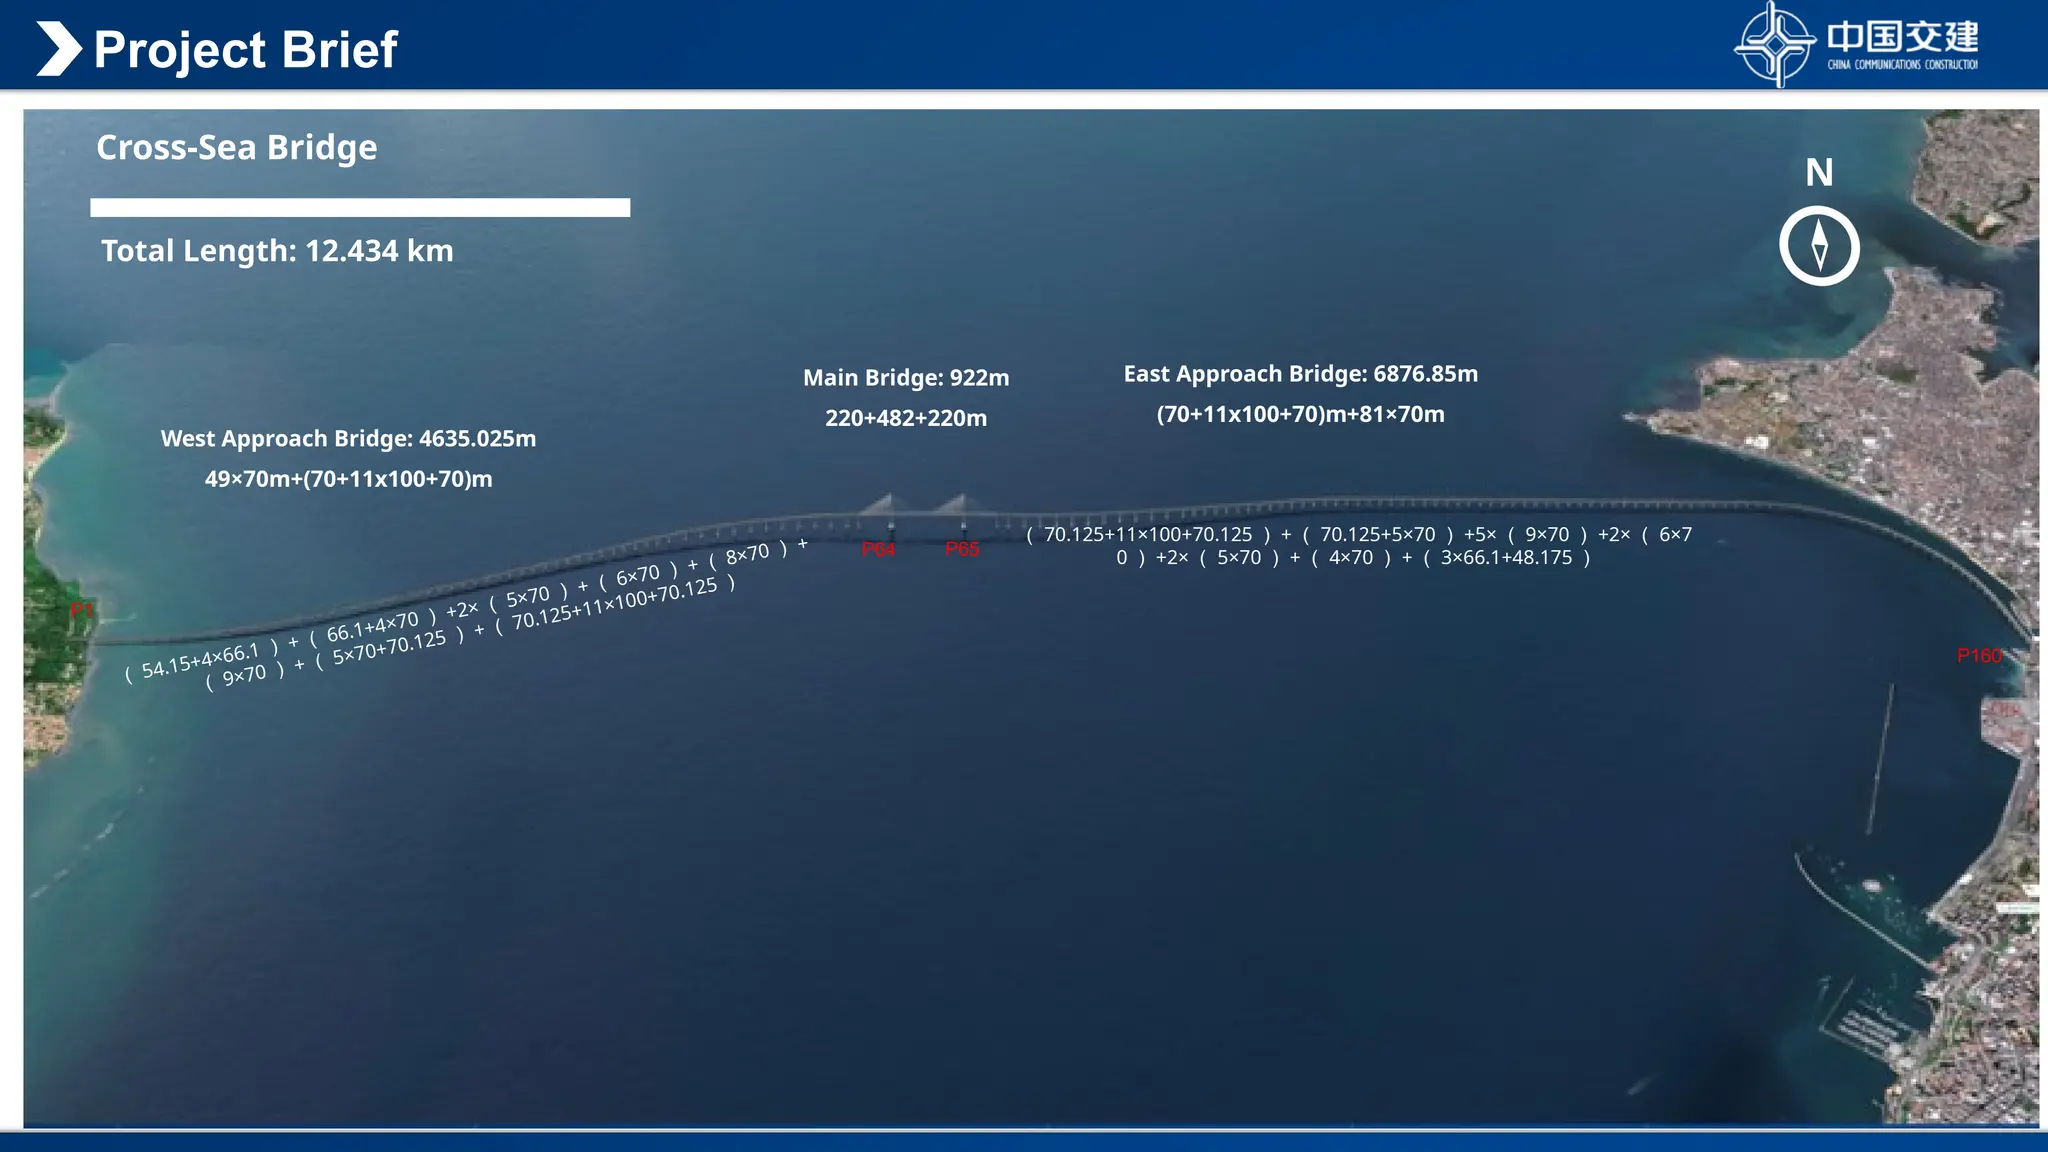
Project Brief
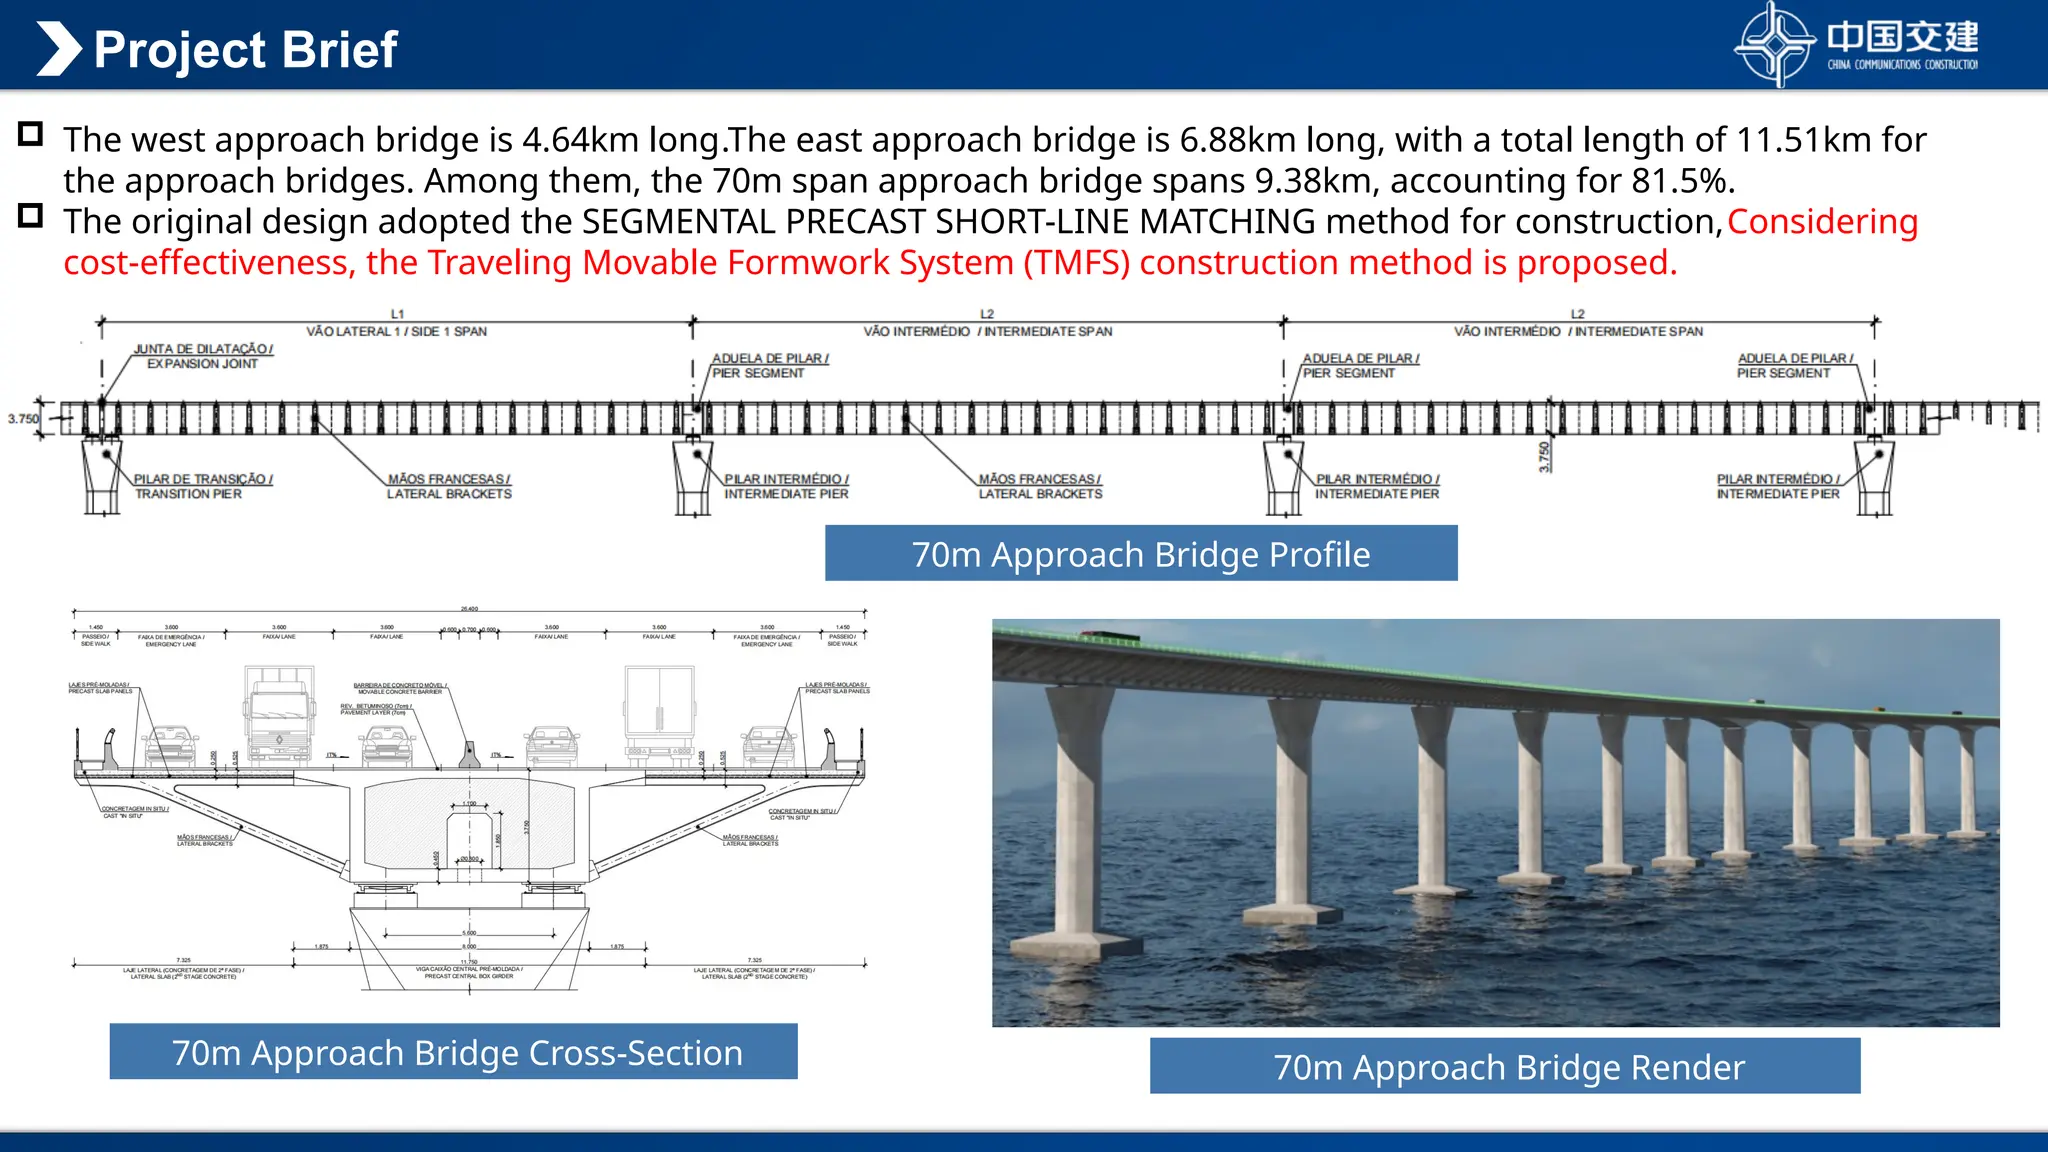
Thewest approach bridge is 4.64km long.The east approach bridge is 6.88km long, with a total length of 11.51km for
the approach bridges. Among them, the 70m span approach bridge spans 9.38km, accounting for 81.5%.
The original design adopted the SEGMENTAL PRECAST SHORT-LINE MATCHING method for construction,Considering
cost-effectiveness, the Traveling Movable Formwork System (TMFS) construction method is proposed.
70m Approach Bridge Profile
70m Approach Bridge Cross-Section 70m Approach Bridge Render
5.
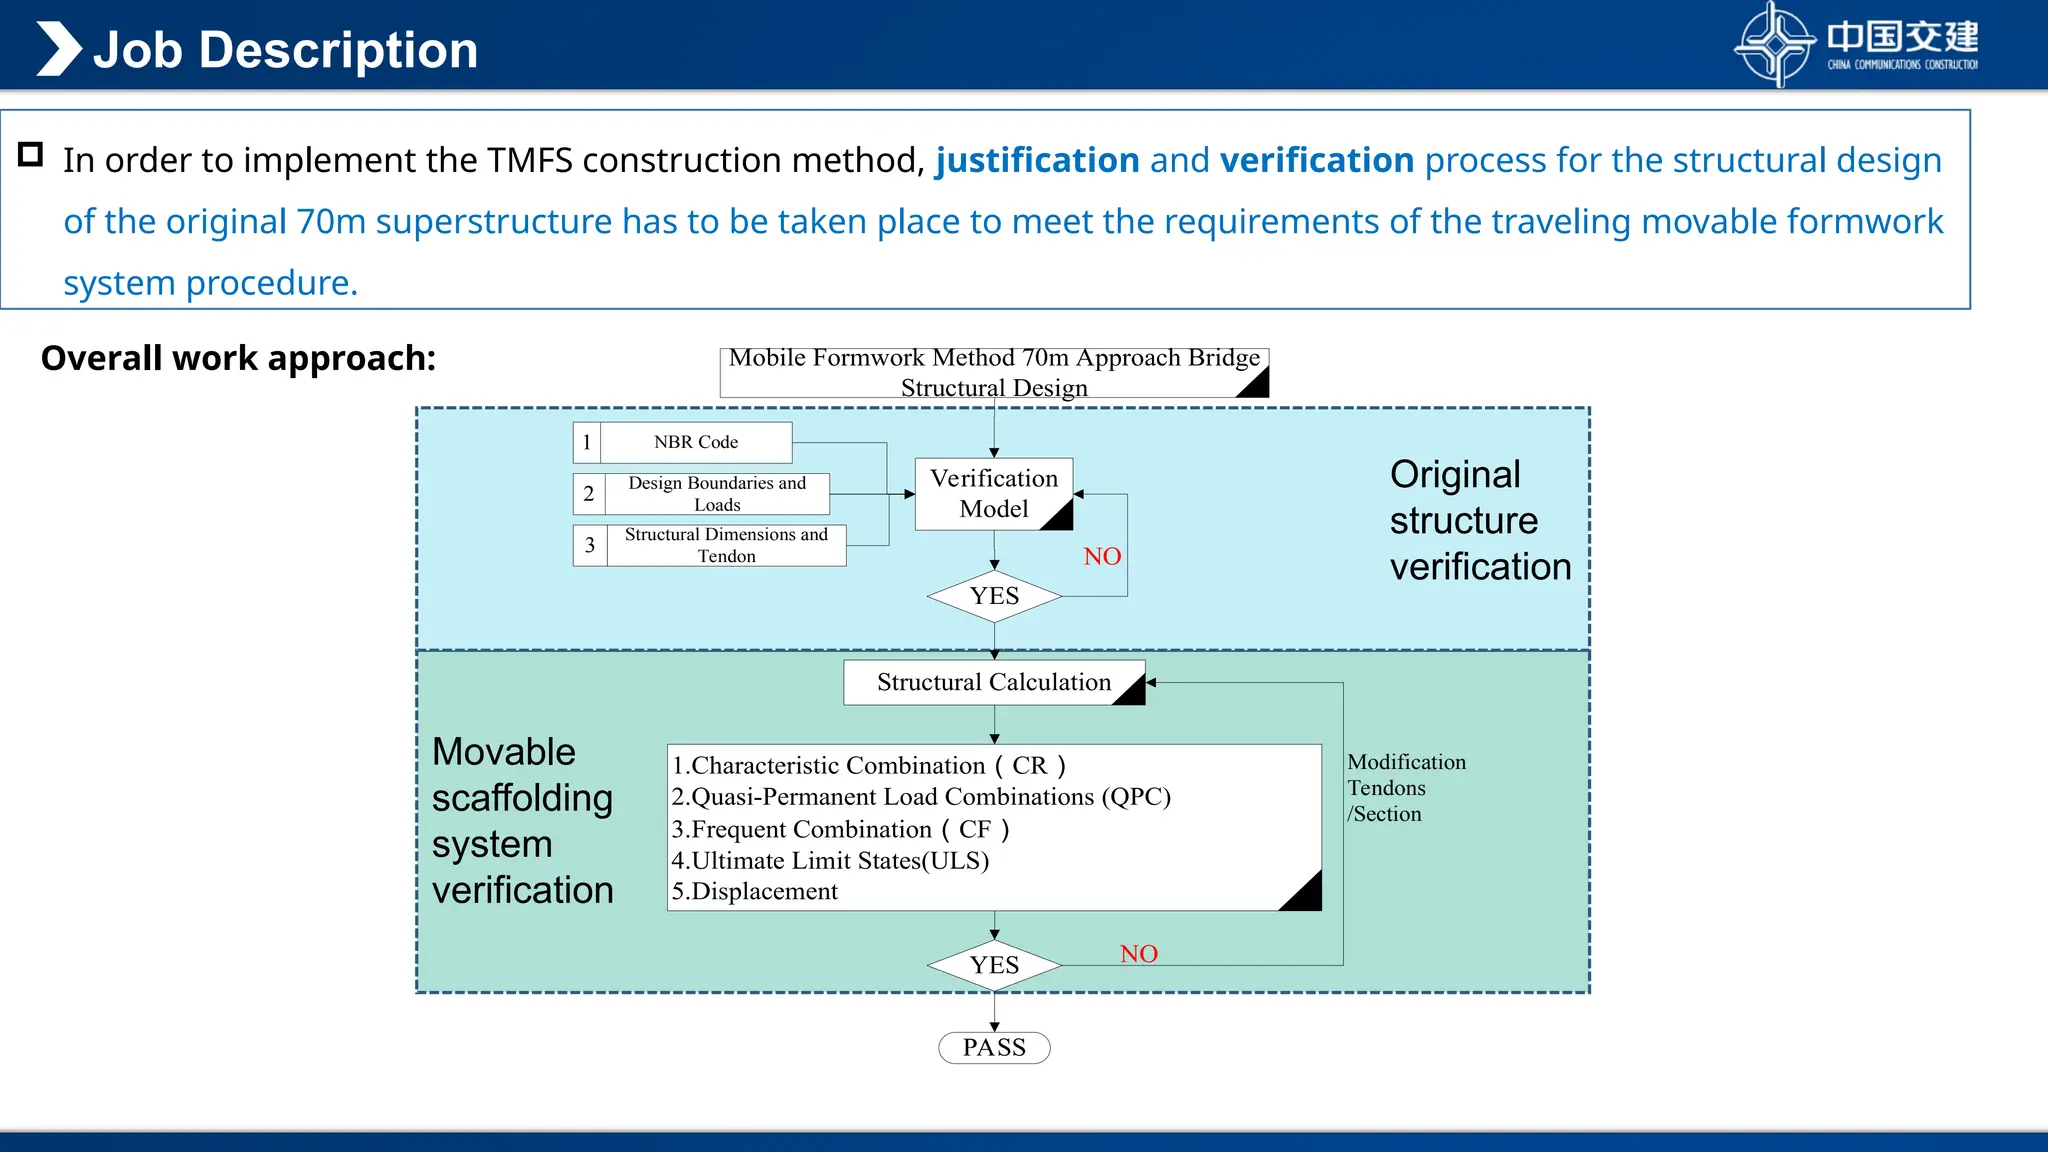
Job Description
Inorder to implement the TMFS construction method, justification and verification process for the structural design
of the original 70m superstructure has to be taken place to meet the requirements of the traveling movable formwork
system procedure.
Original
structure
verification
Movable
scaffolding
system
verification
Mobile Formwork Method 70m Approach Bridge
Structural Design
Verification
Model
1 NBR Code
2
Design Boundaries and
Loads
3
Structural Dimensions and
Tendon
YES
NO
Structural Calculation
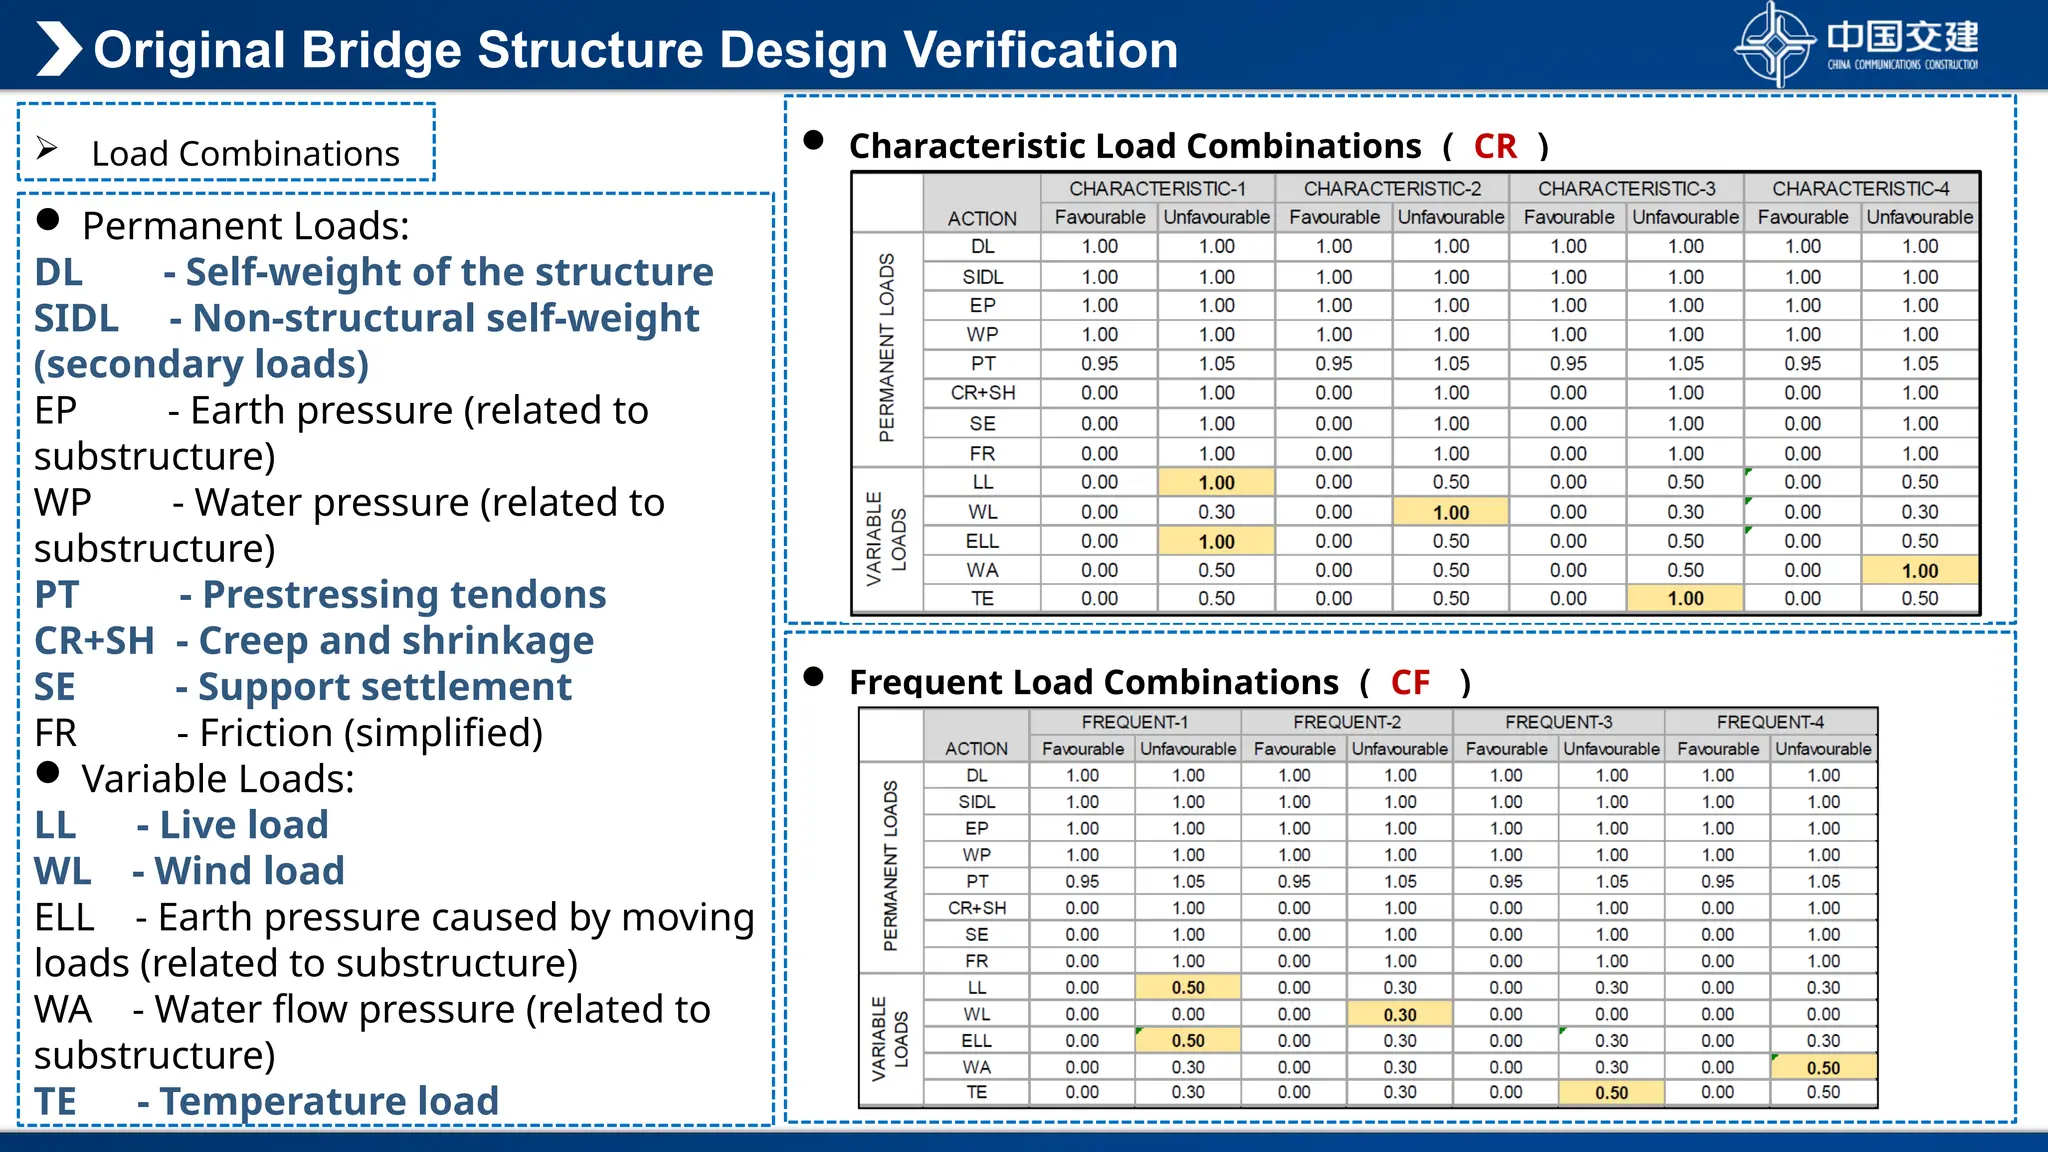
1.Characteristic Combination(CR)
2.Quasi-Permanent Load Combinations (QPC)
3.Frequent Combination(CF)
4.Ultimate Limit States(ULS)
5.Displacement
YES
PASS
NO
Modification
Tendons
/Section
Overall work approach:
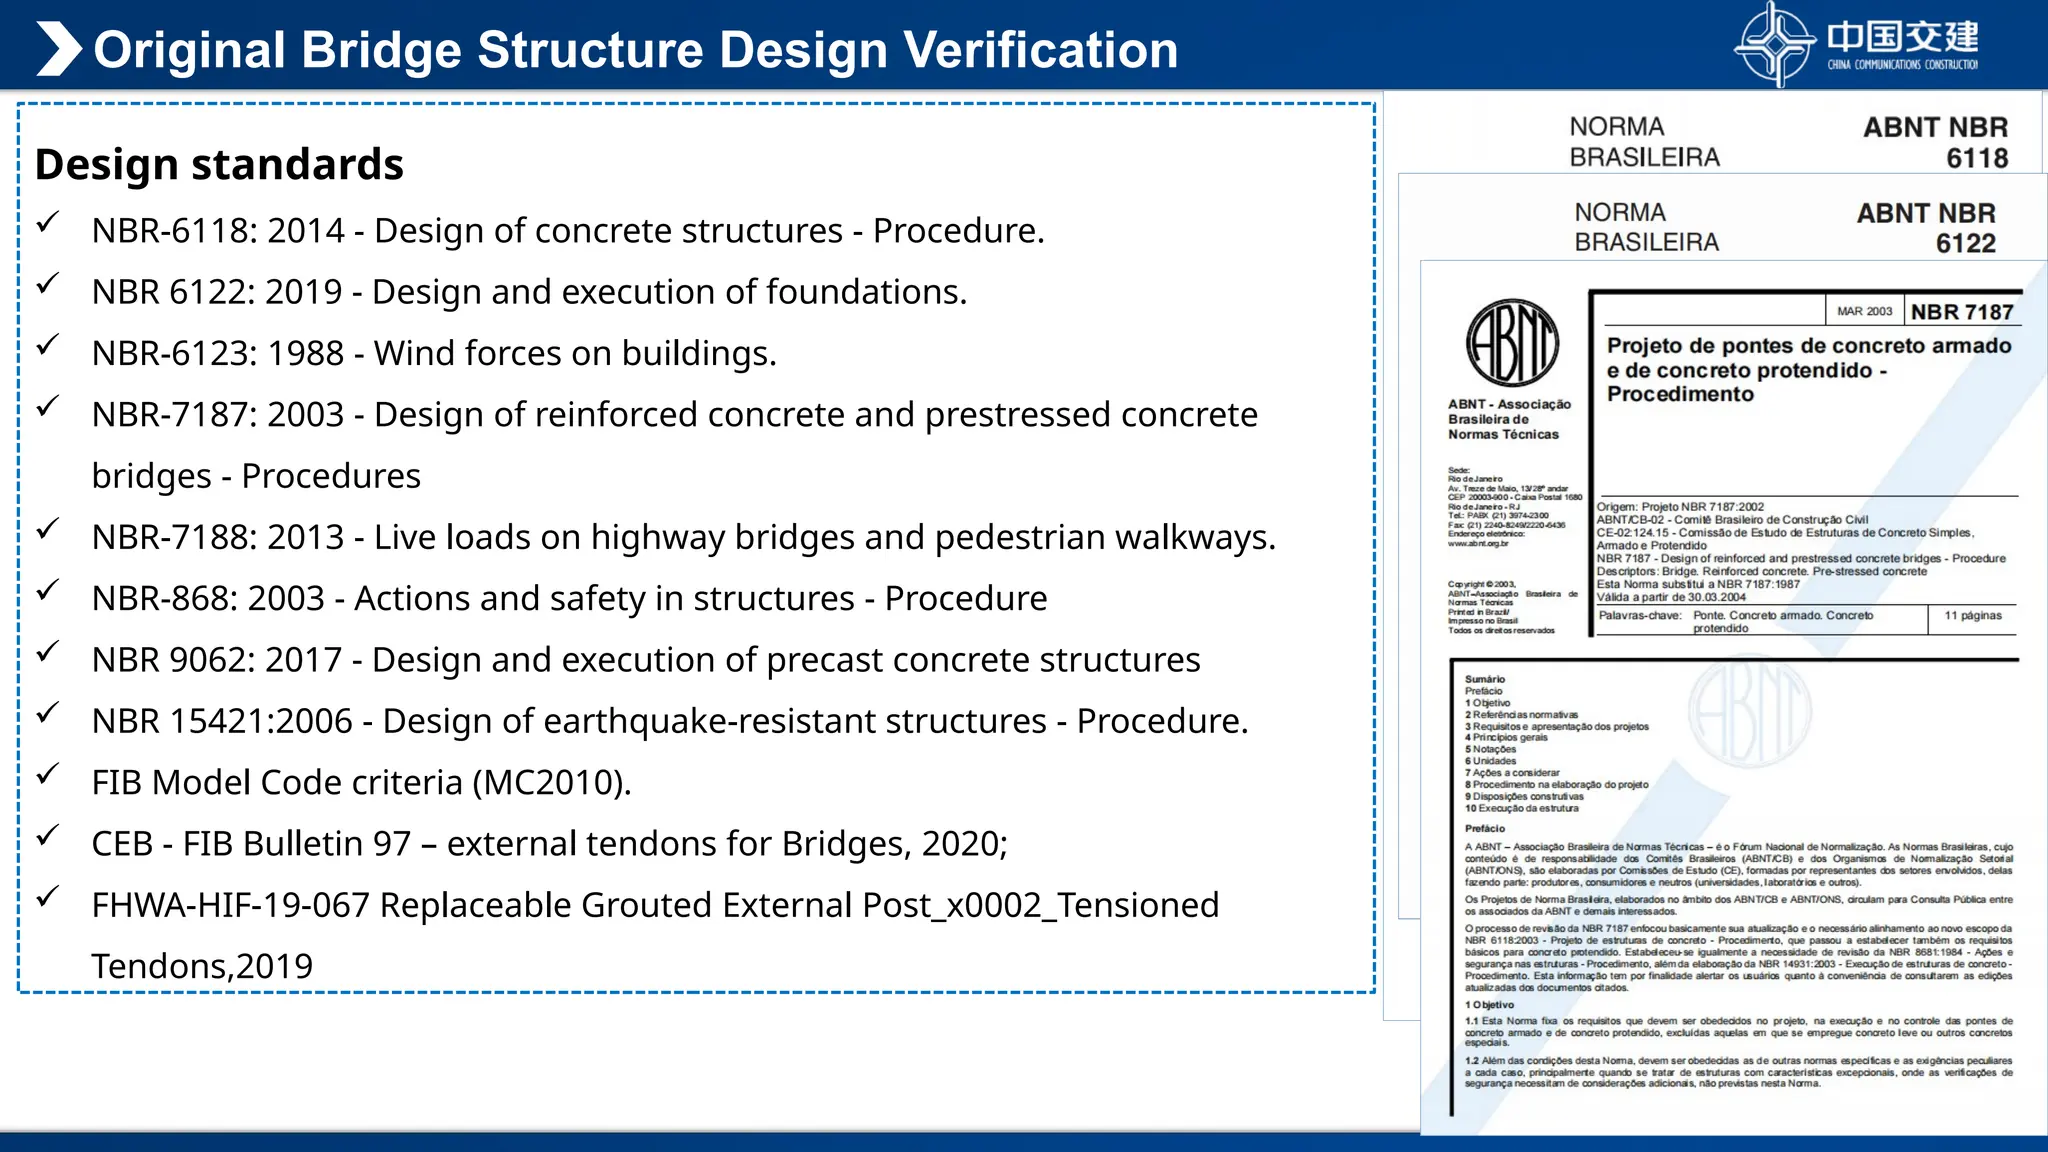
Original Bridge StructureDesign Verification
Design standards
NBR-6118: 2014 - Design of concrete structures - Procedure.
NBR 6122: 2019 - Design and execution of foundations.
NBR-6123: 1988 - Wind forces on buildings.
NBR-7187: 2003 - Design of reinforced concrete and prestressed concrete
bridges - Procedures
NBR-7188: 2013 - Live loads on highway bridges and pedestrian walkways.
NBR-868: 2003 - Actions and safety in structures - Procedure
NBR 9062: 2017 - Design and execution of precast concrete structures
NBR 15421:2006 - Design of earthquake-resistant structures - Procedure.
FIB Model Code criteria (MC2010).
CEB - FIB Bulletin 97 – external tendons for Bridges, 2020;
FHWA-HIF-19-067 Replaceable Grouted External Post_x0002_Tensioned
Tendons,2019
8.
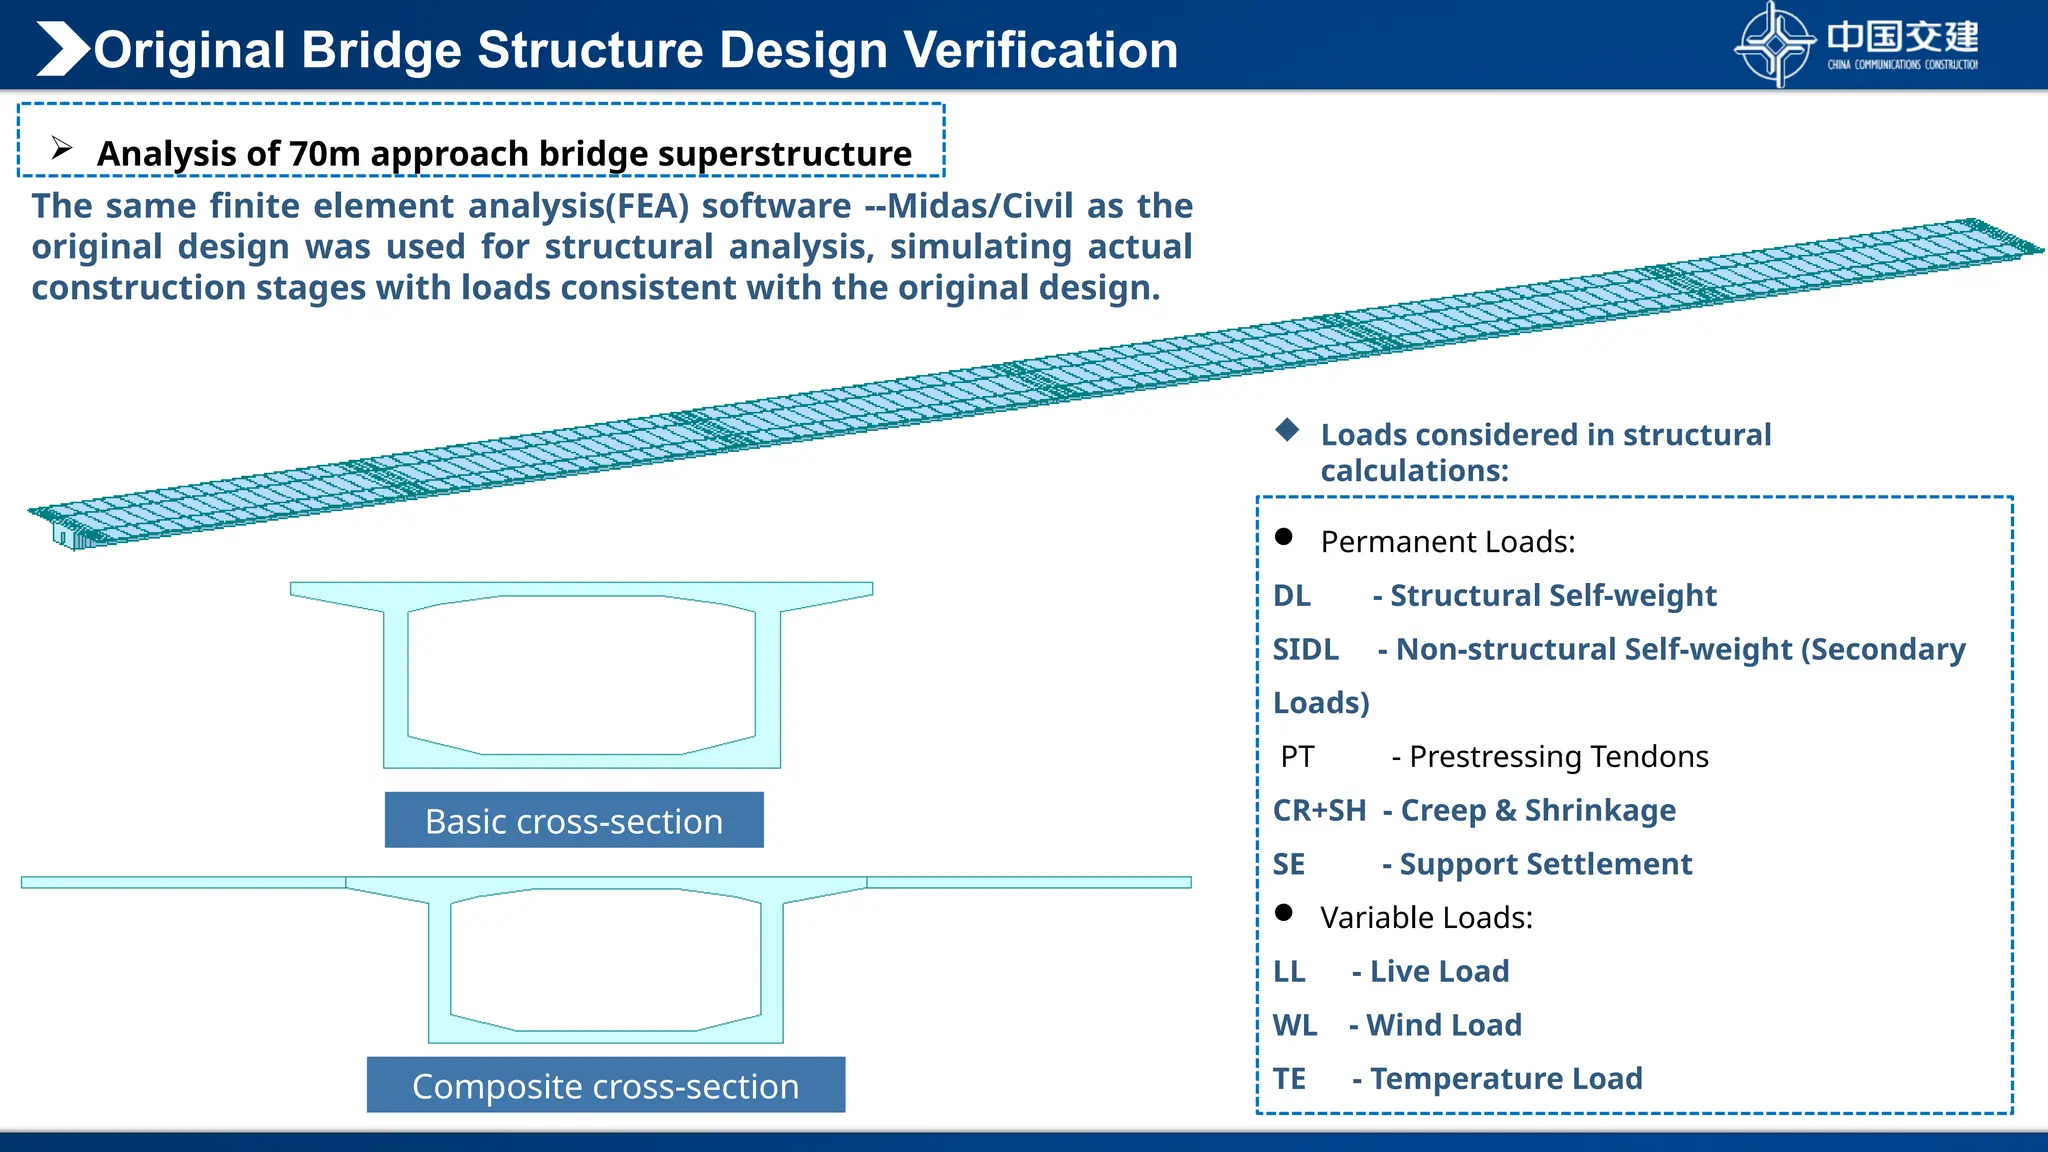
Analysis of70m approach bridge superstructure
Basic cross-section
Composite cross-section
Permanent Loads:
DL - Structural Self-weight
SIDL - Non-structural Self-weight (Secondary
Loads)
PT - Prestressing Tendons
CR+SH - Creep & Shrinkage
SE - Support Settlement
Variable Loads:
LL - Live Load
WL - Wind Load
TE - Temperature Load
The same finite element analysis(FEA) software --Midas/Civil as the
original design was used for structural analysis, simulating actual
construction stages with loads consistent with the original design.
Loads considered in structural
calculations:
Original Bridge Structure Design Verification
9.
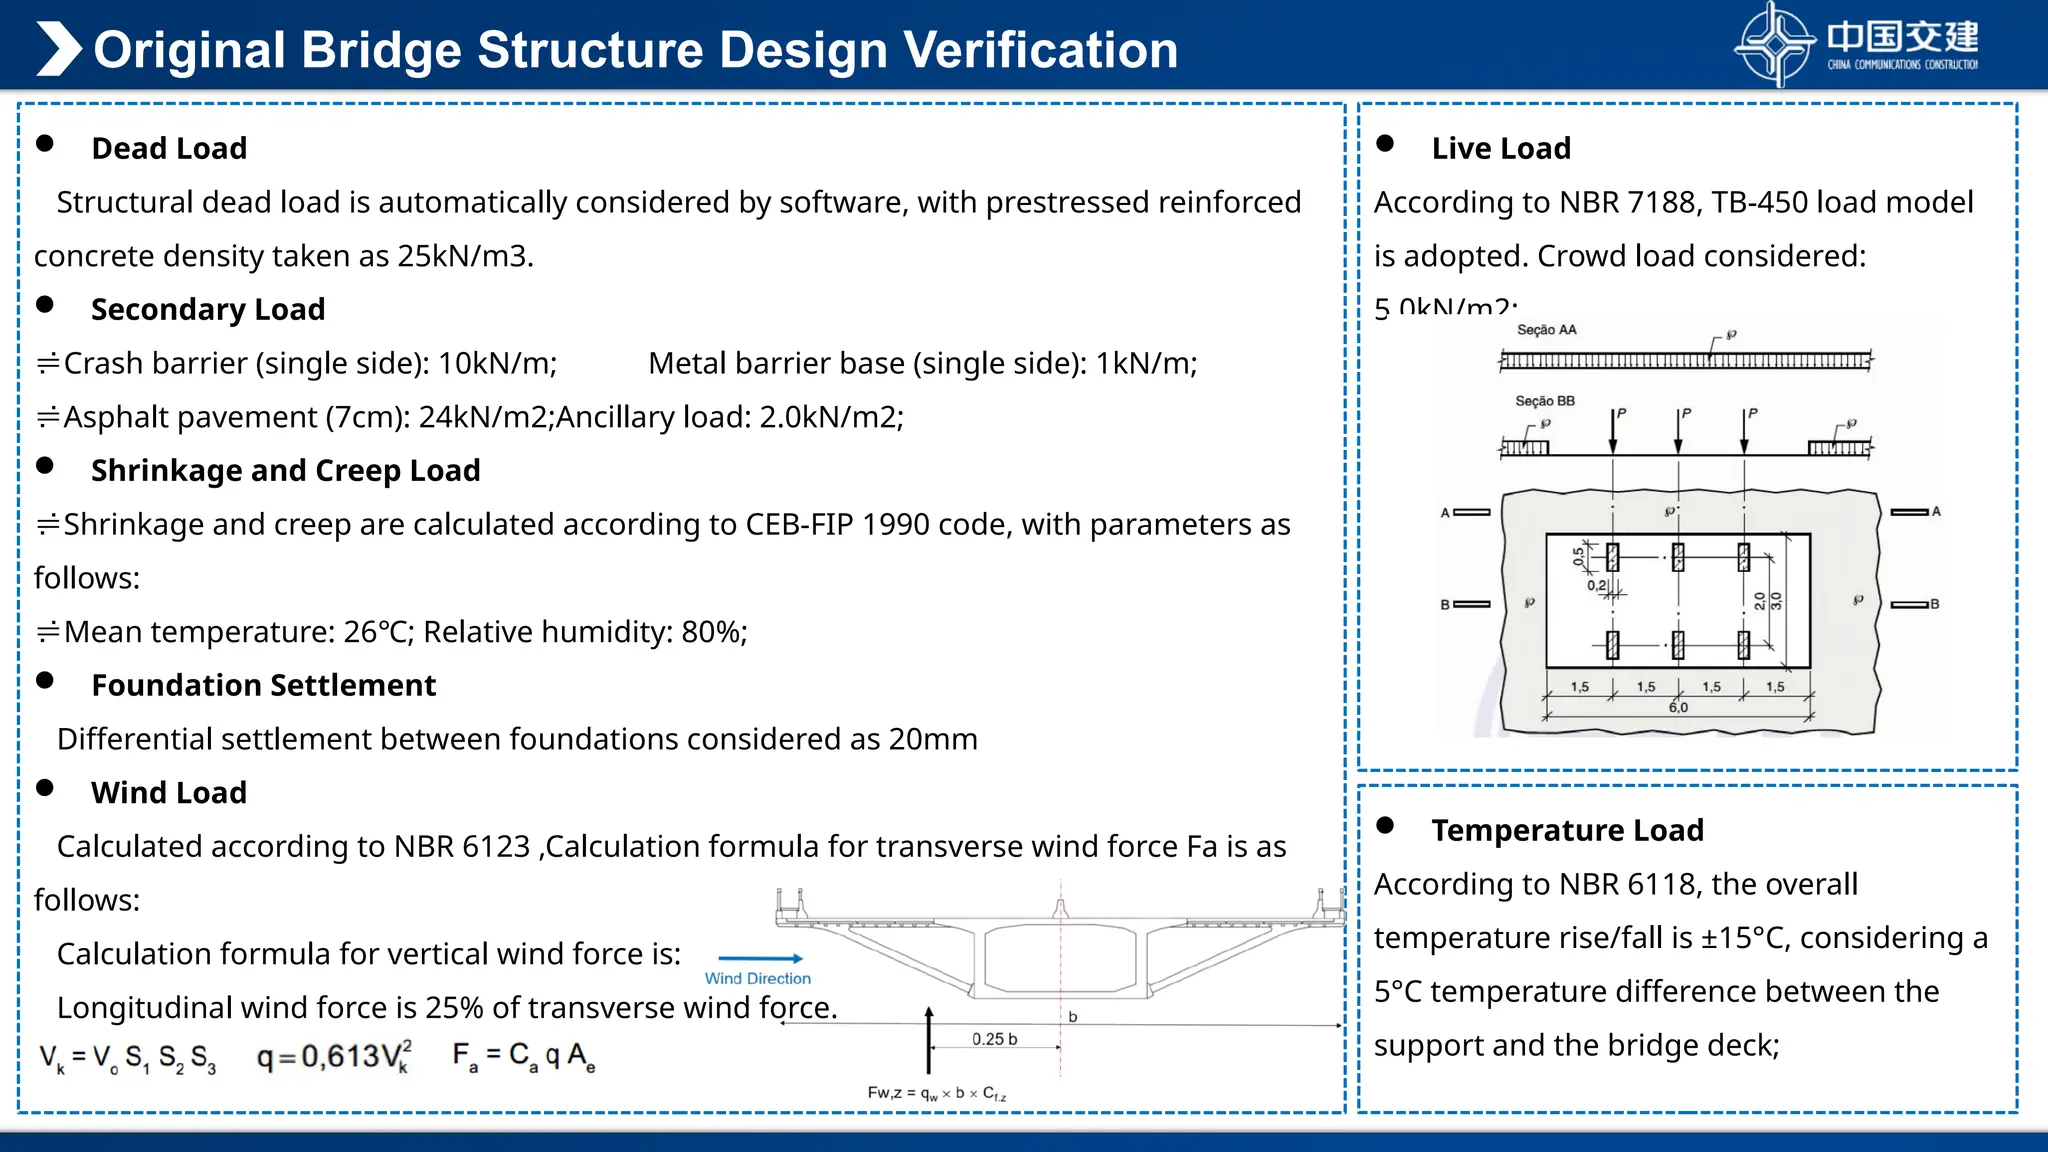
Live Load
Accordingto NBR 7188, TB-450 load model
is adopted. Crowd load considered:
5.0kN/m2;
Dead Load
Structural dead load is automatically considered by software, with prestressed reinforced
concrete density taken as 25kN/m3.
Secondary Load
Crash barrier (single side): 10kN/m; Metal barrier base (single side): 1kN/m;
Asphalt pavement (7cm): 24kN/m2;Ancillary load: 2.0kN/m2;
Shrinkage and Creep Load
Shrinkage and creep are calculated according to CEB-FIP 1990 code, with parameters as
follows:
Mean temperature: 26℃; Relative humidity: 80%;
Foundation Settlement
Differential settlement between foundations considered as 20mm
Wind Load
Calculated according to NBR 6123 ,Calculation formula for transverse wind force Fa is as
follows:
Calculation formula for vertical wind force is:
Longitudinal wind force is 25% of transverse wind force.
Temperature Load
According to NBR 6118, the overall
temperature rise/fall is ±15°C, considering a
5°C temperature difference between the
support and the bridge deck;
Original Bridge Structure Design Verification
10.
Frequent LoadCombinations ( CF )
Characteristic Load Combinations ( CR )
Permanent Loads:
DL - Self-weight of the structure
SIDL - Non-structural self-weight
(secondary loads)
EP - Earth pressure (related to
substructure)
WP - Water pressure (related to
substructure)
PT - Prestressing tendons
CR+SH - Creep and shrinkage
SE - Support settlement
FR - Friction (simplified)
Variable Loads:
LL - Live load
WL - Wind load
ELL - Earth pressure caused by moving
loads (related to substructure)
WA - Water flow pressure (related to
substructure)
TE - Temperature load
Load Combinations
Original Bridge Structure Design Verification
11.
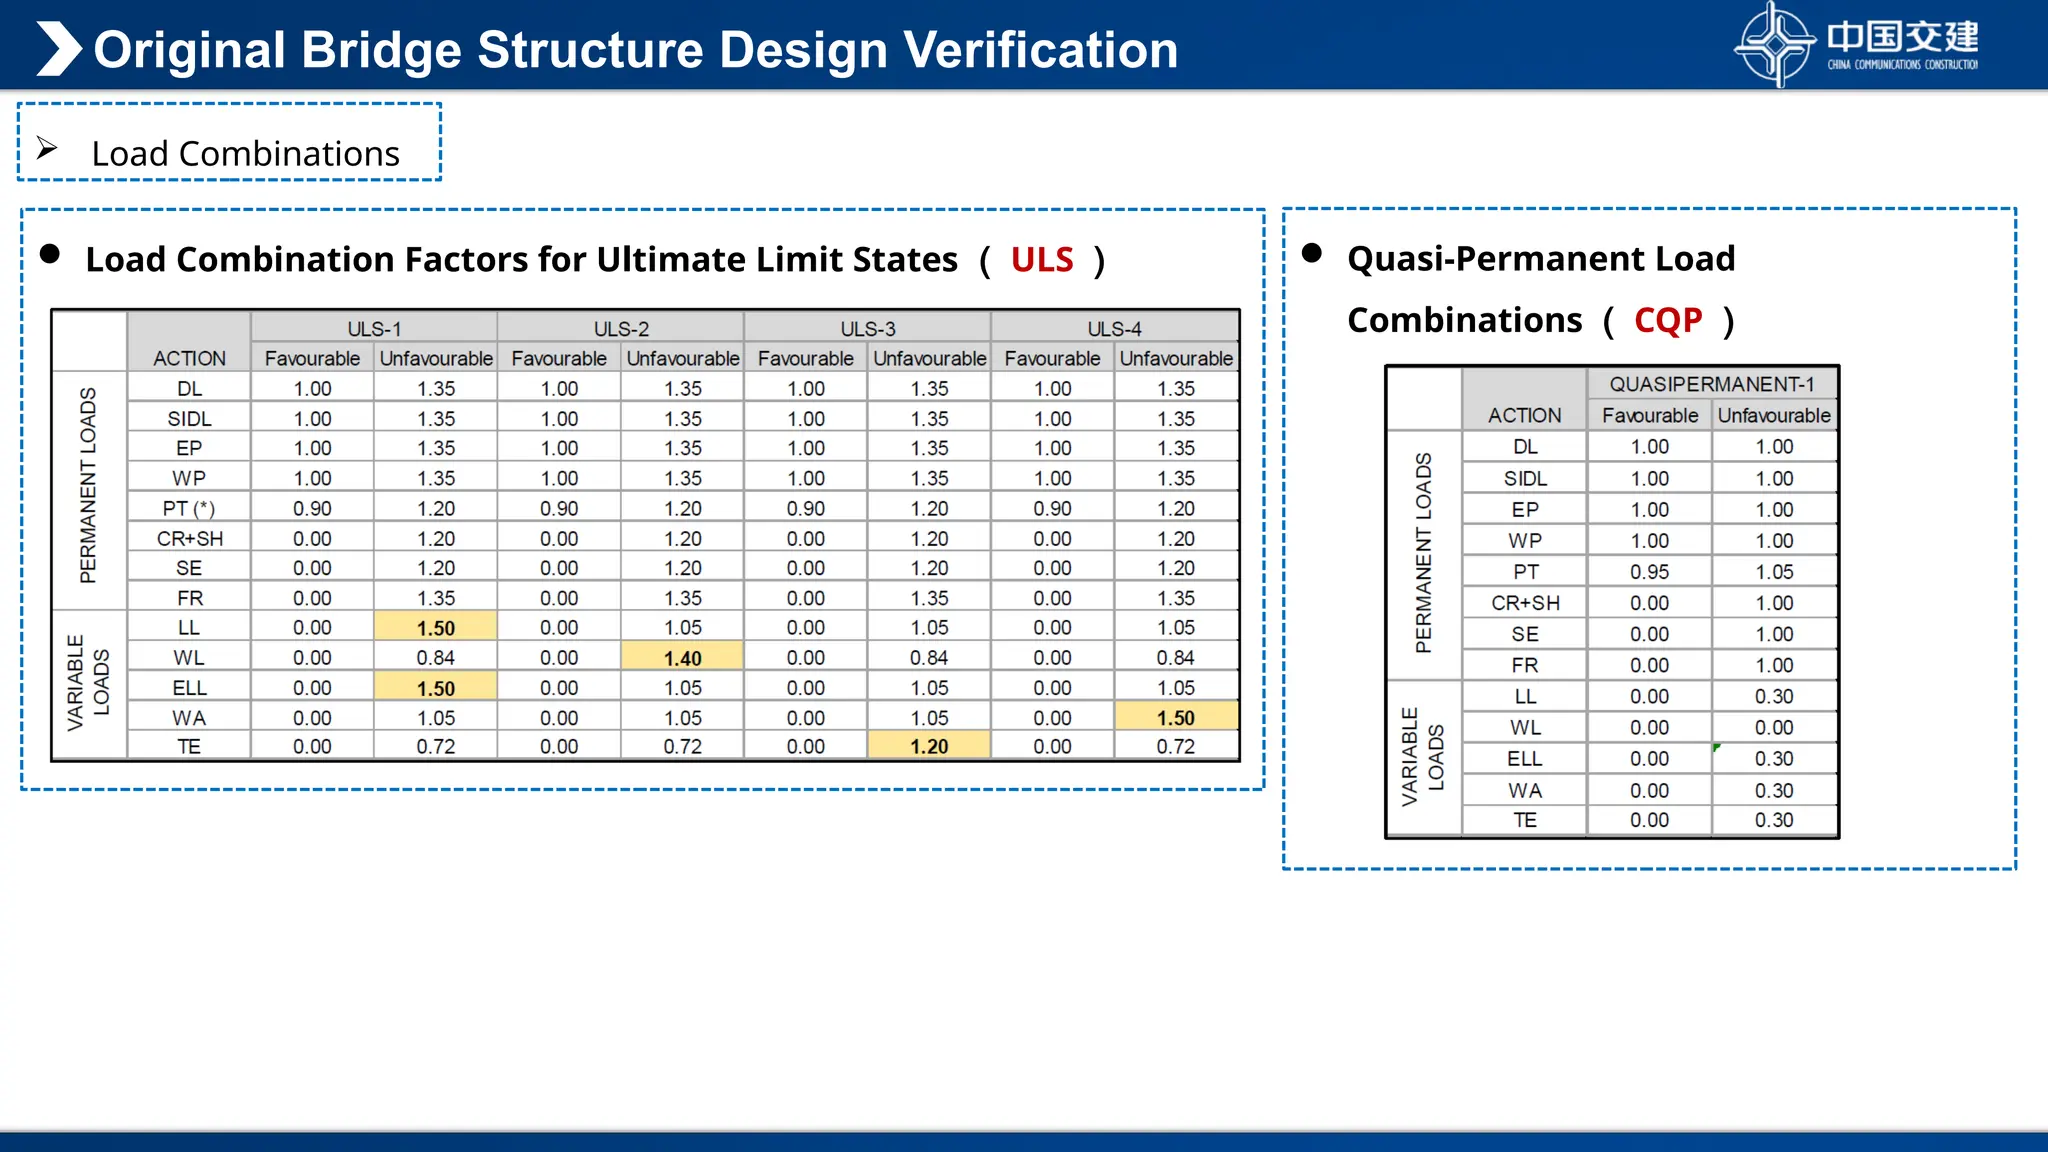
Load CombinationFactors for Ultimate Limit States ( ULS )
Load Combinations
Quasi-Permanent Load
Combinations ( CQP )
Original Bridge Structure Design Verification
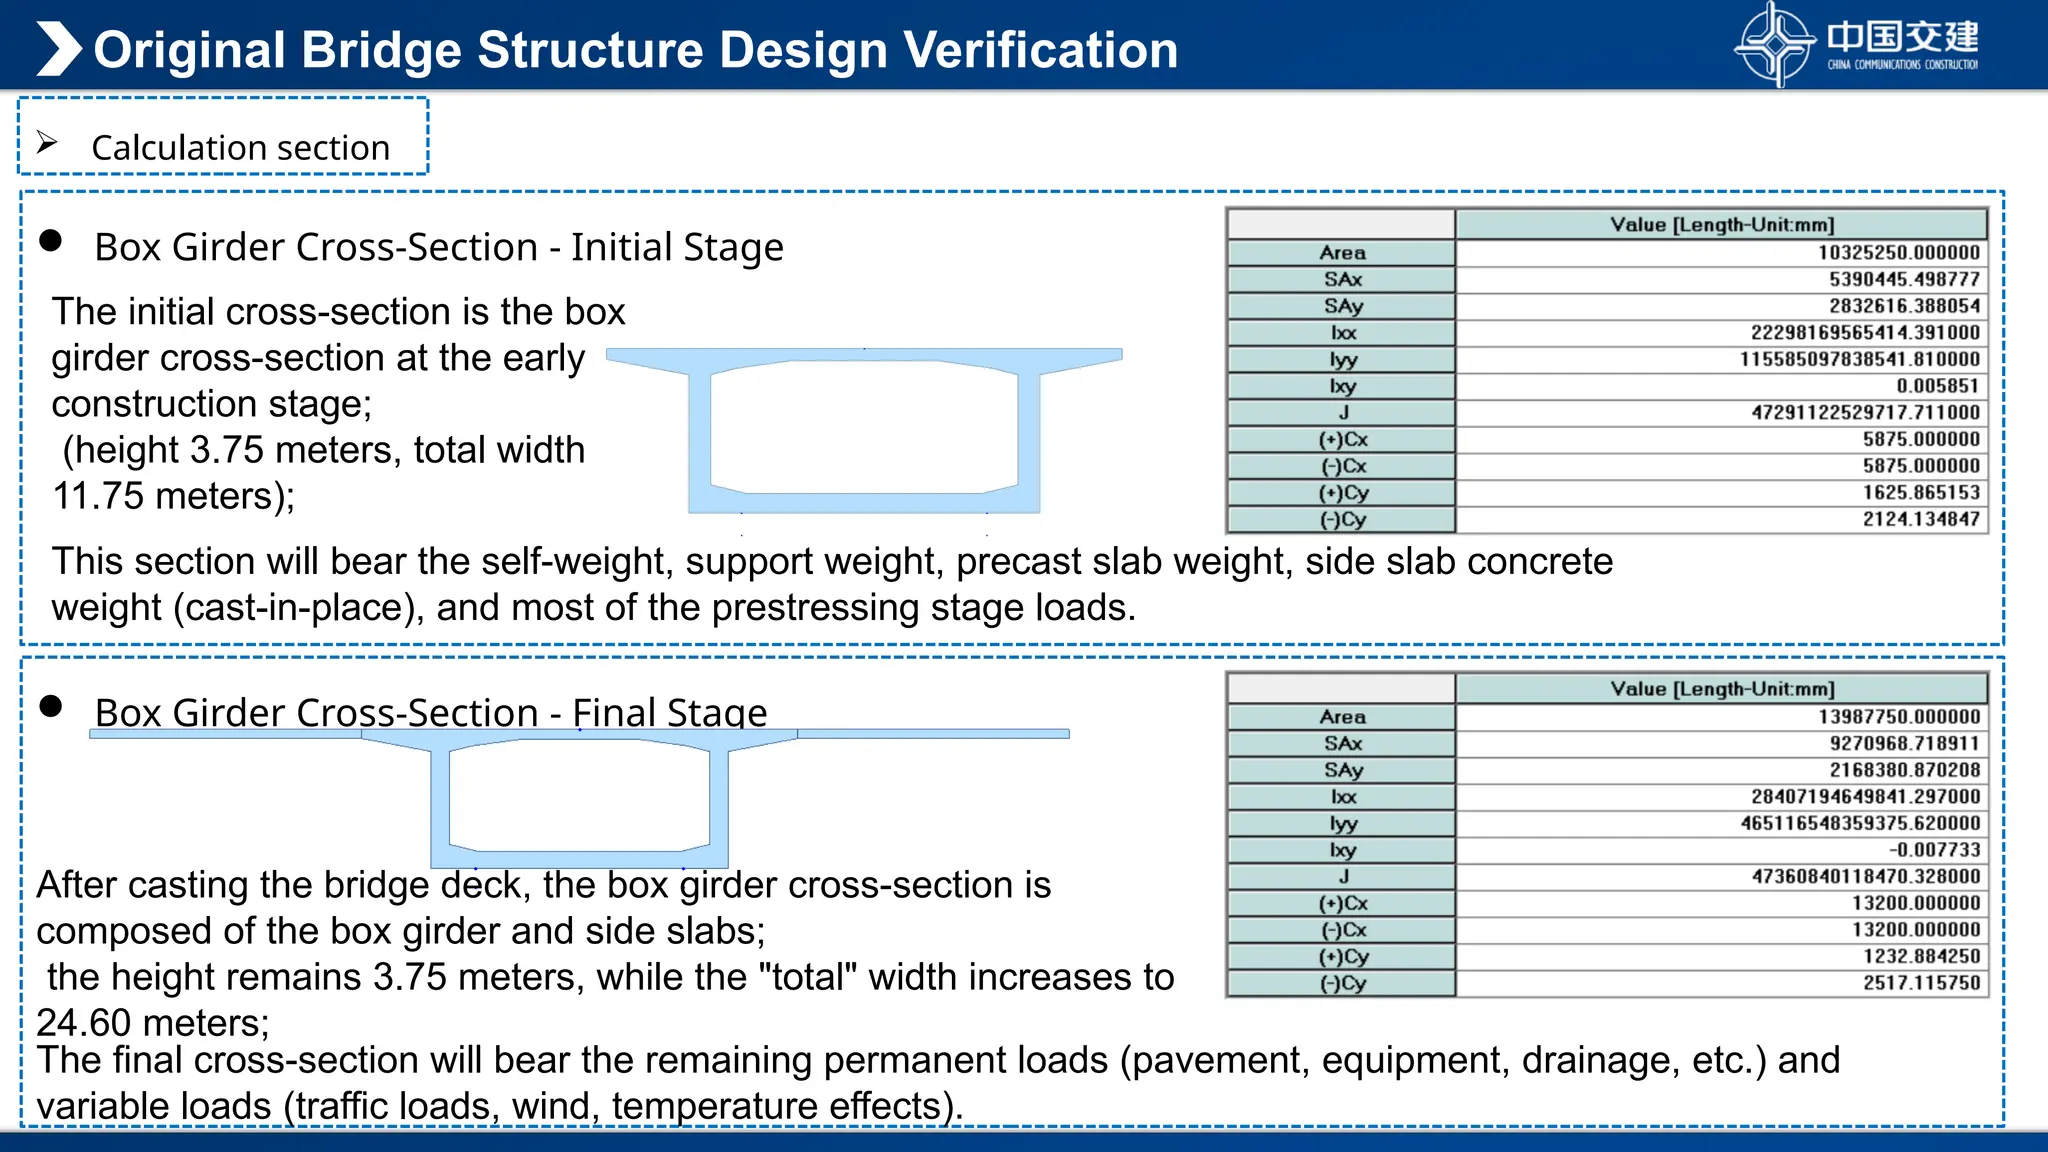
12.
Box GirderCross-Section - Final Stage
Box Girder Cross-Section - Initial Stage
After casting the bridge deck, the box girder cross-section is
composed of the box girder and side slabs;
the height remains 3.75 meters, while the "total" width increases to
24.60 meters;
The initial cross-section is the box
girder cross-section at the early
construction stage;
(height 3.75 meters, total width
11.75 meters);
Calculation section
Original Bridge Structure Design Verification
This section will bear the self-weight, support weight, precast slab weight, side slab concrete
weight (cast-in-place), and most of the prestressing stage loads.
The final cross-section will bear the remaining permanent loads (pavement, equipment, drainage, etc.) and
variable loads (traffic loads, wind, temperature effects).
13.
Original Bridge StructureDesign Verification
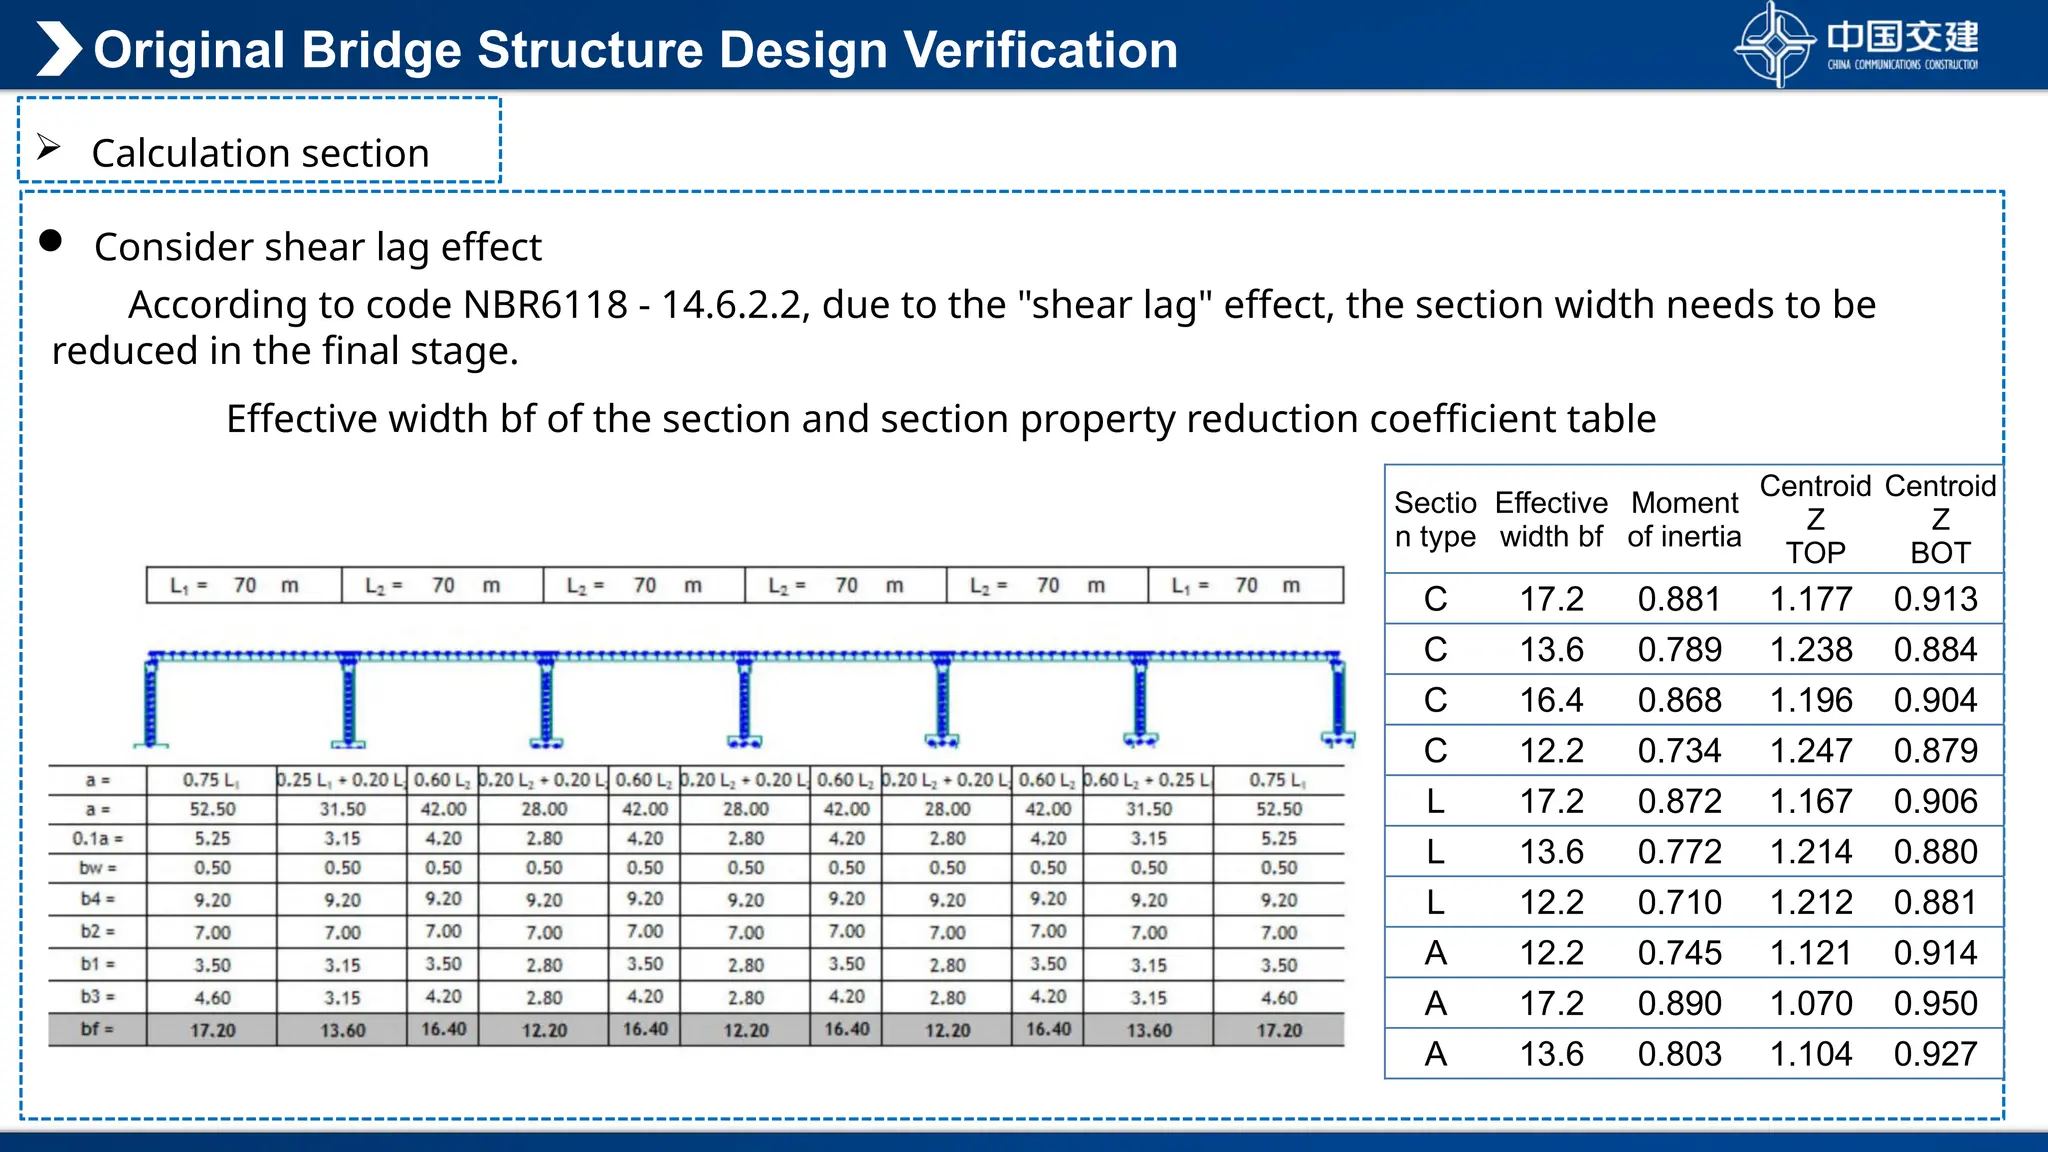
Consider shear lag effect
Calculation section
According to code NBR6118 - 14.6.2.2, due to the "shear lag" effect, the section width needs to be
reduced in the final stage.
Effective width bf of the section and section property reduction coefficient table
Sectio
n type
Effective
width bf
Moment
of inertia
Centroid
Z
TOP
Centroid
Z
BOT
C 17.2 0.881 1.177 0.913
C 13.6 0.789 1.238 0.884
C 16.4 0.868 1.196 0.904
C 12.2 0.734 1.247 0.879
L 17.2 0.872 1.167 0.906
L 13.6 0.772 1.214 0.880
L 12.2 0.710 1.212 0.881
A 12.2 0.745 1.121 0.914
A 17.2 0.890 1.070 0.950
A 13.6 0.803 1.104 0.927
14.
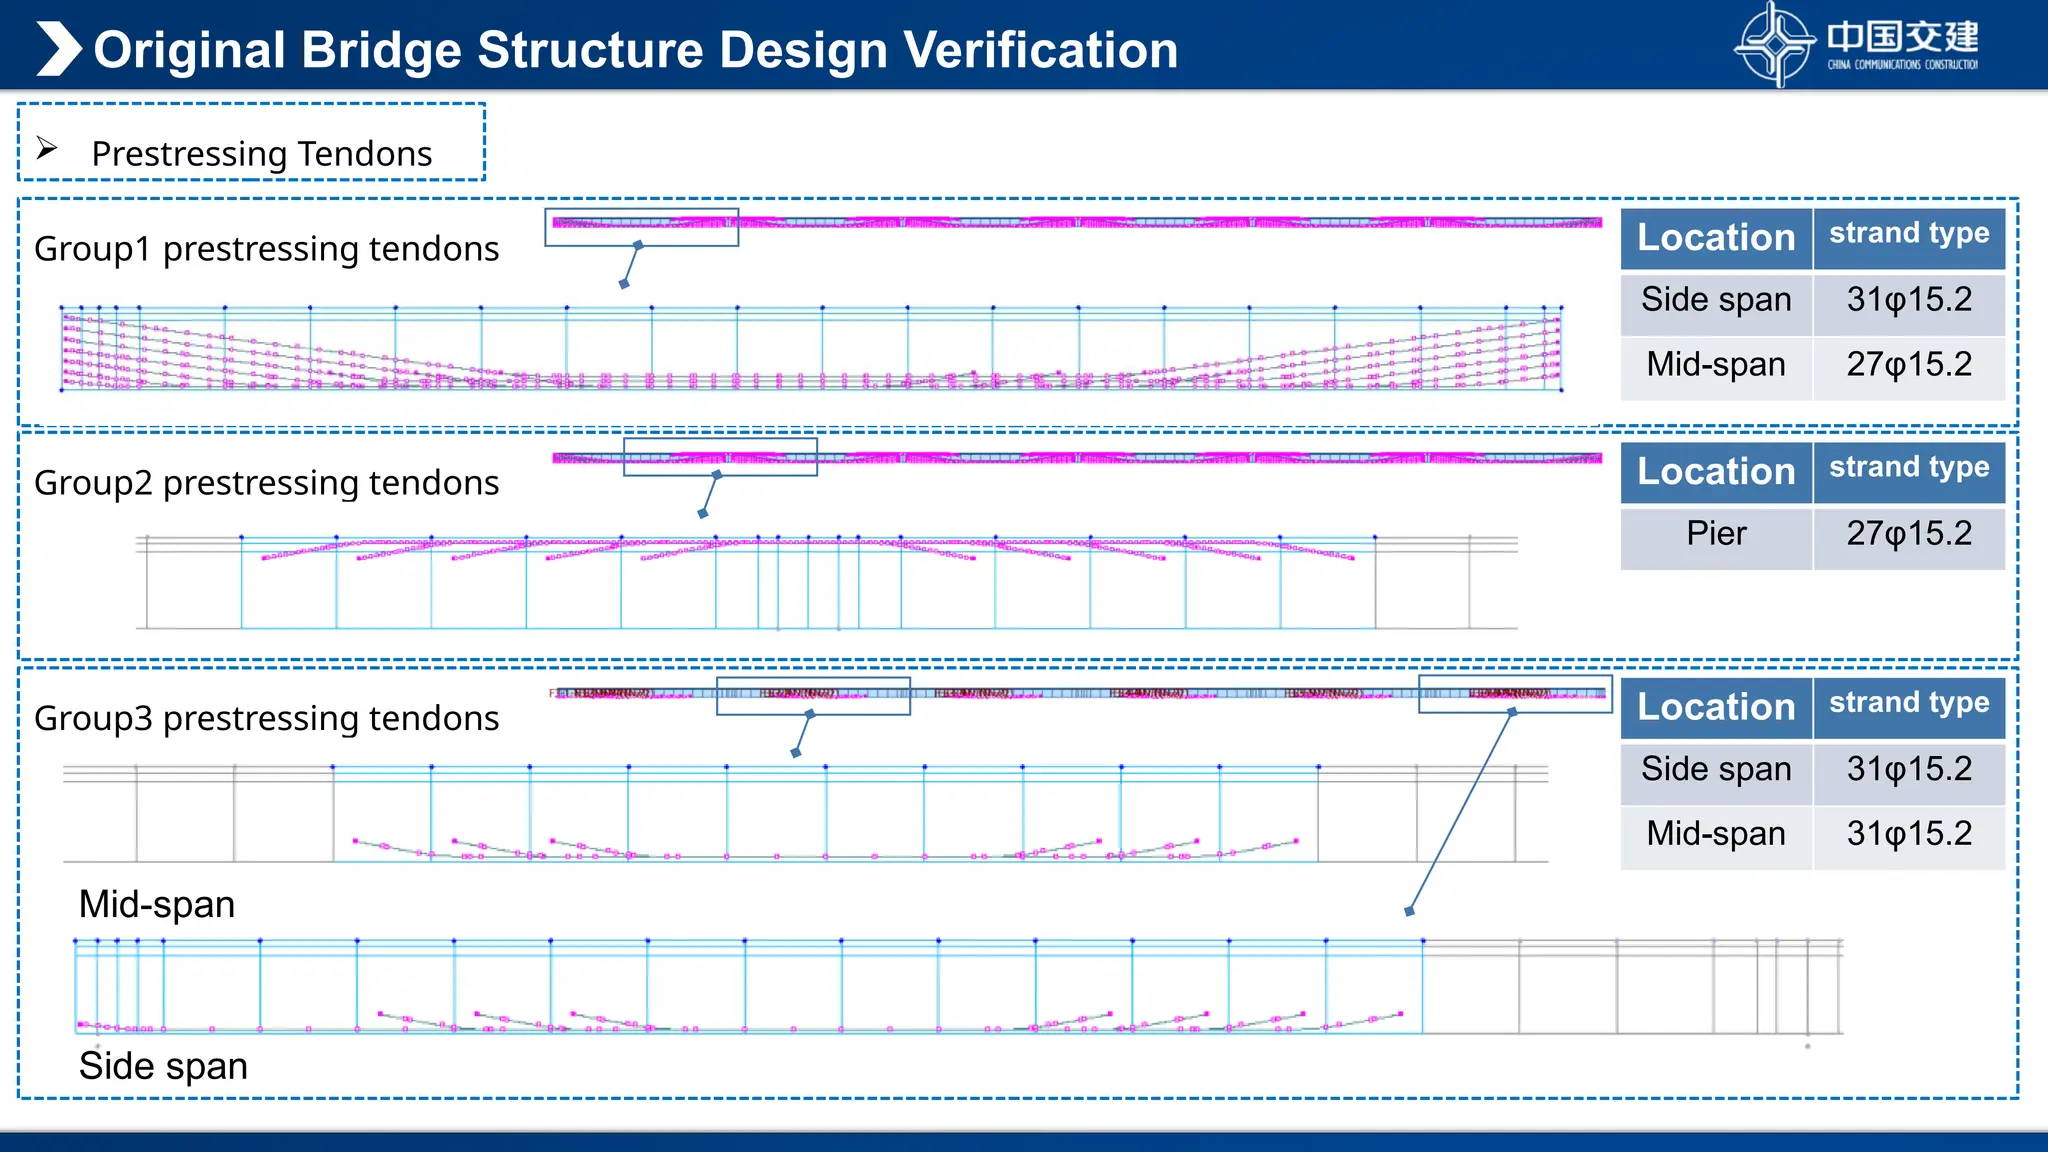
Group1 prestressing tendons
OriginalBridge Structure Design Verification
Prestressing Tendons
Location strand type
Side span 31φ15.2
Mid-span 27φ15.2
Group2 prestressing tendons Location strand type
Pier 27φ15.2
Group3 prestressing tendons Location strand type
Side span 31φ15.2
Mid-span 31φ15.2
Mid-span
Side span
15.
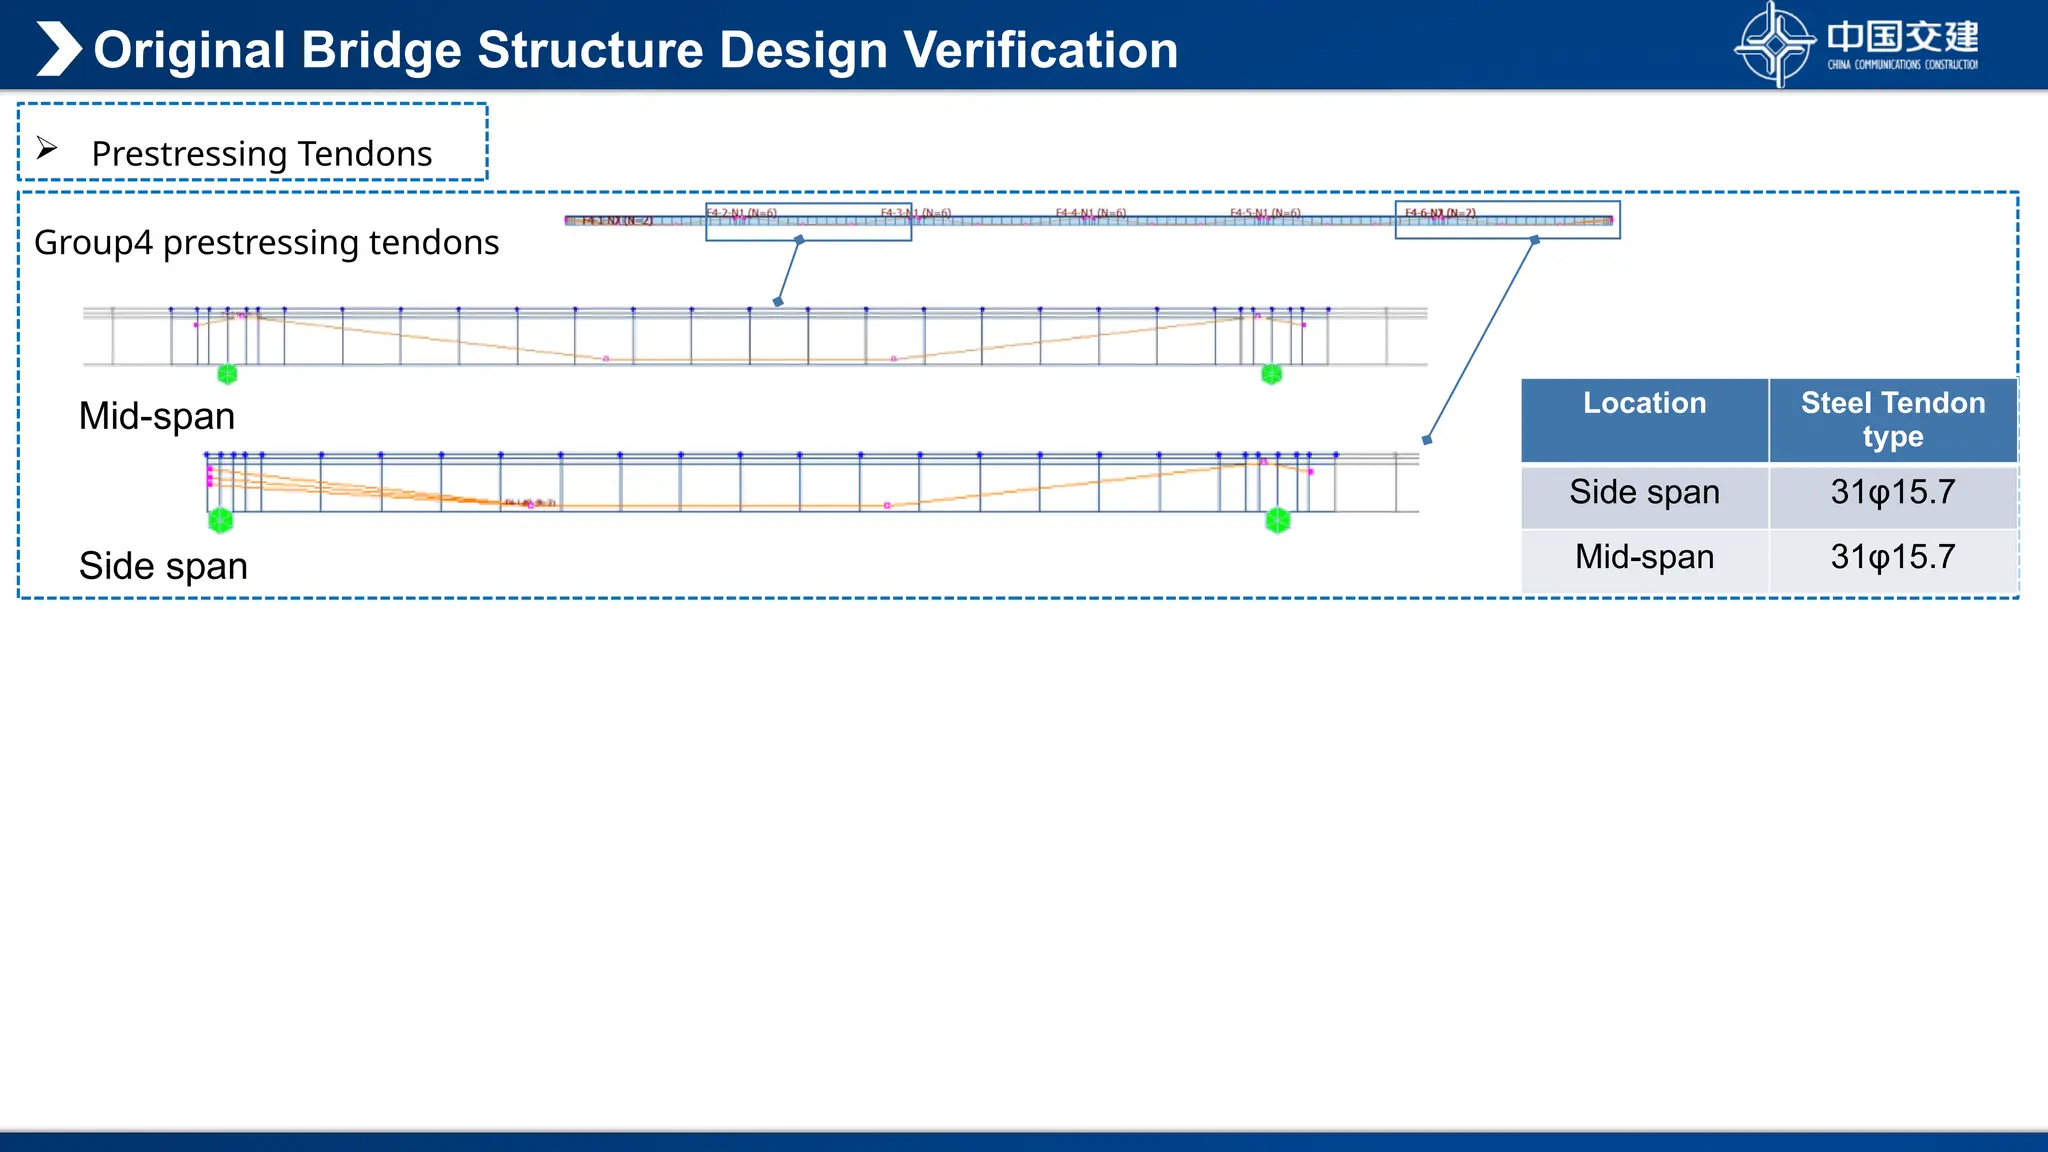
Group4 prestressing tendons
OriginalBridge Structure Design Verification
Prestressing Tendons
Mid-span
Side span
Location Steel Tendon
type
Side span 31φ15.7
Mid-span 31φ15.7
16.
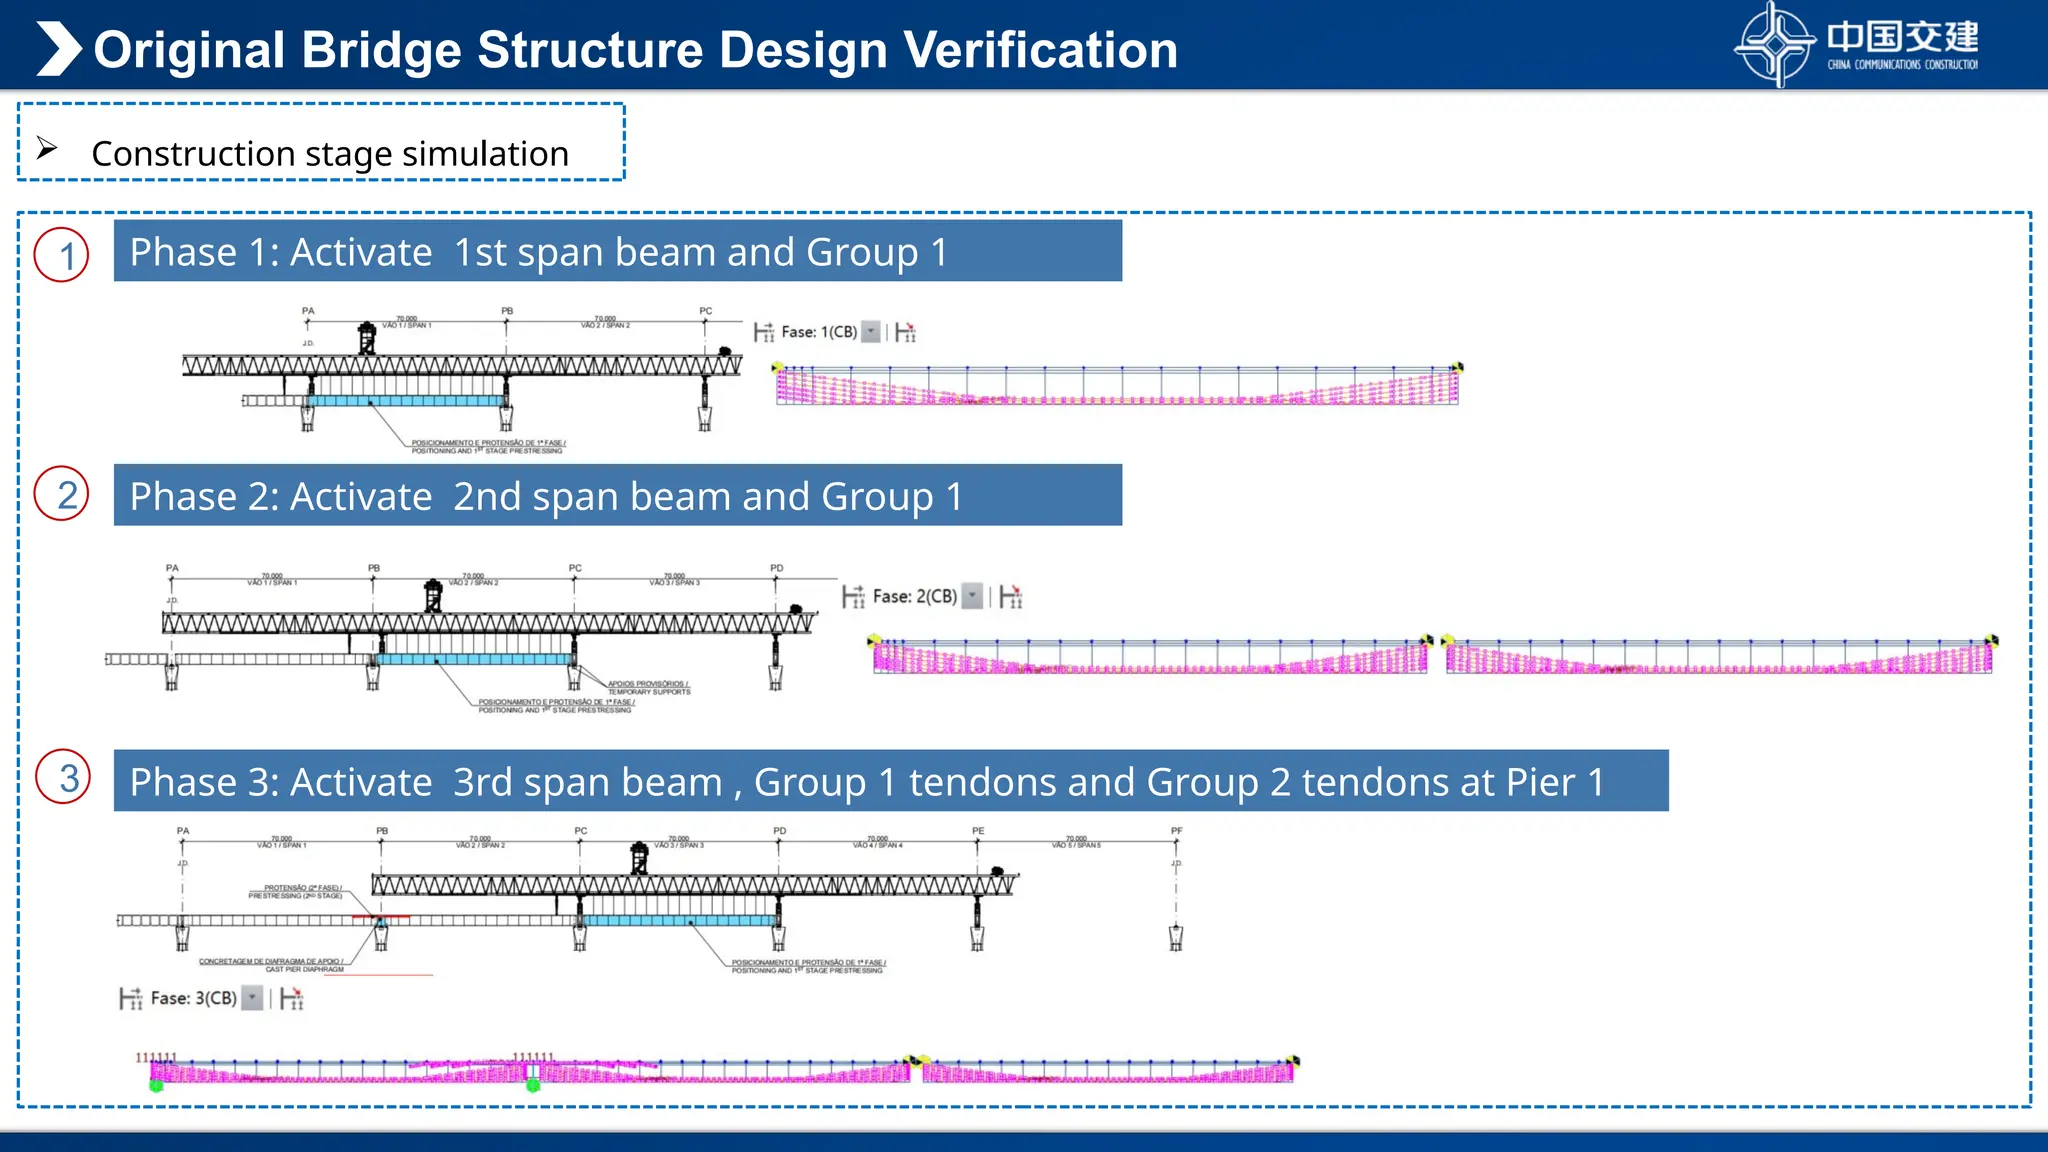
Original Bridge StructureDesign Verification
Construction stage simulation
1
2
3
Phase 1: Activate 1st span beam and Group 1
tendons
Phase 2: Activate 2nd span beam and Group 1
tendons
Phase 3: Activate 3rd span beam , Group 1 tendons and Group 2 tendons at Pier 1
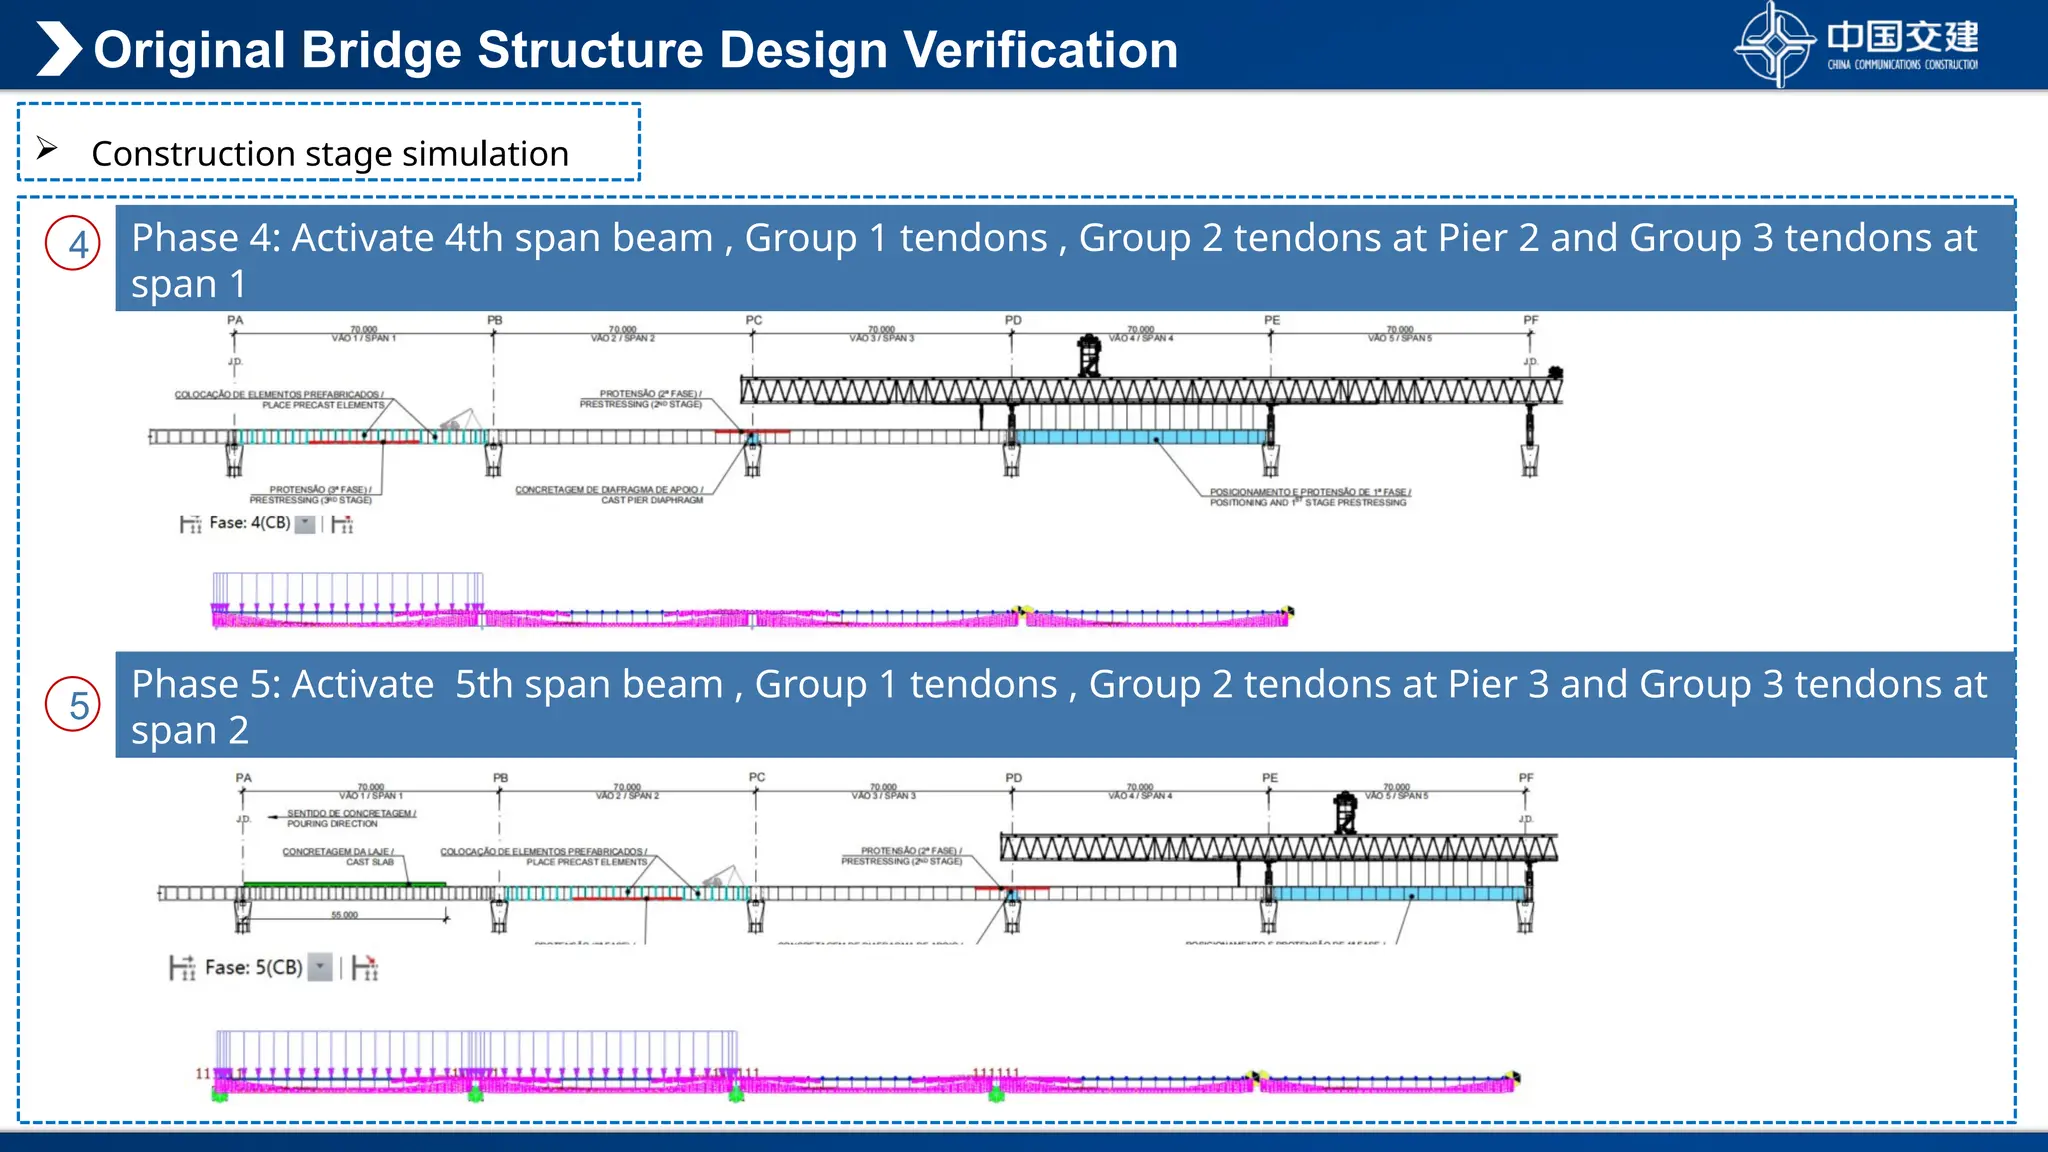
17.
Original Bridge StructureDesign Verification
Construction stage simulation
5
4 Phase 4: Activate 4th span beam , Group 1 tendons , Group 2 tendons at Pier 2 and Group 3 tendons at
span 1
Phase 5: Activate 5th span beam , Group 1 tendons , Group 2 tendons at Pier 3 and Group 3 tendons at
span 2
18.
Original Bridge StructureDesign Verification
Construction stage simulation
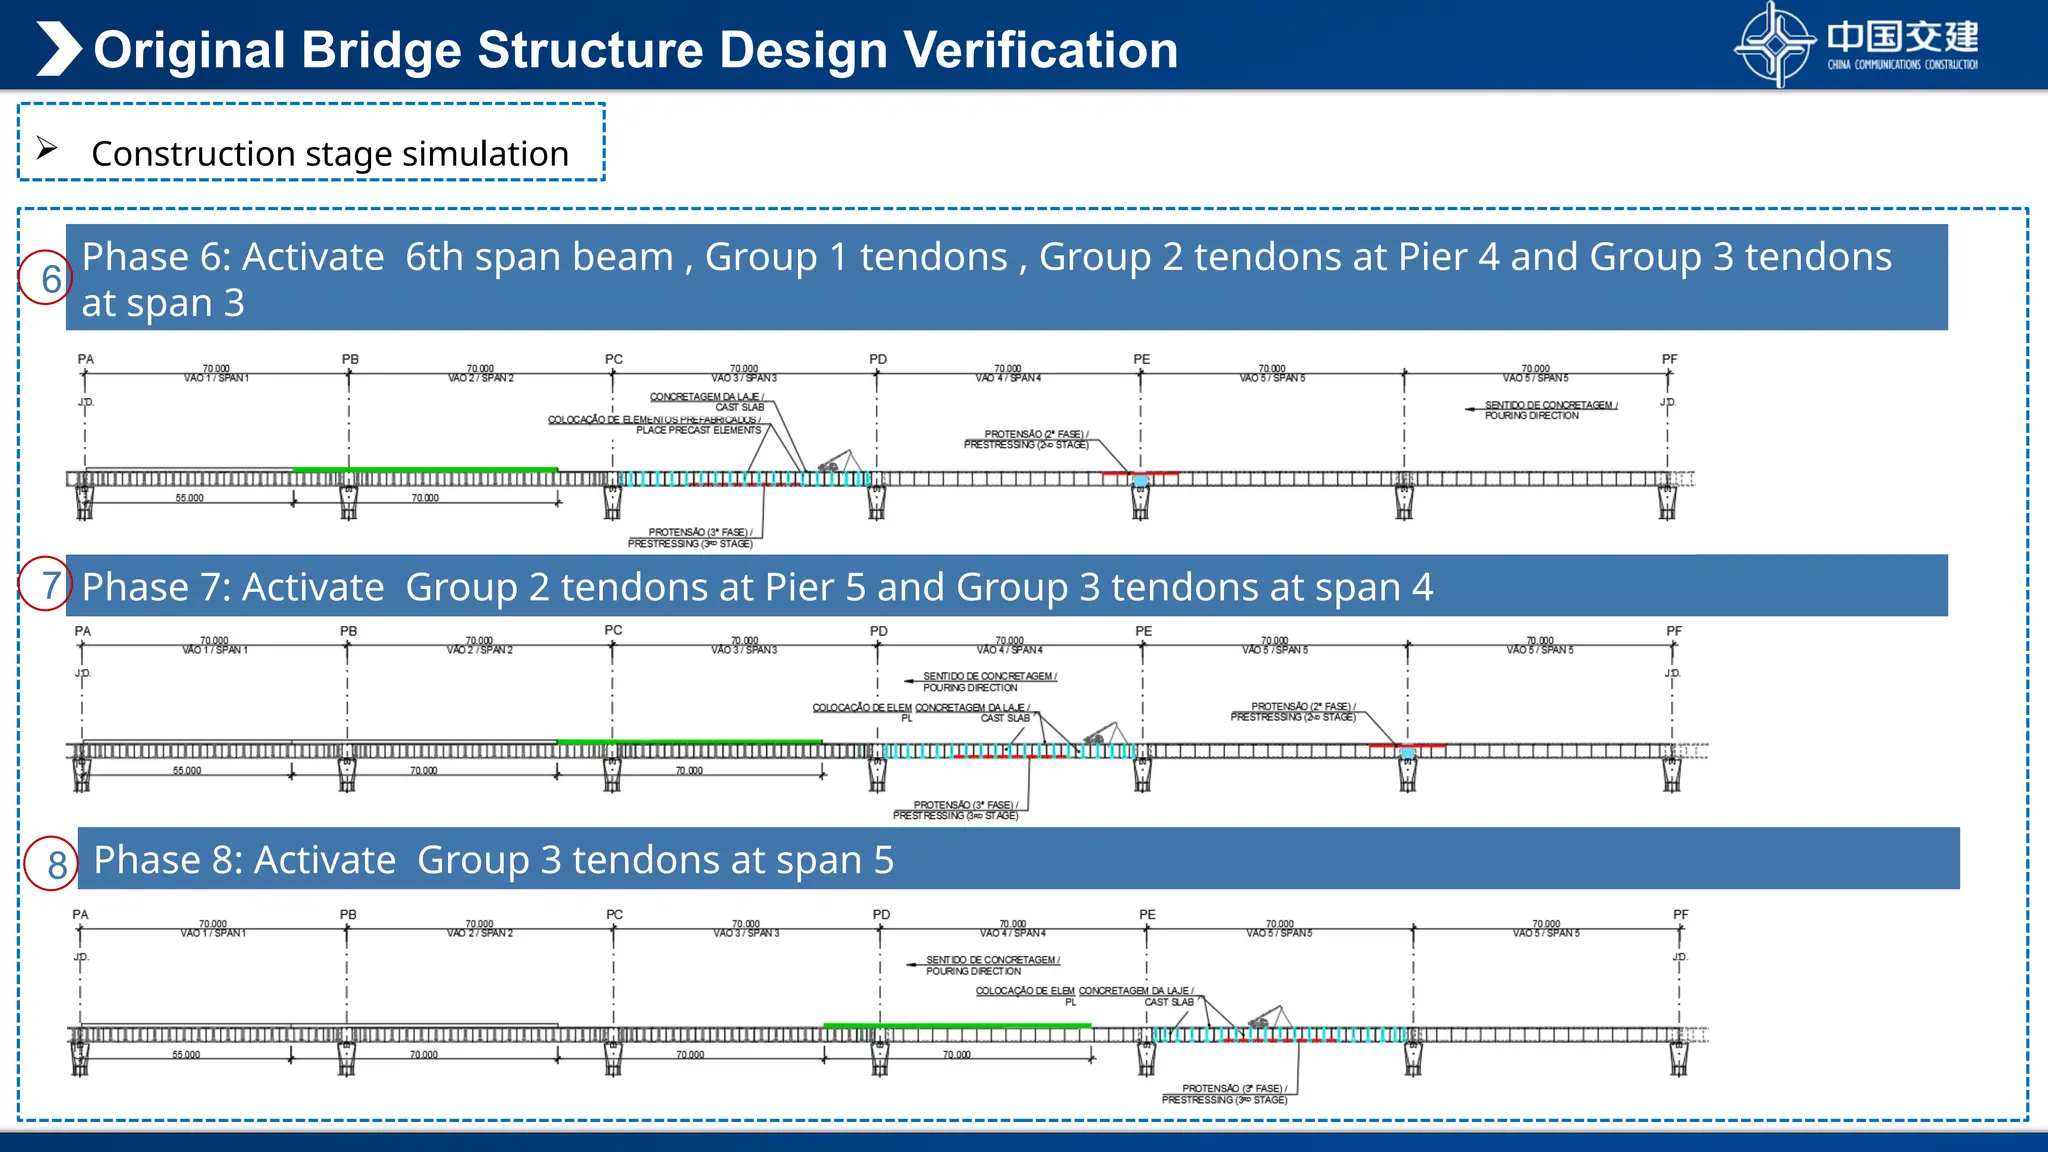
Phase 6: Activate 6th span beam , Group 1 tendons , Group 2 tendons at Pier 4 and Group 3 tendons
at span 3
Phase 7: Activate Group 2 tendons at Pier 5 and Group 3 tendons at span 4
Phase 8: Activate Group 3 tendons at span 5
6
7
8
19.
Original Bridge StructureDesign Verification
Construction stage simulation
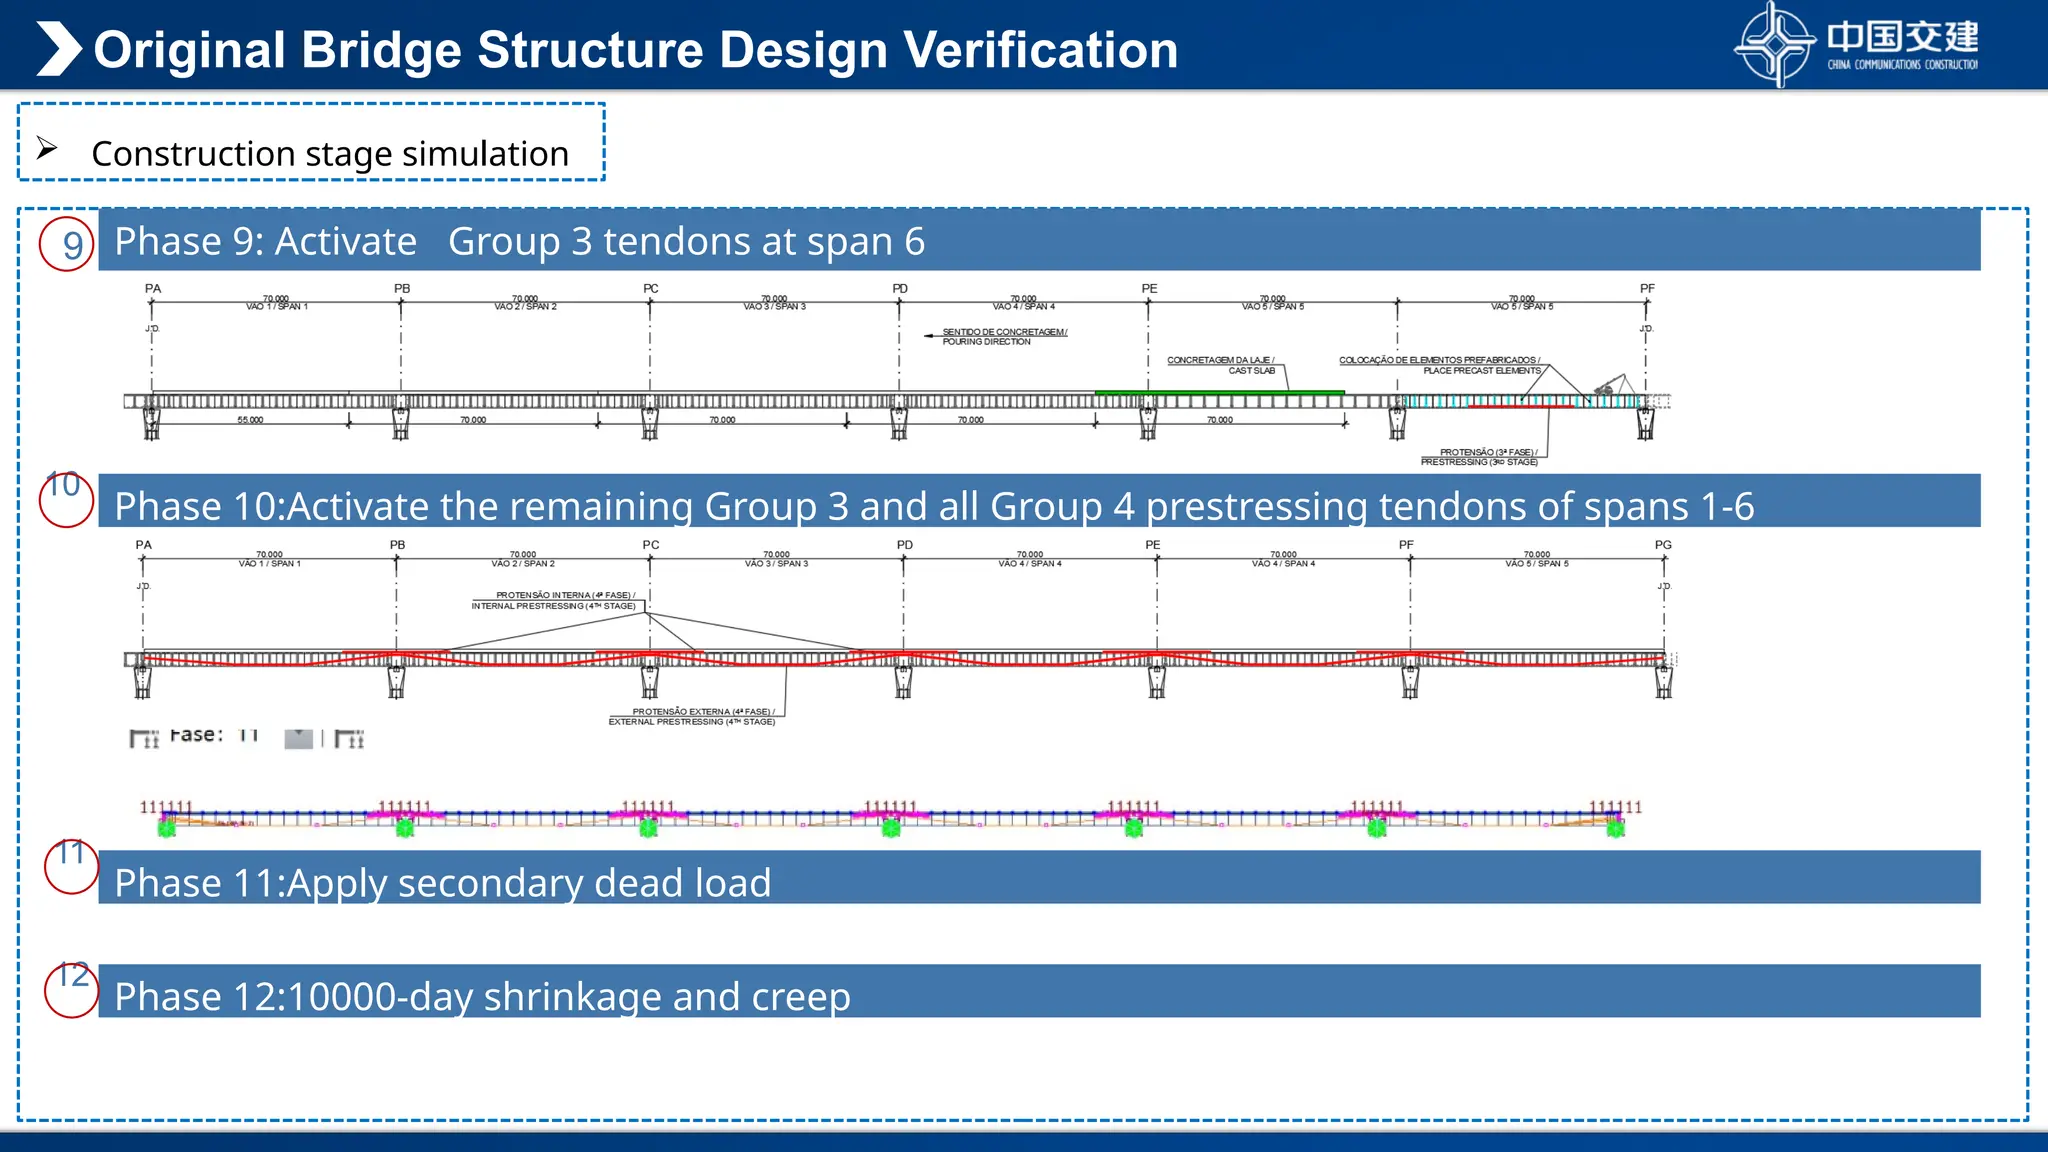
10
11
12
Phase 10:Activate the remaining Group 3 and all Group 4 prestressing tendons of spans 1-6
Phase 9: Activate Group 3 tendons at span 6
Phase 11:Apply secondary dead load
Phase 12:10000-day shrinkage and creep
9
20.
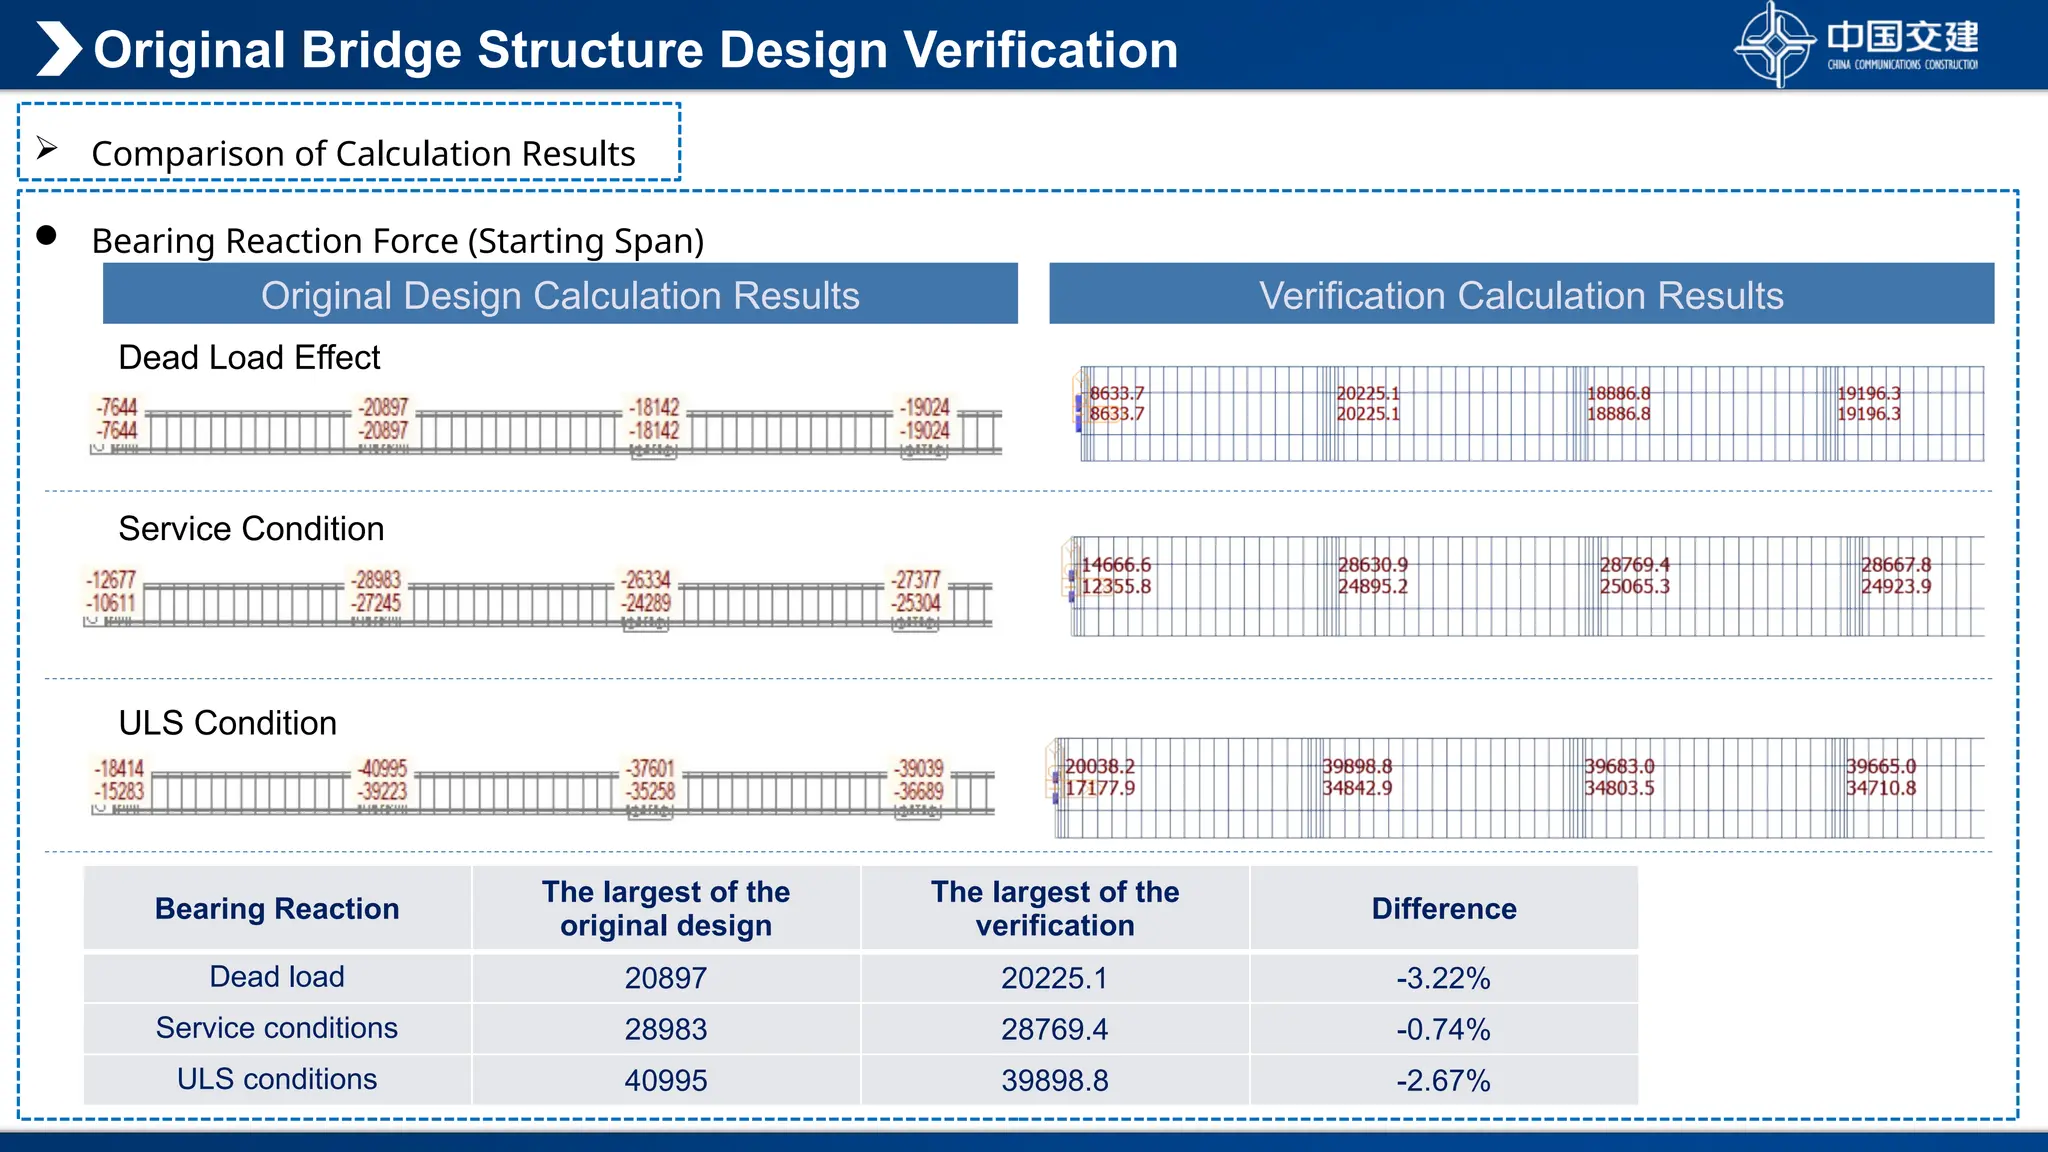
Bearing ReactionForce (Starting Span)
Comparison of Calculation Results
Original Design Calculation Results Verification Calculation Results
Bearing Reaction
The largest of the
original design
The largest of the
verification
Difference
Dead load 20897 20225.1 -3.22%
Service conditions 28983 28769.4 -0.74%
ULS conditions 40995 39898.8 -2.67%
Dead Load Effect
Service Condition
ULS Condition
Original Bridge Structure Design Verification
21.
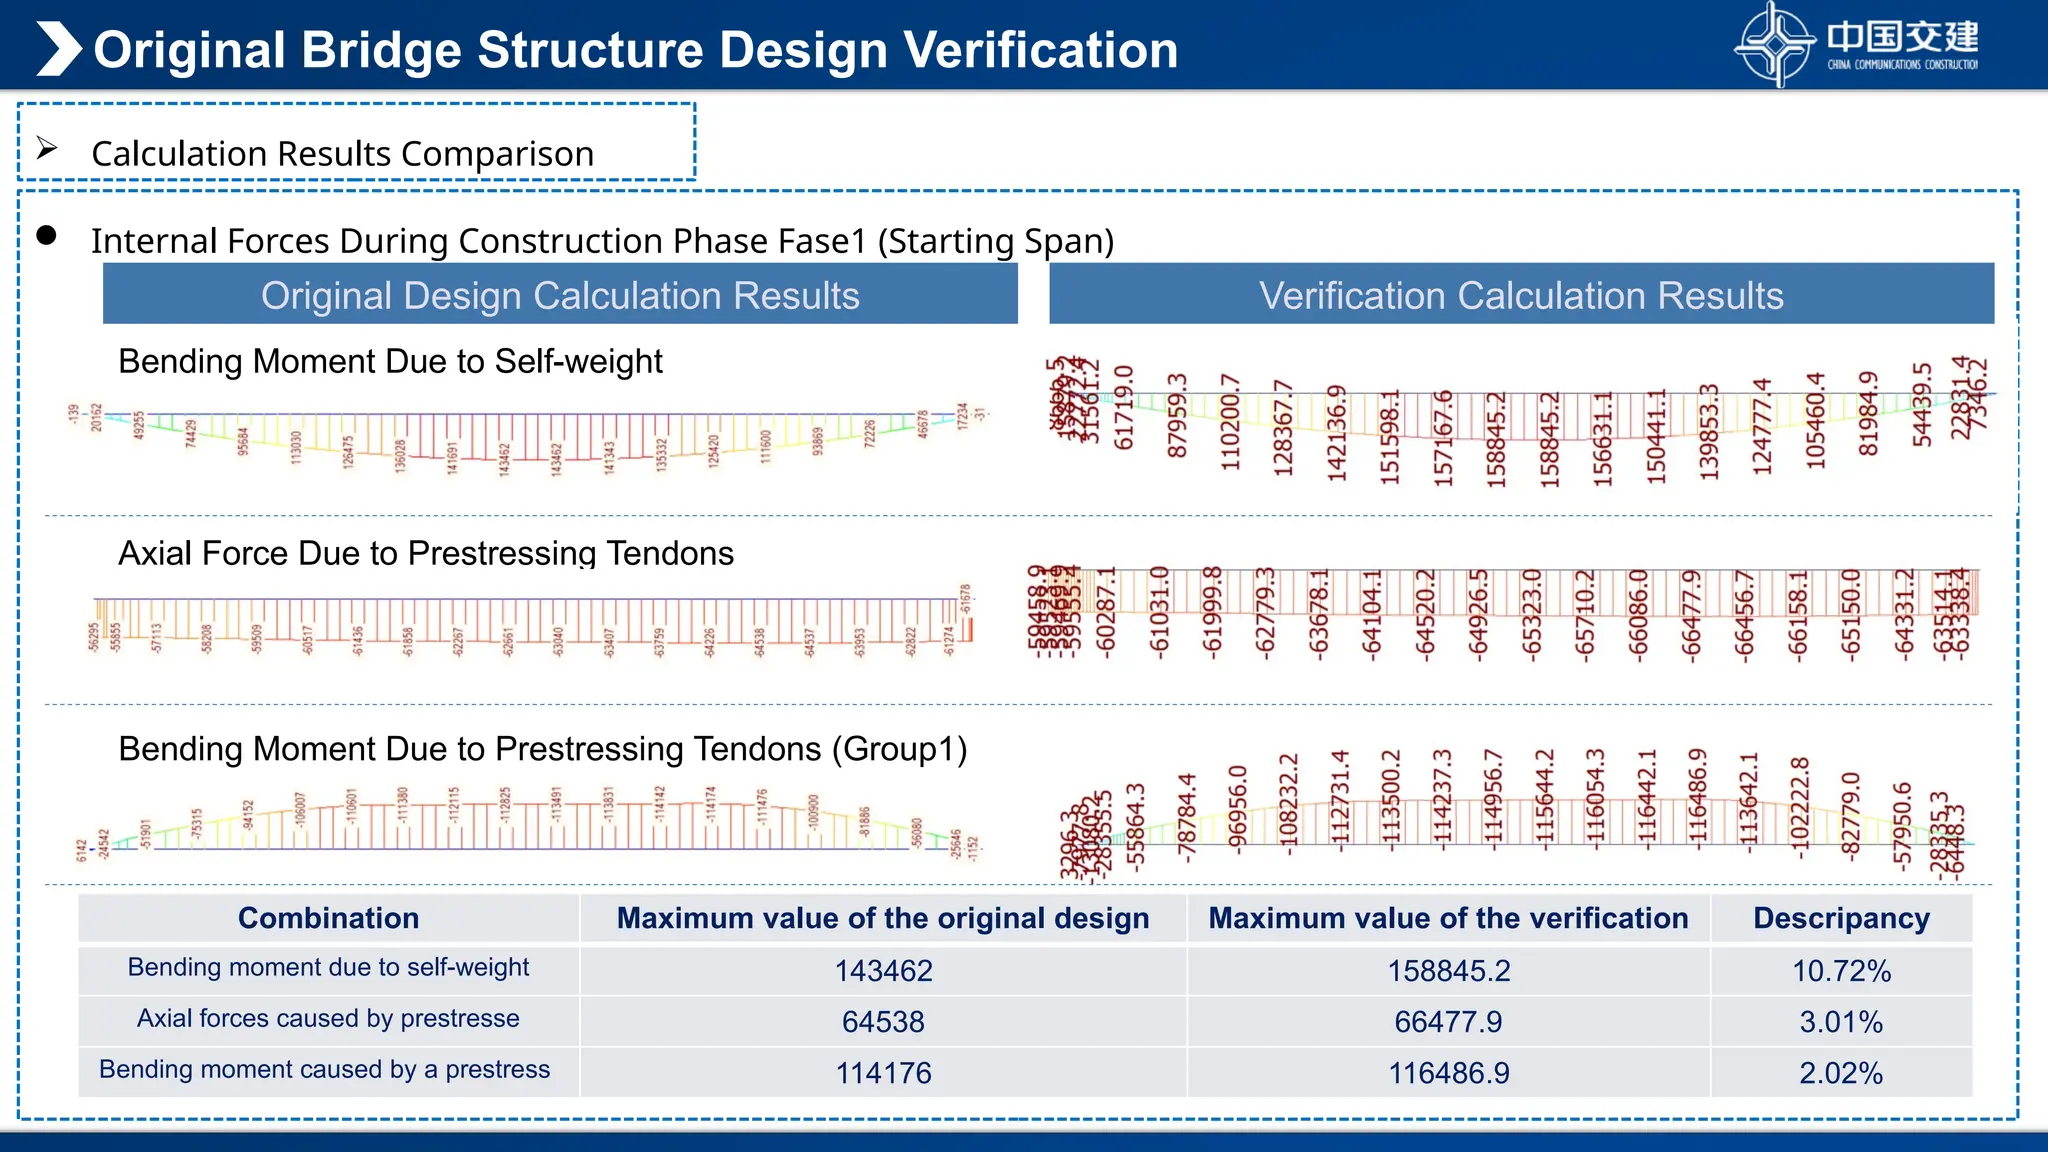
Internal ForcesDuring Construction Phase Fase1 (Starting Span)
Original Bridge Structure Design Verification
Calculation Results Comparison
Original Design Calculation Results
Combination Maximum value of the original design Maximum value of the verification Descripancy
Bending moment due to self-weight 143462 158845.2 10.72%
Axial forces caused by prestresse 64538 66477.9 3.01%
Bending moment caused by a prestress 114176 116486.9 2.02%
Bending Moment Due to Self-weight
Axial Force Due to Prestressing Tendons
(Group1)
Bending Moment Due to Prestressing Tendons (Group1)
Verification Calculation Results
22.
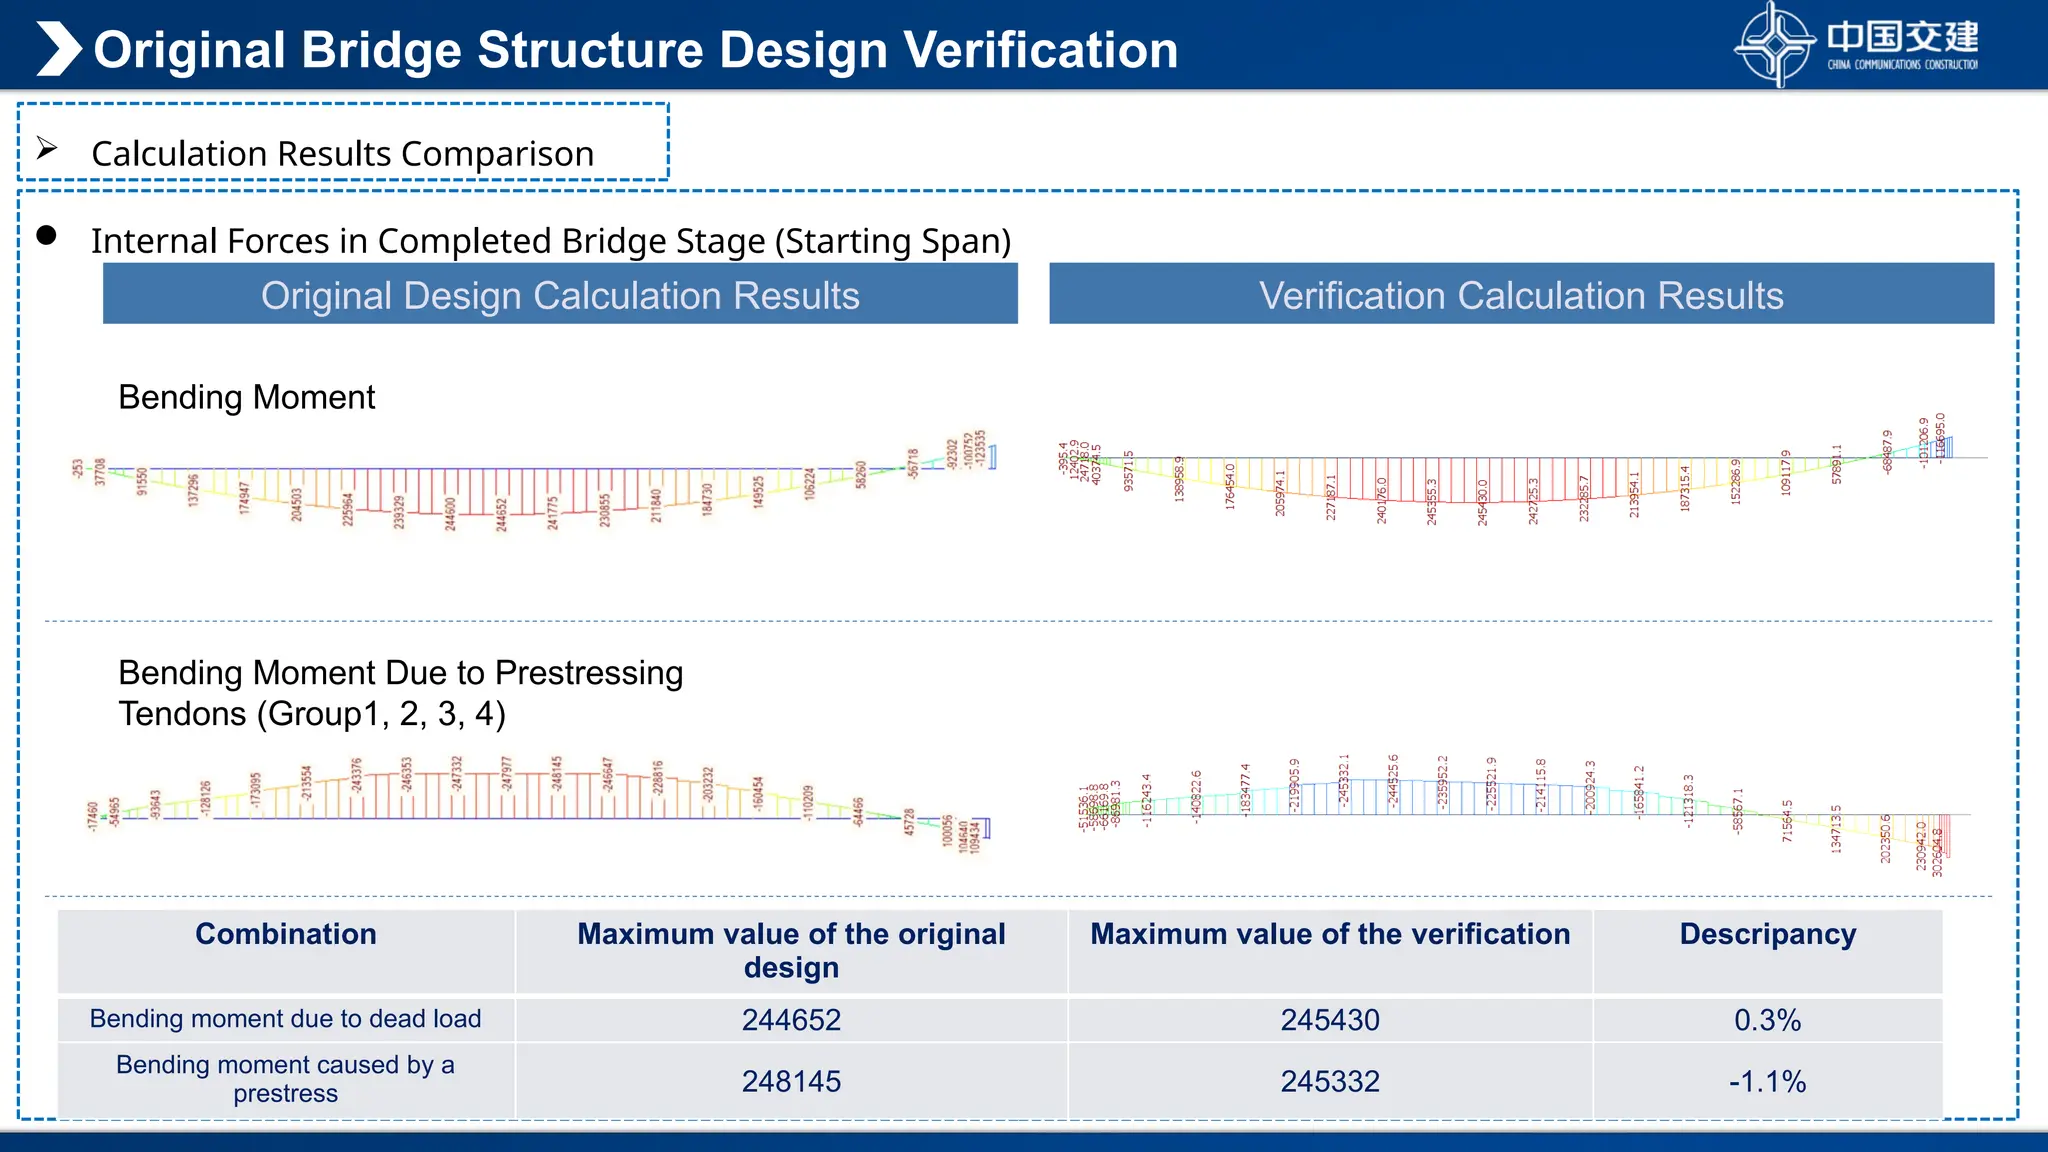
Internal Forcesin Completed Bridge Stage (Starting Span)
Original Bridge Structure Design Verification
Calculation Results Comparison
Original Design Calculation Results
Combination Maximum value of the original
design
Maximum value of the verification Descripancy
Bending moment due to dead load 244652 245430 0.3%
Bending moment caused by a
prestress 248145 245332 -1.1%
Bending Moment
Due to Dead Load
Bending Moment Due to Prestressing
Tendons (Group1, 2, 3, 4)
Verification Calculation Results
23.
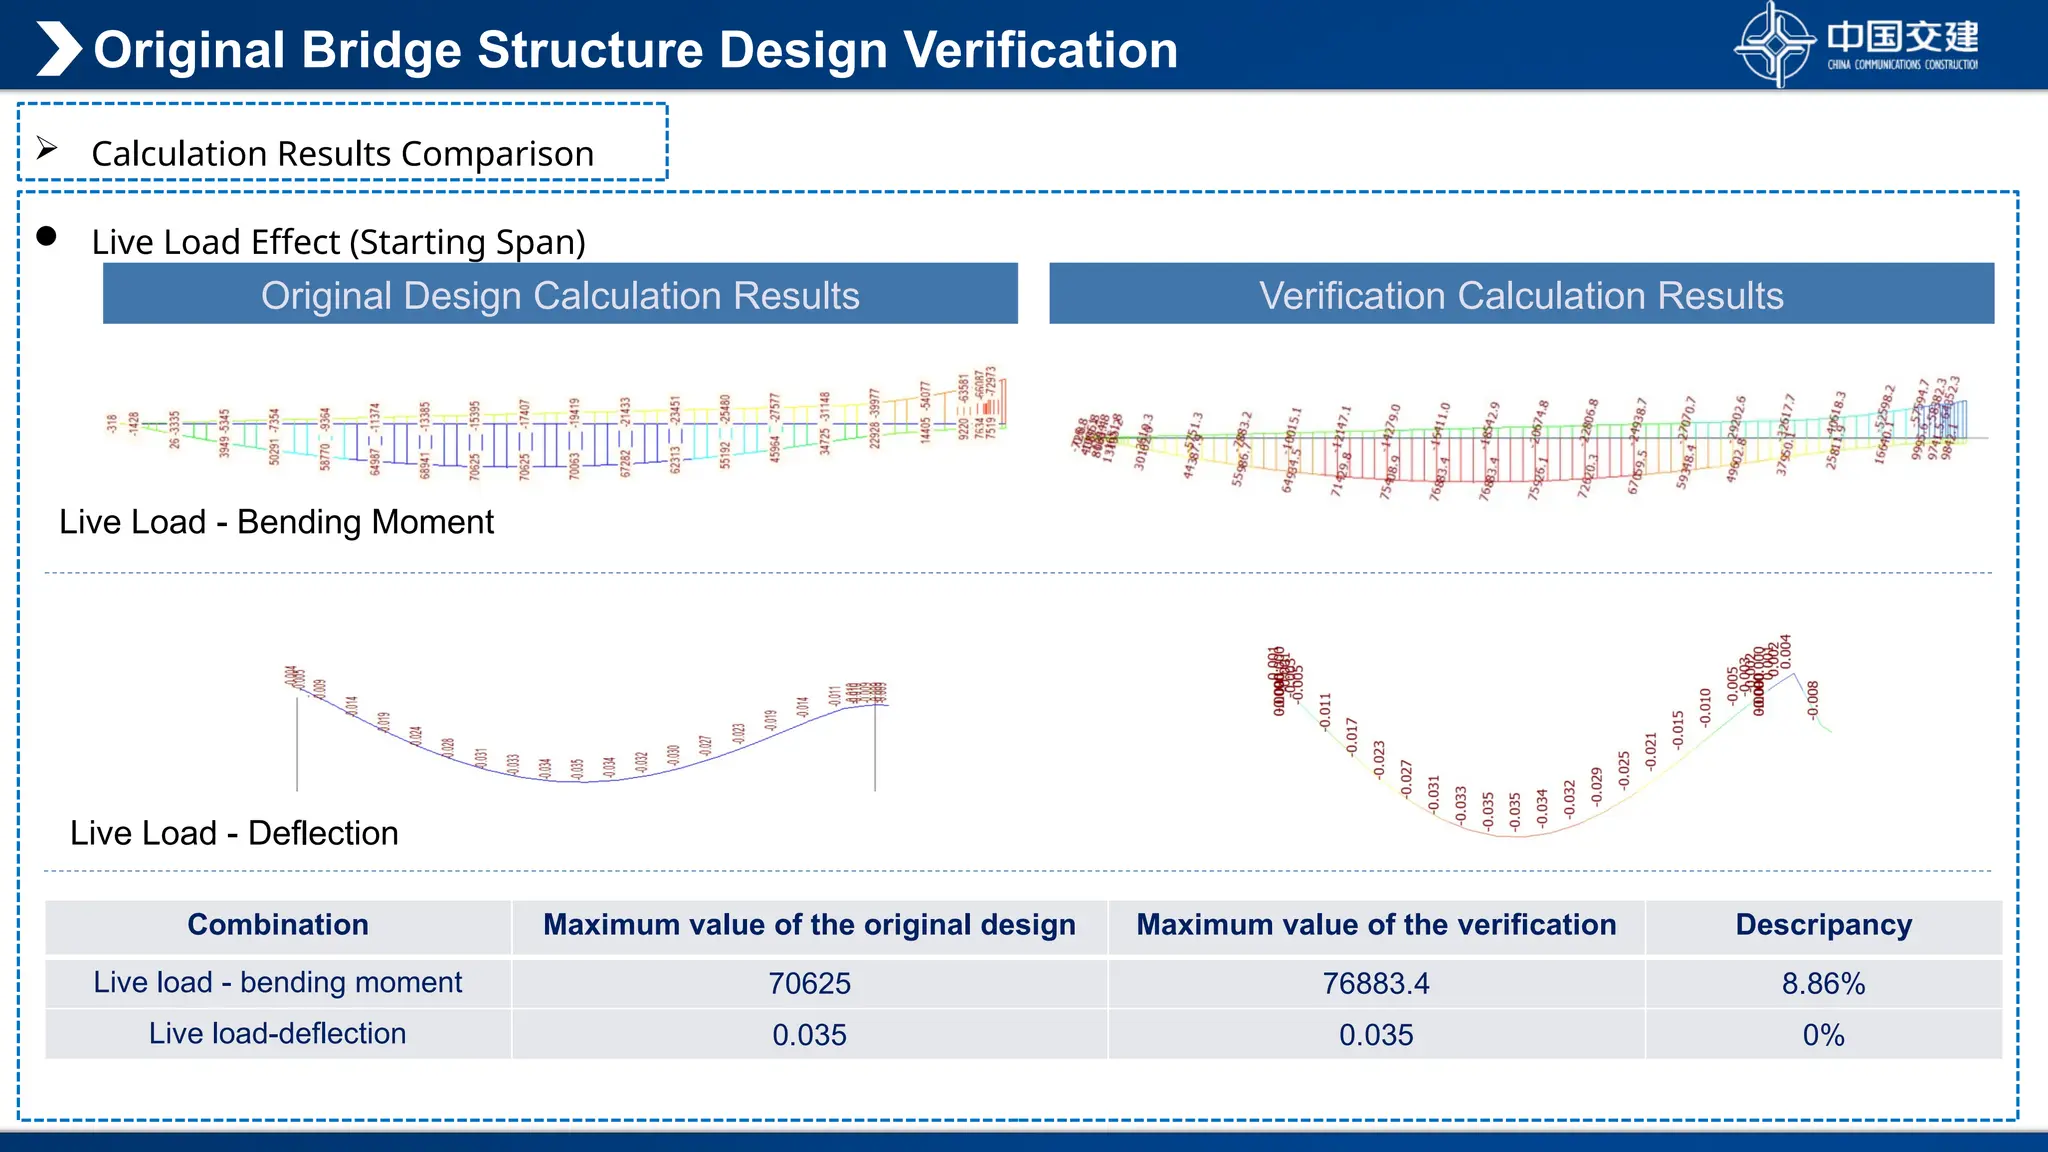
Live LoadEffect (Starting Span)
Original Bridge Structure Design Verification
Calculation Results Comparison
Original Design Calculation Results
Combination Maximum value of the original design Maximum value of the verification Descripancy
Live load - bending moment 70625 76883.4 8.86%
Live load-deflection 0.035 0.035 0%
Live Load - Bending Moment
Verification Calculation Results
Live Load - Deflection
24.
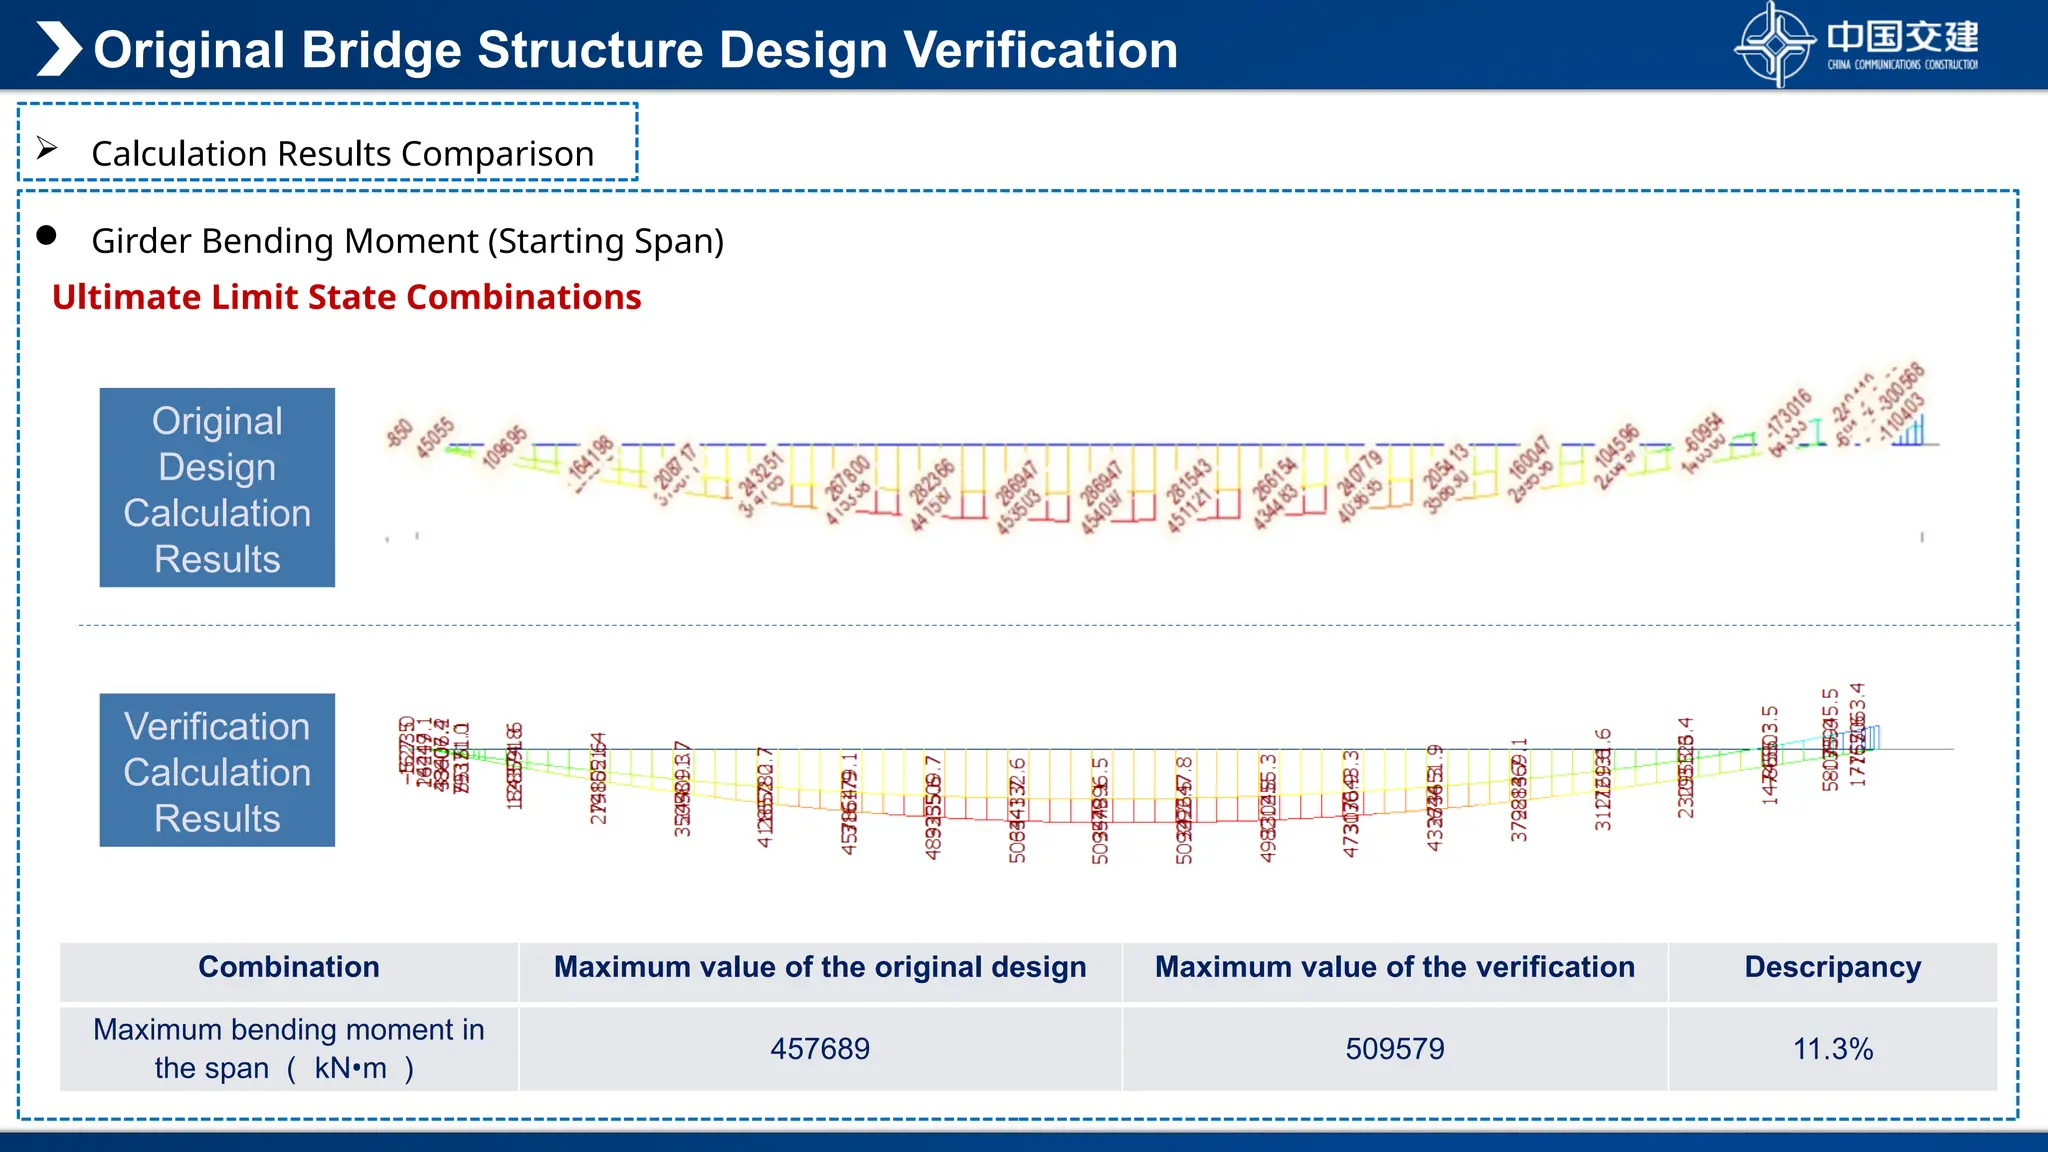
Girder BendingMoment (Starting Span)
Original Bridge Structure Design Verification
Calculation Results Comparison
Original
Design
Calculation
Results
Verification
Calculation
Results
Ultimate Limit State Combinations
Combination Maximum value of the original design Maximum value of the verification Descripancy
Maximum bending moment in
the span ( kN•m )
457689 509579 11.3%
25.
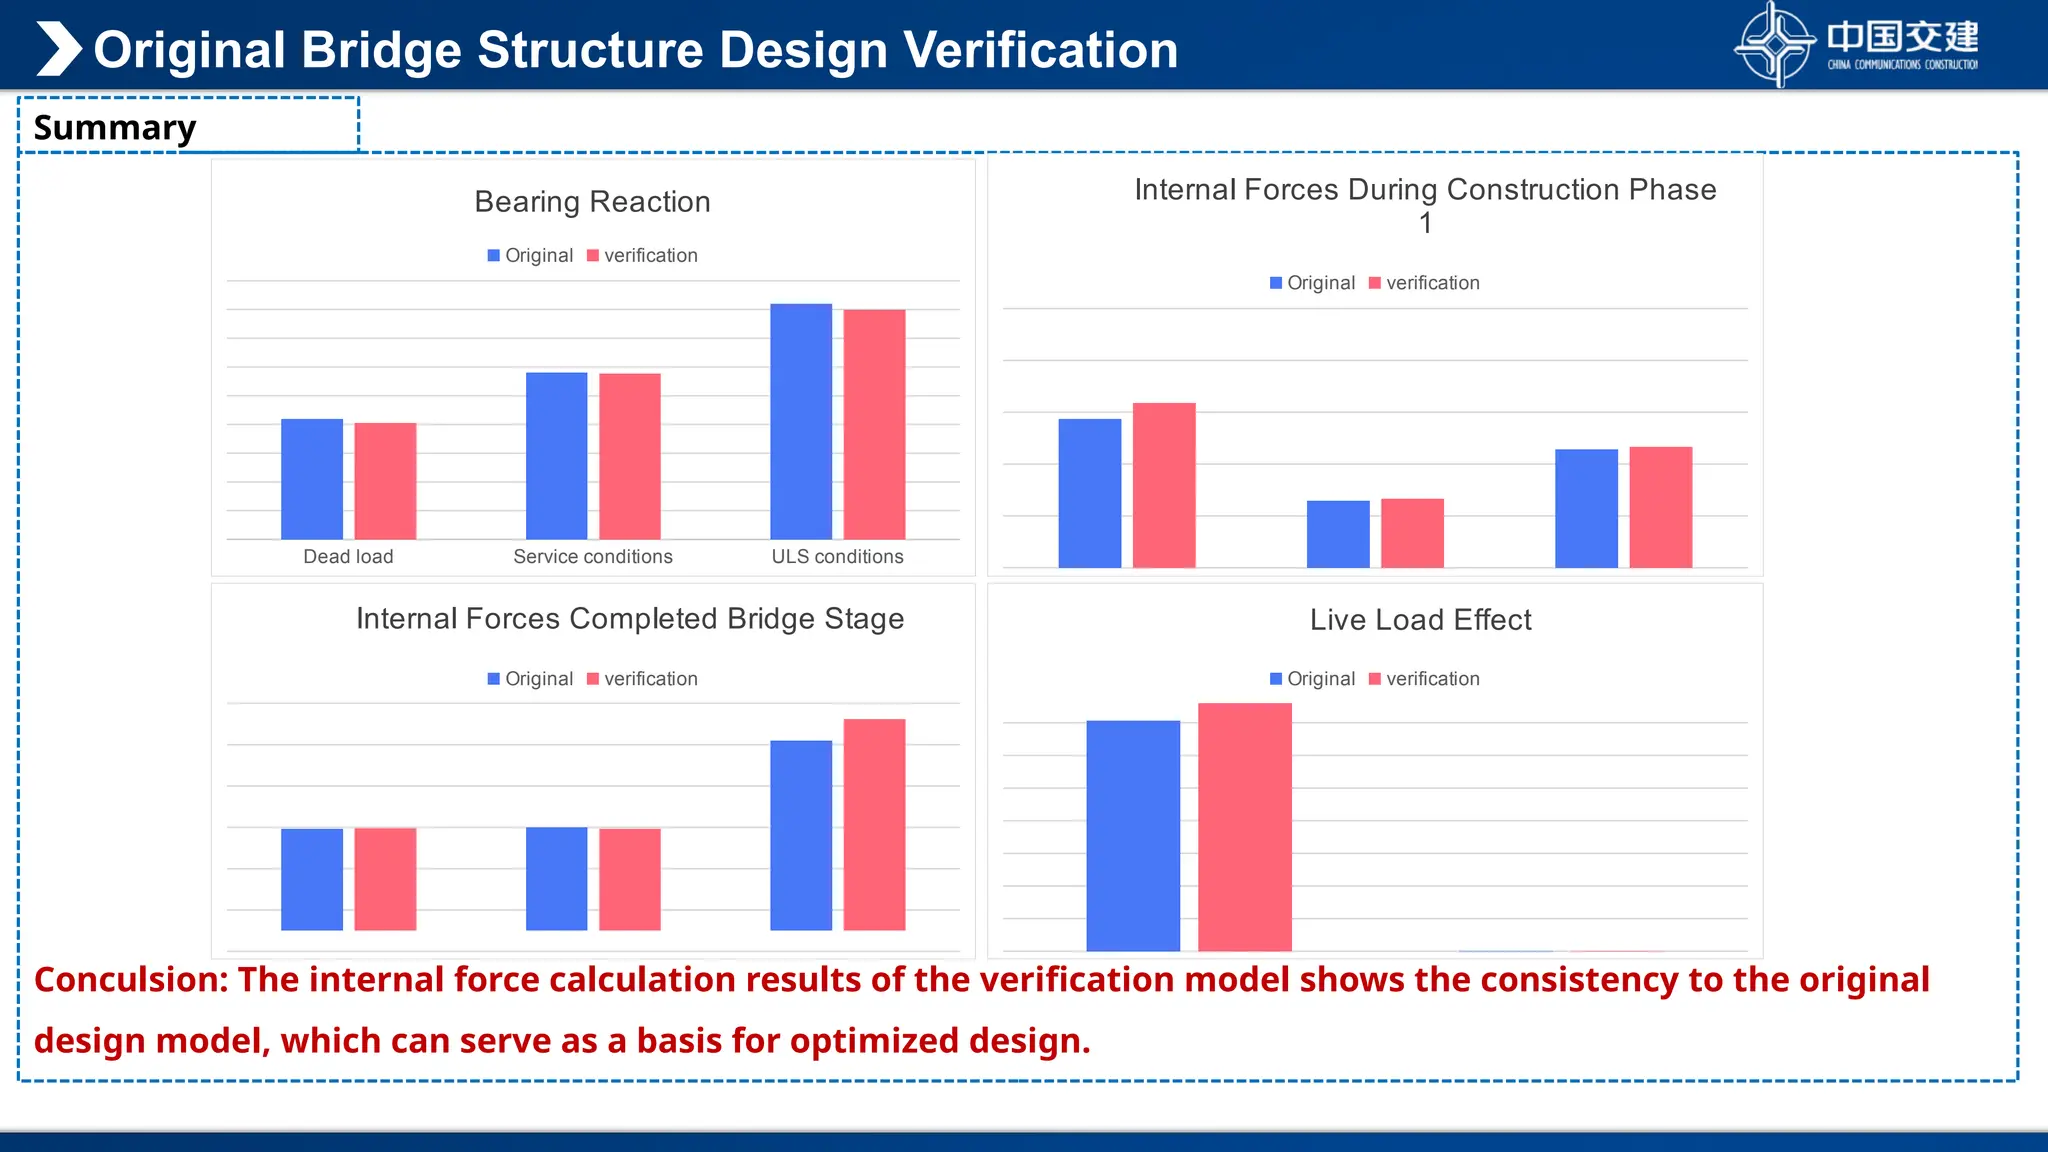
Conculsion: The internalforce calculation results of the verification model shows the consistency to the original
design model, which can serve as a basis for optimized design.
Summary
Original Bridge Structure Design Verification
Dead load Service conditions ULS conditions
Bearing Reaction
Original verification
Internal Forces During Construction Phase
1
Original verification
Internal Forces Completed Bridge Stage
Original verification
Live Load Effect
Original verification
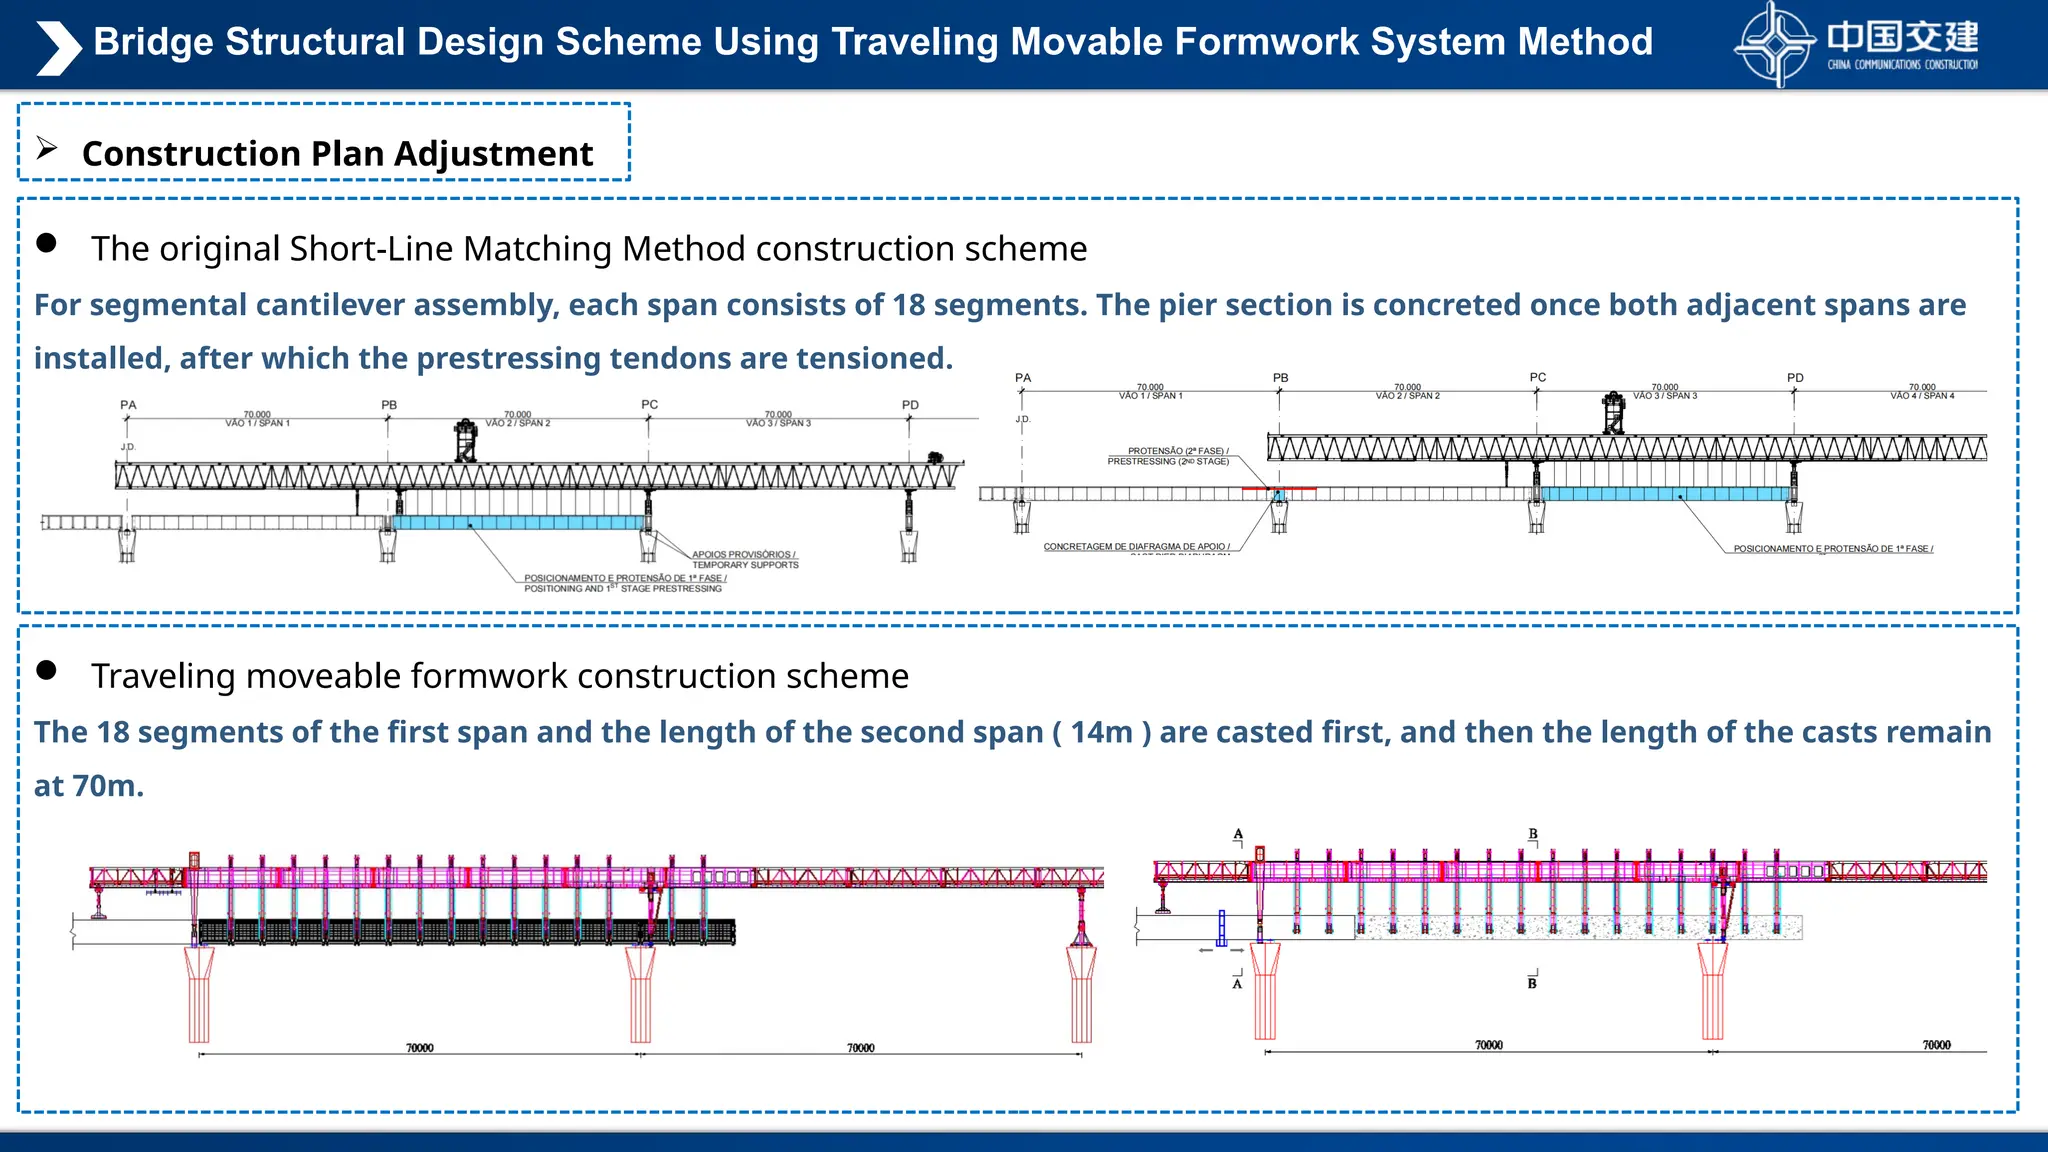
The originalShort-Line Matching Method construction scheme
For segmental cantilever assembly, each span consists of 18 segments. The pier section is concreted once both adjacent spans are
installed, after which the prestressing tendons are tensioned.
Traveling moveable formwork construction scheme
The 18 segments of the first span and the length of the second span ( 14m ) are casted first, and then the length of the casts remain
at 70m.
Construction Plan Adjustment
Bridge Structural Design Scheme Using Traveling Movable Formwork System Method
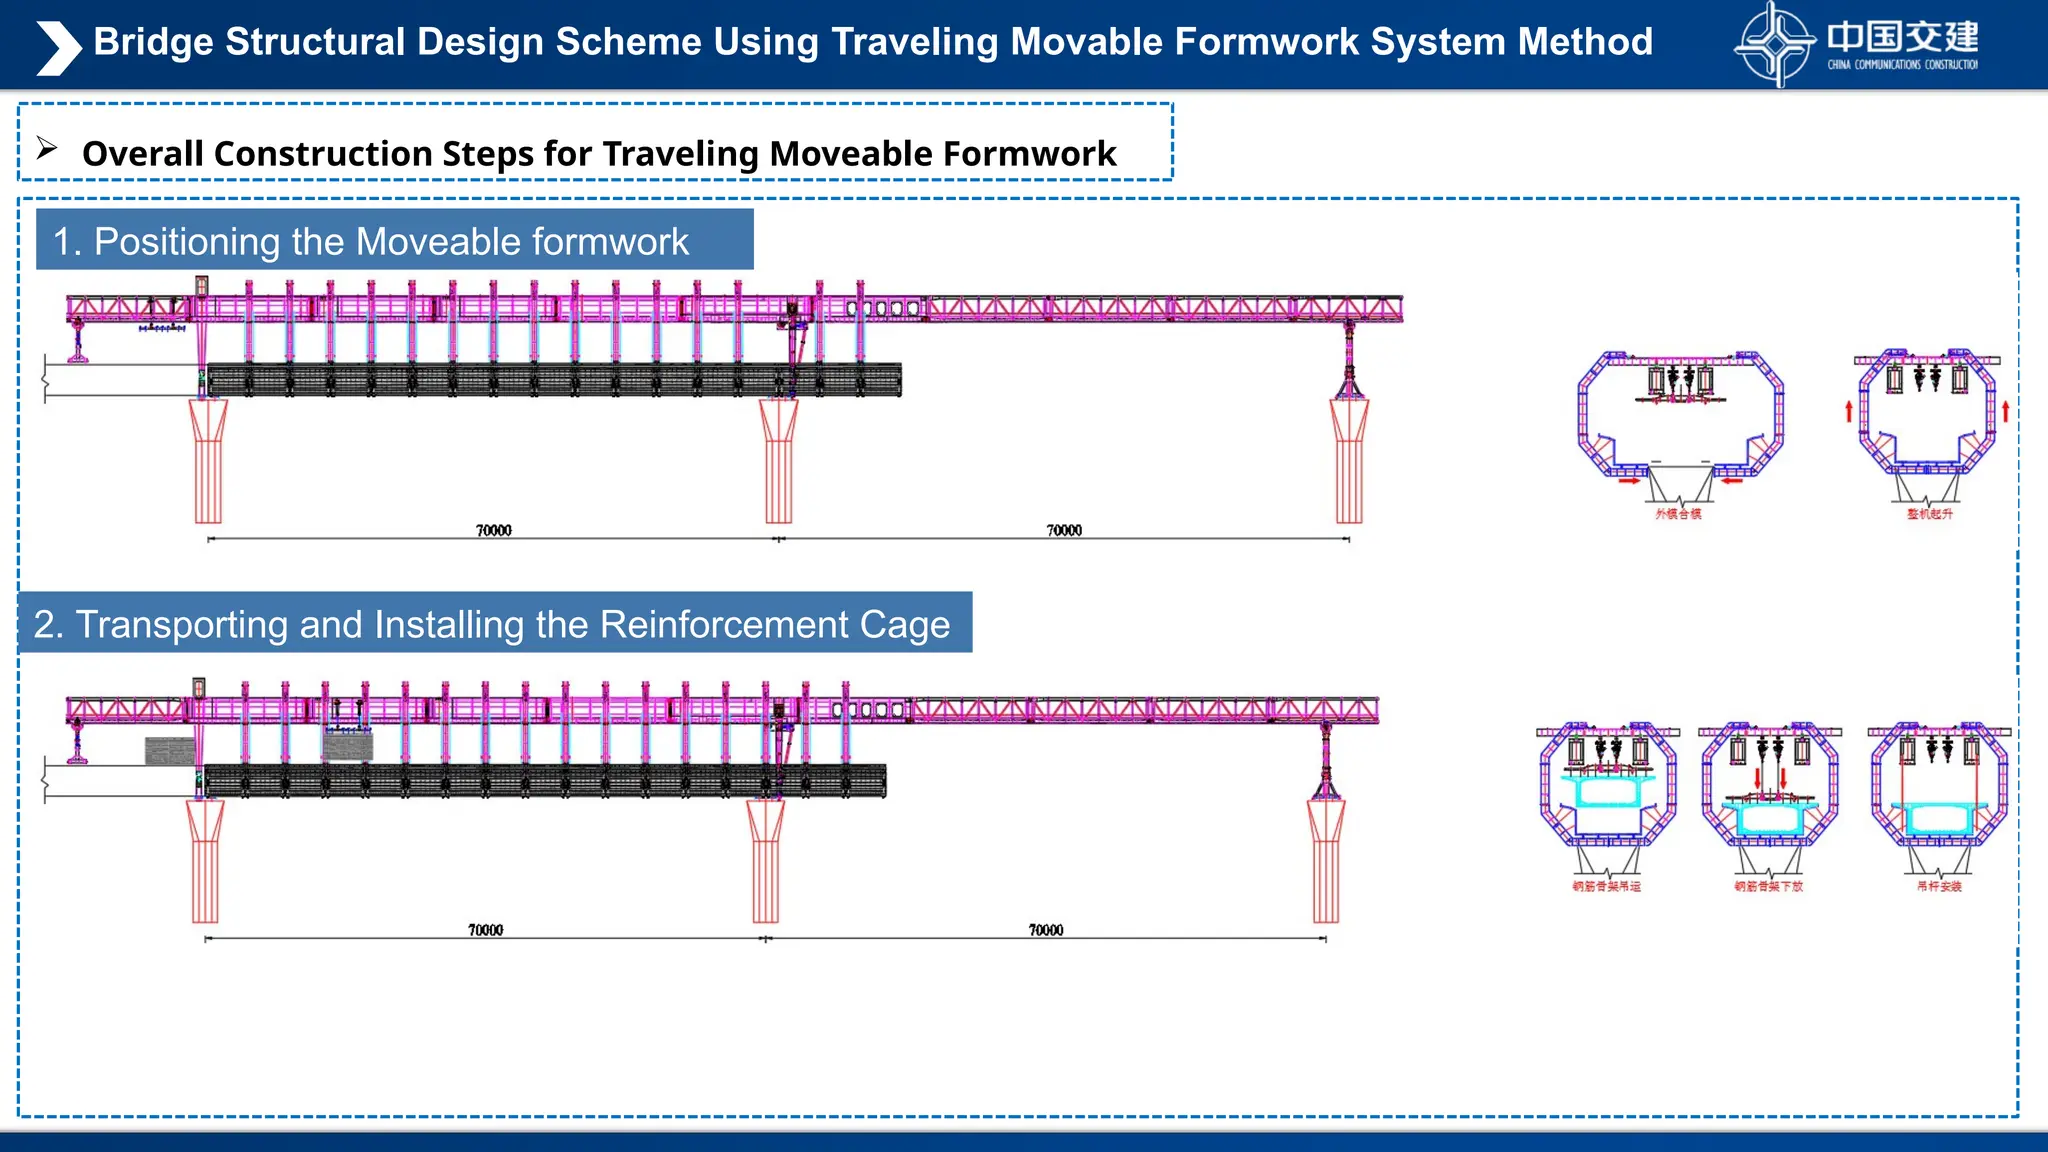
28.
Overall ConstructionSteps for Traveling Moveable Formwork
1. Positioning the Moveable formwork
2. Transporting and Installing the Reinforcement Cage
Bridge Structural Design Scheme Using Traveling Movable Formwork System Method
29.
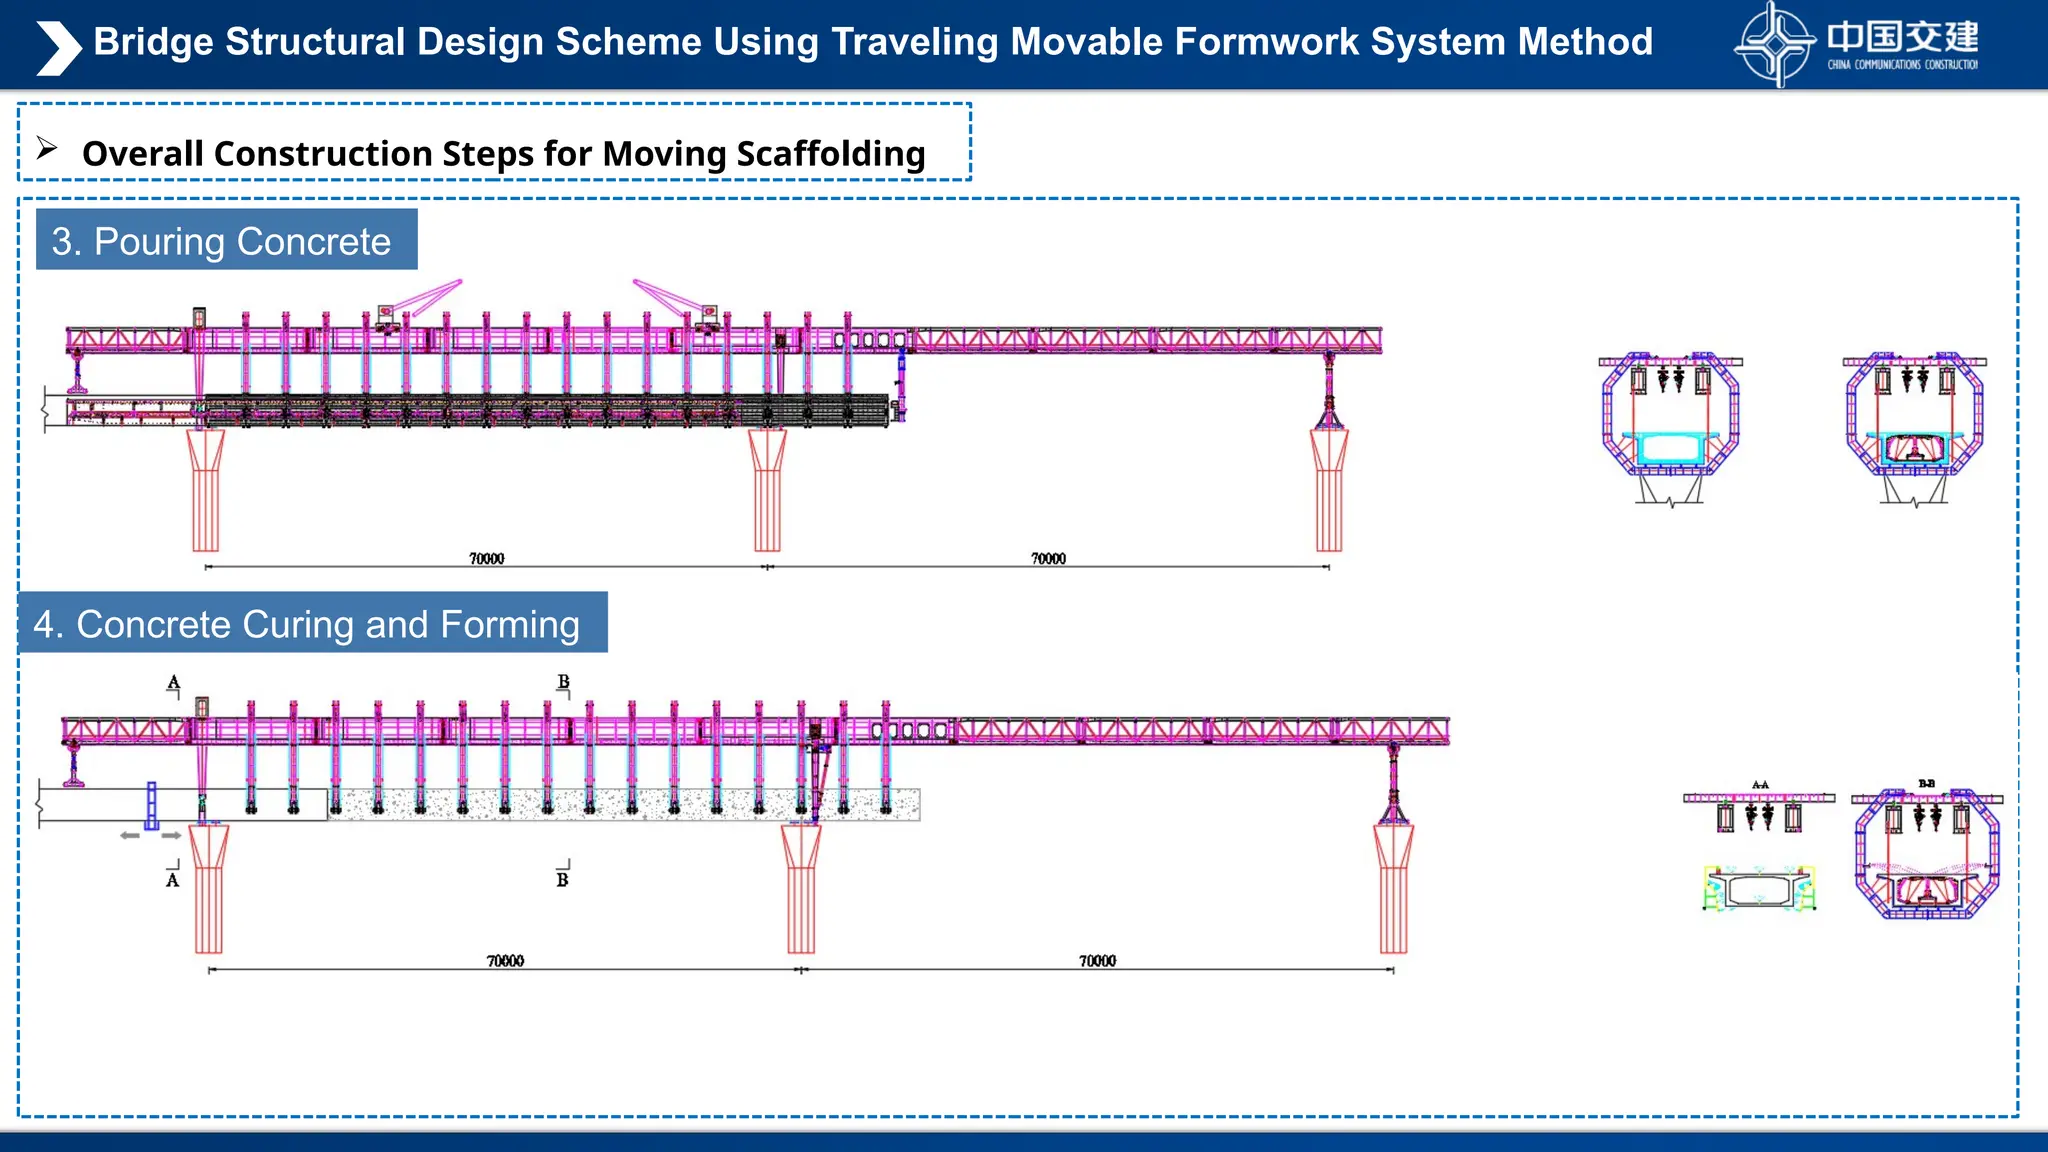
Overall ConstructionSteps for Moving Scaffolding
3. Pouring Concrete
4. Concrete Curing and Forming
Bridge Structural Design Scheme Using Traveling Movable Formwork System Method
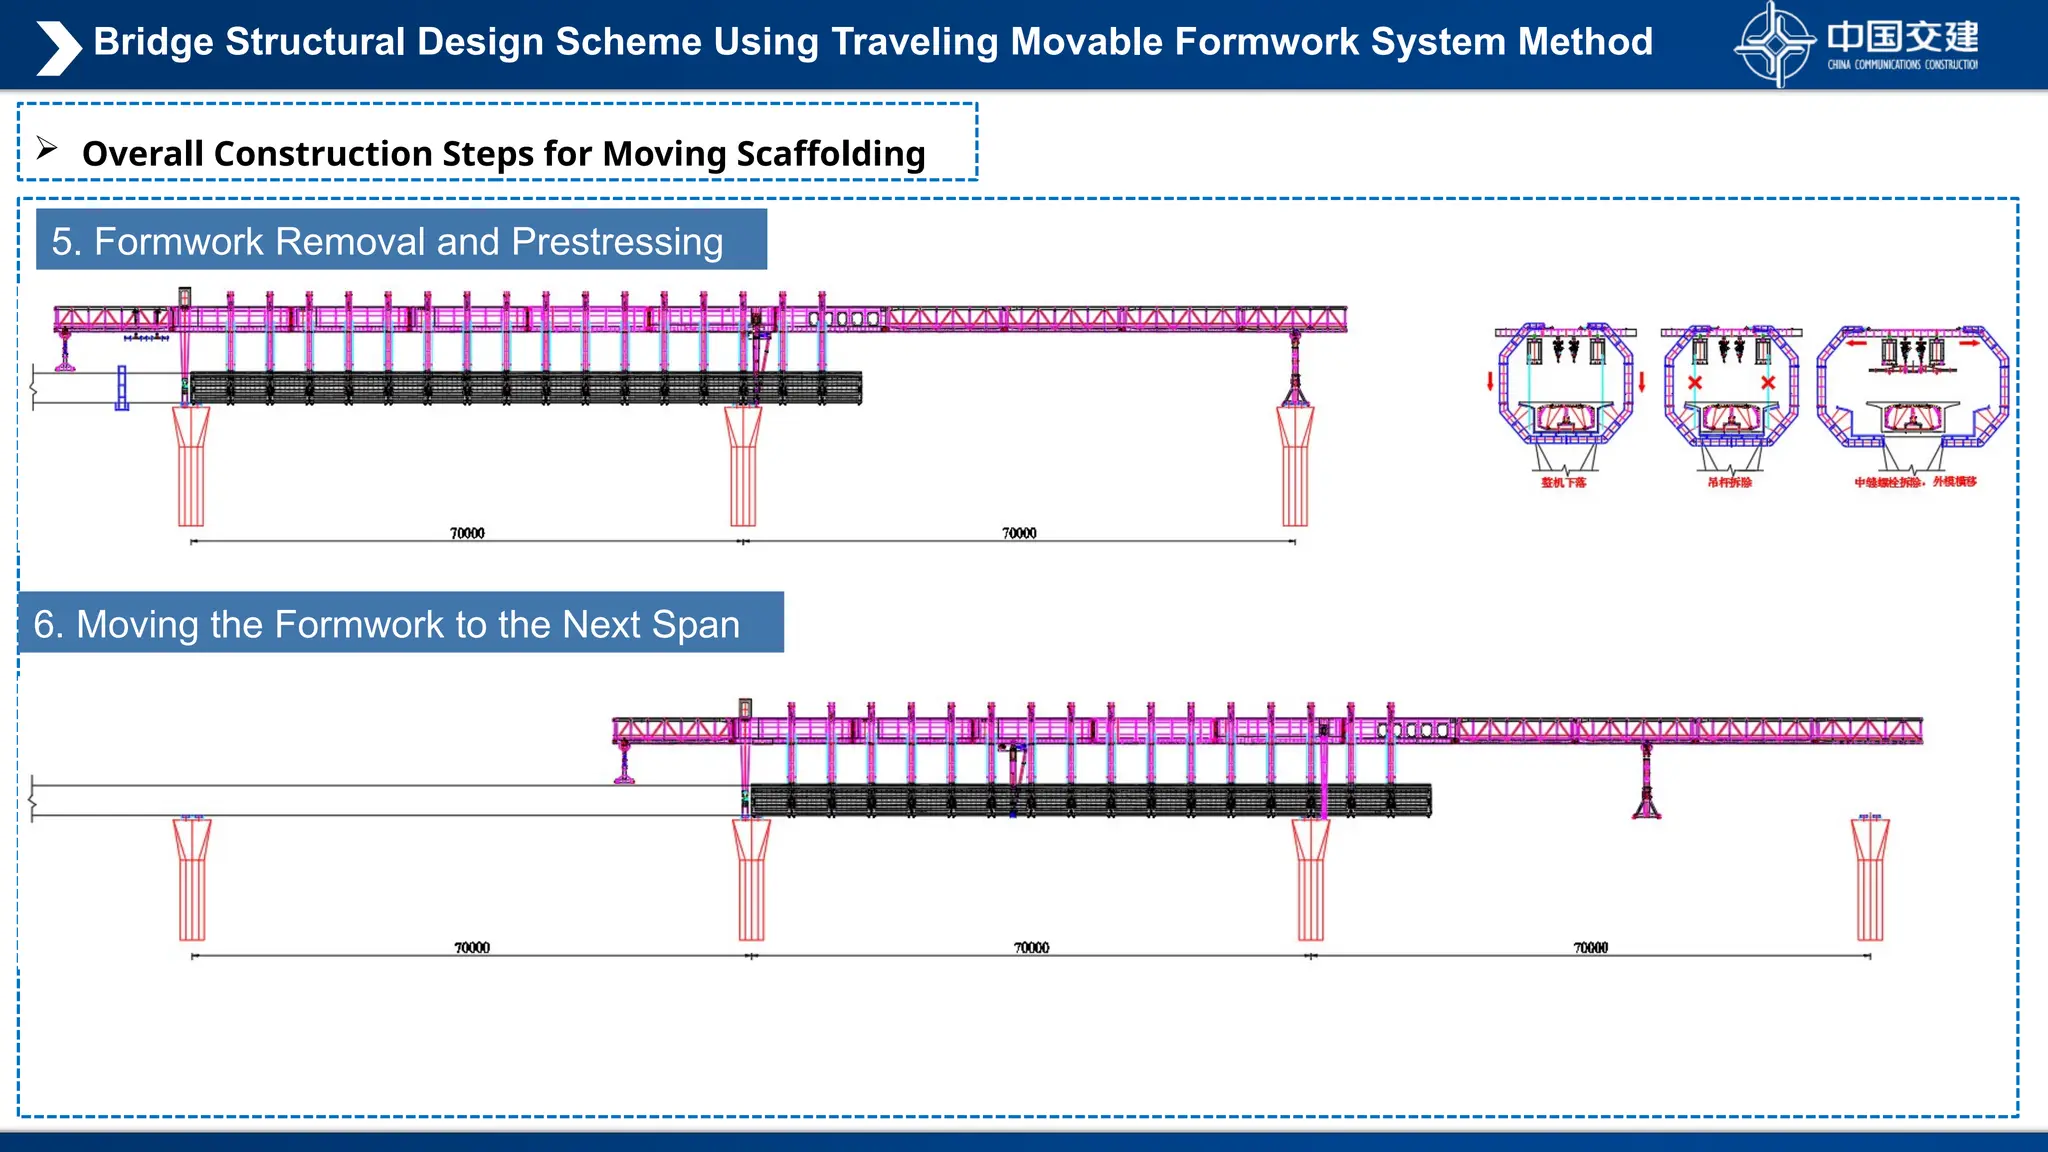
30.
Overall ConstructionSteps for Moving Scaffolding
5. Formwork Removal and Prestressing
6. Moving the Formwork to the Next Span
Bridge Structural Design Scheme Using Traveling Movable Formwork System Method
31.
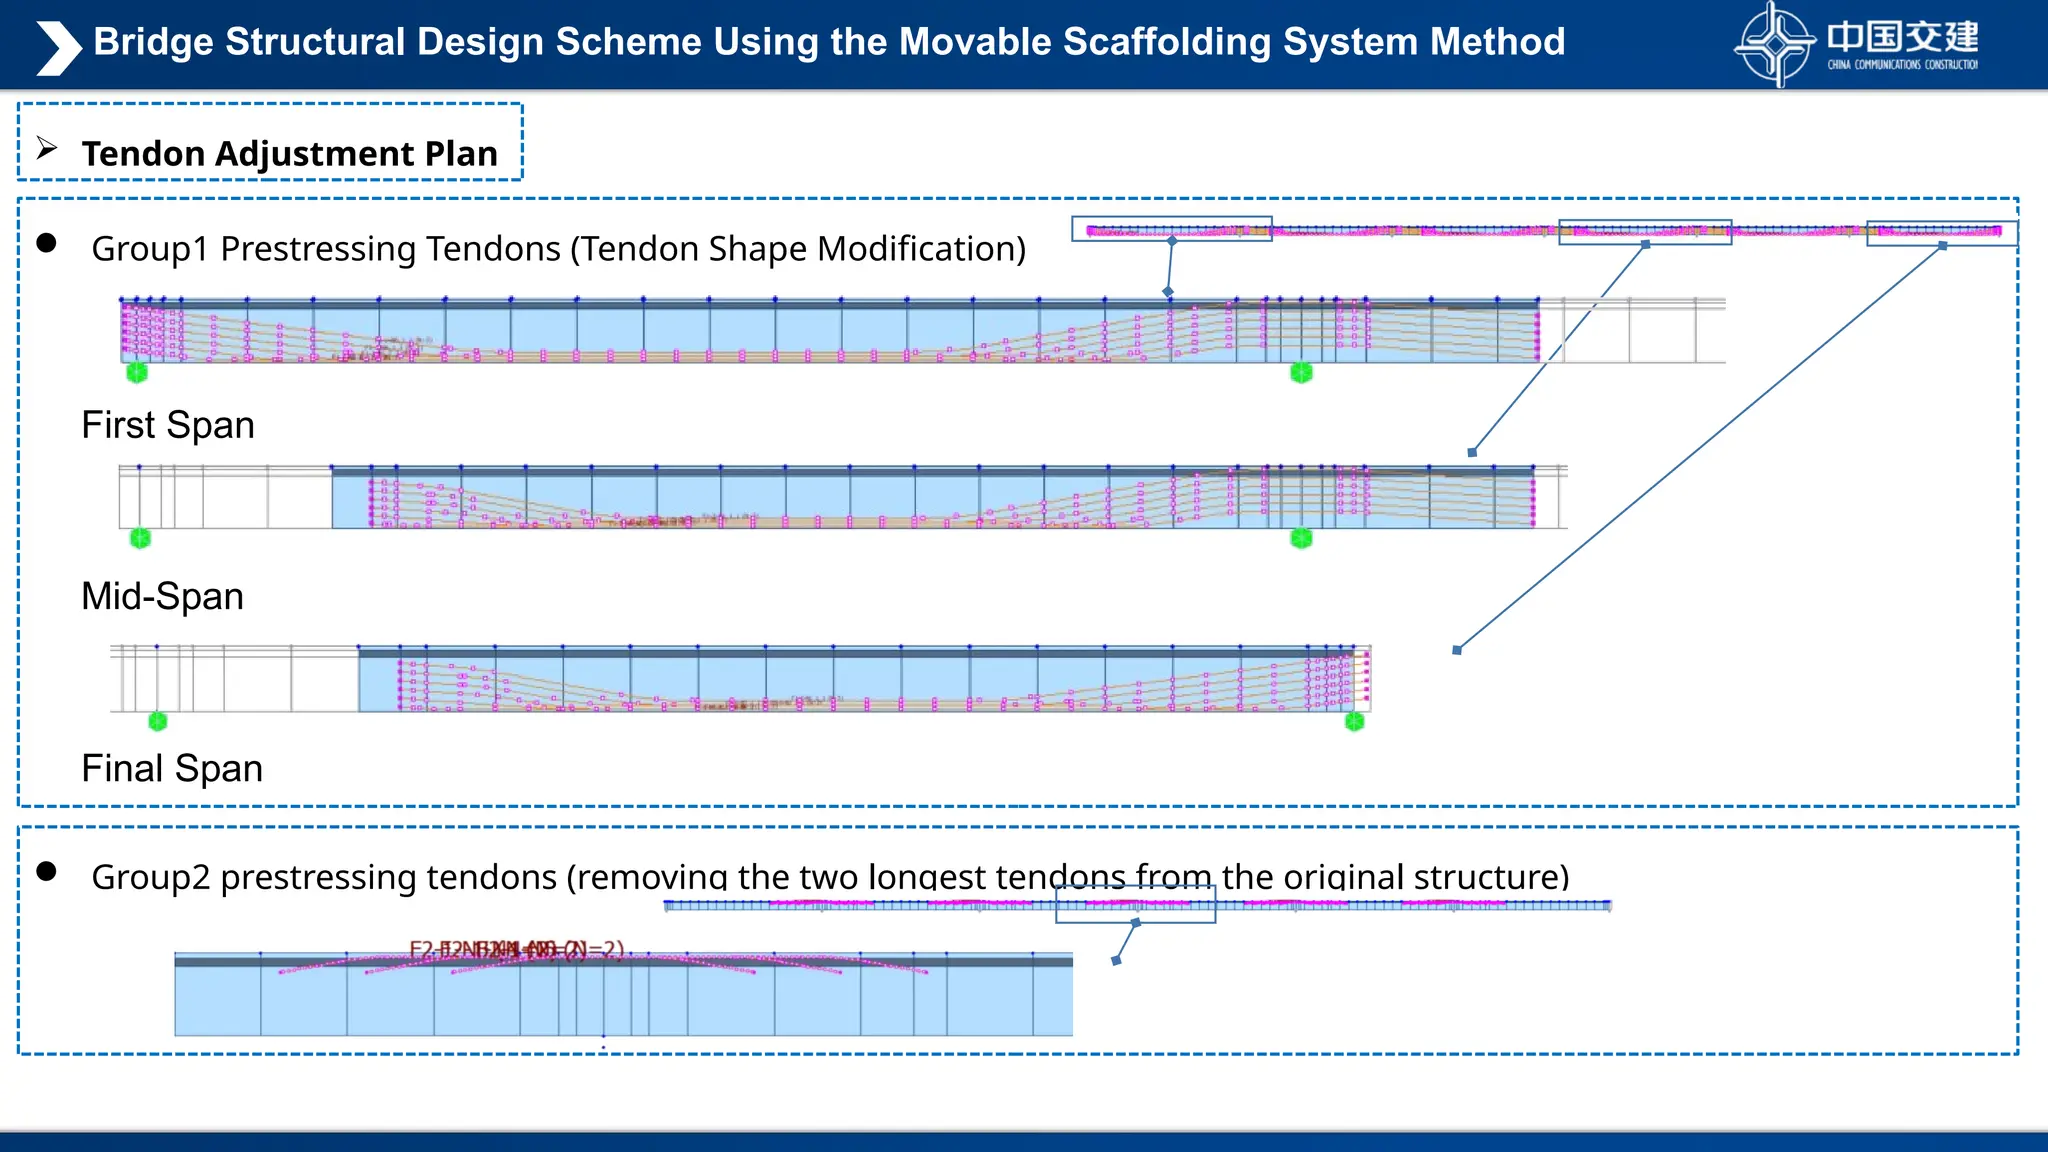
Group1 PrestressingTendons (Tendon Shape Modification)
Tendon Adjustment Plan
Mid-Span
Final Span
First Span
Group2 prestressing tendons (removing the two longest tendons from the original structure)
Bridge Structural Design Scheme Using the Movable Scaffolding System Method
32.
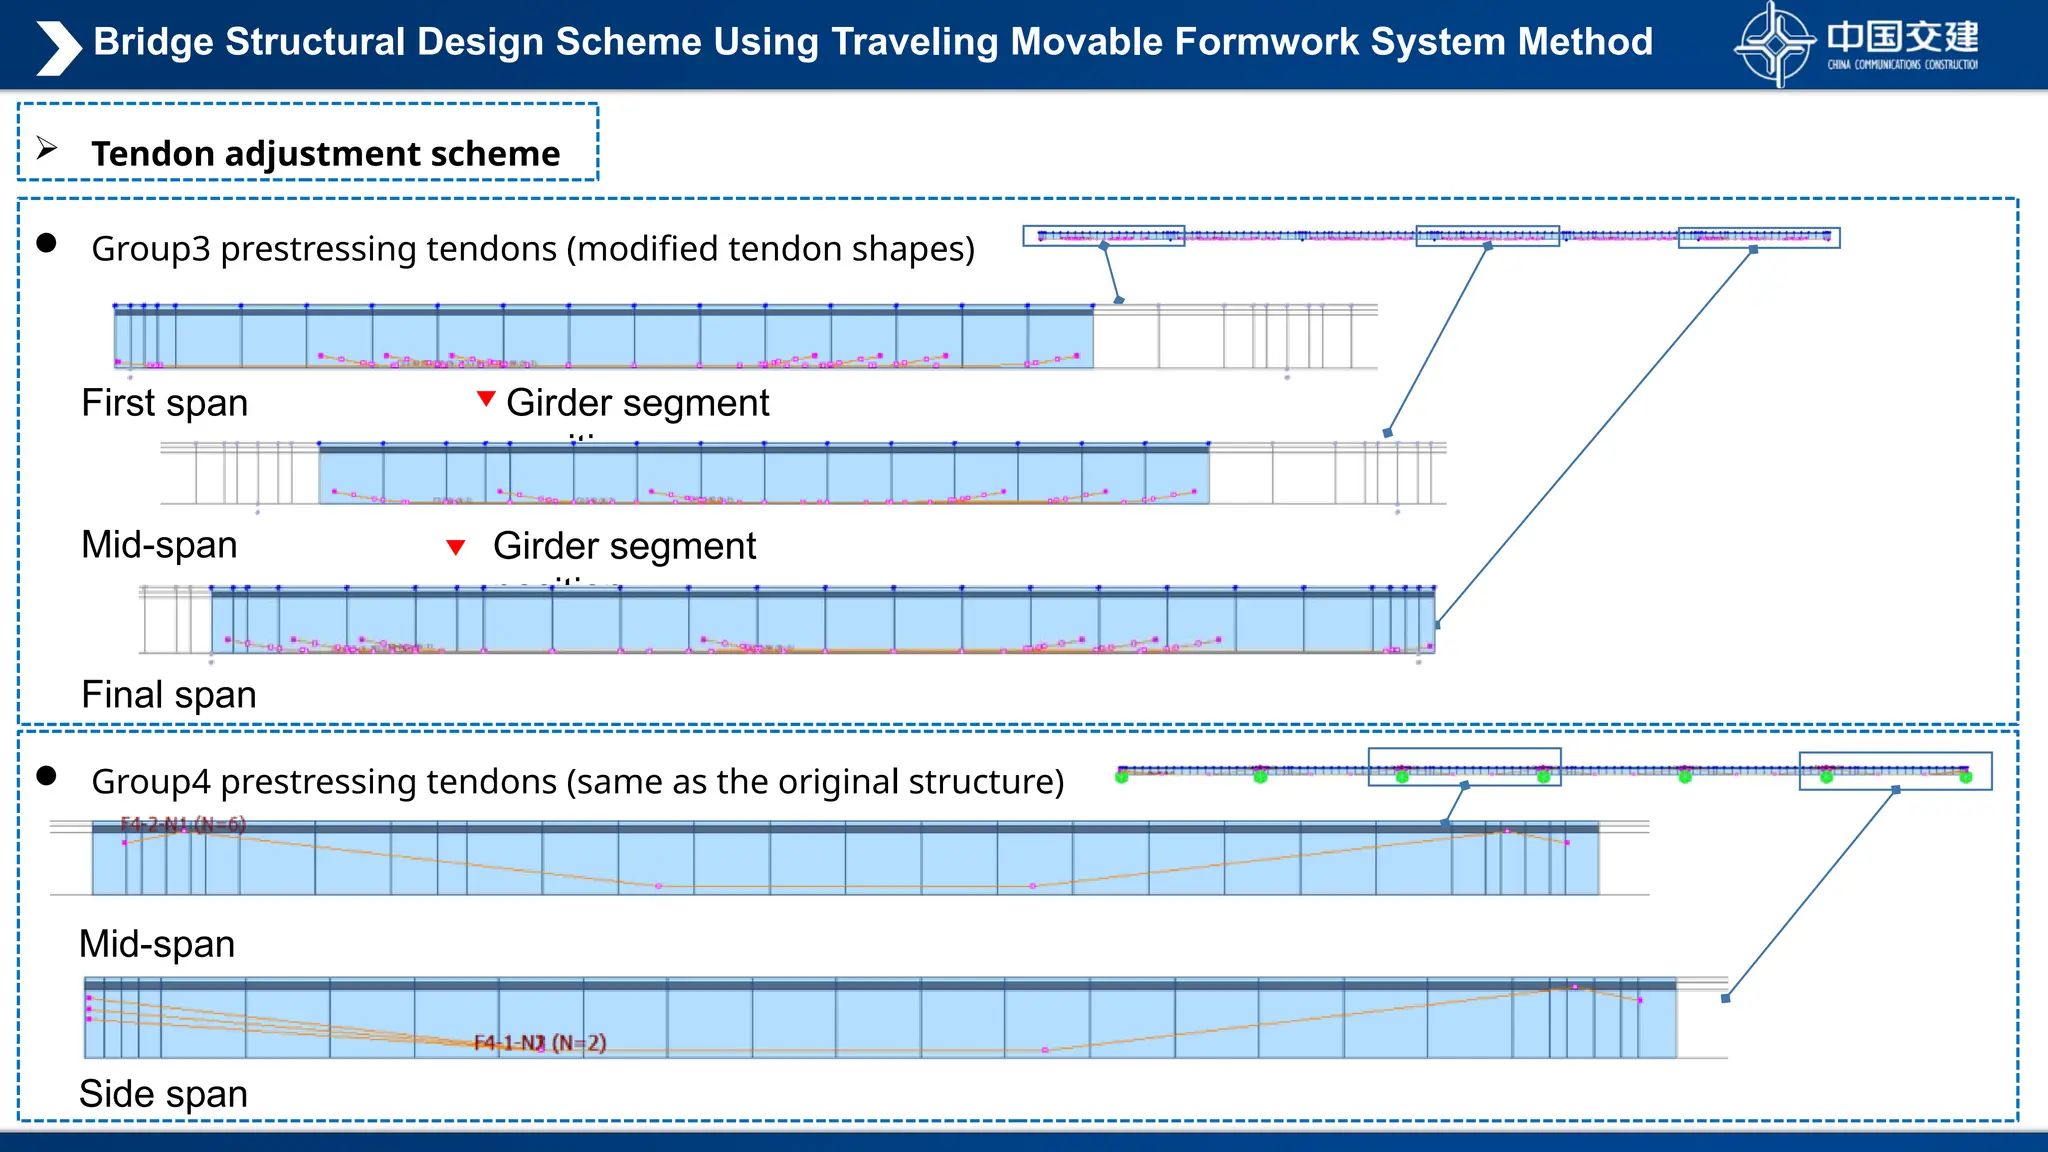
Group3 prestressingtendons (modified tendon shapes)
Group4 prestressing tendons (same as the original structure)
Tendon adjustment scheme
Mid-span
Final span
First span
Mid-span
Side span
Girder segment
position
Girder segment
position
Bridge Structural Design Scheme Using Traveling Movable Formwork System Method
33.
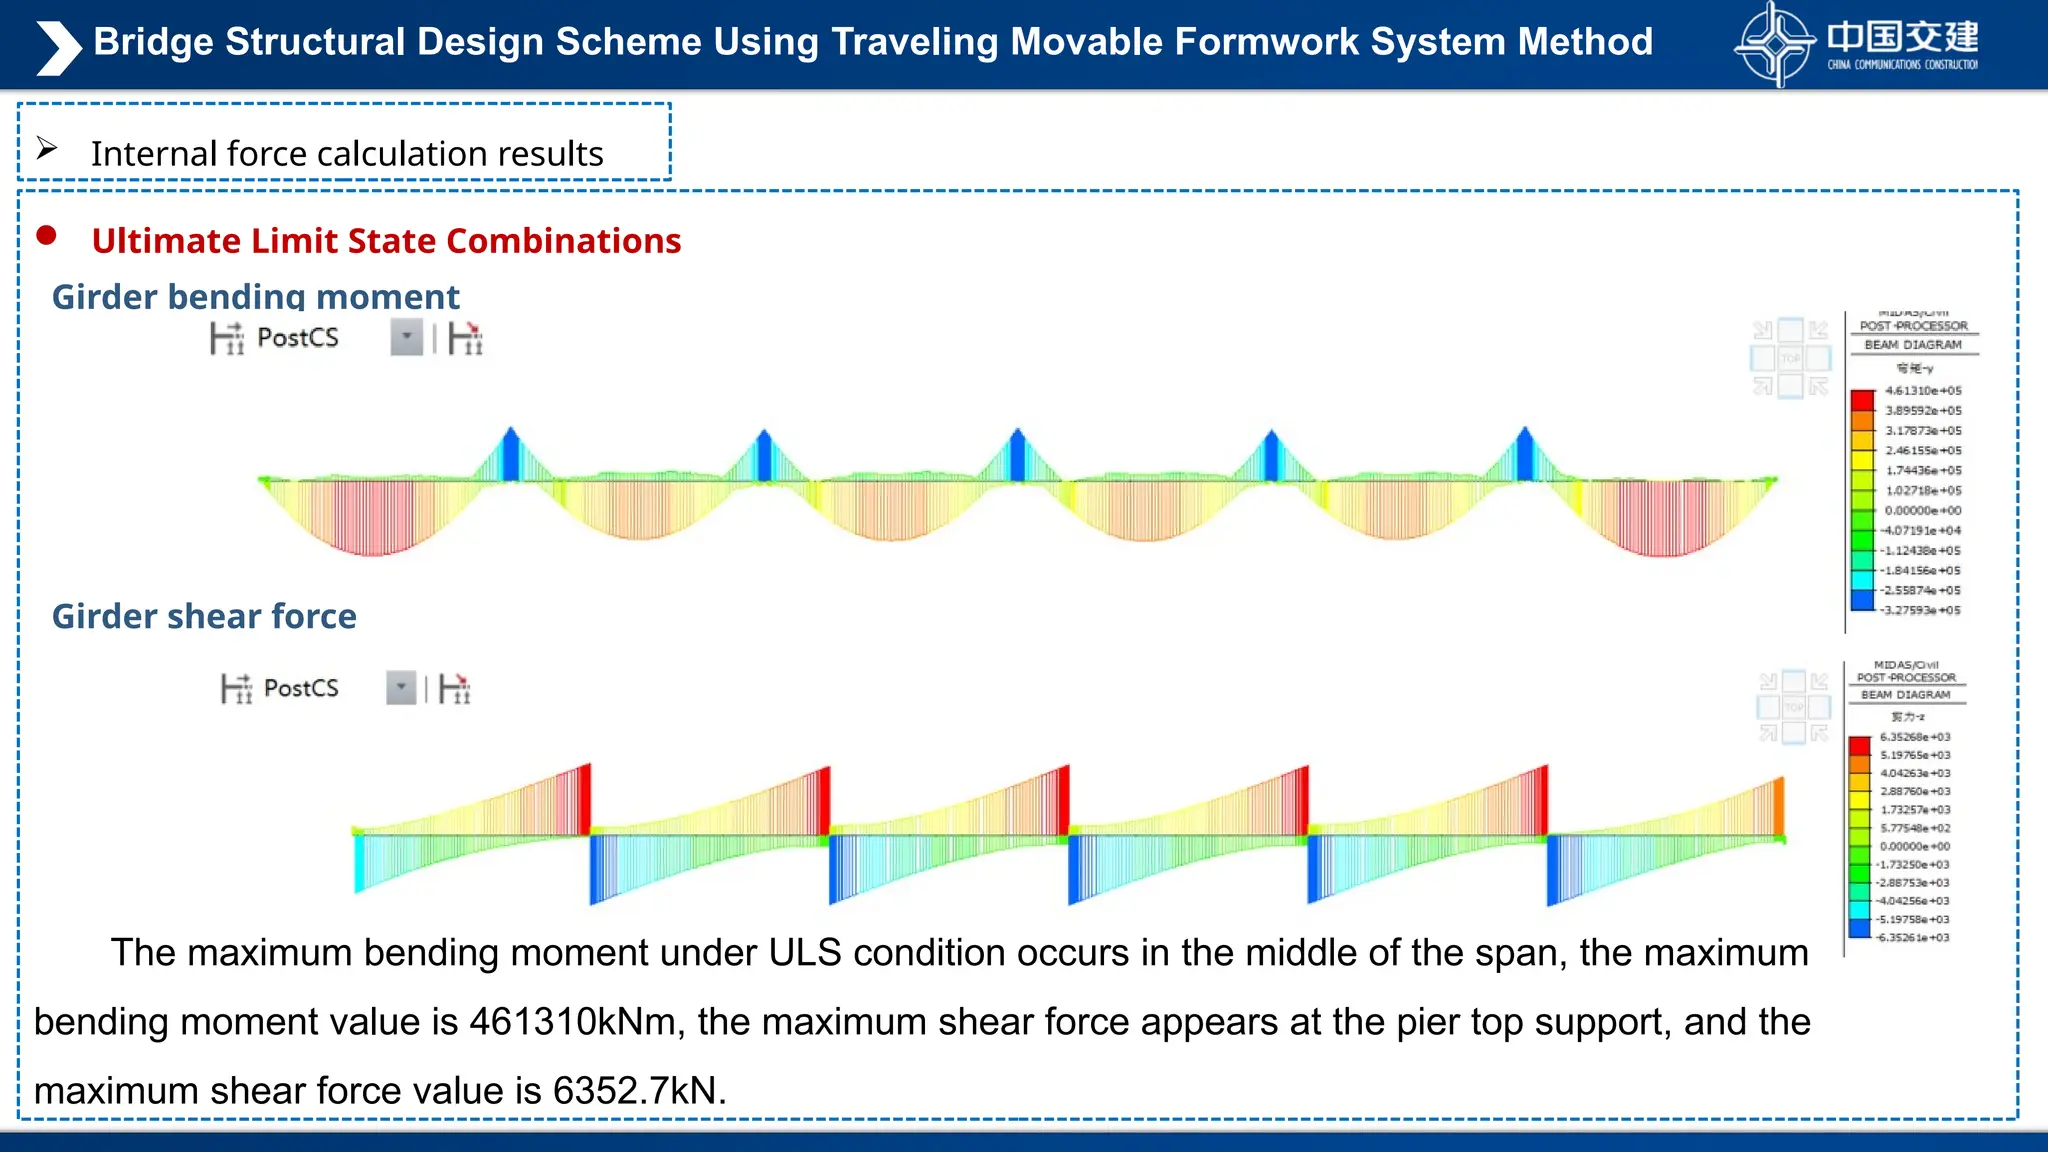
Ultimate LimitState Combinations
Internal force calculation results
Girder bending moment
Girder shear force
The maximum bending moment under ULS condition occurs in the middle of the span, the maximum
bending moment value is 461310kNm, the maximum shear force appears at the pier top support, and the
maximum shear force value is 6352.7kN.
Bridge Structural Design Scheme Using Traveling Movable Formwork System Method
34.
Internal forcecalculation results
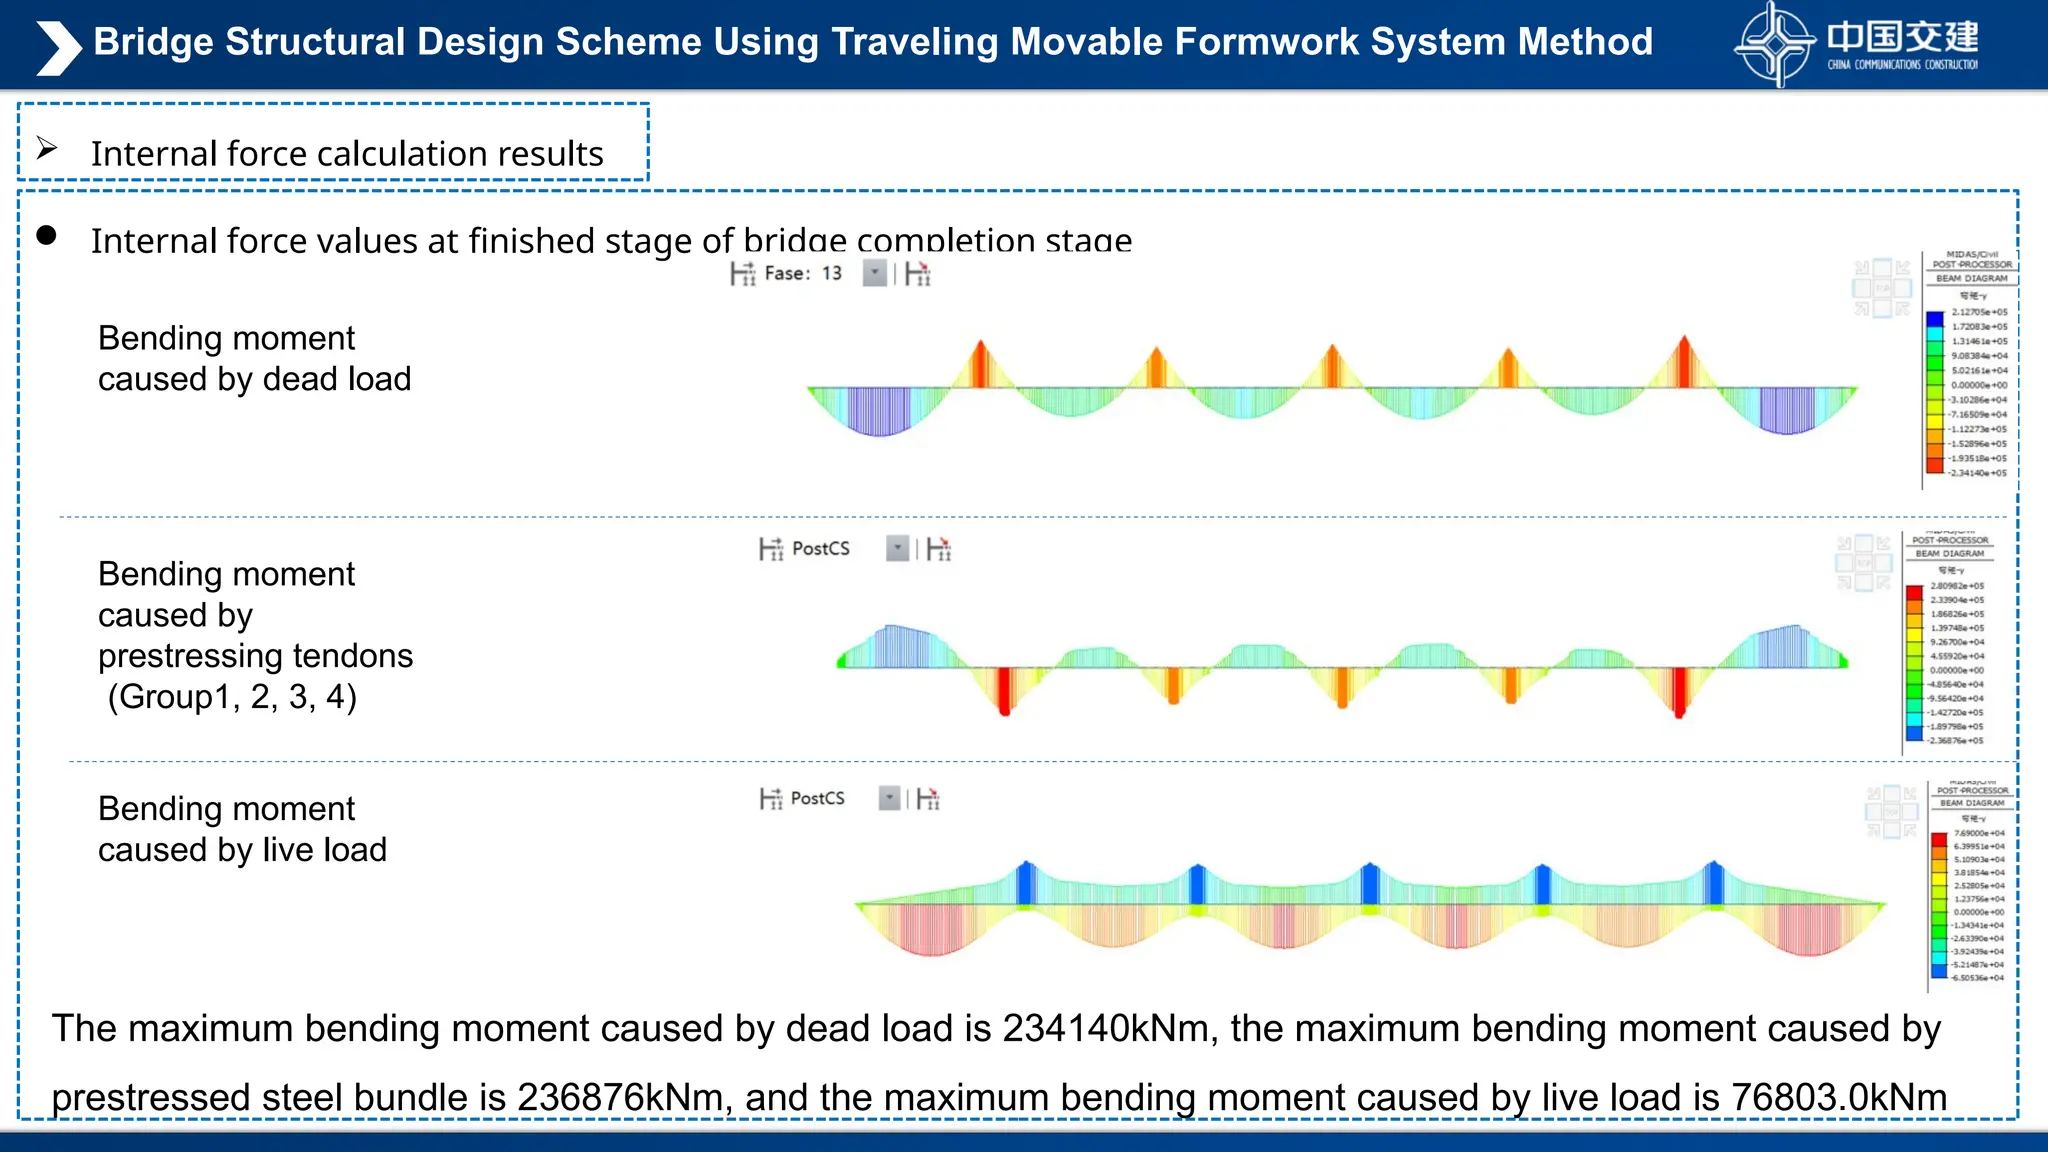
Internal force values at finished stage of bridge completion stage
Bending moment
caused by live load
Bending moment
caused by dead load
Bending moment
caused by
prestressing tendons
(Group1, 2, 3, 4)
The maximum bending moment caused by dead load is 234140kNm, the maximum bending moment caused by
prestressed steel bundle is 236876kNm, and the maximum bending moment caused by live load is 76803.0kNm
Bridge Structural Design Scheme Using Traveling Movable Formwork System Method
35.
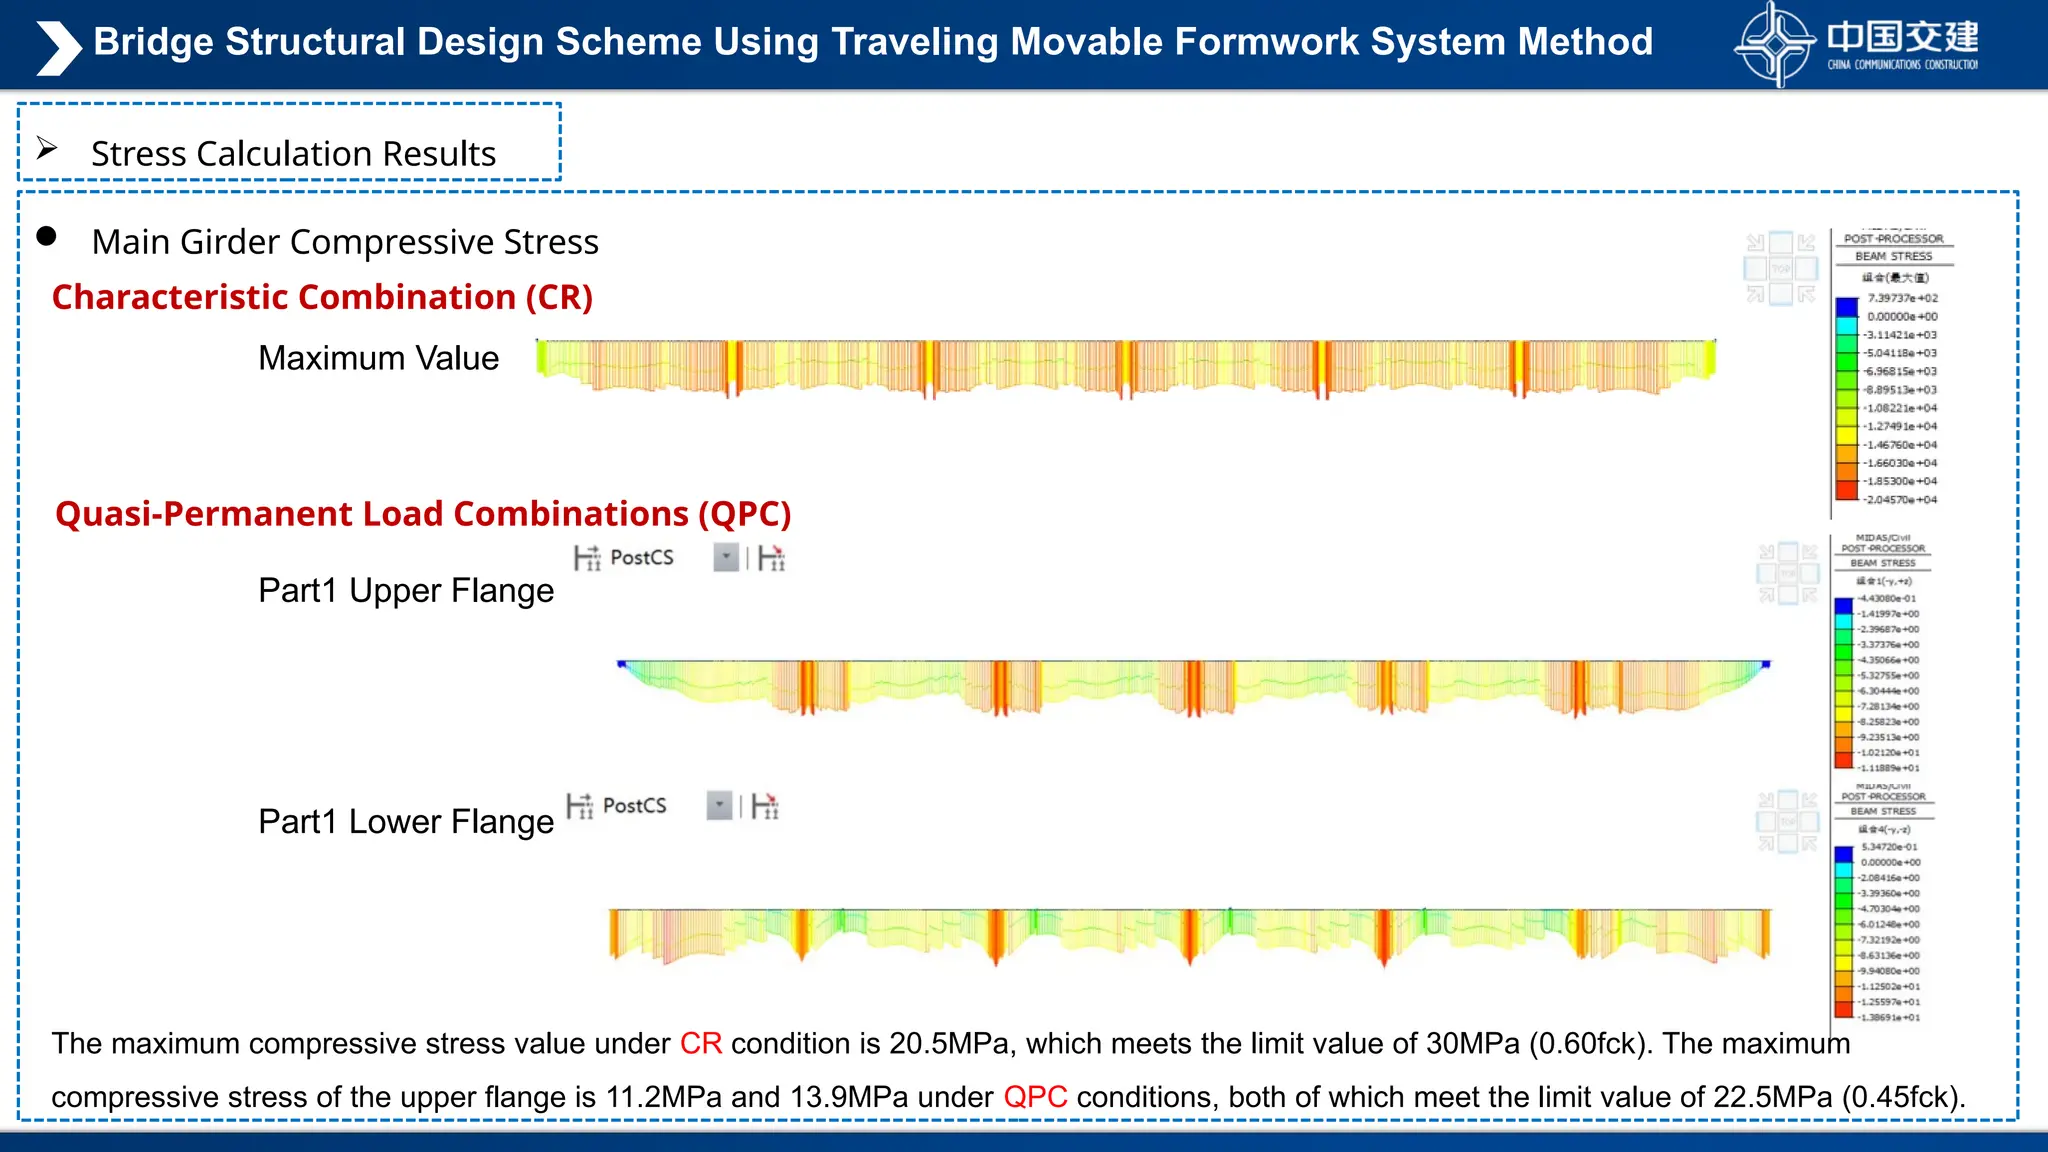
Main GirderCompressive Stress
Stress Calculation Results
Characteristic Combination (CR)
Quasi-Permanent Load Combinations (QPC)
Part1 Upper Flange
Part1 Lower Flange
The maximum compressive stress value under CR condition is 20.5MPa, which meets the limit value of 30MPa (0.60fck). The maximum
compressive stress of the upper flange is 11.2MPa and 13.9MPa under QPC conditions, both of which meet the limit value of 22.5MPa (0.45fck).
Maximum Value
Bridge Structural Design Scheme Using Traveling Movable Formwork System Method
36.
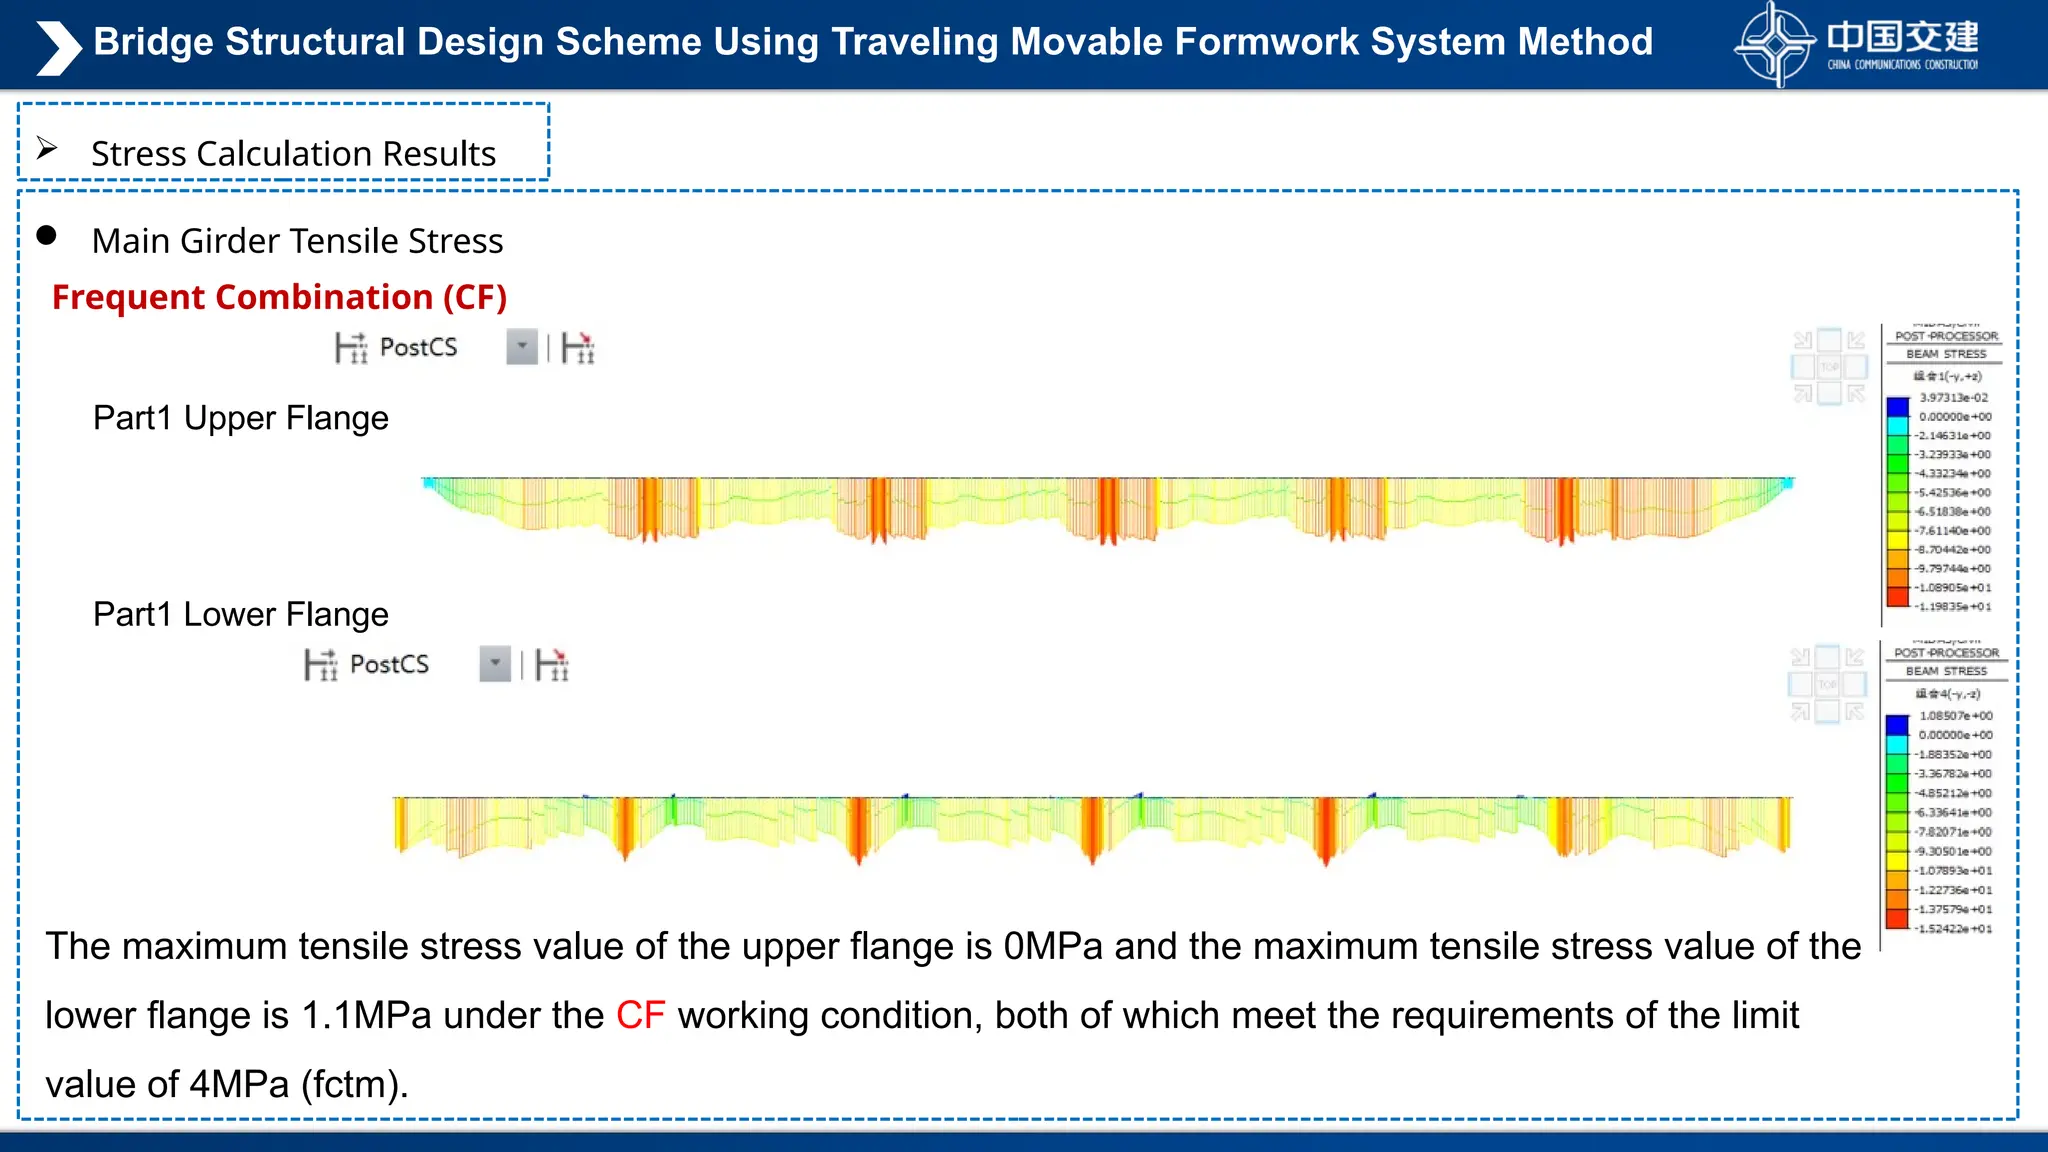
Main GirderTensile Stress
Stress Calculation Results
Frequent Combination (CF)
Part1 Upper Flange
Part1 Lower Flange
The maximum tensile stress value of the upper flange is 0MPa and the maximum tensile stress value of the
lower flange is 1.1MPa under the CF working condition, both of which meet the requirements of the limit
value of 4MPa (fctm).
Bridge Structural Design Scheme Using Traveling Movable Formwork System Method
37.
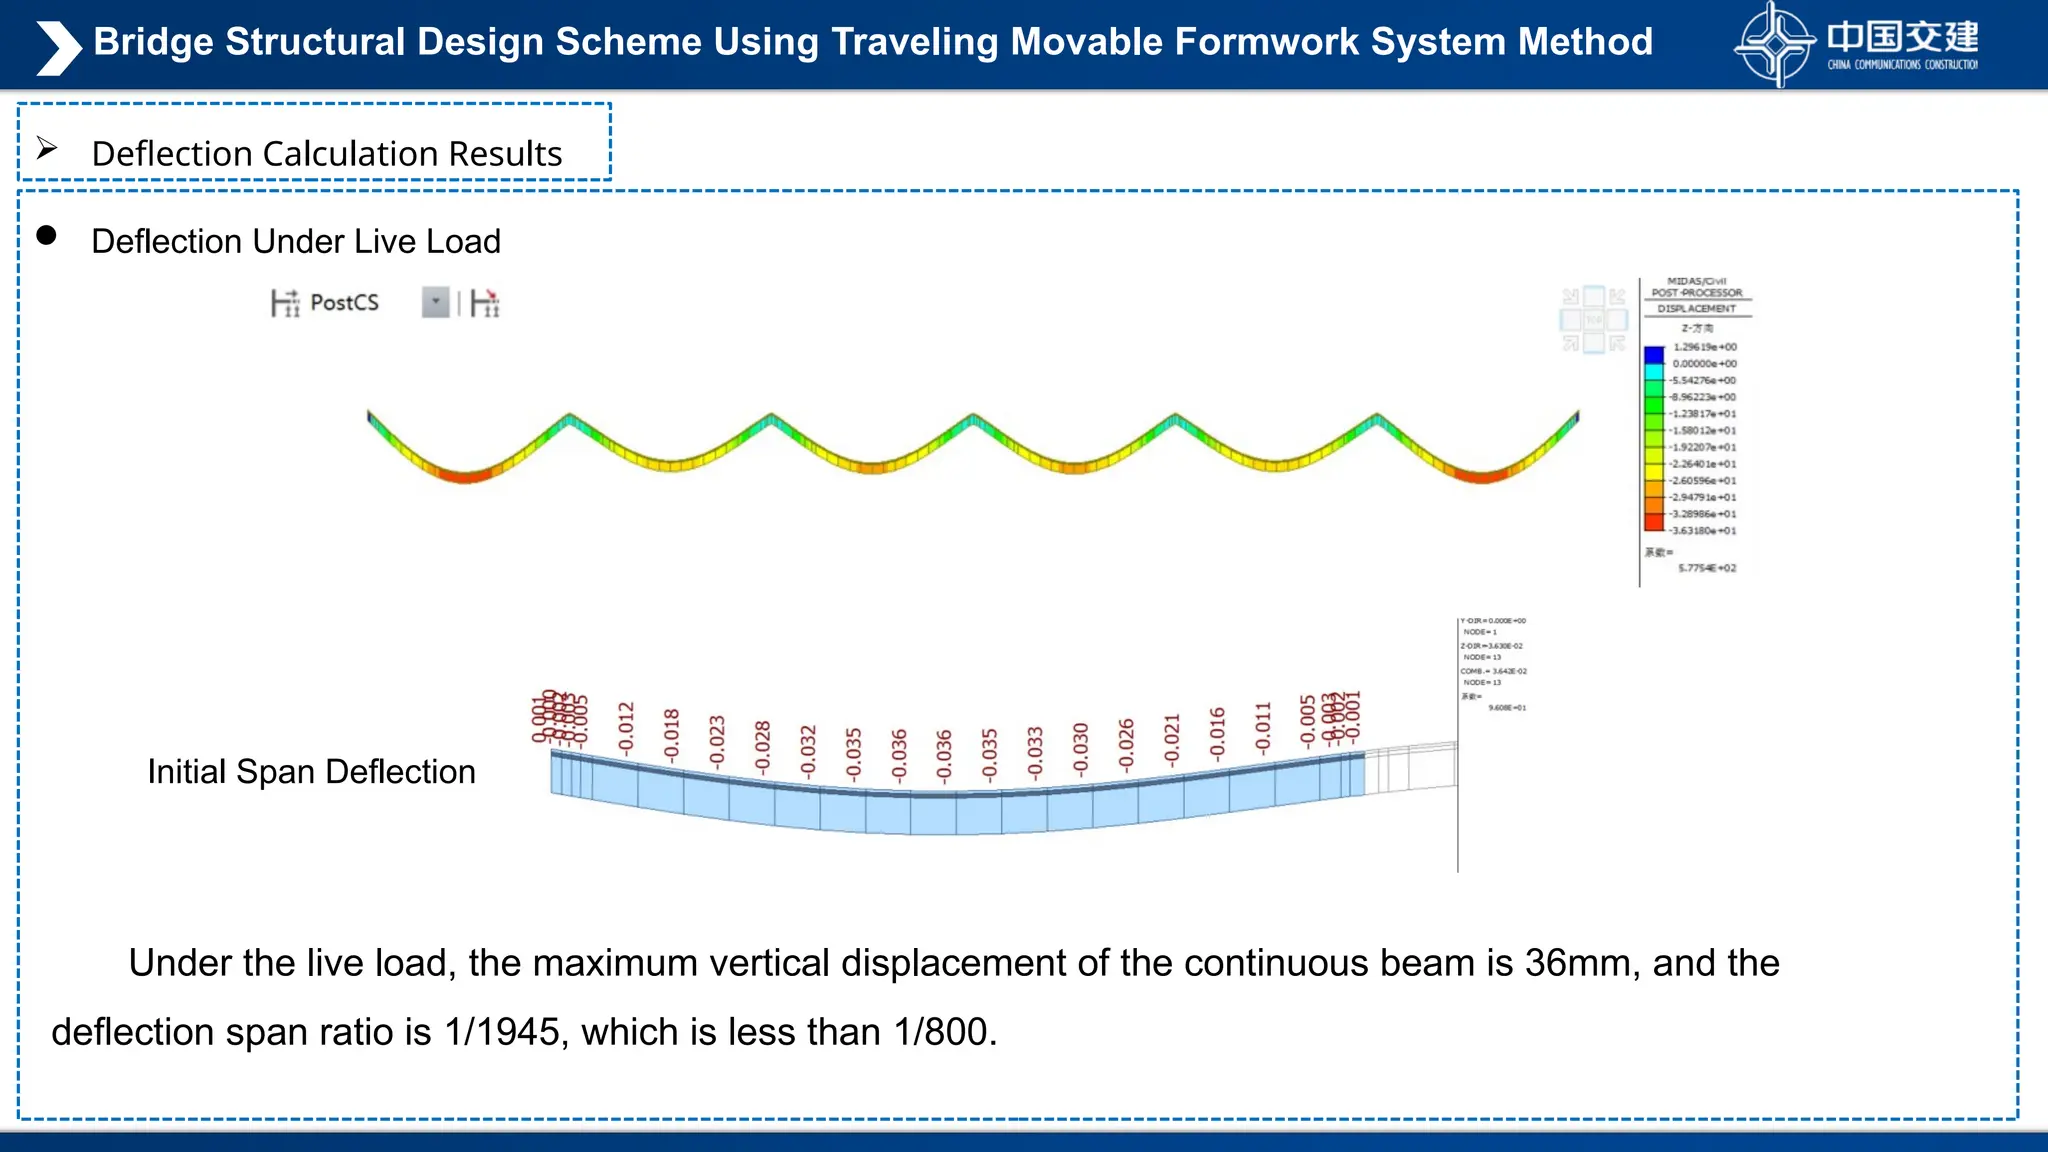
Deflection CalculationResults
Deflection Under Live Load
Initial Span Deflection
Under the live load, the maximum vertical displacement of the continuous beam is 36mm, and the
deflection span ratio is 1/1945, which is less than 1/800.
Bridge Structural Design Scheme Using Traveling Movable Formwork System Method
38.
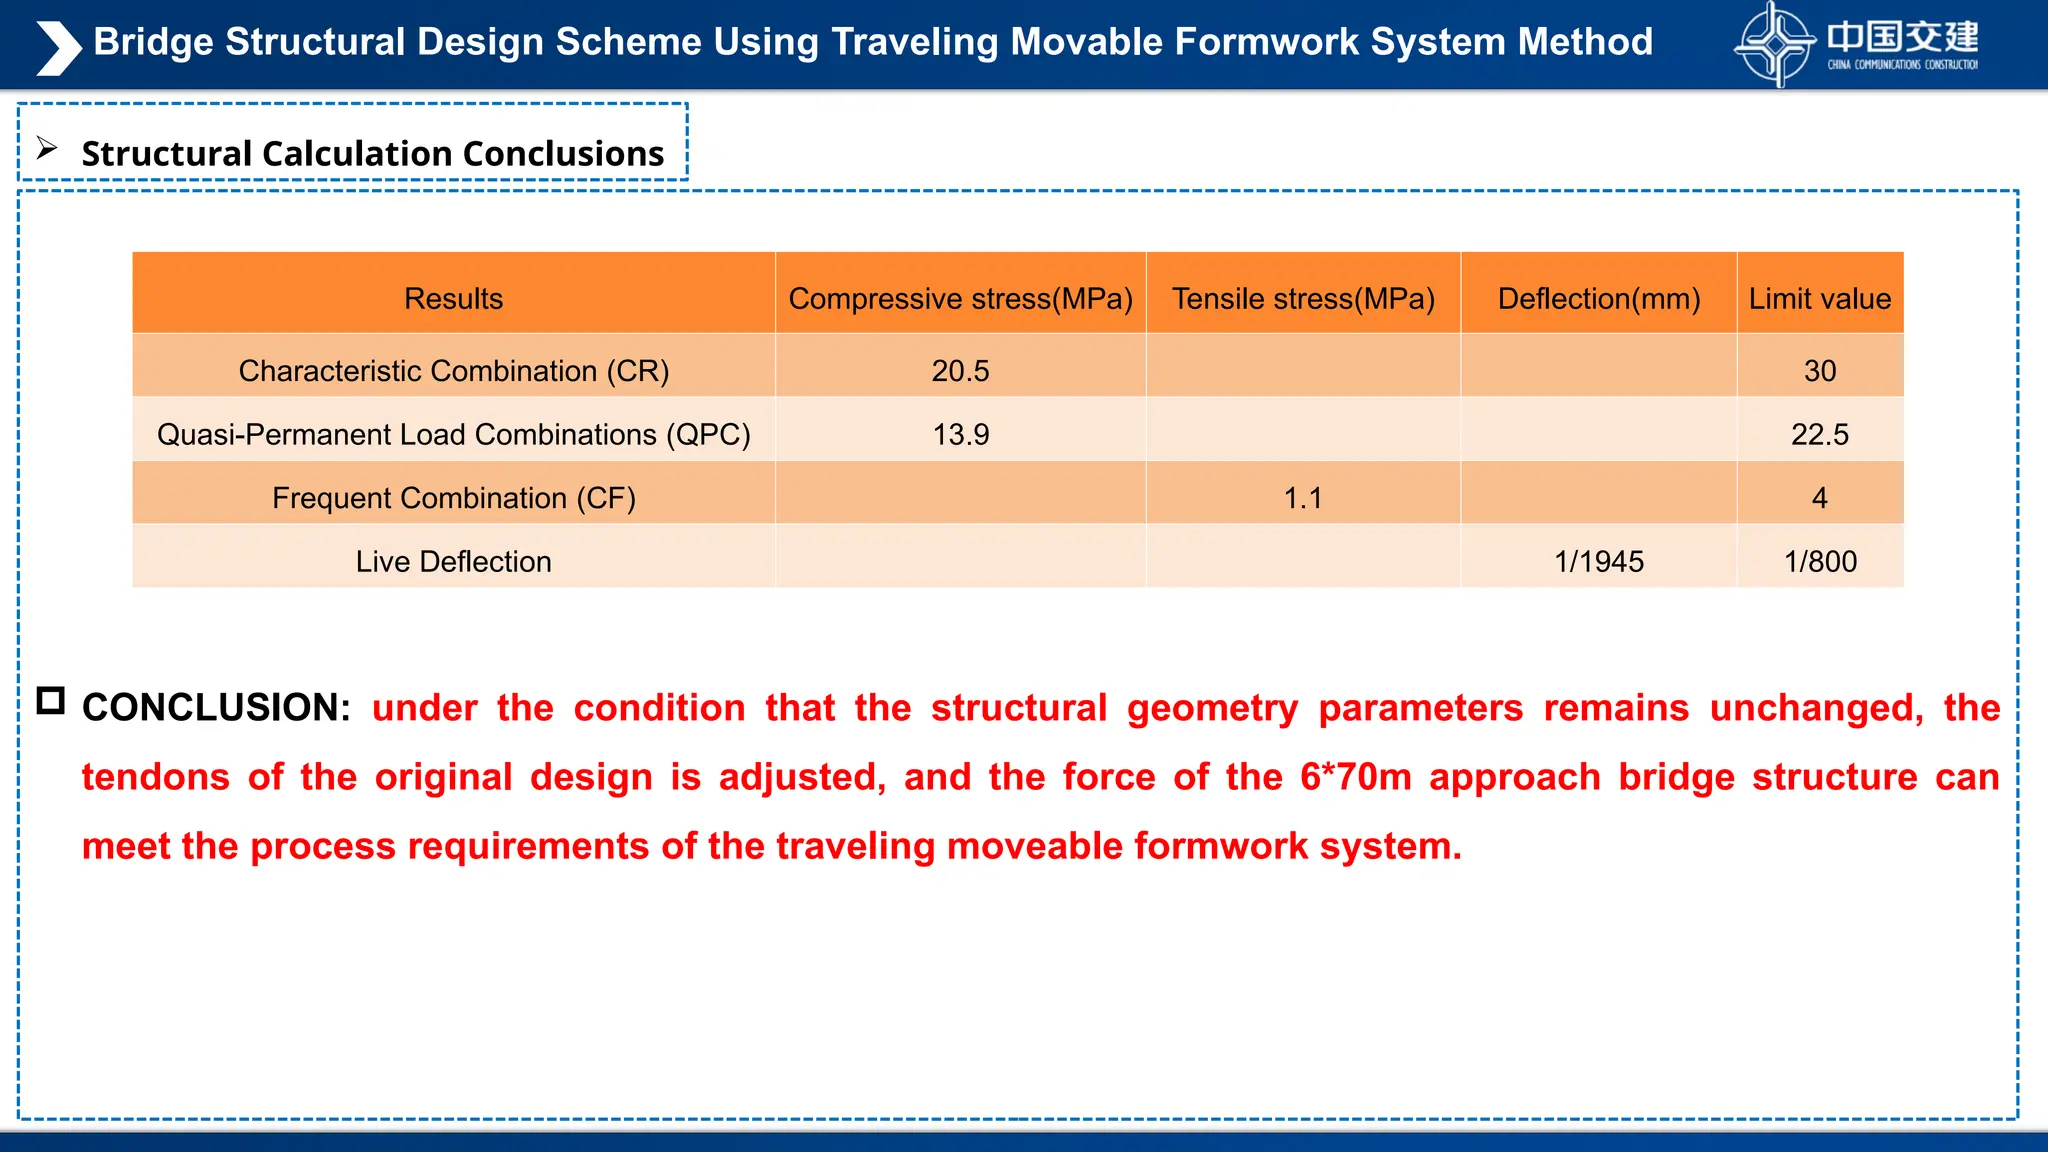
CONCLUSION: underthe condition that the structural geometry parameters remains unchanged, the
tendons of the original design is adjusted, and the force of the 6*70m approach bridge structure can
meet the process requirements of the traveling moveable formwork system.
Structural Calculation Conclusions
Bridge Structural Design Scheme Using Traveling Movable Formwork System Method
Results Compressive stress(MPa) Tensile stress(MPa) Deflection(mm) Limit value
Characteristic Combination (CR) 20.5 30
Quasi-Permanent Load Combinations (QPC) 13.9 22.5
Frequent Combination (CF) 1.1 4
Live Deflection 1/1945 1/800
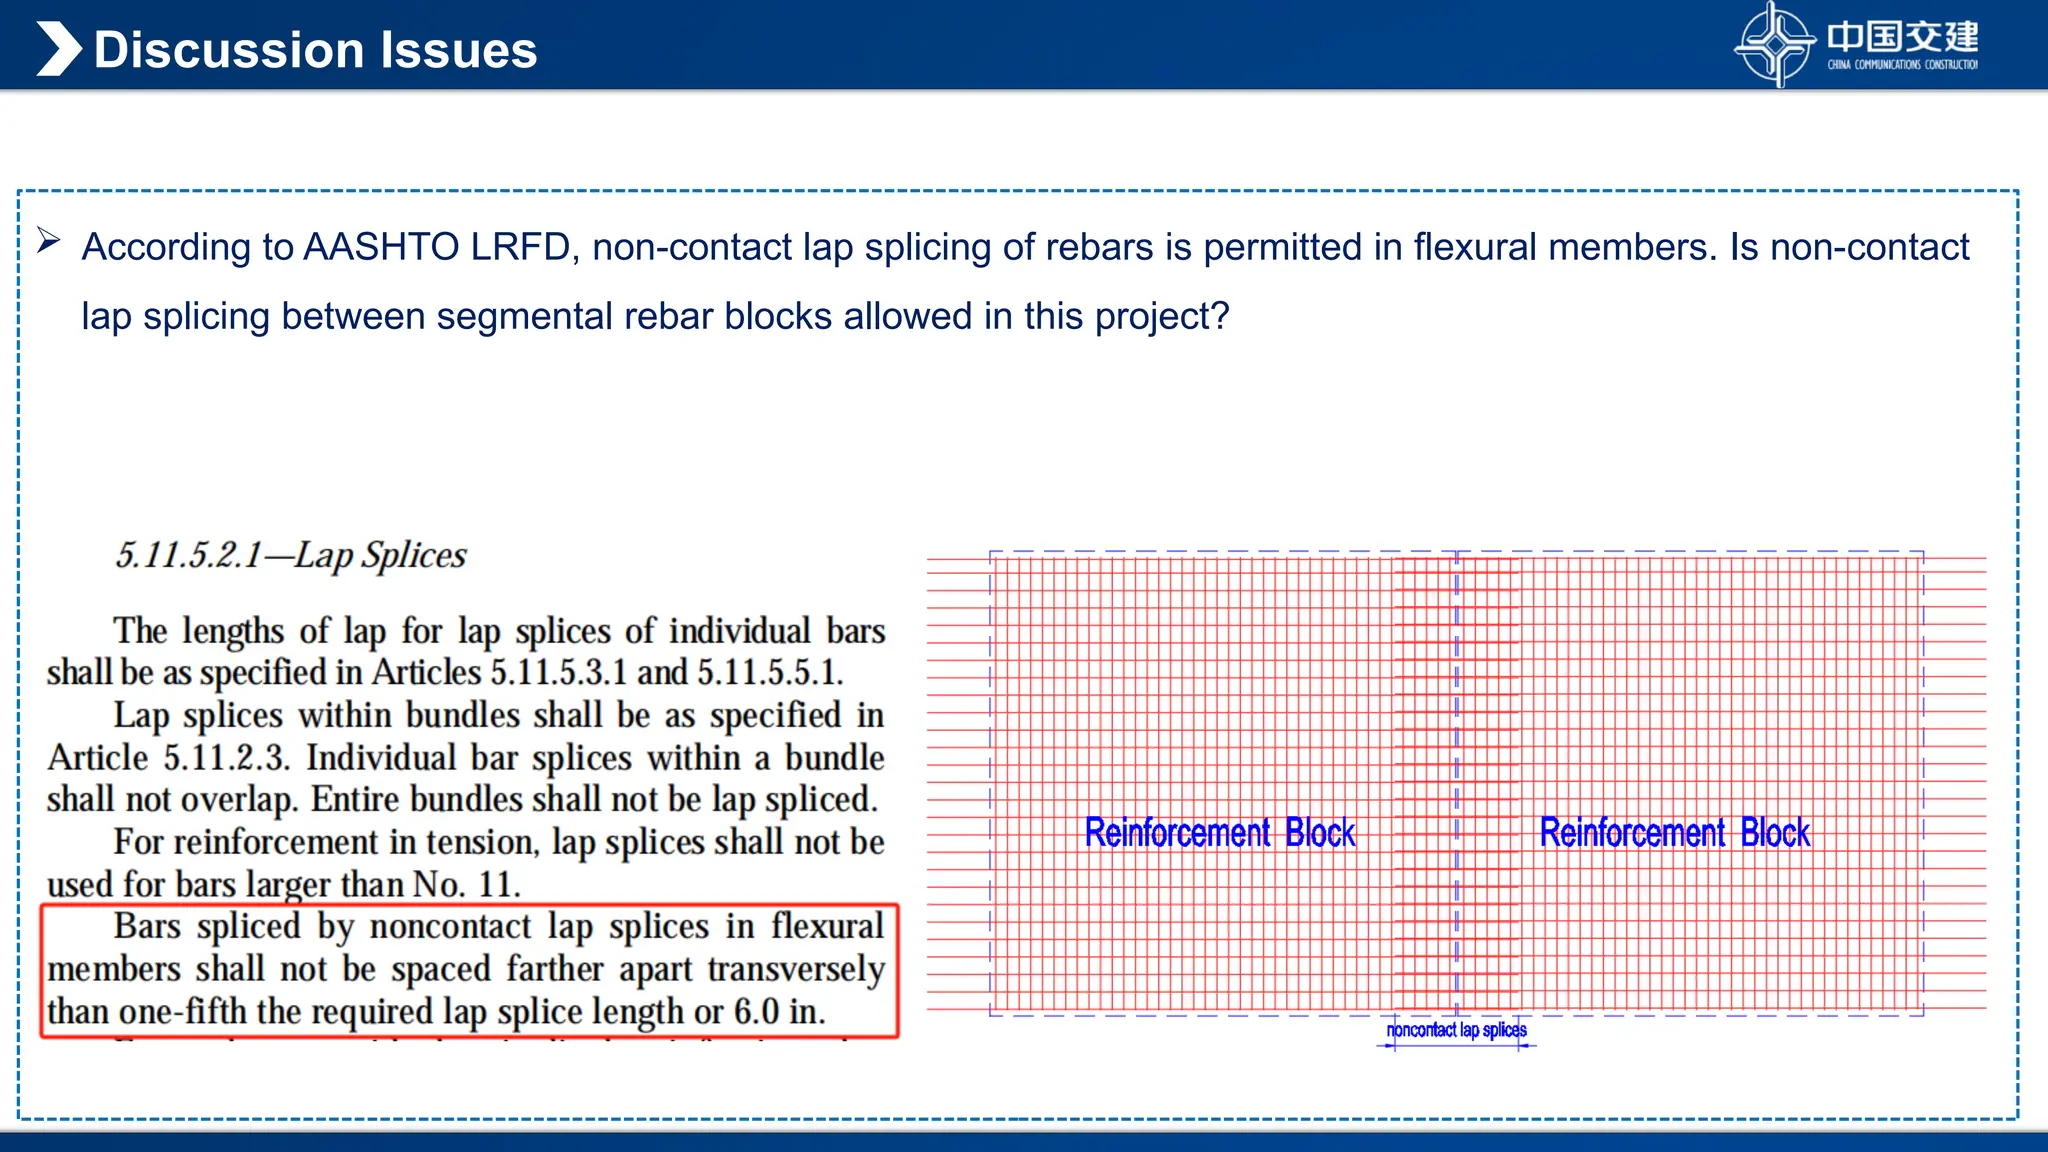
According toAASHTO LRFD, non-contact lap splicing of rebars is permitted in flexural members. Is non-contact
lap splicing between segmental rebar blocks allowed in this project?
Discussion Issues
41.
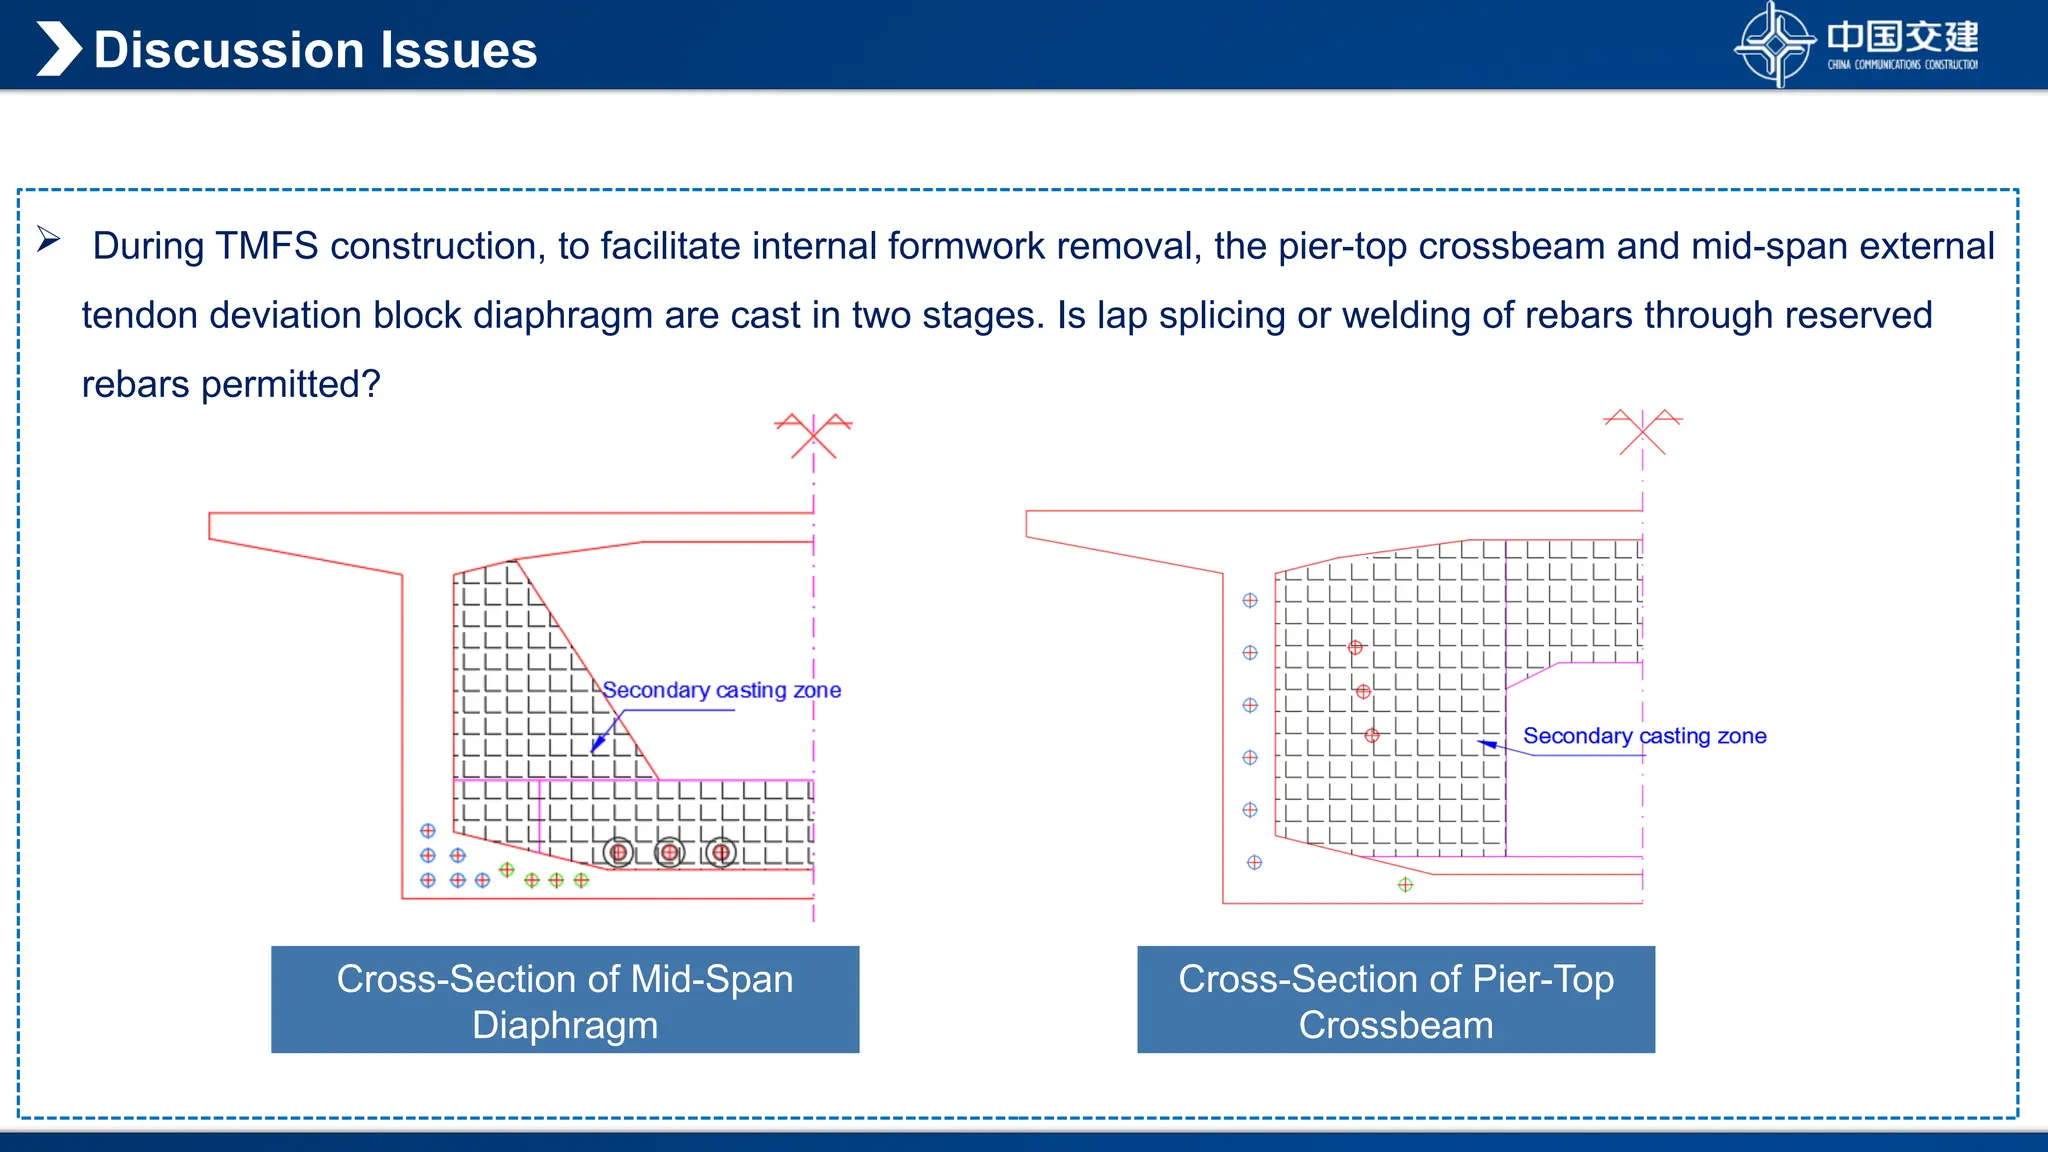
During TMFSconstruction, to facilitate internal formwork removal, the pier-top crossbeam and mid-span external
tendon deviation block diaphragm are cast in two stages. Is lap splicing or welding of rebars through reserved
rebars permitted?
Discussion Issues
Cross-Section of Mid-Span
Diaphragm
Cross-Section of Pier-Top
Crossbeam