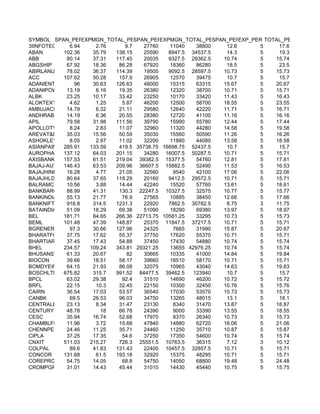
The document appears to be a table containing stock market data for various companies including their symbol, share price information like span per share and total per share, and other financial metrics like expected margin per lot. There are multiple rows of data with company name, share prices, totals, and other figures.
The document appears to be a table containing stock market data for multiple companies. It includes information such as the stock symbol, closing share price, total market capitalization, and other financial metrics. The data is organized into columns with company names and associated values.
The document appears to be a table containing stock market data including the following column headers: SYMBOL, SPAN_PER_SHARE, TOTAL_PER_SHARE, EXPMGN_PERLOT, SPAN_PERLOT, TOTAL_PERLOT, EXP_PER, TOTAL_PER. It includes over 100 rows of stock symbols and their associated values across these financial metrics.
The document appears to be a table containing stock market data for multiple companies including stock symbols, share prices, lot sizes, and total values. It includes figures for span per share, total per share, expected margin per lot, span per lot, total per lot, and expected profit.
The document appears to be a table containing stock market data including symbols, share prices, totals, margins and other financial information for multiple companies. It includes over 100 rows showing details like share price, total price, expected margin and totals for each company. The table contains columns with headings like SYMBOL, SPAN_PER_SHARE, TOTAL_PER_SHARE, EXP_PER and TOTAL_PER showing various financial metrics for each listed company.
The document contains stock market data for multiple companies including their symbol, share price information such as span per share and total per share, and other financial metrics such as expected margin per lot. The data includes metrics such as share price, total price per lot, and expected profit for each company. This appears to be a table containing stock market performance data for many Indian companies.
The document appears to be a table containing stock market data including the symbol, share price information such as span per share, total per share, and expected margin per lot for various companies. The table includes columns for the symbol, various share prices, expected margins, totals, and percentages. It contains data for over 50 stock symbols.
The document appears to be a table containing stock market data including the symbol, span per share, total per share, expected margin per lot, and total values for various stocks. It includes over 100 stocks with values for metrics like span, total, expected margin listed for each.
The document provides the intra-day technical levels for various stocks trading on the National Stock Exchange of India (NSE) on March 5, 2013. It lists the stocks, their closing prices from the previous day, identified trends (up or down), pivot points, and resistance and support levels for intra-day trading. The levels are intended to help traders identify potential highs and lows for the stocks during the trading day.
The document is a table showing vehicle sales data by brand and model for each month of 2016 for imported vehicles from dealer associations affiliated with ABEIFA. Some of the key figures include:
- Total sales for the year were 10,776 vehicles.
- The top selling brands were Land Rover (5,926 vehicles), Kia Motors (4,505 vehicles), and Geely (2,727 vehicles).
- For Land Rover, the Discovery Sport was the top selling model (349 vehicles on average per month).
- Kia's best selling models were the Sportage (4,505 total) and Picanto (1,878 total).
The document provides the intra-day technical levels for various stocks on the NSE futures market for January 29, 2013, the day before the January 2013 futures and options expiry. It lists the closing price from January 28, the intra-day pivot point, and resistance and support levels for each stock. Most stocks are showing a downward trend according to the technical analysis.
The document provides the intra-day technical levels for various stocks trading on the National Stock Exchange of India on February 1, 2013. It lists the closing price, intra-day pivot point, resistance and support levels for over 50 companies. The pivot point, resistance and support levels are used to analyze the trend and potential trading zones for the stocks.
The document appears to be a table containing stock market data including closing prices and various moving average values for multiple ticker symbols. Specifically, it lists the ticker, close price, and 10 different moving average calculations including short term (20 day), medium term (50-100 day), and long term (200 day) averages. This provides a snapshot of stock performance and trends over different durations.
The document provides the intra-day technical levels for various stocks trading on the National Stock Exchange of India on February 8, 2013. It lists the closing price, intra-day pivot point, resistance levels above the pivot, and support levels below the pivot for each stock, along with the trend and expiry date for futures contracts.
This document provides the intra-day technical levels for various stocks trading on the NSE, including pivot points and resistance and support levels, to analyze short term trends on February 4, 2013. Most stocks are showing a downward trend for the day. The levels provided can be used to identify entry and exit points for short term trading.
The document provides the intra-day technical levels for various companies trading on the National Stock Exchange of India (NSE) on January 9, 2013. It lists the closing price, intra-day pivot point, resistance levels (R1-R3) and support levels (S1-S3) for each company to analyze its movement during the trading day. The trends—whether the company is in an upward, downward or neutral trend—are also indicated.
This document provides the intra-day technical levels for various stocks on the NSE futures market for February 12, 2013. It lists the closing price from February 11, the intra-day pivot point, and resistance and support levels for over 50 stocks. The levels are used to identify potential intra-day price targets and trading zones.
The document provides the intra-day technical levels for various stocks trading on the National Stock Exchange of India on February 15, 2013. It lists the closing price from the previous day, intra-day pivot points, and resistance and support levels for each stock to analyze its short-term trend and potential trading zones. Key indices like Nifty, Bank Nifty and CNXIT are shown to be in a downward trend for the day.
This document provides the intra-day technical levels for various stocks on the NSE for December 21, 2012, with the futures and options expiry on December 27, 2012. It lists the closing price, intra-day pivot point, resistance and support levels for over 50 stocks across various sectors. The pivot, resistance and support levels will help traders analyze the intra-day market trends and identify entry and exit points.
- The document is an analysis of futures and options contracts for various stocks and indexes in the Indian market as of November 24, 2011.
- It provides data on the open interest, changes in open interest, changes in closing price, support and resistance levels for each underlying asset.
- The underlying assets include stock futures contracts for over 50 companies across sectors, as well as index futures for Nifty, Bank Nifty, Mini Nifty and CNXIT.
The document provides the intra-day technical levels for various companies trading on the National Stock Exchange of India on January 15, 2013. It lists the previous day's closing price, intra-day pivot points, and resistance and support levels for over 50 companies. Most companies are showing an upward trend for the day.
The document provides the intra-day technical levels for various companies trading on the NSE for November 8, 2012. It includes the previous day's closing price, intra-day pivot points, and resistance and support levels for upward and downward trends to watch in trading. The levels are intended to help traders identify entry and exit points during the trading session.
The document is an Erlang B traffic table that shows the maximum offered traffic load versus blocking probability (B) and number of lines (N). It provides traffic load values for various combinations of B (ranging from 0.01 to 40%) and N (ranging from 1 to 77 lines). The higher the traffic load, the higher the blocking probability will be for a given number of lines.
The document provides the intra-day technical levels for various companies trading on the NSE for December 28, 2012. It lists the closing price, intra-day pivot points, and resistance and support levels for each company to analyze their short-term trend and potential price movements during the trading session. The levels are used to identify targets for purchases and sales as well as exit points for current positions.
The document provides the intra-day technical levels for various companies trading on the NSE for November 30, 2012. It includes the previous day's closing price, intra-day pivot points, resistance and support levels for upward and downward trends to watch in intra-day trading. The levels are intended to help traders identify potential entry, exit and profit booking points during the trading session.
The nifty future is likely to trade in the range of 5360-5650 level in short term as the OI is added. The trading strategy would be to create long positions if the nifty takes support around 5500 levels for the target of 5550 and 5600. On the other hand, one can also create short positions if the nifty resists around 5630 levels.
The document appears to be a market report listing various stocks and indexes with their corresponding lot sizes, open interest, changes in open interest, changes in price, support and resistance levels, and closing prices as of December 30, 2010. A large number of stocks across sectors like banking, infrastructure, automobiles, pharmaceuticals, and more are included with key data points around their futures trading on exchanges. The report provides a snapshot of the futures market and changes in open positions and prices for many major Indian stocks and indexes.
The document appears to be a table containing stock market data for multiple companies including stock symbols, share prices, margins, and totals. It includes values such as share price, total price per share, expected margin per lot, and total values. The table contains these metrics for over 100 stock symbols.
This document provides specifications for Moyno G2 and G3 series pumps including dimensions and weights. It lists various pump frame sizes from 1E008G2 to 6K175G2 with corresponding measurements and discharge weights at different pipe lengths. Key dimensions included are flange size, length and diameter of pump components. The page notes that dimensions are in inches and provides contact information for Moyno pumps.
The document reports stock market data from the Dhaka Stock Exchange for January 23, 2017. It provides details on the number of issues that advanced, declined, and remained unchanged across different categories. Overall, 159 issues advanced and 142 declined among the 328 total issues traded. It also lists transaction numbers and volumes, as well as market capitalization values for various security types.
This document provides specifications for oilfield casing including sizes ranging from 7 3/4 to 13 5/8 inches, weights ranging from 16.6 to 88.2 lbs/ft, drift diameters, capacities in barrels per 100 feet, and other details. It lists physical properties and performance metrics for different casing strings to aid in well design and construction.
R and B SOR FOR BUILDING WORKS AHMEDABAD CITY 2021_22.pdfssuserc0e014
This document appears to be a schedule of rates for building works in Ahmedabad City, Gujarat for the year 2021-22. It contains various annexures and statements providing basic rates for materials, labor, carriage, hire charges, and other construction-related costs. Specifically, statement 4A provides the estimated costs for transporting materials over different distances by truck, accounting for factors like fuel consumption, labor wages, and vehicle hire charges.
The document appears to be a table containing stock price and valuation data for multiple companies. It includes columns for stock price, estimated fair price, percentage difference between current and fair price, and other valuation metrics. The table contains data for over 100 stock ticker symbols.
Comprehensive IIEC final 2010 refferendum results 09/ 08 /2010Leonardus Ouma
The document provides referendum results from 40 constituencies in Kenya. It shows the number of votes for YES and NO, the percentage of votes each received, voter turnout and rejected ballots. YES received over 70% of the vote in most constituencies, with NO votes ranging from under 10% to around 30% depending on the region.
The document provides reference tables for refrigerant pressure-temperature charts for R22, R134a, and R407C refrigerants. It also includes charts converting between kg/cm2 and psi pressure units, as well as common conversion factors for units like mm, m, kg, kW, °C, and °F.
The document reports stock market data from the Dhaka Stock Exchange of Bangladesh for January 25, 2017. It provides details on the number of issues that advanced, declined, and remained unchanged across different categories. Overall, most issues declined, with 89 advancing and 228 declining out of a total of 328 issues traded. It also lists transaction numbers and volumes, as well as market capitalization values and price information for some leading equity issues.
This document contains a chart listing pipe sizes, outside diameters, wall thicknesses, and weights. The pipe sizes range from 1/8 inch to 72 inches in nominal diameter. For each size, the chart provides the outside diameter in mm and the wall thickness in mm for various standard wall thickness designations including SCH 10, SCH 20, SCH 30, etc. Heavier wall thicknesses are shown for larger pipe sizes.
This table provides the partial pressures in mmHg of nitric acid (HNO3) and water (H2O) over aqueous solutions of nitric acid at different concentrations and temperatures. The concentrations of the nitric acid solutions range from 20% to 100% by weight. The temperatures range from 0°C to 125°C. The table shows that as the concentration and temperature of the nitric acid solutions increase, the partial pressures of both HNO3 and H2O increase as well.
The document contains an Erlang B traffic table that shows the maximum offered load versus B and N, where B is the blocking probability in % and N is the number of circuits. The table provides load values for different combinations of B ranging from 0.01 to 40% and N ranging from 1 to 77 circuits. The load values indicate the maximum number of external calls that can be offered to the system without exceeding the blocking probability B for a given number of circuits N.
The document appears to be a table containing stock market data including closing prices and various moving average values for multiple ticker symbols. It includes columns for the ticker, close price, and 10 different types of moving averages including short term (20 day), medium term (50-100 day), and long term (200 day) averages. This table provides a snapshot of performance metrics for dozens of stocks.
This document provides closing stock prices and percentage changes for various companies over different time periods ranging from quarterly to 10 year periods. It ranks over 100 companies and provides their ticker, name, closing prices for 2004, 2009, 2013, 2014 and percentage changes for various time periods. The data allows for comparison of stock performance and changes over short and long-term periods for a variety of companies.
The document shows closing stock prices and percentage changes for various companies over different time periods ranging from quarters to 10 years. It ranks over 100 companies and provides their ticker, name, closing prices for 2004, 2009, 2013, 2014 and percentage changes for various periods of time including quarters, years, and longer time frames of 5 and 10 years. The data allows for comparisons of stock price performance and changes over different durations for a variety of companies.
This document summarizes dairy product import data to Colombia from 1991-2011, including the kilograms and US dollar cost of imports for milk powders, evaporated milk, condensed milk, liquid milk, butter, cheeses, whey, and totals. It shows that import quantities and costs generally increased over time, with the largest imports being milk powders, liquid milk, and cheeses.
This document provides specifications for various standard H-beam, wide flange, lip channel, and equal angle steel sections. It includes dimensions such as height, width, thickness, area, weight, moments of inertia, radii of gyration, and other geometric properties. Sections range in size from 100x100 mm to 588x300 mm for H-beams, 148x100 mm to 500x200 mm for wide flanges, 100x50x20 mm to 200x75x20 mm for lip channels, and 40x40 mm to 120x120 mm for equal angles. Properties are specified in metric units.
#WeeklyNewspaper
RBI increases household income limit for borrowers for NBFCs and MFIs. Demystify Technical Analysis with #Findoc Prime and learn the trade secrets.
Stay updated
https://www.myfindoc.com/research/newspaper
#sharemarket #mutualfunds #trading #stocks #SBI #FinDoc #Gurupurab #GuruNanakDevji
This document provides standard sectional dimensions and properties of equal angle steel and double angle steel. It includes dimensions such as length, width, thickness, radius of gyration, sectional area, unit weight, and moments of inertia. Properties are listed for standard sizes ranging from 25x25mm to 250x250mm.
Similar to Derivative Reports - Mansukh Investments & Trading Solutions. (20)
The document provides quarterly financial results for PNB, UCO Bank, and City Union Bank. For PNB, revenue saw a marginal increase for the quarter ended September 2013 while profit declined 52.56%. UCO Bank reported a 5.92% rise in revenue and a remarkable 285.88% increase in net profit for the quarter. City Union Bank's revenue grew 20.48% while net profit growth was modest at 4.89% for the quarter.
The revenue and profits of India Cements declined in the quarter ended September 2013 compared to the same period last year. The net loss for the quarter was Rs. 225.30 million versus a net profit of Rs. 490.80 million last year. Operating profit also decreased from Rs. 2082.30 million to Rs. 1119.00 million.
In contrast, Tech Mahindra saw significant growth in the September 2013 quarter over the corresponding period last year. Total revenue increased 175.64% to Rs. 41562.40 million. Net profit rose sharply by 298.83% to Rs. 6386.40 million. Operating profit also grew from Rs. 2352.80 million to Rs. 8989
The revenue of Indraprastha Gas zoomed 18.11% for the quarter ended September 2013 compared to the same period last year. However, the Net Profit registered a slight decline of 6.51%. Glaxo Consumer Healthcare witnessed an 18.23% growth in revenue but Net Profit grew only 14.3% for the quarter. BHEL's sales declined 14.93% for the quarter while Net Profit fell sharply by 64.22% compared to the corresponding quarter of the previous year. Operating profit also decreased for BHEL.
This document provides key support and resistance levels for various stock indexes and individual stocks along with their open interest, change in open interest, and closing price information as of November 5, 2013. It lists Nifty, Bank Nifty, CNXIT, and various individual stock futures with their lot size, open interest, change in open interest, support levels 1 and 2 (S1 and S2), resistance levels 1 and 2 (R1 and R2), and closing price on November 5.
- Nifty futures closed at 6298.80 on Tuesday, at a premium of 45.65 points over the spot closing of 6253.15. Nifty December 2013 futures ended at a premium of 92.05 points over the spot closing.
- The put call ratio for Nifty options was 1.31, indicating higher open interest in put options. The put call ratio for Bank Nifty options was 0.97.
- For the upcoming session, the market seems bullish. However, 6317 and 6343 could act as crucial resistance levels, while 6210 and 6170 may serve as near-term support levels.
- The document provides key support and resistance levels for various stocks and indices based on their open interest as of October 30, 2013, the day before expiry. It notes the change in open interest and closing price for each underlying from the previous day. Support levels 1 and 2 (S1, S2) and resistance levels 1 and 2 (R1, R2) are given.
- Open interest increased for Nifty futures but decreased for Bank Nifty and CNXIT futures. Several individual stocks saw significant decreases in open interest, including Adani Power, Hindalco, HDIL, and JSW Steel, while open interest grew for IndusInd Bank, HDFC, and Kotak Bank.
-
The Nifty futures closed at 6,255, up 0.5% from the previous day's close. Trading volumes declined across most derivative products. Put call ratios for both Nifty and Bank Nifty options were above 1, indicating greater open interest for put options. The report provides closing prices and open interest figures for various stocks. It also outlines the most actively traded call and put options, and recommends a bearish options strategy for Nifty.
This document provides key support and resistance levels for futures contracts of various stocks trading on Indian exchanges, based on their open interest and closing price on October 29, 2013. It lists over 50 stocks, along with their lot size, open interest, change in open interest from the previous day, support and resistance levels, and closing price. The expiry date for the contracts is October 31, 2013.
The document is a daily derivative report that provides the following key information:
- Nifty futures closed at 6231.10, a premium of 10.20 points over the spot closing of 6220.90. Open interest on Nifty October futures contracted by 1.3 million units to 12.82 million units.
- Several stock futures like Tata Steel, Yes Bank, DLF, and ICICI Bank traded at discounts to their spot closing prices.
- Put call ratios for Nifty and Bank Nifty options were 1.66 and 1.27 respectively, indicating higher put open interest.
- Total futures and options turnover increased 94.24% compared to the previous day, with gains
This document provides key support and resistance levels for various stock futures contracts expiring on October 31, 2013. It lists underlying stocks, their lot size, open interest, change in open interest, percentage change in open interest and closing price from October 28, 2013. It also provides support levels S1 and S2 and resistance levels R1 and R2 for each stock future contract based on technical analysis.
This document provides key support and resistance levels for various stock indexes and futures as of October 25, 2013. It lists underlying assets, their lot size, open interest, changes in open interest, support and resistance levels, and closing prices from the previous day. The expiry date for the futures contracts is October 31, 2013. It contains this information for indexes like Nifty, Bank Nifty, CNXIT and over 50 stock futures.
The document is a daily derivatives report that provides key information on the NIFTY futures market. Some of the key details included in the summary are:
- NIFTY futures closed at 6,141, down 19.45 points (0.32%) from the previous day's close.
- Total futures and options volume declined 21.02% compared to the previous day.
- The put call ratio for Nifty and Bank Nifty options was 1.45 and 1.08 respectively, indicating higher put open interest.
- Most active stock futures like DLF, ITC, Yes Bank and Tata Steel were trading at premiums between 0.25-2.90 points compared to their spot prices
- Nifty futures closed at 6177.00 on Thursday, at a premium of 12.65 points over the spot closing of 6164.35. Nifty November 2013 futures ended at 6227.05, at a premium of 62.70 points over the spot closing.
- Trading volumes increased for index futures (10.78%), index options (10.21%) and decreased for stock futures (-6.60%) and stock options (-11.76%).
- Key support and resistance levels for Nifty are seen at 6105/6032 and 6235/6280 respectively.
This document provides a summary of futures trading data for various stocks and indices for the expiry date of 31st October 2013. It lists the underlying asset, lot size, open interest, change in open interest, support and resistance levels, and closing price from 23rd October 2013. Key details include an overall increase in open interest for Nifty futures of 6.54% and Bank Nifty futures of 4.06%, while open interest decreased for CNXIT futures by 7.9%. Support and resistance levels are provided to indicate possible price movement ranges.
Nifty futures closed lower at 6,178.35 points, down 0.39% from the previous day's close. Trading volumes increased across all derivative segments. Put call ratios for both Nifty and Bank Nifty options were above 1, indicating greater open interest in put options. Most active calls and puts were seen in the 6,100-6,300 strike price range for the October 31 expiry. The report provides an outlook for Nifty, noting key resistance and support levels. It also includes a sample options strategy for Nifty and a tracker of previous strategies.
Nifty futures closed lower at 6,178.35 points, down 0.39% from the previous day's close. Trading volumes increased across all derivative segments. Put call ratios for both Nifty and Bank Nifty options indicate a bearish sentiment. Most active calls and puts were seen in the 6,100-6,300 strike prices for the October 31 expiry. The report provides an outlook for Nifty, noting key resistance and support levels. It also includes the most and least active stocks by change in open interest. Strategies tracked show profits booked from positions in Nifty futures and options.
This document provides key support and resistance levels for various stock indexes and futures as of October 22, 2013. It lists underlying assets, their lot sizes, open interest levels and changes, and support and resistance price levels. The expiry date for futures contracts is October 31, 2013. Overall, open interest increased for many indexes and stocks compared to the previous day.
- The document provides key support and resistance levels for various stocks and indices in the futures and options market. It lists the underlying, lot size, open interest, change in open interest, closing price and support and resistance levels for each stock.
- The highest changes in open interest were seen in Federal Bank (44.72%), IDFC (10.08%), and Cairn India (10.99%) while the largest falls were in HDFCBank (-2.22%) and LIC Housing Finance (-1.49%).
- The expiry date for the futures and options contracts is 31st October 2013.
- The Nifty futures closed at 6236.00 on Monday, a premium of 31.05 points over the spot closing of 6,204.95.
- Put call ratios for Nifty and Bank Nifty options were 1.59 and 1.06 respectively, indicating higher put open interest.
- Total futures and options turnover decreased by 17.43% on Monday compared to the previous day, with index options seeing the largest fall of 19.52%.
More from Mansukh Investment & Trading Solutions (20)
❼❷⓿❺❻❷❽❷❼❽ Dpboss Matka Result Satta Matka Guessing Satta Fix jodi Kalyan Final ank Satta Matka Dpbos Final ank Satta Matta Matka 143 Kalyan Matka Guessing Final Matka Final ank Today Matka 420 Satta Batta Satta 143 Kalyan Chart Main Bazar Chart vip Matka Guessing Dpboss 143 Guessing Kalyan night
The 10 Most Influential Leaders Guiding Corporate Evolution, 2024.pdfthesiliconleaders
In the recent edition, The 10 Most Influential Leaders Guiding Corporate Evolution, 2024, The Silicon Leaders magazine gladly features Dejan Štancer, President of the Global Chamber of Business Leaders (GCBL), along with other leaders.
Structural Design Process: Step-by-Step Guide for BuildingsChandresh Chudasama
The structural design process is explained: Follow our step-by-step guide to understand building design intricacies and ensure structural integrity. Learn how to build wonderful buildings with the help of our detailed information. Learn how to create structures with durability and reliability and also gain insights on ways of managing structures.
Company Valuation webinar series - Tuesday, 4 June 2024FelixPerez547899
This session provided an update as to the latest valuation data in the UK and then delved into a discussion on the upcoming election and the impacts on valuation. We finished, as always with a Q&A
Part 2 Deep Dive: Navigating the 2024 Slowdownjeffkluth1
Introduction
The global retail industry has weathered numerous storms, with the financial crisis of 2008 serving as a poignant reminder of the sector's resilience and adaptability. However, as we navigate the complex landscape of 2024, retailers face a unique set of challenges that demand innovative strategies and a fundamental shift in mindset. This white paper contrasts the impact of the 2008 recession on the retail sector with the current headwinds retailers are grappling with, while offering a comprehensive roadmap for success in this new paradigm.
Unveiling the Dynamic Personalities, Key Dates, and Horoscope Insights: Gemin...my Pandit
Explore the fascinating world of the Gemini Zodiac Sign. Discover the unique personality traits, key dates, and horoscope insights of Gemini individuals. Learn how their sociable, communicative nature and boundless curiosity make them the dynamic explorers of the zodiac. Dive into the duality of the Gemini sign and understand their intellectual and adventurous spirit.
Understanding User Needs and Satisfying ThemAggregage
https://www.productmanagementtoday.com/frs/26903918/understanding-user-needs-and-satisfying-them
We know we want to create products which our customers find to be valuable. Whether we label it as customer-centric or product-led depends on how long we've been doing product management. There are three challenges we face when doing this. The obvious challenge is figuring out what our users need; the non-obvious challenges are in creating a shared understanding of those needs and in sensing if what we're doing is meeting those needs.
In this webinar, we won't focus on the research methods for discovering user-needs. We will focus on synthesis of the needs we discover, communication and alignment tools, and how we operationalize addressing those needs.
Industry expert Scott Sehlhorst will:
• Introduce a taxonomy for user goals with real world examples
• Present the Onion Diagram, a tool for contextualizing task-level goals
• Illustrate how customer journey maps capture activity-level and task-level goals
• Demonstrate the best approach to selection and prioritization of user-goals to address
• Highlight the crucial benchmarks, observable changes, in ensuring fulfillment of customer needs
B2B payments are rapidly changing. Find out the 5 key questions you need to be asking yourself to be sure you are mastering B2B payments today. Learn more at www.BlueSnap.com.
[To download this presentation, visit:
https://www.oeconsulting.com.sg/training-presentations]
This presentation is a curated compilation of PowerPoint diagrams and templates designed to illustrate 20 different digital transformation frameworks and models. These frameworks are based on recent industry trends and best practices, ensuring that the content remains relevant and up-to-date.
Key highlights include Microsoft's Digital Transformation Framework, which focuses on driving innovation and efficiency, and McKinsey's Ten Guiding Principles, which provide strategic insights for successful digital transformation. Additionally, Forrester's framework emphasizes enhancing customer experiences and modernizing IT infrastructure, while IDC's MaturityScape helps assess and develop organizational digital maturity. MIT's framework explores cutting-edge strategies for achieving digital success.
These materials are perfect for enhancing your business or classroom presentations, offering visual aids to supplement your insights. Please note that while comprehensive, these slides are intended as supplementary resources and may not be complete for standalone instructional purposes.
Frameworks/Models included:
Microsoft’s Digital Transformation Framework
McKinsey’s Ten Guiding Principles of Digital Transformation
Forrester’s Digital Transformation Framework
IDC’s Digital Transformation MaturityScape
MIT’s Digital Transformation Framework
Gartner’s Digital Transformation Framework
Accenture’s Digital Strategy & Enterprise Frameworks
Deloitte’s Digital Industrial Transformation Framework
Capgemini’s Digital Transformation Framework
PwC’s Digital Transformation Framework
Cisco’s Digital Transformation Framework
Cognizant’s Digital Transformation Framework
DXC Technology’s Digital Transformation Framework
The BCG Strategy Palette
McKinsey’s Digital Transformation Framework
Digital Transformation Compass
Four Levels of Digital Maturity
Design Thinking Framework
Business Model Canvas
Customer Journey Map
Discover timeless style with the 2022 Vintage Roman Numerals Men's Ring. Crafted from premium stainless steel, this 6mm wide ring embodies elegance and durability. Perfect as a gift, it seamlessly blends classic Roman numeral detailing with modern sophistication, making it an ideal accessory for any occasion.
https://rb.gy/usj1a2
At Techbox Square, in Singapore, we're not just creative web designers and developers, we're the driving force behind your brand identity. Contact us today.
Zodiac Signs and Food Preferences_ What Your Sign Says About Your Tastemy Pandit
Know what your zodiac sign says about your taste in food! Explore how the 12 zodiac signs influence your culinary preferences with insights from MyPandit. Dive into astrology and flavors!
[To download this presentation, visit:
https://www.oeconsulting.com.sg/training-presentations]
This PowerPoint compilation offers a comprehensive overview of 20 leading innovation management frameworks and methodologies, selected for their broad applicability across various industries and organizational contexts. These frameworks are valuable resources for a wide range of users, including business professionals, educators, and consultants.
Each framework is presented with visually engaging diagrams and templates, ensuring the content is both informative and appealing. While this compilation is thorough, please note that the slides are intended as supplementary resources and may not be sufficient for standalone instructional purposes.
This compilation is ideal for anyone looking to enhance their understanding of innovation management and drive meaningful change within their organization. Whether you aim to improve product development processes, enhance customer experiences, or drive digital transformation, these frameworks offer valuable insights and tools to help you achieve your goals.
INCLUDED FRAMEWORKS/MODELS:
1. Stanford’s Design Thinking
2. IDEO’s Human-Centered Design
3. Strategyzer’s Business Model Innovation
4. Lean Startup Methodology
5. Agile Innovation Framework
6. Doblin’s Ten Types of Innovation
7. McKinsey’s Three Horizons of Growth
8. Customer Journey Map
9. Christensen’s Disruptive Innovation Theory
10. Blue Ocean Strategy
11. Strategyn’s Jobs-To-Be-Done (JTBD) Framework with Job Map
12. Design Sprint Framework
13. The Double Diamond
14. Lean Six Sigma DMAIC
15. TRIZ Problem-Solving Framework
16. Edward de Bono’s Six Thinking Hats
17. Stage-Gate Model
18. Toyota’s Six Steps of Kaizen
19. Microsoft’s Digital Transformation Framework
20. Design for Six Sigma (DFSS)
To download this presentation, visit:
https://www.oeconsulting.com.sg/training-presentations
Easily Verify Compliance and Security with Binance KYCAny kyc Account
Use our simple KYC verification guide to make sure your Binance account is safe and compliant. Discover the fundamentals, appreciate the significance of KYC, and trade on one of the biggest cryptocurrency exchanges with confidence.
Navigating the world of forex trading can be challenging, especially for beginners. To help you make an informed decision, we have comprehensively compared the best forex brokers in India for 2024. This article, reviewed by Top Forex Brokers Review, will cover featured award winners, the best forex brokers, featured offers, the best copy trading platforms, the best forex brokers for beginners, the best MetaTrader brokers, and recently updated reviews. We will focus on FP Markets, Black Bull, EightCap, IC Markets, and Octa.