The document discusses a method for tailoring the depth of focus in optical imaging systems using a Fourier transform approach, which involves designing special pupil functions encoded on a liquid-crystal spatial light modulator (LCSLM). Experimental results demonstrate successful application of the theory, achieving significant improvements in the axial imaging capabilities of optical systems. The findings indicate that constructed complex pupil functions can effectively enhance optical system performance with extended depth of focus.
![April 1, 2007 / Vol. 32, No. 7 / OPTICS LETTERS 845
Consequently the axial electric field E u is pro-
portional to the Fourier transform Q u of the pupil
function q s expressed in s coordinates. For a rect-
angular pupil function, the electric field is a sinc
function in the u direction centered at the focal point
of the lens. As the pupil aperture a decreases, the fo-
cus broadens along the z axis. We can relate the u
and z dimensions by using u − u0 a2 z − f / 2 f 2 .
The initial results using the fast Fourier transform
(FFT) were good, but there were problems (such as
the Gibbs overshoot in the rectangle response func-
tions) because the pupil function is spatially limited
by the size of our LCSLM. Consequently we used an
iterative design procedure11,12 as outlined in Fig. 1 to
improve the results. Figure 1(a) shows the desired
output axial response function E u (a rectangle, for
example). We use discrete Fourier transforms having
N1 = 512 points (or samples) and define the axial re-
sponse function over a limited region of m points
(from u1 to u2). By performing the Fourier transform,
we obtain the complex transmission of the pupil q s
as shown in Fig. 1(b). We cannot use this entire dis-
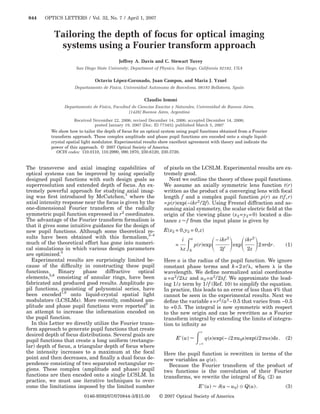
Fig. 2. Amplitude and phase distributions for functions
tribution because of the finite size of the LCSLM.
that give an axial response: (a), (b) rectangle having 9
Consequently we truncate the pupil function to N2 points; (c), (d) two 9-point rectangles separated by 21
= 256 points, where the regions outside the pupil points.
s1 – s2 are made equal to zero as shown in Fig. 1(c).
By inverse Fourier transformation we obtain the pupil function are difficult to encode onto the limited
axial distribution Q u in Fig. 1(d), and we find that pixel structure of the LCSLM.
it does not coincide with the desired one because of To demonstrate this approach, we designed several
the restrictions mentioned above. pupil functions. Figure 2 shows the amplitude and
To improve the results, we impose additional re- phase for pupil functions p r that yield a rectangular
strictions. In the region u1 – u2 we restore the origi- [Figs. 2(a) and 2(b)] and two-separated-rectangle
nally designed magnitude of the axial distribution. [Figs. 2(c) and 2(d)] axial response functions. Using
The axial phase distribution is used as a degree of the simple Fourier transform relation between the
freedom. Outside this region the magnitude is trun- widths of the rectangle and sinc functions, the axial
cated if it exceeds a given percent (5% for this ex- distance in z coordinates is related to the number of
ample) of the maximum magnitude in the region samples in the rectangle function as
u1 – u2 . Then a new axial distribution is obtained.
L = 2m f 2N2 / N1a2 . 4
We continued the process until the mean square er-
ror was 0.01 (in the case of the double rectangle, we The experimental setup is similar to that reported
were limited to a value of 0.1). Typically this required earlier.8 Linearly polarized light from an argon laser
about 1000 iterations. However, because of the effi- is spatially filtered, expanded, and collimated. The
ciency of the FFT algorithm, this typically required a pupil functions are encoded onto a parallel-aligned
few seconds. nematic LCSLM manufactured by Seiko Epson with
After this procedure is completed, the pupil func- 640 480 pixels having dimensions of 42 m on a
tion q s must be rescaled to the radial coordinates as 1.3 in. display.13 Each pixel acts as an electrically
p r . This rescaling spreads the central radial portion controllable phase plate where the total phase shift
and compresses the outer parts. This compression exceeds 2 rad as a function of gray level at the ar-
can create problems because fast oscillations in the gon laser wavelength of 514.5 nm. The light is fo-
cused by a 38.1 cm focal length Space Optics Re-
search Labs lens. Because the focal spot size from the
lens is extremely small, we magnify it with a 20 mi-
croscope objective lens. We fix the distance between
the microscope objective and the detector, and by
shifting the assembly (objective plus CCD camera)
along the axis, we measure the peak intensity in the
transverse plane at different axial distances.
Our LCSLM is easily capable of encoding the phase
information. Amplitude information is then encoded
onto this phase-only medium by spatially modulating
the phase pattern with the amplitude portion of the
Fig. 1. Iterative filter design. pupil function.14 As the phase depth increases, the in-](https://image.slidesharecdn.com/depthoffocuspdf-124691700418-phpapp01/85/Tailoring-the-depth-of-focus-for-optical-imaging-systems-using-a-Fourier-transform-approach-2-320.jpg)


![11.[23 36]quadrature radon transform for smoother tomographic reconstruction](https://cdn.slidesharecdn.com/ss_thumbnails/11-23-36quadratureradontransformforsmoothertomographicreconstruction-120512235621-phpapp01-thumbnail.jpg?width=640&height=640&fit=bounds)


