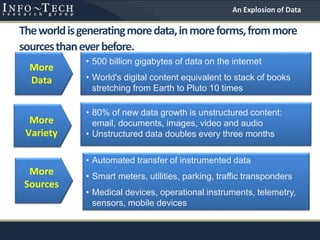
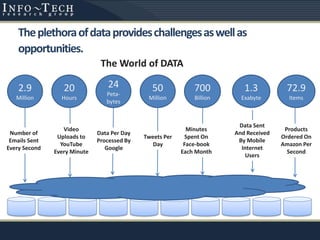
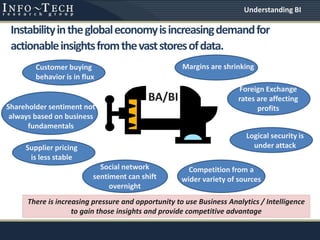
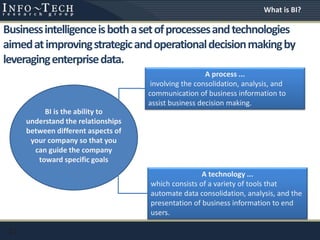
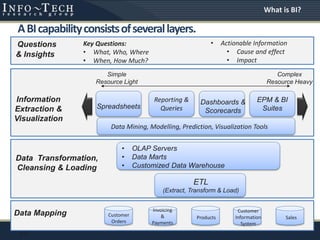
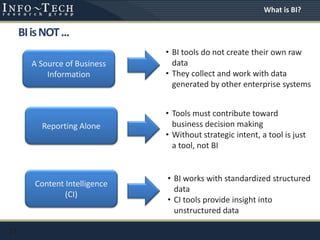
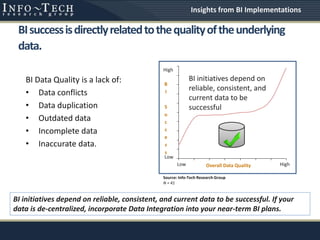
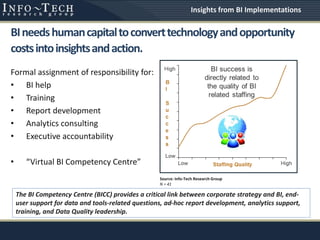
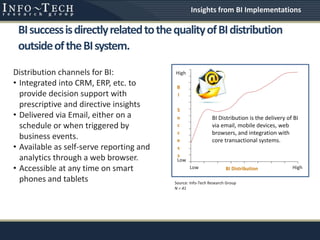
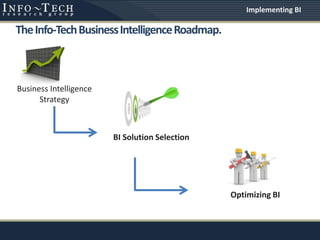
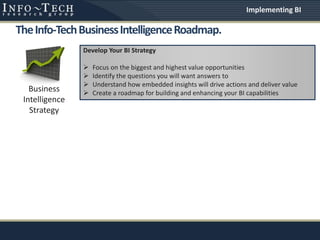
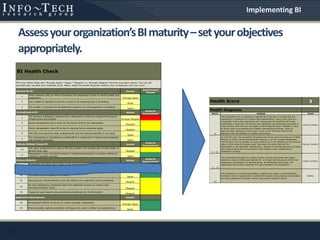
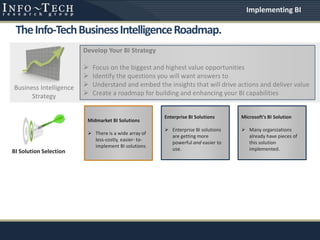
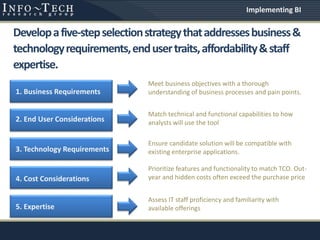
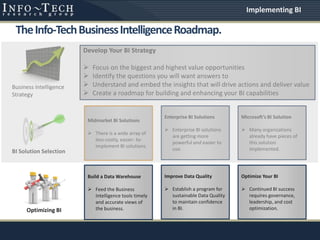
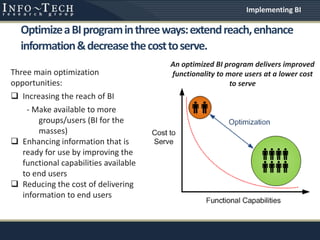
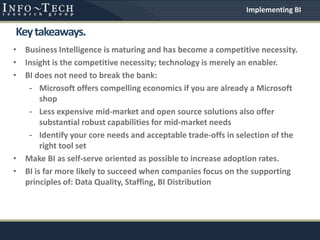
A Practical Guide: Building your Business Intelligence Business Case for 2017Sisense
So you’ve decided you want to jump on the data analytics bandwagon and propel your company into the 21st century with better analytics, reporting and data visualization. But to get a BI project rolling you usually need the entire organization, or at the very least the entire department, to get on board. Since embarking on a BI initiative requires an investment of time and resources, convincing the relevant people in the company to take the leap is imperative. You’ll need to construct a solid business case, defend your budget request and prove the value BI can bring to your organization.
In this Slideshare you’ll discover:
- Why organizations need to invest in BI to begin with
- How are organization deriving value from BI
- How to build an internal business case for investing in BI
- What are the intricacies of how to build a budget
- How to drive your company to a purchasing decision
- How to start realizing value from BI now
Big Data in Financial Services: How to Improve Performance with Data-Driven D...Perficient, Inc.
Most banking and financial services organizations have only scratched the surface of leveraging customer data to transform their business, realize new revenue opportunities, manage risk and address customer loyalty. Yet a business’s digital footprint continues to evolve as automated payments, location-based purchases, and unstructured customer communications continue to influence the technology landscape for financial services.
Financial Markets Data & Analytics Led TransformationGianpaolo Zampol
How big data, advanced analytics and cognitive computing is disrupting traditional business and operating models in financial markets? New competitors, powered by social, mobile, analytics, and cloud computing, are making new business models emerging rapidly. Wealth Management, Corporate Banking and Transaction Banking & Payments are significant sources of growth in Financial Markets. How take advantage from those new technologies to face this new scenario?
Big Data Journeys: Review of roadmaps taken by early adopters to achieve thei...Krishnan Parasuraman
Implementing a Big Data program can be a long and arduous journey. Each organization has its own unique business drivers and technical considerations that drive their big data adoption roadmaps. Whatever be your organization's specific big data driver - be it managing a rapid surge of data, implementing a new set of analytic capabilities, incorporating unstructured data as part of your enterprise data platform or accessing real time information for actionable intelligence - the approach and roadmap that you put in place to reach that end goal becomes all the more critical in a space where early success stories are relatively rare, skill sets are hard to find and technologies are still evolving.
In this session we will chronicle the journeys of four different organizations that were early adopters of big data. Each of them charted a different path to achieve their big data goals. We will look at what were the key drivers behind their respective approaches, what worked and what did not work for them.
Crunching “Big Data” to Drive 2012 Revenue Growth: The 5 Myths of Sales & Mar...MarketBridge
The amount of data created last year could fill 75 billion fully loaded 16GB iPads which, if stacked on top of one another, would reach 339 miles into the air. The exponential growth of customer data means deep Sales and Marketing analytics are more than just an opportunity for improvement.
Increasingly, basic Sales and Marketing performance reporting has become a competitive necessity for companies just to maintain market position.
This presentation discusses the myths and "barriers" to creating powerful Sales
and Marketing analytics that can help you:
- Target your best customers
- Optimize marketing spend
- Increase sales conversions
- Improve retention and up-sell rates
Business intelligence for SMEs with Data AnalyticsTzar Umang
Know the importance of Data on your business, how it can shape up your Business Operations and day to day decision making from a narrative representation of your Data.
Big data is a phenomenon brought about by rapid data growth, complex, new, and changing data types, and parallel technology advancements; it brings huge possibilities. By optimizing these enormous amounts of structured and unstructured data, CSPs are in a unique position to capture these opportunities and create new revenue streams.
D2 d turning information into a competive asset - 23 jan 2014Henk van Roekel
Understanding the evolution of Business Intelligence and Analytics and the challenges and opportunities that come with it. Exploring CGI's Data2Diamonds™ approach ensuring financial sound, technical viable and socially desirable Big Data initiatives.
Using Power BI To Improve Media Buying & Ad PerformanceGramener
Gramener's Senior Lead Data Consultant, Sidharth Parameswaran, and Navya Sri Channamsetty, Gramener's Associate Lead Data Science Engineer conducted this joint webinar session.
Pain points discussed:
-Actual vs. planned results of a campaign
-Competitor Evaluation & Comparison
-Modeling of Media Mix
-Metrics assessed across the Agency, Client, and Brand levels
- Genre/Channel Performance Evaluation
Things you will learn:
1. Power BI may be used in a variety of ways to investigate findings.
2. Various dashboards would be used to analyze ad/program performance.
3. How can you help your clients obtain higher ROI and acquire a competitive advantage?
Do join us if you are a:
Power BI Developer, Media buyer, Campaign Manager, Brand Manager, Consultant, etc.
To watch this webinar visit: https://info.gramener.com/power-bi-media-buying-ad-performance
Learn more about Gramener: https://gramener.com/
Beyond the Classroom consists of events, workshops and presentations meant to introduce Computer Science students to learning opportunities in addition to their regular classroom experiences. Beyond the Classroom events are free and open to all NHCC CSci students.
This presentation is about Big Data, how it changes the traditional data landscape, how different companies are using it, and which skills are in demand.
As firms move from siloed, transaction-oriented systems to more integrated,
socially aware ones, they will face challenges related to customer data. “Big data”
is characterized by increases in data volume, velocity, variety, and variability. To
improve customer engagement, companies must invest in solutions to effectively
manage big data.
Big Data: Real-life examples of Business Value Generation with ClouderaCapgemini
Capgemini has helped multiple organizations to put Big Data to work and create value for their business and their clients.
This prsentation looks at real-world cases of how organizations are using, or planning to use, big data technology. It will look at the different ways in which the technology is being used in a business context.
Examples are drawn from Retail, Telco, Financial Services, Public Sector and Consumer goods.
It will look at a range of business scenarios from simple cost reduction through to new business models looking at how the business case has been built and what value has been realized.
It will also look at some of the practical challenges and approaches taken and specifically the application of Enterprise Data Hubs in collaboration with its prime partner Cloudera.
Written by Richard Brown, Global Programme Leader, Big Data & Analytics, Capgemini
What is business intelligence and where it is applicable is described in this presentation. The subject is offered as elective to BE IT students of Pune University.
Business Intelligence, Portals, Dashboards and Operational Matrix with ShareP...Optimus BT
Key areas of growth in Business Intelligence with SharePoint | Optimus BT
The business environment has driven organizations to view BI as more than technology with strategy, end user adoption, collaboration, real time predictions, pervasive deployments, and mobile adoptions that allows for intelligent business decision making process while keeping cost and IT expertise at the forefront.
This presentation provides an overview of current state of Business Intelligence, portals and dashboards has been deployed enterprise wide, challenges in the existing deployments and how Business Intelligence can be scaled up to the end users in terms of cross organizational collaboration, business initiatives, data availability, user acceptance and data source integration. Even more, this presentation talks about the trends that drive BI which includes but not limited to predictive & real time analysis, Mobile Business Intelligence and Social BI within the process framework, Social Media Analytics, Self Service BI. Towards the later part of the presentation we talk about the vision of a BI solution to meet business initiatives, and how SharePoint 2010 will be a clear winner in terms of how various platforms stack up. There are few real implementation screens illustrated towards the end w.r.t Sales, financial and decision making portal dashboards.
Optimus BT provides end to end SharePoint Business Intelligence Software Consulting and solution implementation services. Using SQL server integration capabilities and SharePoint excel services our BI solutions bring analytics from data warehouse systems into an intuitive dashboard which helps real time reporting with self service tools. Learn more @ www.optimusbt.com/sharepoint_business_intelligence
Business Intelligence In Cyber Security | Cyberroot Risk AdvisoryCR Group
The business world has changed a lot over years with invasion of internet. Along with change of business, come the risk factors as well. When the course of business functionality has changed, the code of conduct has changed along with as well.
how i managed to Develop a Analytics story for services about 4 years back. Contains
Maturity Model, Business Potential, Services Structures Areas that analytics can be applied to
20150108 create time stamp
Benchmarking Digital Readiness: Moving at the Speed of the MarketApigee | Google Cloud
Moving at the new speed of the market: benchmarking your digital readiness with real-world data
Companies are under pressure to move at the speed of digital natives. Benchmark your organization against empirical data and real-world case studies to see where you stand and what you can do to jumpstart your digital readiness.
Business Intellenge (BI),BI PresentationVivek Kumar
Business Intelligence in Changing Market Trends.
Business Intelligence (BI) refers to skills, processes, technologies, applications and practices used to support decision making.
Business Intelligence in Changing Market Trends.
Business Intelligence (BI) refers to skills, processes, technologies, applications and practices used to support decision making.
One of the key concerns of the information age is the proliferation of data. Businesses need to intelligently use this data in order to gain an edge over competition.
Big Data, Big Thinking: Untapped OpportunitiesSAP Technology
In this webinar factsheet, SAP’s Rohit Nagarajan and Suni Verma from Ernst & Young explore Big Data in India, adoption patterns across the globe, and how you can embark on your own Big Data journey.
Microsoft er en data-drevet organisation, og finance spiller en vigtig rolle ift dette. Data-indsigt er en forudsætning for en transparant forretning og for transformation. Hør Microsofts CFO’s syn på sagen og se en demo af de spændende muligheder med Power BI og visualisering.
George Tsichlis, CFO og Lars Bo Granath, Produktchef for Data Platform, Microsoft Danmark
The demand for BI continues to grow, and while there's no question that analytics brings value, there is often uncertainty about how BI initiatives will deliver bottom-line benefits. Your business case for BI should prove ROI, but this is not always a straightforward process.
Turning Big Data into Better Business OutcomesCisco Canada
The big data era is upon us as organizations are awash in social, mobile and machine-generated data. Opportunity abounds. But competition threatens. Further this high volume, data-at-the-edge environment challenges centralized data warehouse approaches typical with BI and Analytics today. Data virtualization provides a more agile, leave-the-data-where-it-lies way to fulfill BI and Analytic needs and achieve key business outcomes.
Levelwise PageRank with Loop-Based Dead End Handling Strategy : SHORT REPORT ...Subhajit Sahu
Abstract — Levelwise PageRank is an alternative method of PageRank computation which decomposes the input graph into a directed acyclic block-graph of strongly connected components, and processes them in topological order, one level at a time. This enables calculation for ranks in a distributed fashion without per-iteration communication, unlike the standard method where all vertices are processed in each iteration. It however comes with a precondition of the absence of dead ends in the input graph. Here, the native non-distributed performance of Levelwise PageRank was compared against Monolithic PageRank on a CPU as well as a GPU. To ensure a fair comparison, Monolithic PageRank was also performed on a graph where vertices were split by components. Results indicate that Levelwise PageRank is about as fast as Monolithic PageRank on the CPU, but quite a bit slower on the GPU. Slowdown on the GPU is likely caused by a large submission of small workloads, and expected to be non-issue when the computation is performed on massive graphs.
As Europe's leading economic powerhouse and the fourth-largest hashtag#economy globally, Germany stands at the forefront of innovation and industrial might. Renowned for its precision engineering and high-tech sectors, Germany's economic structure is heavily supported by a robust service industry, accounting for approximately 68% of its GDP. This economic clout and strategic geopolitical stance position Germany as a focal point in the global cyber threat landscape.
In the face of escalating global tensions, particularly those emanating from geopolitical disputes with nations like hashtag#Russia and hashtag#China, hashtag#Germany has witnessed a significant uptick in targeted cyber operations. Our analysis indicates a marked increase in hashtag#cyberattack sophistication aimed at critical infrastructure and key industrial sectors. These attacks range from ransomware campaigns to hashtag#AdvancedPersistentThreats (hashtag#APTs), threatening national security and business integrity.
🔑 Key findings include:
🔍 Increased frequency and complexity of cyber threats.
🔍 Escalation of state-sponsored and criminally motivated cyber operations.
🔍 Active dark web exchanges of malicious tools and tactics.
Our comprehensive report delves into these challenges, using a blend of open-source and proprietary data collection techniques. By monitoring activity on critical networks and analyzing attack patterns, our team provides a detailed overview of the threats facing German entities.
This report aims to equip stakeholders across public and private sectors with the knowledge to enhance their defensive strategies, reduce exposure to cyber risks, and reinforce Germany's resilience against cyber threats.
Adjusting primitives for graph : SHORT REPORT / NOTESSubhajit Sahu
Graph algorithms, like PageRank Compressed Sparse Row (CSR) is an adjacency-list based graph representation that is
Multiply with different modes (map)
1. Performance of sequential execution based vs OpenMP based vector multiply.
2. Comparing various launch configs for CUDA based vector multiply.
Sum with different storage types (reduce)
1. Performance of vector element sum using float vs bfloat16 as the storage type.
Sum with different modes (reduce)
1. Performance of sequential execution based vs OpenMP based vector element sum.
2. Performance of memcpy vs in-place based CUDA based vector element sum.
3. Comparing various launch configs for CUDA based vector element sum (memcpy).
4. Comparing various launch configs for CUDA based vector element sum (in-place).
Sum with in-place strategies of CUDA mode (reduce)
1. Comparing various launch configs for CUDA based vector element sum (in-place).
Data Centers - Striving Within A Narrow Range - Research Report - MCG - May 2...pchutichetpong
M Capital Group (“MCG”) expects to see demand and the changing evolution of supply, facilitated through institutional investment rotation out of offices and into work from home (“WFH”), while the ever-expanding need for data storage as global internet usage expands, with experts predicting 5.3 billion users by 2023. These market factors will be underpinned by technological changes, such as progressing cloud services and edge sites, allowing the industry to see strong expected annual growth of 13% over the next 4 years.
Whilst competitive headwinds remain, represented through the recent second bankruptcy filing of Sungard, which blames “COVID-19 and other macroeconomic trends including delayed customer spending decisions, insourcing and reductions in IT spending, energy inflation and reduction in demand for certain services”, the industry has seen key adjustments, where MCG believes that engineering cost management and technological innovation will be paramount to success.
MCG reports that the more favorable market conditions expected over the next few years, helped by the winding down of pandemic restrictions and a hybrid working environment will be driving market momentum forward. The continuous injection of capital by alternative investment firms, as well as the growing infrastructural investment from cloud service providers and social media companies, whose revenues are expected to grow over 3.6x larger by value in 2026, will likely help propel center provision and innovation. These factors paint a promising picture for the industry players that offset rising input costs and adapt to new technologies.
According to M Capital Group: “Specifically, the long-term cost-saving opportunities available from the rise of remote managing will likely aid value growth for the industry. Through margin optimization and further availability of capital for reinvestment, strong players will maintain their competitive foothold, while weaker players exit the market to balance supply and demand.”
2. • Info-Tech Research Group
- Practical IT Research and advice for:
» Small and mid-market enterprises
» Broader public sector
» Technology leaders in large organizations
- Syndicated and Custom Research
» 20,000 surveys and interviews conducted
» Buyer and ecosystem behaviour
- Demand generation and lead nurturing
» Licensed content
» Custom campaigns
Presenter • Jamal S. Shah
Managing Director
Info-Tech Indaba
Who We Are
3. Today’sTopics.
Understanding Business Intelligence
How BI is Evolving
Insights from Experience of BI Implementations
Implementing BI in Mid-market Enterprises
3
4. 4
More
Variety
• 500 billion gigabytes of data on the internet
• World's digital content equivalent to stack of books
stretching from Earth to Pluto 10 times
• 80% of new data growth is unstructured content:
email, documents, images, video and audio
• Unstructured data doubles every three months
• Automated transfer of instrumented data
• Smart meters, utilities, parking, traffic transponders
• Medical devices, operational instruments, telemetry,
sensors, mobile devices
An Explosion of Data
More
Sources
More
Data
Theworldisgeneratingmoredata,inmoreforms,frommore
sourcesthaneverbefore.
6. Instabilityintheglobaleconomyisincreasingdemandfor
actionableinsightsfromthevaststoresofdata.
Supplier pricing
is less stable
Customer buying
behavior is in flux
Competition from a
wider variety of sources
Margins are shrinking
Foreign Exchange
rates are affecting
profitsShareholder sentiment not
always based on business
fundamentals
Social network
sentiment can shift
overnight
Logical security is
under attack
BA/BI
There is increasing pressure and opportunity to use Business Analytics / Intelligence
to gain those insights and provide competitive advantage
Understanding BI
7. Single version
of the truth
Actionable decisions based on facts
Reducing staff
turnover
Servicing
customers on
time
Informing
sales
opportunities
BusinessIntelligenceisaboutinsights,nottechnology.
Insights
based on
facts vs.
``hunches``
Near real-
time decision
making
Understanding BI
8. Organizationslargeandsmallarealreadycreatingbusinessvalue
throughinsightsfromthisdata.
8
Organization Distinctive
Capability
Value Delivered
Macy’s Going Local $1bn revenue impact?
Harrah’s Casinos Customer and
Loyalty Service
Increased market share from 36% to 43% between
1998 to 2004
Netflix Customer
Preferences
Analytics
Revenue increase from $5million in 1999 to
$1.7billion in 2009
Marriott Hotels Revenue
Management
Actual revenue as percent of optimal rates increased
from 83% to 91%
Blue Mountain
Resort
Supply Chain and
Yield Management
1,822% ROI by eliminating excess inventory, improved
reporting, more strategic pricing decisions
Understanding BI
9. 0
1
2
3
4
5
6
9:00 AM 11:24 AM 1:48 PM 4:12 PM 6:36 PM 9:00 PM
Retail traffic during summer hours
# of shoppers
Data:
Weekly Avg.
Information:Insights:
Understanding BI
10. BusinessIntelligenceisaboutinsights.
Effort manual effort required
Role displays database content
Data Currency static
Data Quality bring your own rigor
Confidence the value ‘seems’ obvious
Scope point in time
Intent informational content
InsightData
Understanding BI
12. ABIcapabilityconsistsofseverallayers.
12
& Insights
Information
Extraction &
Visualization
Data Transformation,
Cleansing & Loading
Data Mapping
Reporting &
QueriesSpreadsheets
ETL
(Extract, Transform & Load)
• OLAP Servers
• Data Marts
• Customized Data Warehouse
Dashboards &
Scorecards
Complex
Resource Heavy
Simple
Resource Light
EPM & BI
Suites
Data Mining, Modelling, Prediction, Visualization Tools
• Actionable Information
• Cause and effect
• Impact
What is BI?
Customer
Orders
Invoicing
&
Payments
Products
Customer
Information
System
Sales
Questions Key Questions:
• What, Who, Where
• When, How Much?
13. BIisNOT...
13
A Source of Business
Information
Reporting Alone
Content Intelligence
(CI)
• BI tools do not create their own raw
data
• They collect and work with data
generated by other enterprise systems
• Tools must contribute toward
business decision making
• Without strategic intent, a tool is just
a tool, not BI
• BI works with standardized structured
data
• CI tools provide insight into
unstructured data
What is BI?
14. Today’sTopics.
Understanding Business Intelligence
How BI is Evolving
Insights from Experience of BI Implementations
Implementing BI in Mid-market Enterprises
14
16. BIcanbedeployedfasterandeasierthanever,thankstoBI
appliancesandSaaSoptions.
Appliances SaaS BI
- BI delivered via Software-as-a-Service
(SaaS) and Data-as-a-Service (DaaS)
-Reduced capital cost requirements
-Compressed deployment timelines
-Faster to Implement
IBM
SAS
SAP
QlikView
Birst
Jaspersoft
- Preconfigured hardware, data
warehouse, and software bundles
that reduce BI deployment costs and
timelines
IB WebFOCUS + Terradata
HP / Microsoft BI -SQL Server, SharePoint
IBM Netezza include petabyte-scale options
SAP – BI Accelerator
How BI is Evolving
18. HowwemeasuresuccessofBI implementationshaschanged.
BI technologies and practices have
matured in recent years. Rather
than trying to force adoption,
businesses are focusing on the
underlying drivers: Data Quality,
Staffing, and Distribution
Two years ago, BI success came
from a vague notion of adoption
Today, the success of BI is
measured by how well it drives
decision-making
How BI is Evolving
Business
Insights
19. Today’sTopics.
Understanding Business Intelligence
How BI is Evolving
Insights from Experience of BI Implementations
Implementing BI in Mid-market Enterprises
19
20. Smallandmid-sizedorganizationsfacedifferentchallenges
thantheirlargercounterparts.
• Limited IT resources
• None or few dedicated
business analysts
• Complex and expensive stack
solutions out of range
• Multiple un-integrated data
sources
Cost Effective:
Self-service reporting
Data visualization
Data management
ETL / Data integration
Granular security
Facilitated data management
“Leading practice” processes
Less complexity
Mid-Market Organization Challenges Mid-Market BI Needs
Insights from BI Implementations
23. Source: Info-Tech Research Group
N = 41
BIsuccessisdirectlyrelatedtothequalityoftheunderlying
data.
BI Data Quality is a lack of:
• Data conflicts
• Data duplication
• Outdated data
• Incomplete data
• Inaccurate data.
Overall Data QualityLow
Low
High
High
B
I
S
u
c
c
e
s
s
BI initiatives depend on
reliable, consistent, and
current data to be
successful
BI initiatives depend on reliable, consistent, and current data to be successful. If your
data is de-centralized, incorporate Data Integration into your near-term BI plans.
Insights from BI Implementations
24. Source: Info-Tech Research Group
N = 41
BIneedshumancapitaltoconverttechnologyandopportunity
costsintoinsightsandaction.
Formal assignment of responsibility for:
• BI help
• Training
• Report development
• Analytics consulting
• Executive accountability
• “Virtual BI Competency Centre”
The BI Competency Centre (BICC) provides a critical link between corporate strategy and BI, end-
user support for data and tools-related questions, ad-hoc report development, analytics support,
training, and Data Quality leadership.
Insights from BI Implementations
25. BIsuccessisdirectlyrelatedtothequalityofBIdistribution
outsideoftheBIsystem.
BI DistributionLow
Low
High
High
B
I
S
u
c
c
e
s
s
Source: Info-Tech Research Group
N = 41
BI Distribution is the delivery of BI
via email, mobile devices, web
browsers, and integration with
core transactional systems.
Distribution channels for BI:
• Integrated into CRM, ERP, etc. to
provide decision support with
prescriptive and directive insights
• Delivered via Email, either on a
schedule or when triggered by
business events.
• Available as self-serve reporting and
analytics through a web browser.
• Accessible at any time on smart
phones and tablets
Insights from BI Implementations
26. Today’sTopics.
Understanding Business Intelligence
How BI is Evolving
Insights from Experience of BI Implementations
Implementing BI in Mid-market Enterprises
29
28. TheInfo-TechBusinessIntelligenceRoadmap.
Business
Intelligence
Strategy
Develop Your BI Strategy
Focus on the biggest and highest value opportunities
Identify the questions you will want answers to
Understand how embedded insights will drive actions and deliver value
Create a roadmap for building and enhancing your BI capabilities
Implementing BI
29. Assessyourorganization’sBImaturity–setyourobjectives
appropriately.
32
Answer
Improvement
Needed
1
Other business units (or lines of business) are requesting access to the BI toolset and
applications. Strongly Agree
3 The number of requests for ad hoc access to BI reporting tools is increasing.
Agree
4 The number of requests for BI application projects for work programs is increasing.
Agree
Answer
Areas for
Improvement
5
The business intelligence program has a dedicated (continuous) budget/financing for
infrastructure and support. Strongly Disagree
6 Senior management has a vision for the future of BI in the organization.
Disagree
7 Senior management views BI as key to meeting future enterprise goals.
Disagree
8 The CEO and executive body understand BI and the business benefits it can bring.
Agree
9
The organization is attempting to embed BI as a component of regular work programs
and business processes. Agree
Answer
Areas for
Improvement
10
End users understand the value of BI and consider it an integral part of their ability to
perform their jobs. Disagree
11
Management views information based or analytical approaches to decision making as
critical to business success. Agree
Answer
Areas for
Improvement
12
Repeatable processes are in place in the functional areas that have been targeted for
BI support. Agree
Fill in the Yellow Fields with "Strongly Agree," "Agree," "Disagree," or "Strongly Disagree" from the drop down menus. The tool will
automatically calculate your readiness score. Below, follow the Health Diagnosis analysis that corresponds with your score.
Process Maturity
BI Health Check
Demand for BI
Commitment to BI
Culture/Attitude Toward BI
29
Processes are in place for metadata management to assist users with understanding
how data applies to the business. Agree
30
Sufficient staff are in place to implement, support, and maintain any new BI
deployments. Agree
Answer
Areas for
Improvement
31 End users are involved in the planning process for new deployments.
Agree
32 User acceptance testing is done prior to each major rollout.
Agree
33
IT follows up with end users after the initial deployment to ensure end users are
satisfied with the BI tool.
Agree
Answer
Areas for
Improvement
34 BI is mentioned in the enterprise’s strategic plan.
Disagree
35 The BI program is tightly integrated with business programs and objectives/goals.
Disagree
36
Planning for BI is a collaborative effort that is driven by the business and supported by
IT. Strongly Disagree
Answer
Areas for
Improvement
37 "Turf wars” over BI ownership have been addressed and rectified.
Disagree
38 Data accuracy and integrity procedures have been put in place.
Disagree
39
The data for new BI report/application requests can normally be found in source
systems. Agree
40 End users trust the quality of the data.
Agree
41 Data sources, transformations, and calculations are understood and documented.
Disagree
42
We have experience integrating data from disparate sources to create cross-
functional business views. Disagree
43 Frequently used reports are generated automatically by the BI system.
Disagree
Answer
44 Development efforts for BI aim to create reusable components.
Strongly Agree
45 Where possible, agile development techniques are used to deliver new applications.
Agree
Application Development
Change Management
Business/IT Alignment
Data Management
3
Score Analysis Score
<0
The enterprise is not in a position to optimize BI at this time. It is likely that the
organization is suffering from a failed initial implementation. Ensure that there is a
commitment to BI in the organization and communicate the benefits of BI to key
stakeholders. Ensure that the business has repeatable and measurable processes in
those business units that are the target of the BI implementation. Establish a vision
for BI but build an incremental and scalable implementation strategy. Start by
improving basic reporting in those areas. Focus on the remaining areas in this
diagnostic that are identified as needing improvement.
Critical Condition
0 - 10
Up until this point, the enterprise's BI program has found some successes but is likely
affected by issues around organizational resistance, such as change management.
The BI toolset may be working as a point solution but is not delivering on its potential
value to other areas of business need. Reevaluate the areas indicated for
improvement in the diagnostic questionnaire. Attempt to leverage previous successes
and communicate those to the business while building a more comprehensive
optimization strategy.
Serious Condition
11 - 34
The enterprise's BI program is in good condition but has some areas that require
attention in order to effectively optimize BI. It is likely that the growth of BI in the
organization has flatlined or is growing slowly. By addressing these issues, the
organization will be able to maximize the value provided by BI investments.
Stable Condition
>35
The enterprise is in an extremely healthy condition with respect to BI optimization.
Continue to look for opportunities to embed BI in regular work programs and transition
the entire organization towards a metrics and analysis business culture.
Healthy
Health Score
Health Diagnosis
Implementing BI
30. Develop Your BI Strategy
Focus on the biggest and highest value opportunities
Identify the questions you will want answers to
Understand and embed the insights that will drive actions and deliver value
Create a roadmap for building and enhancing your BI capabilities
TheInfo-TechBusinessIntelligenceRoadmap.
Business Intelligence
Strategy
BI Solution Selection
Midmarket BI Solutions
There is a wide array of
less-costly, easier- to-
implement BI solutions.
Microsoft’s BI Solution
Many organizations
already have pieces of
this solution
implemented.
Enterprise BI Solutions
Enterprise BI solutions
are getting more
powerful and easier to
use.
Implementing BI
31. Developafive-stepselectionstrategythataddressesbusiness&
technologyrequirements,endusertraits,affordability&staff
expertise.
1. Business Requirements
2. End User Considerations
3. Technology Requirements
4. Cost Considerations
5. Expertise
Meet business objectives with a thorough
understanding of business processes and pain points.
Match technical and functional capabilities to how
analysts will use the tool
Ensure candidate solution will be compatible with
existing enterprise applications.
Prioritize features and functionality to match TCO. Out-
year and hidden costs often exceed the purchase price
Assess IT staff proficiency and familiarity with
available offerings
Implementing BI
32. Develop Your BI Strategy
Focus on the biggest and highest value opportunities
Identify the questions you will want answers to
Understand and embed the insights that will drive actions and deliver value
Create a roadmap for building and enhancing your BI capabilities
TheInfo-TechBusinessIntelligenceRoadmap.
Business Intelligence
Strategy
BI Solution Selection
Optimizing BI
Midmarket BI Solutions
There is a wide array of
less-costly, easier- to-
implement BI solutions.
Microsoft’s BI Solution
Many organizations
already have pieces of
this solution
implemented.
Enterprise BI Solutions
Enterprise BI solutions
are getting more
powerful and easier to
use.
Build a Data Warehouse
Feed the Business
Intelligence tools timely
and accurate views of
the business.
Optimize Your BI
Continued BI success
requires governance,
leadership, and cost
optimization.
Improve Data Quality
Establish a program for
sustainable Data Quality
to maintain confidence
in BI.
Implementing BI
33. OptimizeaBIprograminthreeways:extendreach,enhance
information&decreasethecosttoserve.
An optimized BI program delivers improved
functionality to more users at a lower cost
to serve
Three main optimization
opportunities:
Increasing the reach of BI
- Make available to more
groups/users (BI for the
masses)
Enhancing information that is
ready for use by improving the
functional capabilities available
to end users
Reducing the cost of delivering
information to end users
Implementing BI
34. • Business Intelligence is maturing and has become a competitive necessity.
• Insight is the competitive necessity; technology is merely an enabler.
• BI does not need to break the bank:
- Microsoft offers compelling economics if you are already a Microsoft
shop
- Less expensive mid-market and open source solutions also offer
substantial robust capabilities for mid-market needs
- Identify your core needs and acceptable trade-offs in selection of the
right tool set
• Make BI as self-serve oriented as possible to increase adoption rates.
• BI is far more likely to succeed when companies focus on the supporting
principles of: Data Quality, Staffing, BI Distribution
Keytakeaways.
Implementing BI
36. Traditional Approach Cost Effective Alternative
Reporting
and Analysis
Dedicated tools for basis reporting,
analysis, dash-boarding
Approx. $500 per seat
Use existing Microsoft Excel features
-Pivot tables
-Data visualization
Approx. $229 per seat
Data Mining
and OLAP
Specialized, dedicated tools for
multi-dimensional analysis and data
mining
Approx. $800 per named user
Existing SQL Server Analysis Services:
- OLAP
-Data Mining
Approx. $6,000 per processor
BI Suites
COTS packages, IBM Cognos,
Oracle, QlikView, Microstrategy
Approx. $100k to $500k
Use Open source software
-Pentaho
-JasperSoft
Approx. $10k to $15k per year
Data
Warehousing
Customized data warehouse
Price: varies greatly depending on
implementation; often in $millions
Mid-market data W/H appliance
-Netezza
-Sun Microsystems Greenplum
-Dataupia
Approx. $20,000 to $50,000