Download as PDF, PPTX
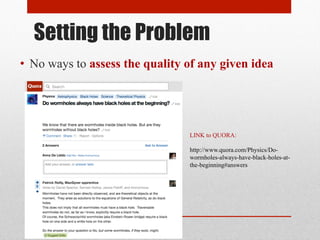
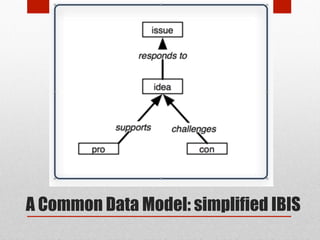
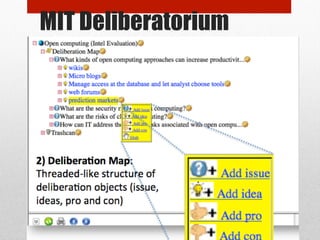
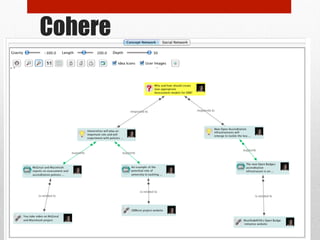
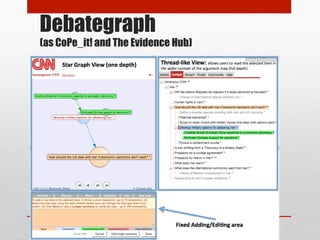
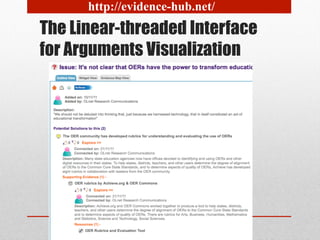
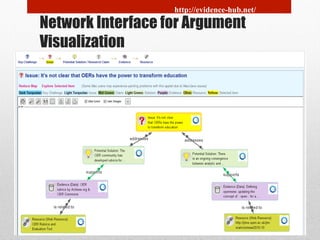
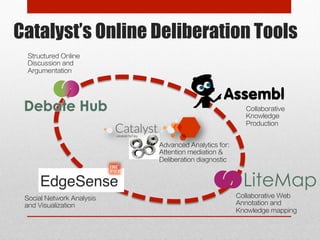


The document presents research on the effectiveness of network versus threaded interfaces for online deliberation, emphasizing issues with traditional chronological formats that hinder idea evaluation and participation. The exploratory study finds that network visualizations improve users' understanding of complex arguments, enhance task performance, and evoke positive emotional responses compared to linear interfaces. Ultimately, it suggests that dynamic network visualizations could enrich online discourse by providing better structural insights into argumentation.


![How Big Brands are Taking Your Traffic in Alberta [Data Inside].pptx](https://cdn.slidesharecdn.com/ss_thumbnails/howbigbrandsaretakingyourtrafficinalbertadatainside-260123180142-42d276f3-thumbnail.jpg?width=640&height=640&fit=bounds)
