Download as PDF, PPTX


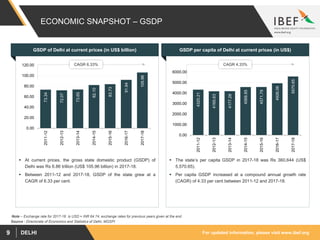
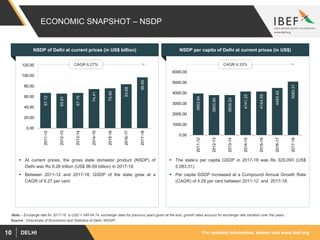
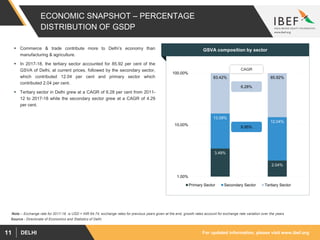
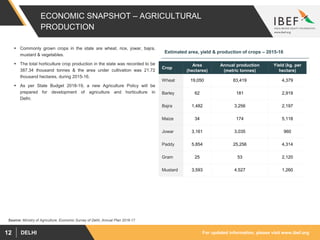


Delhi has a strong and growing economy, with its gross state domestic product increasing at a compound annual growth rate of 6.33% between 2011-12 and 2017-18. The tertiary sector is the largest contributor to Delhi's economy, accounting for 85.92% of the gross state value added in 2017-18. Agriculture plays a small but important role in Delhi's economy, with the main crops grown being wheat, rice, jowar, bajra, mustard and vegetables. The state government is focusing on further developing the agriculture and horticulture sectors through initiatives such as a new Agriculture Policy.


