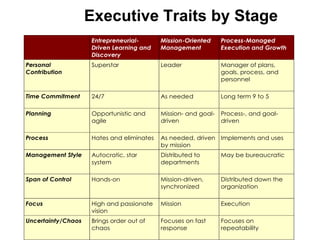
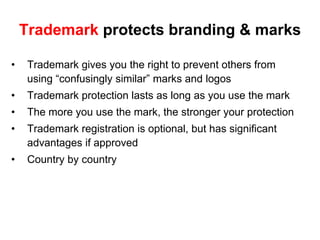
Downloaded 231 times


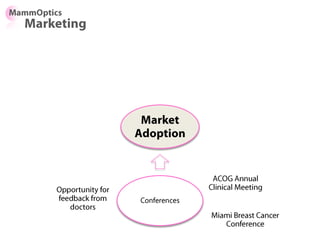


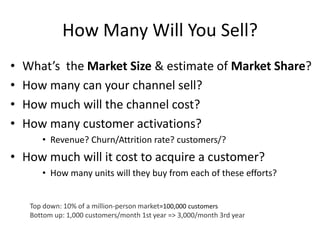


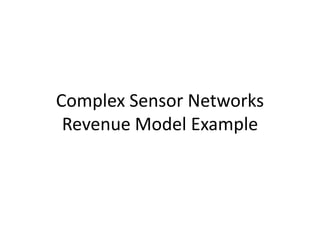
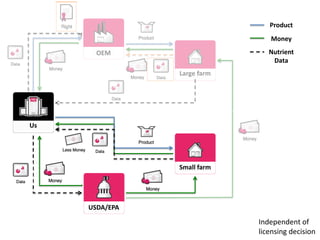
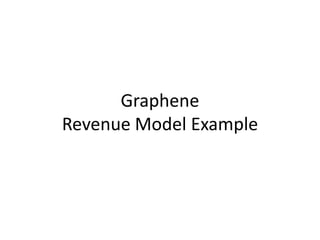
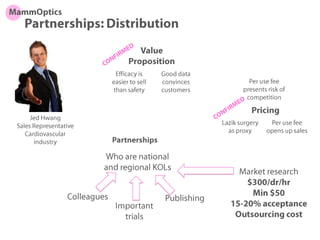
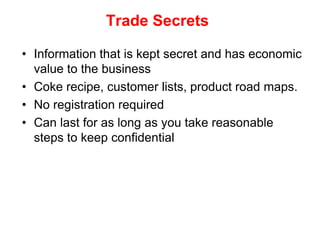
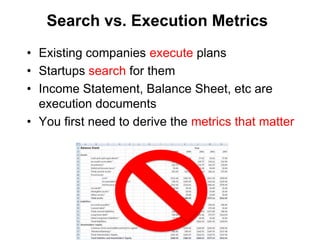
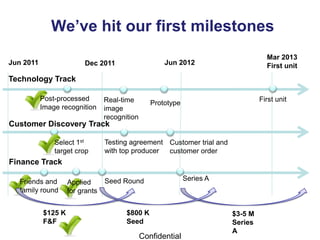
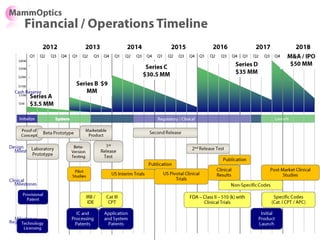
![Soft product launch projected for Q1-Q2 2012
General launch projected for Q4 2012
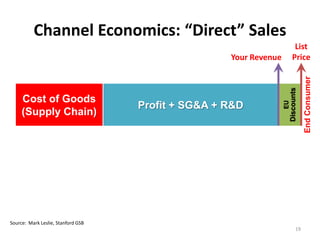
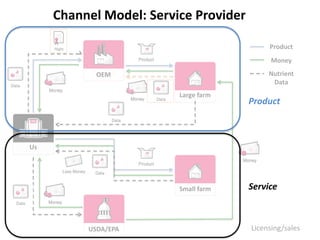
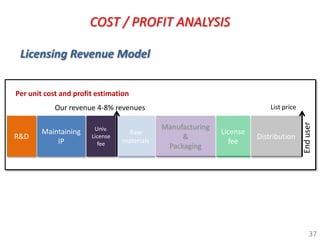
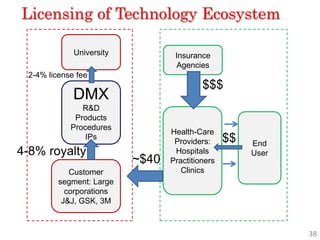
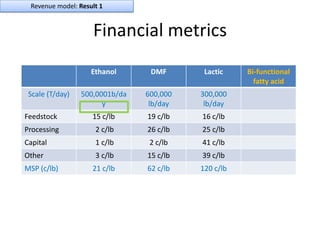
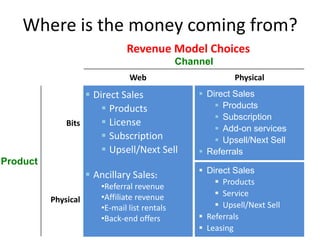
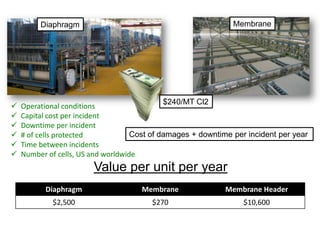
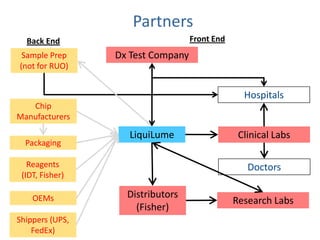
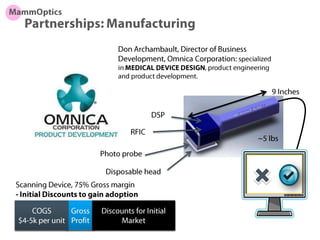
Diaphragm Membrane Membrane Header
$2,500 $270 $10,600
Year Type % Revenue [/year]
1 Innovators (US) 2.5 $271,500
Operating costs for 1st year projected to be $350,000
2 Early Adopters 16 $15,040,000
3 Early Majority 50 $47,000,000
4 Late Majority 84 $78,960,000
Full Penetration 100 $94,000,000
206](https://image.slidesharecdn.com/delftclimatekic070212part2-120704162656-phpapp01/85/Delft-climate-kic-070212-part-2-205-320.jpg)


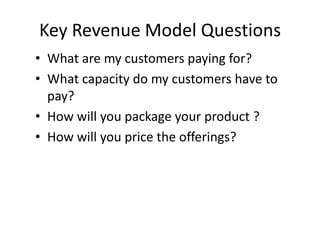


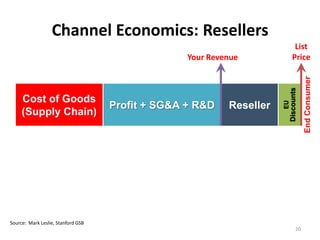
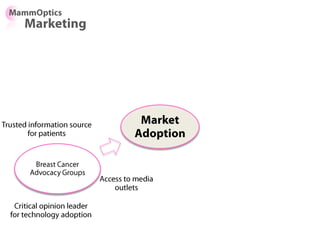
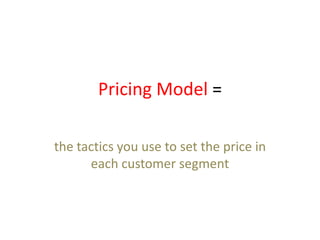
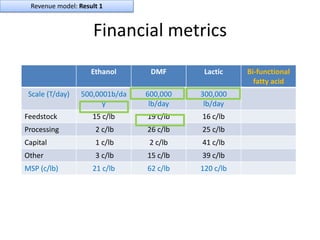
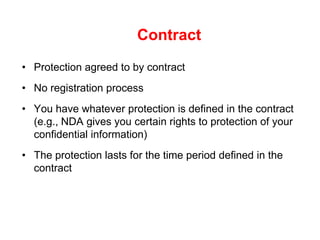
![Soft product launch projected for Q1-Q2 2012
General launch projected for Q4 2012
Diaphragm Membrane Membrane Header
$2,500 $270 $10,600
Year Type % Revenue [/year]
1 Innovators (US) 2.5 $271,500
Operating costs for 1st year projected to be $350,000
2 Early Adopters 16 $15,040,000
3 Early Majority 50 $47,000,000
4 Late Majority 84 $78,960,000
Full Penetration 100 $94,000,000
291](https://image.slidesharecdn.com/delftclimatekic070212part2-120704162656-phpapp01/85/Delft-climate-kic-070212-part-2-290-320.jpg)


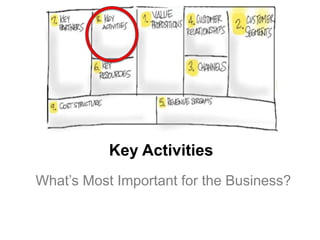
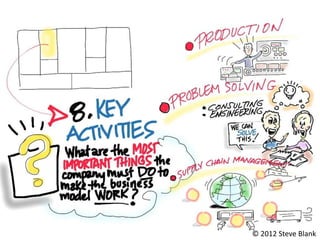
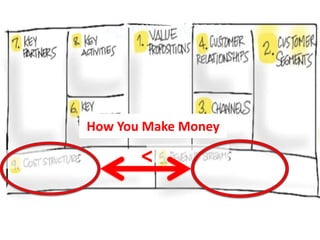


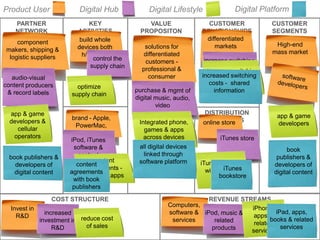
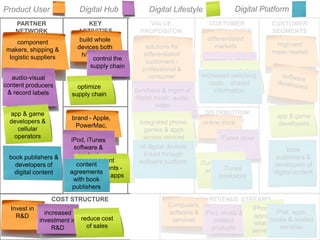
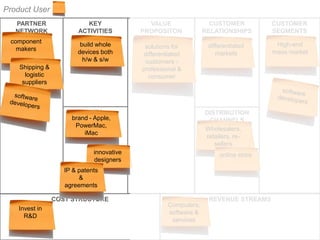
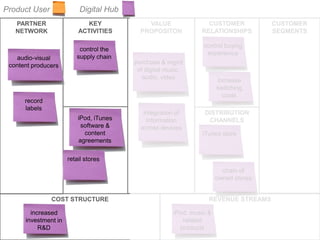
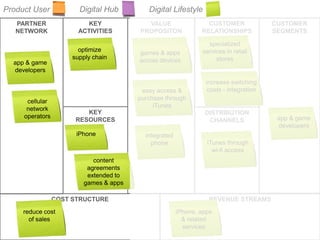
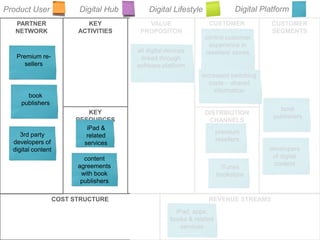


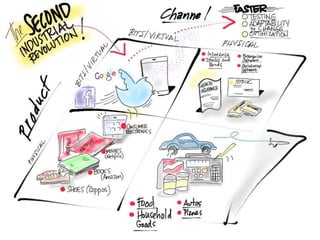
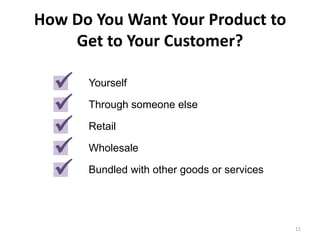
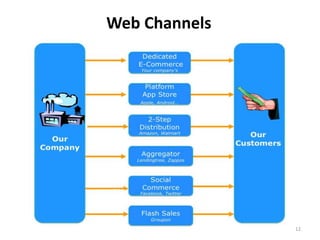
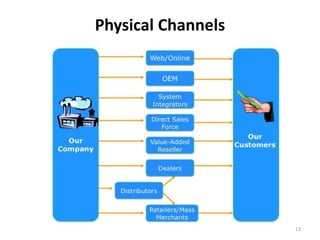
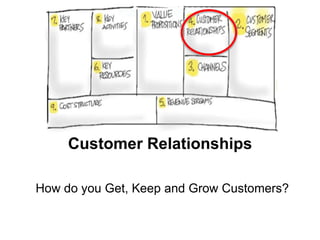
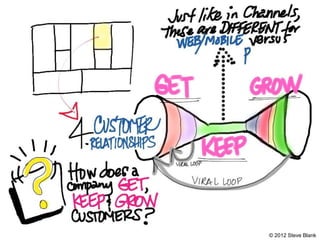
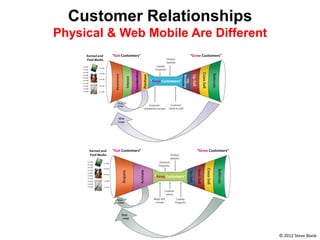
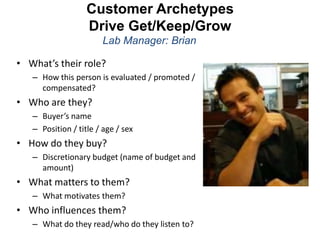
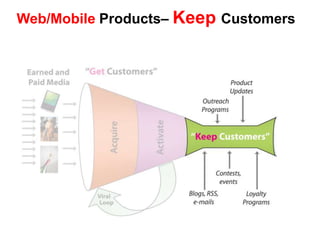
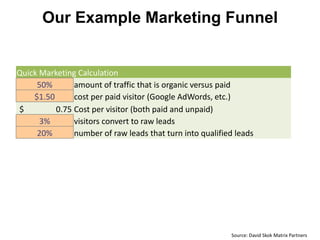
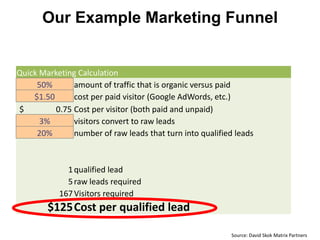
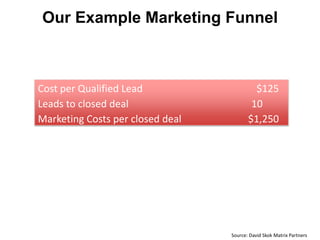
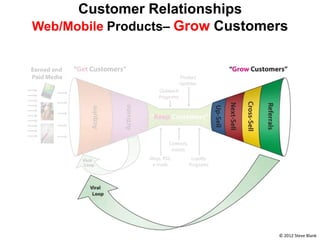
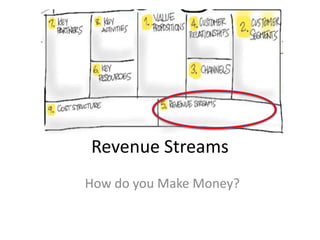
The document outlines an agenda for a workshop on customer development and business models, including sessions on developing a value proposition, identifying customer segments, creating a business model canvas, developing a customer discovery action plan, and discussing customer relationships, revenue streams, and the customer development manifesto. Homework assignments involve updating the business model canvas and developing a customer discovery action plan.


