Download to read offline


![03/25/14 © 2009 Bahill237
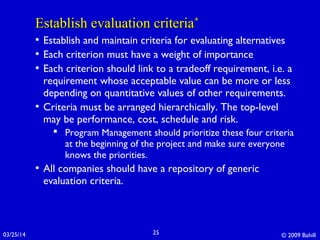
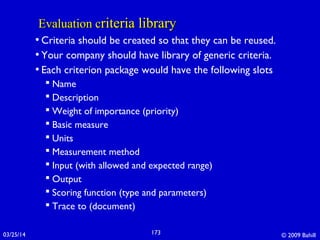
NFL quarterback passer ratingsNFL quarterback passer ratings
BM stands for basic measure
BM1 = (Completed Passes) / (Pass Attempts)
BM2 = (Passing Yards) / (Pass Attempts)
BM3 = (Touchdown Passes) / (Pass Attempts)
BM4 = Interceptions / (Pass Attempts)
Rating = [5(BM1-0.3) + 0.25(BM2-3) + 20(BM3) + 25(-
BM4+0.095)]*100/6](https://image.slidesharecdn.com/decisionmaking1-140325014122-phpapp02/85/Decision-making-1-237-320.jpg)
![03/25/14 © 2009 Bahill238
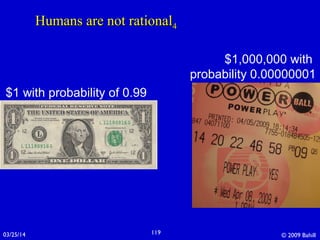
College football BCSCollege football BCS**
BM1 = Polls: AP media & ESPN coaches
BM2 = Computer Rankings: Seattle Times, NY Times, Jeff
Sagarin, etc.
BM3 = Strength of Schedule
BM4 = Number of Losses
Rating = [BM1 + BM2 + BM3 - BM4]
http://sports.espn.go.com/ncf/abcsports/BCSStandings
www.bcsFootball.org](https://image.slidesharecdn.com/decisionmaking1-140325014122-phpapp02/85/Decision-making-1-238-320.jpg)


![03/25/14 © 2009 Bahill245
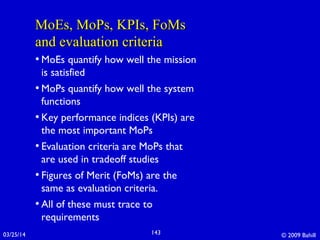
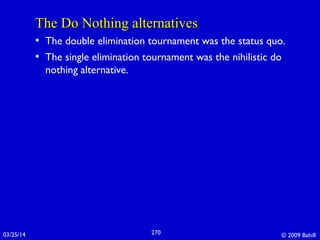
Who was the best NFL quarterback?Who was the best NFL quarterback?
• NFL quarterback passer ratings
• BM1 = (Completed Passes) / (Pass Attempts)
• BM2 = (Passing Yards) / (Pass Attempts)
• BM3 = (Touchdown Passes) / (Pass Attempts)
• BM4 = Interceptions / (Pass Attempts)
• Rating = [5(BM1-0.3) + 0.25(BM2-3) + 20(BM3) +
25(-BM4+0.095)]*100/6](https://image.slidesharecdn.com/decisionmaking1-140325014122-phpapp02/85/Decision-making-1-245-320.jpg)


![03/25/14 © 2009 Bahill281
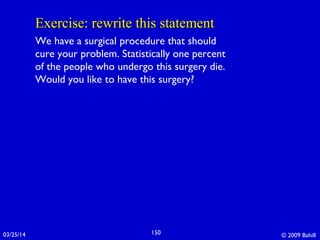
But what about the second-order terms?But what about the second-order terms?
Namely
When using the sum of weighted scores combining function
the second derivatives are all zero. So our estimations are
all right. This is not true for the product combining function
or most other common combining functions. See Daniels,
Werner and Bahill [2001] for explanations of other
combining functions.
2
0
( )
( )
2!
f
x x
ζ′′
−
1 1 11 2 21 2 1 12 2 22andF Wt S Wt S F Wt S Wt S= × + × = × + ×
1 2 1 2
1 11 21 2 12 22andWt Wt Wt Wt
F S S F S S= × = ×](https://image.slidesharecdn.com/decisionmaking1-140325014122-phpapp02/85/Decision-making-1-281-320.jpg)


![03/25/14 © 2009 Bahill315
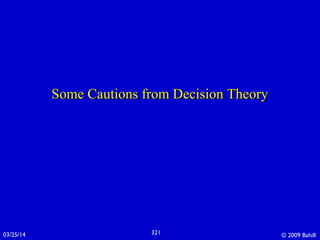
Decision treesDecision trees**
• Another, not necessarily tradeoff study, tool for decision
analysis and resolution.
• Example key decisions and their alternatives
Is formal evaluation needed? [yes, no]
Evaluation data source? [approximations, analysis, models and
simulations, experiments, prototypes]
Combining function? [sum, product, sum minus product,
compromise]
Alternatives? [alt-1, alt-2, alt-3]
Question order may be important, e. g. ask about dog system
function before fertility.
OK, the next slide is the decision tree for these questions.](https://image.slidesharecdn.com/decisionmaking1-140325014122-phpapp02/85/Decision-making-1-315-320.jpg)


![03/25/14 © 2009 Bahill347
Create a Tradeoff StudyCreate a Tradeoff Study44
Main Success Scenario (continued):
8. The system transfers data from the Output Matrices into
the Summary Module.
9. The system displays the Summary Module for Tradeoff
Analyst’s inspection.
10. Tradeoff Analyst looks at the preferred alternatives in
the Summary Module.
11. Tradeoff Analyst repeats steps 2 to 10 until he or she is
satisfied.
12. Tradeoff Analyst submits the tradeoff study for expert
review.
13. Tradeoff Analyst submits the tradeoff study to the
decision maker and places it in the Process Asset Library
(PAL) [exit use case]](https://image.slidesharecdn.com/decisionmaking1-140325014122-phpapp02/85/Decision-making-1-347-320.jpg)
![03/25/14 © 2009 Bahill348
Create a Tradeoff StudyCreate a Tradeoff Study55
Unanchored Alternate Flow:
Tradeoff Analyst can stop the system at any time; all
entered data and intermediate results will be saved [exit
use case].
Postcondition: Tradeoff Analyst has planed a tradeoff study.
Specific Requirements
Functional Requirements:
Note: Transferring data from the Criteria Module into other
modules and interchanging information with Company
Resources and the PAL are supplementary requirements.](https://image.slidesharecdn.com/decisionmaking1-140325014122-phpapp02/85/Decision-making-1-348-320.jpg)


![03/25/14 © 2009 Bahill354
Complete Criteria ModuleComplete Criteria Module44
Main Success Scenario (continued):
9. The system displays alternative combining functions and
accepts the function chosen by Tradeoff Analyst.
10. Tradeoff Analyst repeats this process until satisfied with
the results.
11. Tradeoff Analyst expresses desire to finish this use case.
12. The system transfers criteria to the Input Module [exit
use case].
Anchored Alternate Flow:
1b. When triggered by the Tradeoff Analyst, Tradeoff
Analyst specifies the file to be worked on.](https://image.slidesharecdn.com/decisionmaking1-140325014122-phpapp02/85/Decision-making-1-354-320.jpg)
![03/25/14 © 2009 Bahill355
Complete Criteria ModuleComplete Criteria Module55
Unanchored Alternate Flow:
Tradeoff Analyst can stop the system at any time; all
entered data and intermediate results will be saved [exit
use case].
Postcondition: Tradeoff Analyst knows what the criteria are
and where they are stored.
Specific Requirements
Functional Requirements:
FR2-1 The Criteria Module shall accept scoring function
parameters from Tradeoff Analyst.
FR2-2 The Criteria Module shall create and graph scoring
functions.
FR2-3 The Criteria Module shall accept changes in scoring
function parameters and criteria from Tradeoff Analyst.](https://image.slidesharecdn.com/decisionmaking1-140325014122-phpapp02/85/Decision-making-1-355-320.jpg)


![03/25/14 © 2009 Bahill360
Fill Input ModuleFill Input Module33
Main Success Scenario (continued):
4. Tradeoff Analyst reassesses the criteria values until
satisfied with the results.
5. The Input Module sends criteria values to the Criteria
Module [exit use case].
Anchored Alternate Flow:
1b. When triggered by the Tradeoff Analyst, Tradeoff
Analyst specifies the file to be worked on.
Unanchored Alternate Flow:
Tradeoff Analyst can stop the system at any time; all
entered data and intermediate results will be saved [exit
use case].](https://image.slidesharecdn.com/decisionmaking1-140325014122-phpapp02/85/Decision-making-1-360-320.jpg)


This document outlines a course on decision analysis and tradeoff studies. It provides an estimated timing for the course sections which include introductions to decision analysis and tradeoff processes, an example airport site selection study, methods for overcoming problems in tradeoff studies, a tradeoff study exercise, and a mathematical summary. It also describes establishing evaluation criteria, identifying alternative solutions, selecting evaluation methods, evaluating alternatives, and selecting preferred solutions, which are key steps in the tradeoff study process.


