Solution Manual Cost Accounting Planning and Control by Matz.Hammer and Usry ...Bushra Sultana Malik
This Solution manual Cost Accounting Planning and Control.
Chapter 3 is not Complete.But The Complete chapter is Uploaded See my other Uploads,Chapter 3 Problems are Available.
This deck consists of total of twenty slides. It has PPT slides highlighting important topics of Budget Variance Analysis Powerpoint Presentation Slides. This deck comprises of amazing visuals with thoroughly researched content. Each template is well crafted and designed by our PowerPoint experts. Our designers have included all the necessary PowerPoint layouts in this deck. From icons to graphs, this PPT deck has it all. The best part is that these templates are easily customizable. Just click the DOWNLOAD button shown below. Edit the colour, text, font size, add or delete the content as per the requirement. Download this deck now and engage your audience with this ready made presentation.
“You can download this product from SlideTeam.net”
Select our professionally designed Finance Budgeting PowerPoint Presentation Slides to improve your profits, reduce costs, and increase return on investments. Keep track of your expenses and revenues with the help of our content ready budget forecast presentation deck. The topic-specific actual vs budget variance PowerPoint complete deck contains a set of self-explanatory templates such as actual cost vs budget, month-wise forecasting, overhead cost analysis, quarterly budget analysis, variance analysis, actual vs target variance, budget vs plan vs forecast, forecast, and projection, etc. Creating and monitoring a budget can keep your business profitable and successful. Manage your finances effectively using the ready-to-use budget projection PPT slides. Incorporate the professional-looking financial forecasting PPT visuals to showcase steps of developing and planning a budget. Furthermore, the visually appealing corporate budgeting and forecasting PowerPoint templates are also helpful in creating your financial plans. Thus, download the budget variance analysis PowerPoint presentation now and engage your viewers. A hearty chuckle is good for health. Our Finance Budgeting Powerpoint Presentation Slides are firm believers of the fact. https://bit.ly/3ETzaSC
This complete deck can be used to present to your team.It has PPT slides on various topics highlighting all the core areas of your business needs. This complete deck focuses on Finance Budgeting Powerpoint Presentation Slides and has professionally designed templates with suitable visuals and appropriate content. This deck consists of total of twentyone slides. All the slides are completely customizable for your convenience. You can change the colour, text and font size of these templates. You can add or delete the content if needed. Get access to this professionally designed complete presentation by clicking the download button below.
This complete deck is oriented to make sure you do not lag in your presentations. Our creatively crafted slides come with apt research and planning. This exclusive deck with twenty slides is here to help you to strategize, plan, analyse, or segment the topic with clear understanding and apprehension. Utilize ready to use presentation slides on Budget Projection Powerpoint Presentation Slides with all sorts of editable templates, charts and graphs, overviews, analysis templates. It is usable for marking important decisions and covering critical issues. Display and present all possible kinds of underlying nuances, progress factors for an all inclusive presentation for the teams. This presentation deck can be used by all professionals, managers, individuals,internal external teams involved in any company organization.
Presentation during the Bureau of Agricultural Research (BAR) 14th Agriculture and Fisheries Technology Forum and Product Exhibition Seminar Series on August 31, 2018 at Megatrade Hall 2, SM Megamall, Mandaluyong City
GivenLOSS Sells a variety of equpiment including the executive off.pdfanjanaarts2014
Given
LOSS Sells a variety of equpiment including the executive office chair
Particulars
Current
No.of Units expected to sell the executive office chair
6000
Selling Price per executive office chair in $
250
Current manufacturing costs in $ per unit
175
Current Fixed cost
3,60,000
Proposed Changes
No.of Units expected to sell the executive office chair
6000
Selling Price per executive office chair in $
250
Alternative manufacturing costs in $ per unit
75
Alternative Fixed cost
9,45,000
Sl
Particulars
Current
Proposed
A
Sales
15,00,000
15,00,000
B
Variable cost
10,50,000
4,50,000
C
Contribution ( A - B )
4,50,000
10,50,000
D
Fixed cost
3,60,000
9,45,000
E
Profit ( C - D )
90,000
1,05,000
F
price Volume Ratio % ( C/A * 100 )
30%
70%
G
Break even Point Volume ( D/F)
12,00,000
13,50,000
H
Contribution Per Unit ( C/6000 )
75
175
I
Break even Point Units ( D/H)
4800
5400
J
Margin of safety sales ( A -G )
3,00,000
1,50,000
K
Margin of safety in Units ( J / selling Price pu )
1200
600
L
Margin of safety in Percentage ( J / A )*100
20%
10%
Indiffernce point between two alternatives
Indifference cost = point where there is no difference in cost between two alternatives
Indifference point Units
Assumptions
Q = Quantity / units
Cpu 1 = Contribution per unit for current alternative
Cpu 2= Contribution per unit for proposed alternative
FC 1 = fixed cost for current alternative
FC 2 = fixed cost for Proposed alternative alternative
Indifference point equation
Cpu1 * Q - FC1 = Cpu2 * Q - FC2
=
75 * Q - 360,000 = 175 * Q -945,000
=
945,000 - 360,000 = Q ( 175 - 75 )
=
100 * Q = 585,000
=
Q = 585,000/100
=
Q = 5850 Units
Therefore Indifference point is 5850 Units
Given
LOSS Sells a variety of equpiment including the executive office chair
Particulars
Current
No.of Units expected to sell the executive office chair
6000
Selling Price per executive office chair in $
250
Current manufacturing costs in $ per unit
175
Current Fixed cost
3,60,000
Proposed Changes
No.of Units expected to sell the executive office chair
6000
Selling Price per executive office chair in $
250
Alternative manufacturing costs in $ per unit
75
Alternative Fixed cost
9,45,000
Sl
Particulars
Current
Proposed
A
Sales
15,00,000
15,00,000
B
Variable cost
10,50,000
4,50,000
C
Contribution ( A - B )
4,50,000
10,50,000
D
Fixed cost
3,60,000
9,45,000
E
Profit ( C - D )
90,000
1,05,000
F
price Volume Ratio % ( C/A * 100 )
30%
70%
G
Break even Point Volume ( D/F)
12,00,000
13,50,000
H
Contribution Per Unit ( C/6000 )
75
175
I
Break even Point Units ( D/H)
4800
5400
J
Margin of safety sales ( A -G )
3,00,000
1,50,000
K
Margin of safety in Units ( J / selling Price pu )
1200
600
L
Margin of safety in Percentage ( J / A )*100
20%
10%
Indiffernce point between two alternatives
Indifference cost = point where there is no difference in cost between two alternatives
Indifference point Units
Assumptions
Q = Quantity / units
Cpu 1 = Contribution per unit for current alternative
Cpu 2= Contribution per unit for.
This Slideshare presentation is a partial preview of the full business document. To view and download the full document, please go here:
http://flevy.com/browse/business-document/Break-Even-Calculator-142
This excel sheet provides a Break Even Calculator which shows an analysis to determine the point at which revenue received equals the costs associated with receiving the revenue. Break-even analysis calculates what is known as a margin of safety, the amount that revenues exceed the break-even point. This is the amount that revenues can fall while still staying above the break-even point.
Question 5The financial statements of The Hershey Company and .docxteofilapeerless
Question 5
The financial statements of
The Hershey Company
and
Tootsie Roll
are presented below.
THE HERSHEY COMPANY
CONSOLIDATED STATEMENTS OF INCOME
For the years ended December 31,
2011
2010
2009
In thousands of dollars except per share amounts
Net Sales
$6,080,788
$5,671,009
$5,298,668
Costs and Expenses:
Cost of sales
3,548,896
3,255,801
3,245,531
Selling, marketing and administrative
1,477,750
1,426,477
1,208,672
Business realignment and impairment (credits) charges, net
(886
)
83,433
82,875
Total costs and expenses
5,025,760
4,765,711
4,537,078
Income before Interest and Income Taxes
1,055,028
905,298
761,590
Interest expense, net
92,183
96,434
90,459
Income before Income Taxes
962,845
808,864
671,131
Provision for income taxes
333,883
299,065
235,137
Net Income
$628,962
$509,799
$435,994
Net Income Per Share—Basic—Class B Common Stock
$2.58
$2.08
$1.77
Net Income Per Share—Diluted—Class B Common Stock
$2.56
$2.07
$1.77
Net Income Per Share—Basic—Common Stock
$2.85
$2.29
$1.97
Net Income Per Share—Diluted—Common Stock
$2.74
$2.21
$1.90
Cash Dividends Paid Per Share:
Common Stock
$1.3800
$1.2800
$1.1900
Class B Common Stock
1.2500
1.1600
1.0712
The notes to consolidated financial statements are an integral part of these statements and are included in the Hershey's 2011 Annual Report, available at www.thehersheycompany.com.
THE HERSHEY COMPANY
CONSOLIDATED BALANCE SHEETS
December 31,
2011
2010
In thousands of dollars
ASSETS
Current Assets:
Cash and cash equivalents
$693,686
$884,642
Accounts receivable—trade
399,499
390,061
Inventories
648,953
533,622
Deferred income taxes
136,861
55,760
Prepaid expenses and other
167,559
141,132
Total current assets
2,046,558
2,005,217
Property, Plant and Equipment, Net
1,559,717
1,437,702
Goodwill
516,745
524,134
Other Intangibles
111,913
123,080
Deferred Income Taxes
38,544
21,387
Other Assets
138,722
161,212
Total assets
$4,412,199
$4,272,732
LIABILITIES AND STOCKHOLDERS’ EQUITY
Current Liabilities:
Accounts payable
$420,017
$410,655
Accrued liabilities
612,186
593,308
Accrued income taxes
1,899
9,402
Short-term debt
42,080
24,088
Current portion of long-term debt
97,593
261,392
Total current liabilities
1,173,775
1,298,845
Long-term Debt
1,748,500
1,541,825
Other Long-term Liabilities
617,276
494,461
Total liabilities
3,539,551
3,335,131
Commitments and Contingencies
—
—
Stockholders’ Equity:
The Hershey Company Stockholders’ Equity
Preferred Stock, shares issued: none in 2011 and 2010
—
—
Common Stock, shares issued: 299,269,702 in 2011 and 299,195,325 in 2010
299,269
299,195
Class B Common Stock.
Pernyataan gabungan memiliki keuntungan tidak membutuhkan pembentukan sebuah laporan keuangan baru. Namun, Menutup laba bersih sebagai subtotal pada pernyataan ini dianggap merugikan
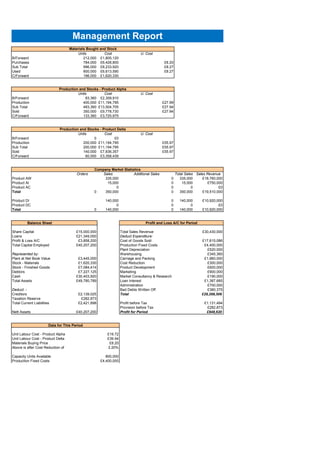
1. Units Cost U. Cost
B/Forward 212,000 £1,805,120
Purchases 784,000 £6,428,800 £8.20
Sub Total 996,000 £8,233,920 £8.27
Used 800,000 £6,613,590 £8.27
C/Forward 196,000 £1,620,330
Units Cost U. Cost
B/Forward 83,360 £2,309,910
Production 400,000 £11,194,795 £27.99
Sub Total 483,360 £13,504,705 £27.94
Sold 350,000 £9,778,730 £27.94
C/Forward 133,360 £3,725,975
Units Cost U. Cost
B/Forward 0 £0
Production 200,000 £11,194,795 £55.97
Sub Total 200,000 £11,194,795 £55.97
Sold 140,000 £7,836,357 £55.97
C/Forward 60,000 £3,358,439
Company Market Statistics
Orders Sales Additional Sales Total Sales Sales Revenue
Product AW 335,000 0 335,000 £18,760,000
Product AI 15,000 0 15,000 £750,000
Product AC 0 0 0 £0
Total 0 350,000 0 350,000 £19,510,000
Product DI 140,000 0 140,000 £10,920,000
Product DC 0 0 0 £0
Total 0 140,000 0 140,000 £10,920,000
Balance Sheet Profit and Loss A/C for Period
Share Capital £15,000,000 Total Sales Revenue £30,430,000
Loans £21,349,000 Deduct Expenditure:
Profit & Loss A/C £3,858,200 Cost of Goods Sold £17,615,086
Total Capital Employed £40,207,200 Production Fixed Costs £4,400,000
Plant Depreciation £520,000
Represented by: Warehousing £345,360
Plant at Net Book Value £3,445,000 Carriage and Packing £1,960,000
Stock - Materials £1,620,330 Cost Reduction £300,000
Stock - Finished Goods £7,084,414 Product Development £600,000
Debtors £7,227,125 Marketing £900,000
Cash £30,403,920 Market Consultancy & Research £190,000
Total Assets £49,780,789 Loan Interest £1,387,685
Administration £700,000
Deduct: - Bad Debts Written Off £380,375
Creditors £2,139,025 Total £29,298,506
Taxation Reserve £282,873
Total Current Liabilities £2,421,898 Profit before Tax £1,131,494
Provision before Tax £282,873
Nett Assets £40,207,200 Profit for Period £848,620
Data for This Period
Unit Labour Cost - Product Alpha £19.72
Unit Labour Cost - Product Delta £39.44
Materials Buying Price £8.20
Above is after Cost Reduction of 2.20%
Capacity Units Available 800,000
Production Fixed Costs £4,400,000
Production and Stocks - Product Delta
Production and Stocks - Product Alpha
Materials Bought and Stock
Management Report