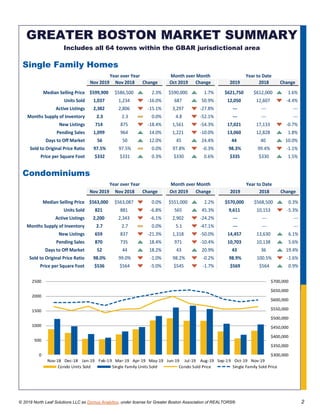
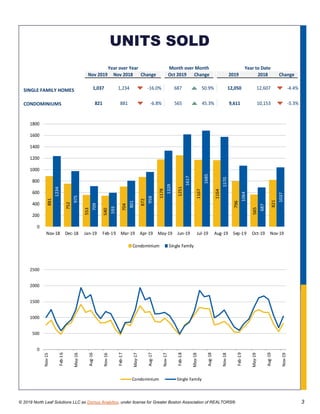
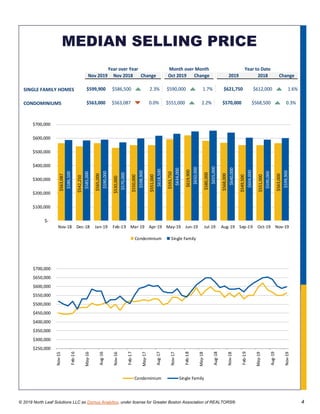
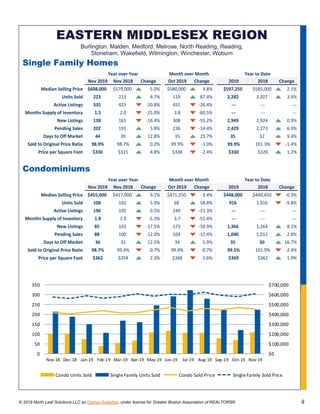
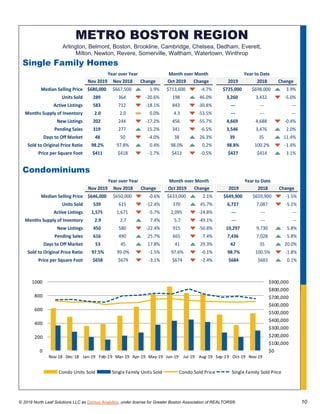
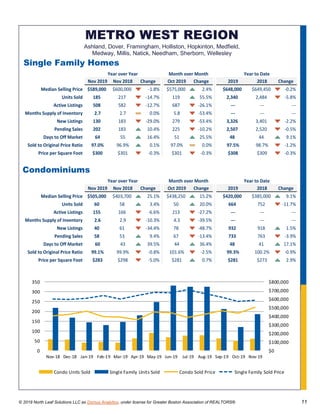
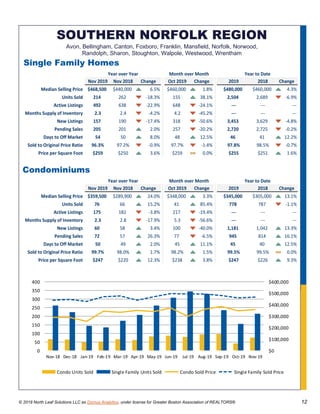
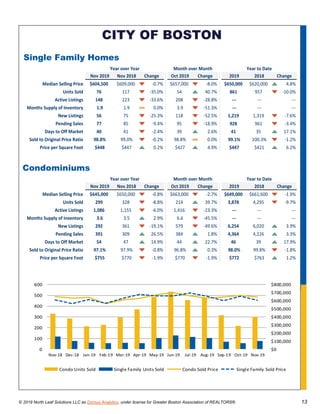
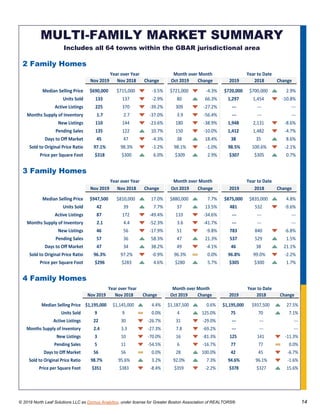
- In November 2019, 1,037 single-family homes and 821 condominiums were sold in Greater Boston, decreases of 16.0% and 6.8% respectively from November 2018.
- The median sales price for single-family homes reached a new record high of $599,900, up 2.3% from November 2018, while the median price for condos remained flat at $563,000.
- Both active listings and new listings decreased for single-family homes and condos compared to November 2018.
The document provides market data for single-family homes, condominiums, and multi-family homes in the Greater Boston area for October 2019 compared to October 2018 and September 2019. For single-family homes, sales volume decreased 38.7% year-over-year while the median price declined 2.2%. Condominium sales were down 31.0% but the median price rose 1.9%. Multi-family home sales increased 46.1% and listings declined 24% from the previous year. The document also includes data for various subregions in the Greater Boston area.
The document summarizes real estate market data for January 2020 in the Greater Boston area. It provides statistics on home and condo sales, median prices, inventory levels, and new listings for single-family homes and condominiums at the regional and town levels. Specifically for the Central Middlesex region, median home prices increased slightly while condo prices decreased. Home sales increased 37.7% while condo sales decreased slightly. Inventory levels also decreased for both homes and condos.
Greater Boston Association of Realtors Monthly Market Insights Report, August...Joe Schutt
The document provides market data for single-family homes, condominiums, and multi-family homes in the Greater Boston area for August 2019 compared to August 2018 and July 2019. Some key figures:
- Sales of single-family homes decreased 7.4% year-over-year while the median price increased 2.5%. Condo sales decreased 9.6% and the median price decreased 1.7%.
- Active listings of single-family homes decreased 11.9% year-over-year while months of supply decreased 5.9%. For condos, active listings increased 9.3% and months of supply increased 20%.
- New listings of single-family homes decreased 14%
The document summarizes real estate market data for the Greater Boston area in November 2020. It reports that sales of single-family homes and condominiums increased year-over-year, with median home prices reaching new record highs. Specifically, single-family home sales were up 15.6% and the median price increased 16.9%. Condo sales rose 5.1% and the median price grew 2.5%. Inventory declined for both housing types. The multi-family market also saw a sales increase and higher median price compared to November 2019.
- In October 2020, detached single-family home sales in Greater Boston reached a record high of 1,433 homes sold, a 36.9% increase from October 2019. The median sales price rose 18% from the previous year to a new record high of $700,000.
- Condominium sales in October 2020 also set a new record with 949 units sold, a 9.3% increase over the previous year. The median condo price rose 4.6% to $575,000, a new high for October.
- Multi-family home sales increased 6.4% compared to October 2019, with 198 units sold last month.
- In September 2019, 1,060 single family homes and 790 condominiums were sold in Greater Boston, increases of 6.5% and 3.4% respectively from September 2018. The median sales price for single family homes reached a new high of $605,000, up 1.7% from September 2018, while the median condo price declined 4.1% to $549,000.
- The number of active listings decreased 11.4% for single family homes but increased 8.7% for condominiums compared to September 2018. Months supply of inventory declined for both property types.
- New listings decreased 3.3% for single family homes but increased 12.8
- Housing sales in Greater Boston decreased in June 2019 compared to June 2018, with single family home sales down 13.8% and condo sales down 8.9%.
- The median sales price of single family homes rose slightly to a new record high of $652,555, while the median price of condos increased 6.8% to $618,450, also a new record.
- Active listings and new listings decreased for both single family homes and condos compared to June 2018, while pending sales rose slightly, indicating the market remains balanced overall despite lower sales volume.
Greater Boston Association of Realtors Monthly Market Insights Report July 2019Joe Schutt
The real estate market in Greater Boston saw mixed results in July 2019 compared to July 2018. Sales of single-family homes increased slightly while condo sales decreased. The median sales price of single-family homes rose slightly but the median price of condos fell. Active listings of single-family homes decreased from the previous year while condo listings increased.
December 2018 Greater Boston Real Estate Market TrendsJoe Schutt
The document provides housing market data for December 2018 for the Greater Boston area. It shows that in December, sales of single-family homes decreased 8.4% from the previous year while the median sales price increased slightly by 0.2%. Condo sales decreased 11.5% while the median price remained flat. Multi-family home sales decreased 11.9%. Data is also provided for various subregions showing changes in units sold, median prices, active listings and other metrics on a year-over-year basis.
Housing market conditions continue to favour home buyers VANCOUVER, BC – March 4, 2019 – The Metro Vancouver* housing market saw increased
supply from home sellers and below average demand from home buyers in February.
- Home sales in the Metro Vancouver region dipped below the long-term average in February 2018, with a 9% decrease in sales compared to February 2017.
- The supply of apartments and townhomes is unable to meet demand, while the detached home market is entering a buyers' market.
- Rising interest rates and stricter mortgage requirements have reduced home buyers' purchasing power, particularly for first-time buyers.
Home sales in Metro Vancouver dipped to the lowest level seen in March in over 30 years according to a report from the Real Estate Board of Greater Vancouver. Sales totalled 1,727 in March 2019, down 31.4% from March 2018. The total number of homes currently listed is also up 52.4% compared to March 2018. The president of the Real Estate Board attributed the downturn to government policies that have imposed new taxes and regulations on the housing market in recent years, arguing these measures sideline buyers in the short term but do not eliminate long term demand for housing. Benchmark home prices were down across all major property types compared to the previous year.
The September 2019 Gallatin Valley real estate market update provided the following information in 3 sentences:
Homes for sale increased in Bozeman but decreased in Three Forks and Big Sky compared to September 2018, while new listings rose in Bozeman, Belgrade, and Big Sky but fell in Three Forks. Median sales prices grew over 10% in Bozeman and Three Forks but declined slightly in Belgrade. Months supply of inventory decreased in Three Forks but increased in Bozeman and Big Sky compared to the previous September.
- In July 2019, the U.S. economic expansion became the longest on record at 121 months. However, average growth has been slower than in the 1990s. A mild recession is expected in the near future.
- In San Francisco, single family home sales prices fell 1.6% while condo prices rose 6.5% in July. New listings dropped significantly while pending sales rose slightly for homes and fell for condos.
- The economic expansion has lowered unemployment but many consumers remain financially struggling despite low interest rates. The Federal Reserve cut rates to support continued growth.
San Francisco Market Focus Report October 2018Ronny Budiutama
The document provides a summary of residential real estate activity in San Francisco for October 2018. Key points include:
- New listings were down 2.1% for single family homes and 9.7% for condos. Pending sales increased 0.8% for single family but decreased 14.2% for condos.
- Median sales prices increased 1.6% for single family homes to $1,600,000 and 7.3% for condos to $1,223,500. Months of inventory increased for both property types.
- Overall the real estate market appears to be stabilizing as the year comes to an end, with slowing price growth and shrinking differences in yearly sales, inventory
Home buyer activity in the Metro Vancouver housing market increased in October compared to the previous year and month. Residential home sales totaled 2,858, up 45.4% from October 2018 and 22.5% from September 2019. While the number of newly listed homes decreased compared to the same periods, total active listings also declined. Benchmark home prices decreased across all major property types over the past year but increased slightly from September 2019.
San Francisco market focus report December 2019Ronny Budiutama
The document provides a monthly snapshot of residential real estate activity in San Francisco for December 2019. Key points include:
- The median sales price for single family homes decreased 2.8% year-over-year to $1,450,000, while the median price for condos increased 4.2% to $1,219,000.
- New listings decreased 40.2% for single family homes and 45.1% for condos year-over-year. Pending sales decreased 8.3% for single family but increased 3.4% for condos.
- Inventory levels decreased across the board while demand remained healthy, suggesting the market remains balanced with low interest rates and wage growth supporting
December 2020 Victoria Real Estate Board StatisticsVicky Aulakh
The Victoria real estate market saw record sales in 2020, with a total of 8,497 properties sold, up 17.1% from 2019. While sales increased, inventory decreased significantly, with only 1,279 active listings at the end of December 2020, down 29.5% from the previous month and 34.5% from the previous year. This represents the lowest inventory levels in at least 25 years, putting upward pressure on home prices. The benchmark price of a single-family home in Victoria increased 6.8% year-over-year to $915,100 in December 2020.
Residential real estate activity in San Francisco County saw the following trends in May 2019:
- Median sales prices for single family homes increased 4.9% year-over-year to $1,697,500, while median prices for condos decreased 0.7% to $1,249,000.
- New listings decreased 15.1% for single family homes and 20.3% for condos compared to May 2018. Pending sales also decreased for single family homes but increased for condos.
- Months supply of inventory decreased for both single family and condo properties, indicating a tighter market with fewer options for buyers.
- Sales of residential and commercial properties in the Fraser Valley decreased 22.5% in March 2022 compared to March 2021 but increased 41.4% compared to February 2022. New listings also increased compared to the previous month.
- While sales and new listings decreased compared to the previous year, total active inventory increased compared to last month but remained lower than March 2021 levels. Benchmark home prices continued to rise month-over-month across all property types.
- The increases in new listings and inventory were seen as positive signs that could help slow price growth, but the market was still seen as imbalanced due to lack of housing supply. Interest rate hikes were also expected to impact new homebuyers more than other
The document is a monthly real estate snapshot for San Francisco County that provides key metrics and year-over-year comparisons. It summarizes that:
- Median home sale prices increased 9.9% for single family homes and 8.0% for condos year-over-year.
- New listings were down 22.2% for single family and 12.0% for condos compared to the previous year.
- Inventory levels decreased with months supply down 31.0% for single family homes and 20.0% for condos.
The document provides a monthly snapshot of residential real estate activity in San Francisco for July 2018. Some key points:
- Median home sale prices increased 17.9% year-over-year for single family homes and 1.4% for condos.
- New listings were down 14.2% for single family and 32.8% for condos compared to the previous year. Pending sales also decreased for single family but increased for condos.
- Inventory levels decreased while prices rose, suggesting the market remains favorable for sellers despite some signs of a potential slowdown in demand.
The U.S. housing market remains strong with increasing single-family rents and rising new home construction sales. In San Francisco County, the median sales price for single-family homes increased 12.8% year-over-year to $1,810,000 in October 2021, while the median price for condos rose 8.5% to $1,250,000. New listings were down significantly for both property types compared to the previous year.
- Residential real estate activity in San Francisco saw increases in new listings, pending sales, and median sales prices in July 2020 compared to July 2019.
- New listings rose 20.8% for single family homes and 46.6% for condos. Pending sales increased 38.5% for single family and 14% for condos.
- Median sales prices grew 6% for single family homes to $1,670,000 and 3.7% for condos to $1,268,200. However, months of inventory increased significantly.
The document summarizes real estate market data for January 2020 in the Greater Boston area. It provides statistics on home and condo sales, median prices, inventory levels, and other metrics for single-family homes, condominiums, and multi-family properties across different regions. Specifically for the Central Middlesex region, it shows a 37.7% increase in single-family home sales from January 2019, with the median price rising 0.4%, and condo median prices and sales both declining from the previous year.
Greater Boston Association of Realtors Monthly Market Insights Report July 2019Joe Schutt
The real estate market in Greater Boston saw mixed results in July 2019 compared to July 2018. Sales of single-family homes increased slightly while condo sales decreased. The median sales price of single-family homes rose slightly but the median price of condos fell. Active listings of single-family homes decreased from the previous year while condo listings increased.
- In June 2020, detached single-family home sales in Greater Boston decreased 28.8% compared to June 2019, while the median sales price increased 4.5%. Condo sales decreased 39.3% but the median price fell 4.4%. Multi-family home sales dropped 40.2%.
- For single-family homes, active listings declined 32.5% while months of supply decreased slightly. New listings rose 2.4% and pending sales increased 7.5%. The median price grew 1.7% over May 2020.
- Condo active listings declined 2.1% and months of supply jumped 65%. New listings rose 20.1% and pending sales were flat. The median price increased
September 2017 Greater Boston Real Estate Indicators ReportJoe Schutt
This document summarizes real estate market data for September 2017 in the Greater Boston area. It reports that 1,100 single-family homes and 865 condominiums were sold last month, representing decreases from September 2016. The median sales price of single-family homes reached a new high of $573,500, up 13.6% from the previous year, while the median condo price fell 2.4% to $497,500. Active listings and new listings declined slightly for both housing types compared to September 2016.
July 2017 Greater Boston Real Estate Market TrendsJoe Schutt
Single-family home sales in the Central Middlesex region decreased slightly by 2.1% in July 2017 compared to July 2016. The median sales price also decreased by 2.2% to $740,000. Condominium sales decreased by 1.9% and the median sales price increased by 5.4% to $430,000, a new high for the region. Overall the housing market in the region saw softening activity in July 2017 compared to the previous year.
Greater Boston Association of Realtors Monthly Market Insights Report July 2019Joe Schutt
The real estate market in Greater Boston saw mixed results in July 2019 compared to July 2018. Sales of single-family homes increased slightly while condo sales decreased. The median sales price of single-family homes rose slightly but the median price of condos fell. Active listings of single-family homes decreased from the previous year while condo listings increased.
December 2018 Greater Boston Real Estate Market TrendsJoe Schutt
The document provides housing market data for December 2018 for the Greater Boston area. It shows that in December, sales of single-family homes decreased 8.4% from the previous year while the median sales price increased slightly by 0.2%. Condo sales decreased 11.5% while the median price remained flat. Multi-family home sales decreased 11.9%. Data is also provided for various subregions showing changes in units sold, median prices, active listings and other metrics on a year-over-year basis.
Housing market conditions continue to favour home buyers VANCOUVER, BC – March 4, 2019 – The Metro Vancouver* housing market saw increased
supply from home sellers and below average demand from home buyers in February.
- Home sales in the Metro Vancouver region dipped below the long-term average in February 2018, with a 9% decrease in sales compared to February 2017.
- The supply of apartments and townhomes is unable to meet demand, while the detached home market is entering a buyers' market.
- Rising interest rates and stricter mortgage requirements have reduced home buyers' purchasing power, particularly for first-time buyers.
Home sales in Metro Vancouver dipped to the lowest level seen in March in over 30 years according to a report from the Real Estate Board of Greater Vancouver. Sales totalled 1,727 in March 2019, down 31.4% from March 2018. The total number of homes currently listed is also up 52.4% compared to March 2018. The president of the Real Estate Board attributed the downturn to government policies that have imposed new taxes and regulations on the housing market in recent years, arguing these measures sideline buyers in the short term but do not eliminate long term demand for housing. Benchmark home prices were down across all major property types compared to the previous year.
The September 2019 Gallatin Valley real estate market update provided the following information in 3 sentences:
Homes for sale increased in Bozeman but decreased in Three Forks and Big Sky compared to September 2018, while new listings rose in Bozeman, Belgrade, and Big Sky but fell in Three Forks. Median sales prices grew over 10% in Bozeman and Three Forks but declined slightly in Belgrade. Months supply of inventory decreased in Three Forks but increased in Bozeman and Big Sky compared to the previous September.
- In July 2019, the U.S. economic expansion became the longest on record at 121 months. However, average growth has been slower than in the 1990s. A mild recession is expected in the near future.
- In San Francisco, single family home sales prices fell 1.6% while condo prices rose 6.5% in July. New listings dropped significantly while pending sales rose slightly for homes and fell for condos.
- The economic expansion has lowered unemployment but many consumers remain financially struggling despite low interest rates. The Federal Reserve cut rates to support continued growth.
San Francisco Market Focus Report October 2018Ronny Budiutama
The document provides a summary of residential real estate activity in San Francisco for October 2018. Key points include:
- New listings were down 2.1% for single family homes and 9.7% for condos. Pending sales increased 0.8% for single family but decreased 14.2% for condos.
- Median sales prices increased 1.6% for single family homes to $1,600,000 and 7.3% for condos to $1,223,500. Months of inventory increased for both property types.
- Overall the real estate market appears to be stabilizing as the year comes to an end, with slowing price growth and shrinking differences in yearly sales, inventory
Home buyer activity in the Metro Vancouver housing market increased in October compared to the previous year and month. Residential home sales totaled 2,858, up 45.4% from October 2018 and 22.5% from September 2019. While the number of newly listed homes decreased compared to the same periods, total active listings also declined. Benchmark home prices decreased across all major property types over the past year but increased slightly from September 2019.
San Francisco market focus report December 2019Ronny Budiutama
The document provides a monthly snapshot of residential real estate activity in San Francisco for December 2019. Key points include:
- The median sales price for single family homes decreased 2.8% year-over-year to $1,450,000, while the median price for condos increased 4.2% to $1,219,000.
- New listings decreased 40.2% for single family homes and 45.1% for condos year-over-year. Pending sales decreased 8.3% for single family but increased 3.4% for condos.
- Inventory levels decreased across the board while demand remained healthy, suggesting the market remains balanced with low interest rates and wage growth supporting
December 2020 Victoria Real Estate Board StatisticsVicky Aulakh
The Victoria real estate market saw record sales in 2020, with a total of 8,497 properties sold, up 17.1% from 2019. While sales increased, inventory decreased significantly, with only 1,279 active listings at the end of December 2020, down 29.5% from the previous month and 34.5% from the previous year. This represents the lowest inventory levels in at least 25 years, putting upward pressure on home prices. The benchmark price of a single-family home in Victoria increased 6.8% year-over-year to $915,100 in December 2020.
Residential real estate activity in San Francisco County saw the following trends in May 2019:
- Median sales prices for single family homes increased 4.9% year-over-year to $1,697,500, while median prices for condos decreased 0.7% to $1,249,000.
- New listings decreased 15.1% for single family homes and 20.3% for condos compared to May 2018. Pending sales also decreased for single family homes but increased for condos.
- Months supply of inventory decreased for both single family and condo properties, indicating a tighter market with fewer options for buyers.
- Sales of residential and commercial properties in the Fraser Valley decreased 22.5% in March 2022 compared to March 2021 but increased 41.4% compared to February 2022. New listings also increased compared to the previous month.
- While sales and new listings decreased compared to the previous year, total active inventory increased compared to last month but remained lower than March 2021 levels. Benchmark home prices continued to rise month-over-month across all property types.
- The increases in new listings and inventory were seen as positive signs that could help slow price growth, but the market was still seen as imbalanced due to lack of housing supply. Interest rate hikes were also expected to impact new homebuyers more than other
The document is a monthly real estate snapshot for San Francisco County that provides key metrics and year-over-year comparisons. It summarizes that:
- Median home sale prices increased 9.9% for single family homes and 8.0% for condos year-over-year.
- New listings were down 22.2% for single family and 12.0% for condos compared to the previous year.
- Inventory levels decreased with months supply down 31.0% for single family homes and 20.0% for condos.
The document provides a monthly snapshot of residential real estate activity in San Francisco for July 2018. Some key points:
- Median home sale prices increased 17.9% year-over-year for single family homes and 1.4% for condos.
- New listings were down 14.2% for single family and 32.8% for condos compared to the previous year. Pending sales also decreased for single family but increased for condos.
- Inventory levels decreased while prices rose, suggesting the market remains favorable for sellers despite some signs of a potential slowdown in demand.
The U.S. housing market remains strong with increasing single-family rents and rising new home construction sales. In San Francisco County, the median sales price for single-family homes increased 12.8% year-over-year to $1,810,000 in October 2021, while the median price for condos rose 8.5% to $1,250,000. New listings were down significantly for both property types compared to the previous year.
- Residential real estate activity in San Francisco saw increases in new listings, pending sales, and median sales prices in July 2020 compared to July 2019.
- New listings rose 20.8% for single family homes and 46.6% for condos. Pending sales increased 38.5% for single family and 14% for condos.
- Median sales prices grew 6% for single family homes to $1,670,000 and 3.7% for condos to $1,268,200. However, months of inventory increased significantly.
The document summarizes real estate market data for January 2020 in the Greater Boston area. It provides statistics on home and condo sales, median prices, inventory levels, and other metrics for single-family homes, condominiums, and multi-family properties across different regions. Specifically for the Central Middlesex region, it shows a 37.7% increase in single-family home sales from January 2019, with the median price rising 0.4%, and condo median prices and sales both declining from the previous year.
Greater Boston Association of Realtors Monthly Market Insights Report July 2019Joe Schutt
The real estate market in Greater Boston saw mixed results in July 2019 compared to July 2018. Sales of single-family homes increased slightly while condo sales decreased. The median sales price of single-family homes rose slightly but the median price of condos fell. Active listings of single-family homes decreased from the previous year while condo listings increased.
- In June 2020, detached single-family home sales in Greater Boston decreased 28.8% compared to June 2019, while the median sales price increased 4.5%. Condo sales decreased 39.3% but the median price fell 4.4%. Multi-family home sales dropped 40.2%.
- For single-family homes, active listings declined 32.5% while months of supply decreased slightly. New listings rose 2.4% and pending sales increased 7.5%. The median price grew 1.7% over May 2020.
- Condo active listings declined 2.1% and months of supply jumped 65%. New listings rose 20.1% and pending sales were flat. The median price increased
September 2017 Greater Boston Real Estate Indicators ReportJoe Schutt
This document summarizes real estate market data for September 2017 in the Greater Boston area. It reports that 1,100 single-family homes and 865 condominiums were sold last month, representing decreases from September 2016. The median sales price of single-family homes reached a new high of $573,500, up 13.6% from the previous year, while the median condo price fell 2.4% to $497,500. Active listings and new listings declined slightly for both housing types compared to September 2016.
July 2017 Greater Boston Real Estate Market TrendsJoe Schutt
Single-family home sales in the Central Middlesex region decreased slightly by 2.1% in July 2017 compared to July 2016. The median sales price also decreased by 2.2% to $740,000. Condominium sales decreased by 1.9% and the median sales price increased by 5.4% to $430,000, a new high for the region. Overall the housing market in the region saw softening activity in July 2017 compared to the previous year.
May 2017 Greater Boston Association of Realtors Monthly Indicators ReportJoe Schutt
The document provides market insights data for May 2017 on single-family homes, condominiums, and multi-family homes in Greater Boston. Key points include:
- Sales of single-family homes decreased 2.2% from May 2016 but the median sales price reached a new high of $600,000, up 13.1%. Condo sales fell 4.3% but the median price rose 8.9% to $525,381.
- In the Central Middlesex region, single-family home sales fell 3.6% while the median price jumped 24.5% to $818,000, a new record. Condo median prices there declined 10.1% to $386,
San Francisco Market Focus Report December 2018Ronny Budiutama
This monthly snapshot summarizes real estate activity in San Francisco County for December 2018. Key points include:
- Median home prices increased 3.4% year-over-year for single family homes and 6.7% for condos.
- New listings declined sharply, down 43.6% for single family and 57.4% for condos compared to December 2017.
- Pending sales rose 10.3% for single family but fell 28.6% for condos over the same period last year.
- Inventory remained tight while demand remained strong, putting upward pressure on home prices despite signs that more inventory may become available in 2019.
San Francisco Market Focus Report August 2019Ronny Budiutama
The document provides a monthly snapshot of real estate activity in San Francisco County for August 2019. Key metrics showed a 4.2% year-over-year increase in the median sales price for single family homes and a 4.1% increase for condos. New listings were down 30.5% for single family homes and 28% for condos compared to the previous year. Pending sales also decreased by 13.5% and 13.4%, respectively. The report examines additional housing market indicators and trends over time.
Greater Boston Association of Realtors January 2017 Monthly Indicators ReportJoe Schutt
- In January 2017, 830 single family homes and 610 condominiums were sold in the Greater Boston area, a slight decrease from January 2016. The median sales price increased 6.1% for single family homes and 12.8% for condominiums compared to January 2016.
- For single family homes, active listings decreased 36.9% while new listings decreased 2% compared to January 2016. The months supply of inventory also decreased 35.9% year-over-year.
- Condominium active listings decreased 29.1% and new listings increased 1.8% versus January 2016. The months supply of condo inventory decreased 29.6% year-over-year.
August 2017 Greater Boston Real Estate Market TrendsJoe Schutt
The document provides market insights for August 2017 on single-family homes, condominiums, and multi-family homes in Greater Boston. Key points include:
- Single-family home sales decreased 7.2% year-over-year while the median sales price increased 6.1% to a record high of $610,000.
- Condo sales fell 4.7% compared to last August but the median sales price rose 7.0% to a new high of $535,000.
- Multi-family home sales were down 16.2% from August 2016.
October 2017 Greater Boston Real Estate Market TrendsJoe Schutt
The document provides housing market data for Greater Boston for October 2017. Some key points:
- Single-family home sales increased 14.3% from October 2016 and the median sales price reached a new record high of $568,000, up 8.2%.
- Condo sales increased 1.8% from the previous October and the median sales price set a new October record at $511,525, rising 6.6%.
- Multi-family home sales declined 9.3% year-over-year while median prices increased for all property types except 4-family homes.
February 2017 Greater Boston Real Estate Market ReportJoe Schutt
This document provides real estate market data and statistics for Greater Boston for February 2017. It shows that in February 2017, 504 single family homes were sold, a 14.4% decline from the previous year. The median selling price for single family homes also declined by 2.4%. Condo sales declined slightly by 3.8% while the median price rose 14.7% year-over-year. Multi-family home sales decreased 24.5% overall with the largest decline in two-family home sales. The document also provides more granular data by region within Greater Boston.
Residential real estate activity in San Francisco County saw decreases in new listings, median sales prices, and inventory in April 2019 compared to the previous year. New listings were down 26.7% for single family homes and 22.8% for condos. The median sales price was down 0.9% for single family homes and 2.4% for condos. Months of inventory decreased 13% for single family homes and 14.3% for condos. However, pending sales increased for both single family homes and condos compared to the previous year.
March 2017 Greater Boston Real Estate Market TrendsJoe Schutt
The document provides market insights data for March 2017 on single-family homes, condominiums, and multi-family homes in the Greater Boston area. It shows that in March 2017, sales of single-family homes increased 5.6% compared to the previous year, with the median sales price rising 17.5%. Condominium sales rose 7.1% with the median price up 8.6%. Multi-family home sales declined 10.8% compared to the prior year. The report also includes sub-market data for different regions.
- The median sales price for single family homes increased 8.3% year-over-year to $1,760,000, while the median sales price for condos increased 11.1% to $1,300,000.
- New listings were down 37.4% for single family homes and 40.8% for condos compared to the previous year. Pending sales decreased for both single family homes and condos.
- The report provides key housing market metrics for San Francisco for the month of June 2019.
- Residential real estate activity in San Francisco County saw a decrease in new listings, pending sales, and median sales price for single family homes in February 2019 compared to the previous year, while condo sales saw an increase in median sales price but decreases in new listings, pending sales, and sold listings.
- Weather negatively impacted real estate activity in February but home sales have proven resilient overall.
- Economic fundamentals remain positive for the housing market despite some predictions of a tougher year.
Home sales in the Metro Vancouver housing market declined below the long-term average in 2019 despite increased demand at the end of the year. Sales increased 3% from 2018 but were still 20.3% below the 10-year average. Prices dipped between 2-4% across property types depending on the area. Listings decreased from 2018 but were still below the 10-year average, indicating low inventory. Home buyer confidence improved in the second half of the year, leading to above average sales in the fourth quarter of 2019.
The document provides a monthly snapshot of real estate market data and metrics for San Francisco County for March 2019. Some key highlights include:
- New listings were down 34.1% for single family homes and 26.9% for condos/co-ops compared to the previous year. Pending sales also decreased.
- The median sales price was down 2.2% to $1,650,000 for single family homes but remained flat at $1,250,000 for condos/co-ops. Months of inventory decreased as well.
- Residential real estate activity saw declines across several metrics compared to the previous year, indicating a slowing market. The Federal Reserve also recently announced no further
- Sales and new listings in the Fraser Valley set records in August 2020, with 2,039 sales (up 57.2% year-over-year) and 3,309 new listings (up 40.4% year-over-year).
- The average prices of single-family homes, townhomes, and apartments all increased compared to August 2019, with benchmark prices up 6.9%, 3%, and 4% respectively.
- REB President Chris Shields noted the market remains competitive with multiple offers and shorter days on market, and consumers are seeking expert guidance from REALTORS.
Similar to Gbar monhtly-market-insight-report-nov2019 (20)
Serviced Apartment Ho Chi Minh For RentalGVRenting
GVRenting is the leading rental real estate company in Vietnam. We help you to find a serviced apartment for rent in Ho Chi Minh & Saigon. Discover our broad range of rental properties in Vietnam.
For more details https://gvrenting.com/
AVRUPA KONUTLARI ESENTEPE - ENGLISH - Listing TurkeyListing Turkey
Looking for a new home in Istanbul? Look no further than Avrupa Konutlari Esentepe! Our beautifully designed homes provide the perfect blend of luxury and comfort, making them the perfect choice for anyone looking for a high-quality home in the city.
With a wide range of apartment types available, from 1+1 to 4+1, we have something to suit every need and budget. Each apartment is designed with attention to detail and features spacious and bright living areas, making them the perfect place to relax and unwind after a long day.
One of the things that sets Avrupa Konutlari Esentepe apart from other developments is our focus on creating a community that is both comfortable and convenient. Our homes are surrounded by lush green spaces, perfect for enjoying a peaceful stroll or having a picnic with friends and family. Additionally, our complex includes a variety of social and recreational amenities, such as swimming pools, sports fields, and playgrounds, making it easy for residents to stay active and socialize with their neighbors.
https://listingturkey.com/property/avrupa-konutlari-esentepe/
Discover Yeni Eyup Evleri 2, nestled among the rising values of Eyupsultan, offering the epitome of modern living in Istanbul.
With its spacious living areas, contemporary architecture, and meticulous details, Yeni Eyup Evleri 2 is poised to be the star of your happiest moments. Situated in the new favorite district of Eyupsultan, claim your spot and unlock the doors to a peaceful life alongside your loved ones. Nestled next to the historical and natural beauties of Eyupsultan, embrace the comfort of modern living and rediscover life.
Social Amenities:
Yeni Eyup 2 offers a life filled with joy with its green landscaping areas, gym, sauna, children’s play areas, café, outdoor pool, and basketball court. Reserve your place for unforgettable moments!
Reliable Structure:
With 1+1, 2+1, and 3+1 apartment options, Yeni Eyup Evleri 2 is designed with first-class materials and craftsmanship. The doors to a safe and comfortable life are here! Choose the option that suits you best and step into your dream home.
Project:
Yeni Eyup 2 is conveniently located, with Istanbul Airport just 26 minutes away, the Mecidiyeköy Metro Line 4 minutes away, and the Tram Stop 5 minutes away, making your life easier with its central location.
Location:
Your home is positioned in a privileged location, providing easy access to the city center, shopping malls, restaurants, schools, and other important places.
Yeni Eyup 2 offers 1+1, 2+1, and 3+1 apartment options designed to meet different needs. Find an option suitable for every lifestyle and open the doors to a comfortable life in your dream home.
https://listingturkey.com/property/yeni-eyup-evleri-2/
The SVN® organization shares a portion of their new weekly listings via their SVN Live® Weekly Property Broadcast. Visit https://svn.com/svn-live/ if you would like to attend our weekly call, which we open up to the brokerage community.
BEST FARMLAND FOR SALE | FARM PLOTS NEAR BANGALORE | KANAKAPURA | CHICKKABALP...knox groups real estate
welcome to knox groups real estate company in Bangalore. best farm land for sale near Bangalore and madhugiri . Managed farmland near Kanakapura and Chickkabalapur get know more details about the projects .Knox groups is a leading real estate company dedicated to helping individuals and businesses navigate the dynamic real estate market. With our extensive knowledge, experience, and commitment to excellence, we deliver exceptional results for our clients. Discover the perfect foundation for your agricultural aspirations with KNOX Groups' prime farm lands. These aren't just plots; they're the fertile grounds where vibrant crops flourish, livestock thrives, and unique agricultural ventures come to life. At KNOX, we go beyond selling land we curate sustainable ecosystems, ensuring that your journey toward agricultural success is seamless and prosperous.
Recent Trends Fueling The Surge in Farmhouse Demand in IndiaFarmland Bazaar
Embarking on the journey to acquire a farmhouse for sale is just the beginning; the real investment lies in crafting an environment that contributes to our mental and physical well-being while satisfying the soul. At Farmlandbazaar.com, India’s leading online marketplace dedicated to farm land, farmhouses, and agricultural lands, we understand the importance of transforming a humble farmland into a warm and inviting sanctuary. Let's explore the fundamental aspects that can elevate your farmhouse into a tranquil haven.