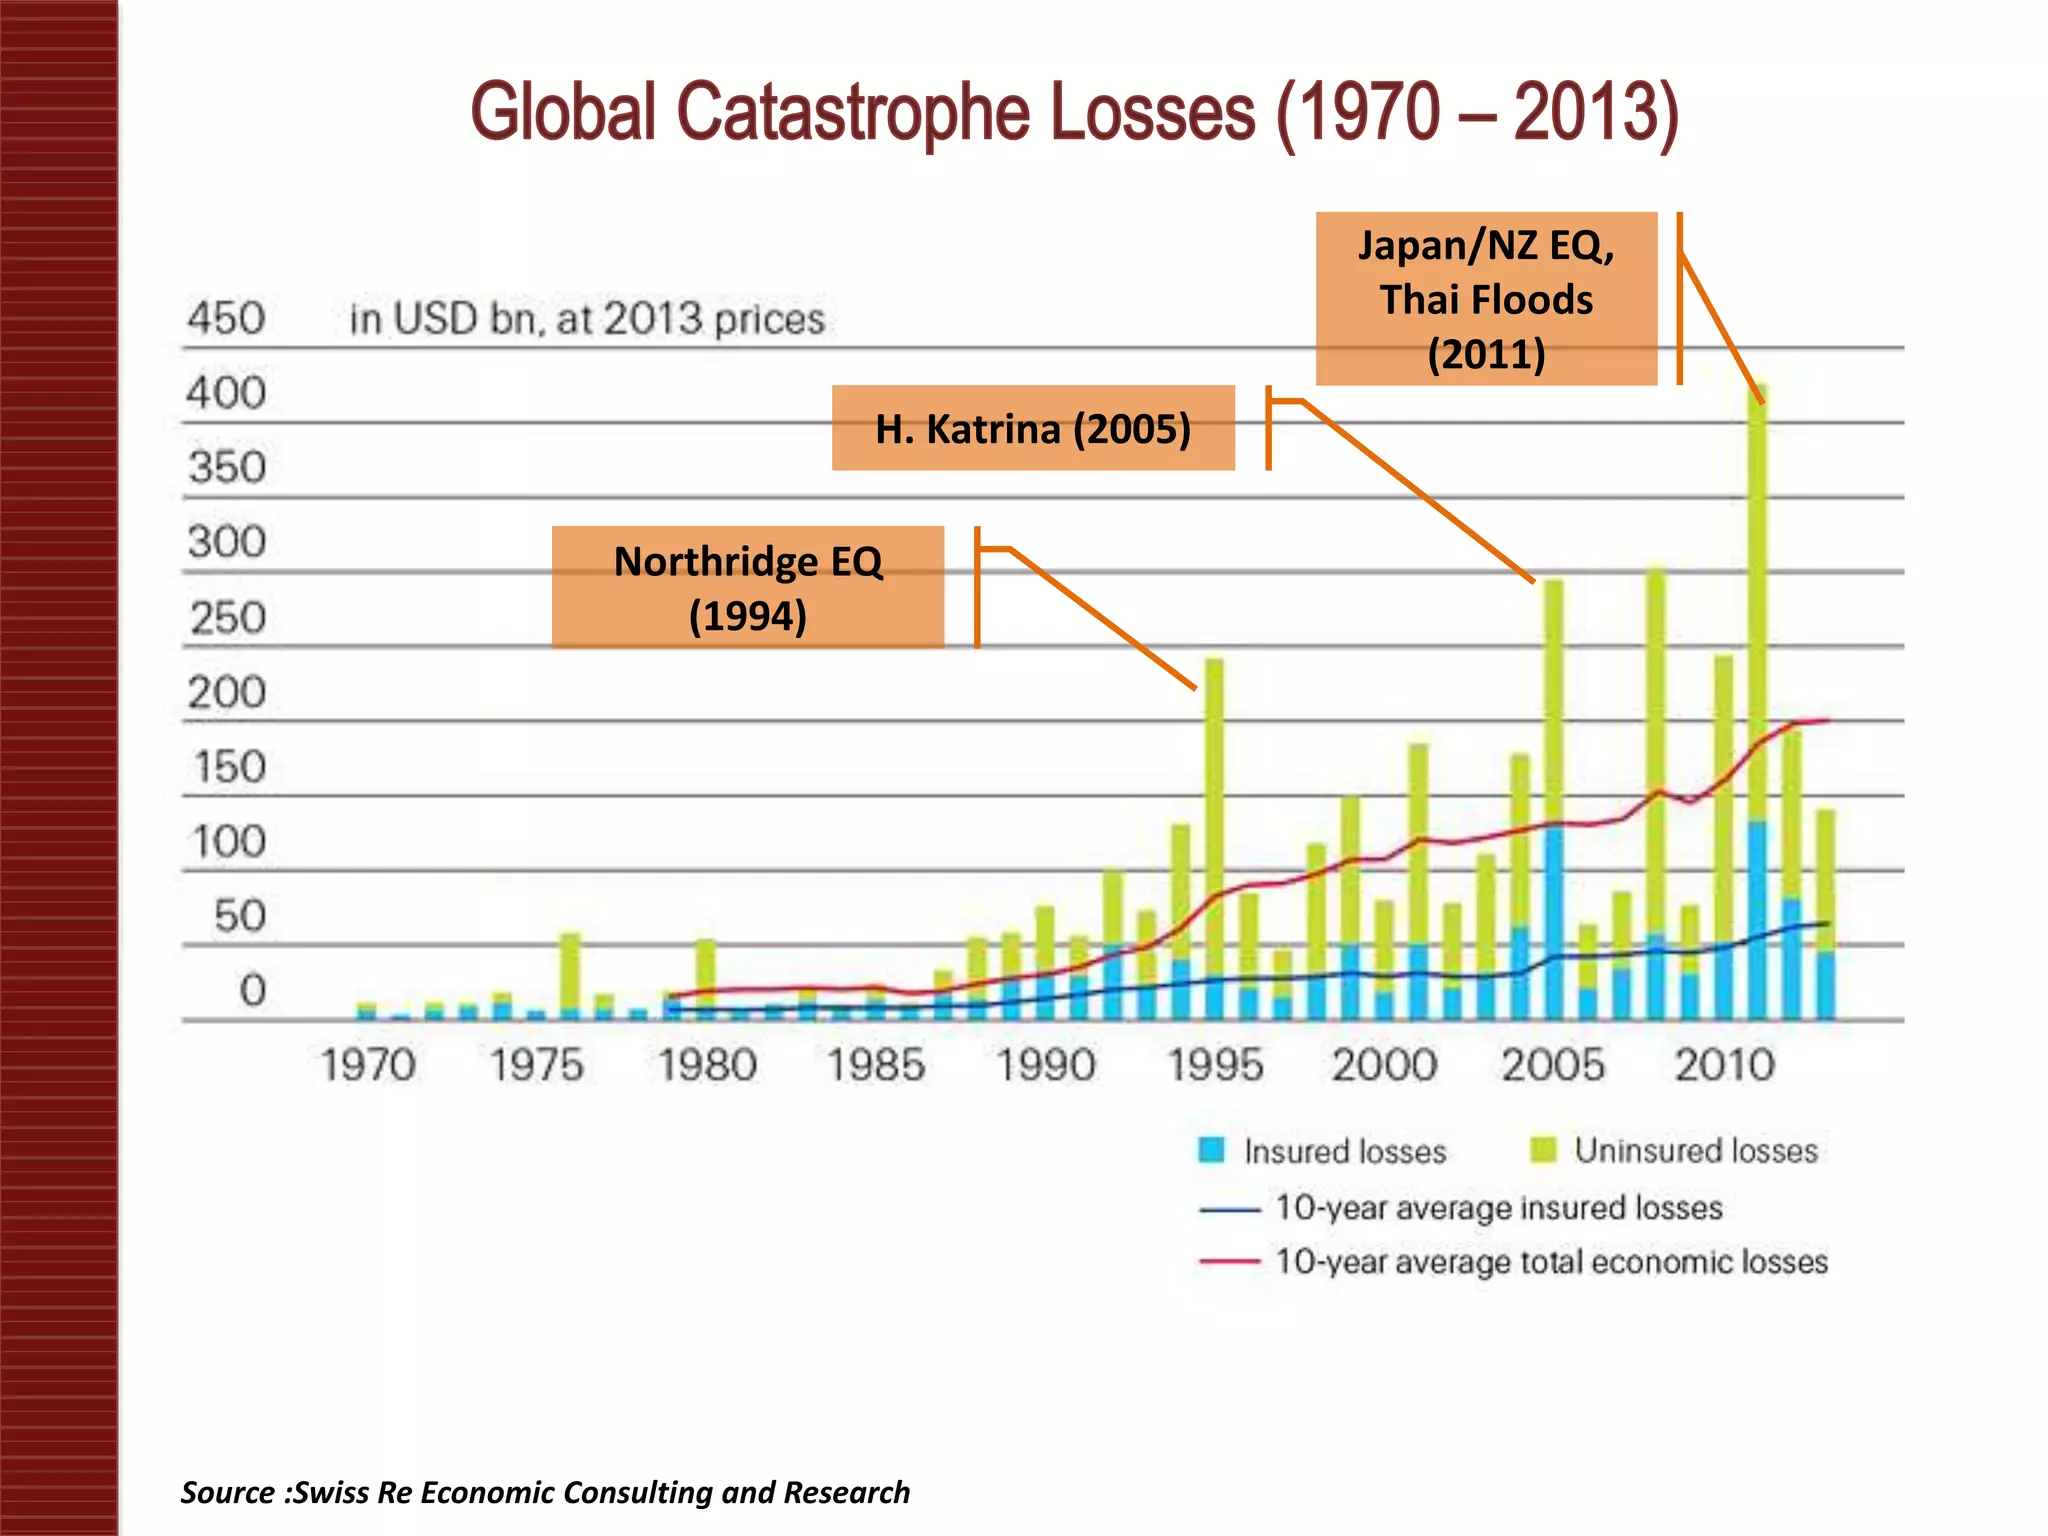
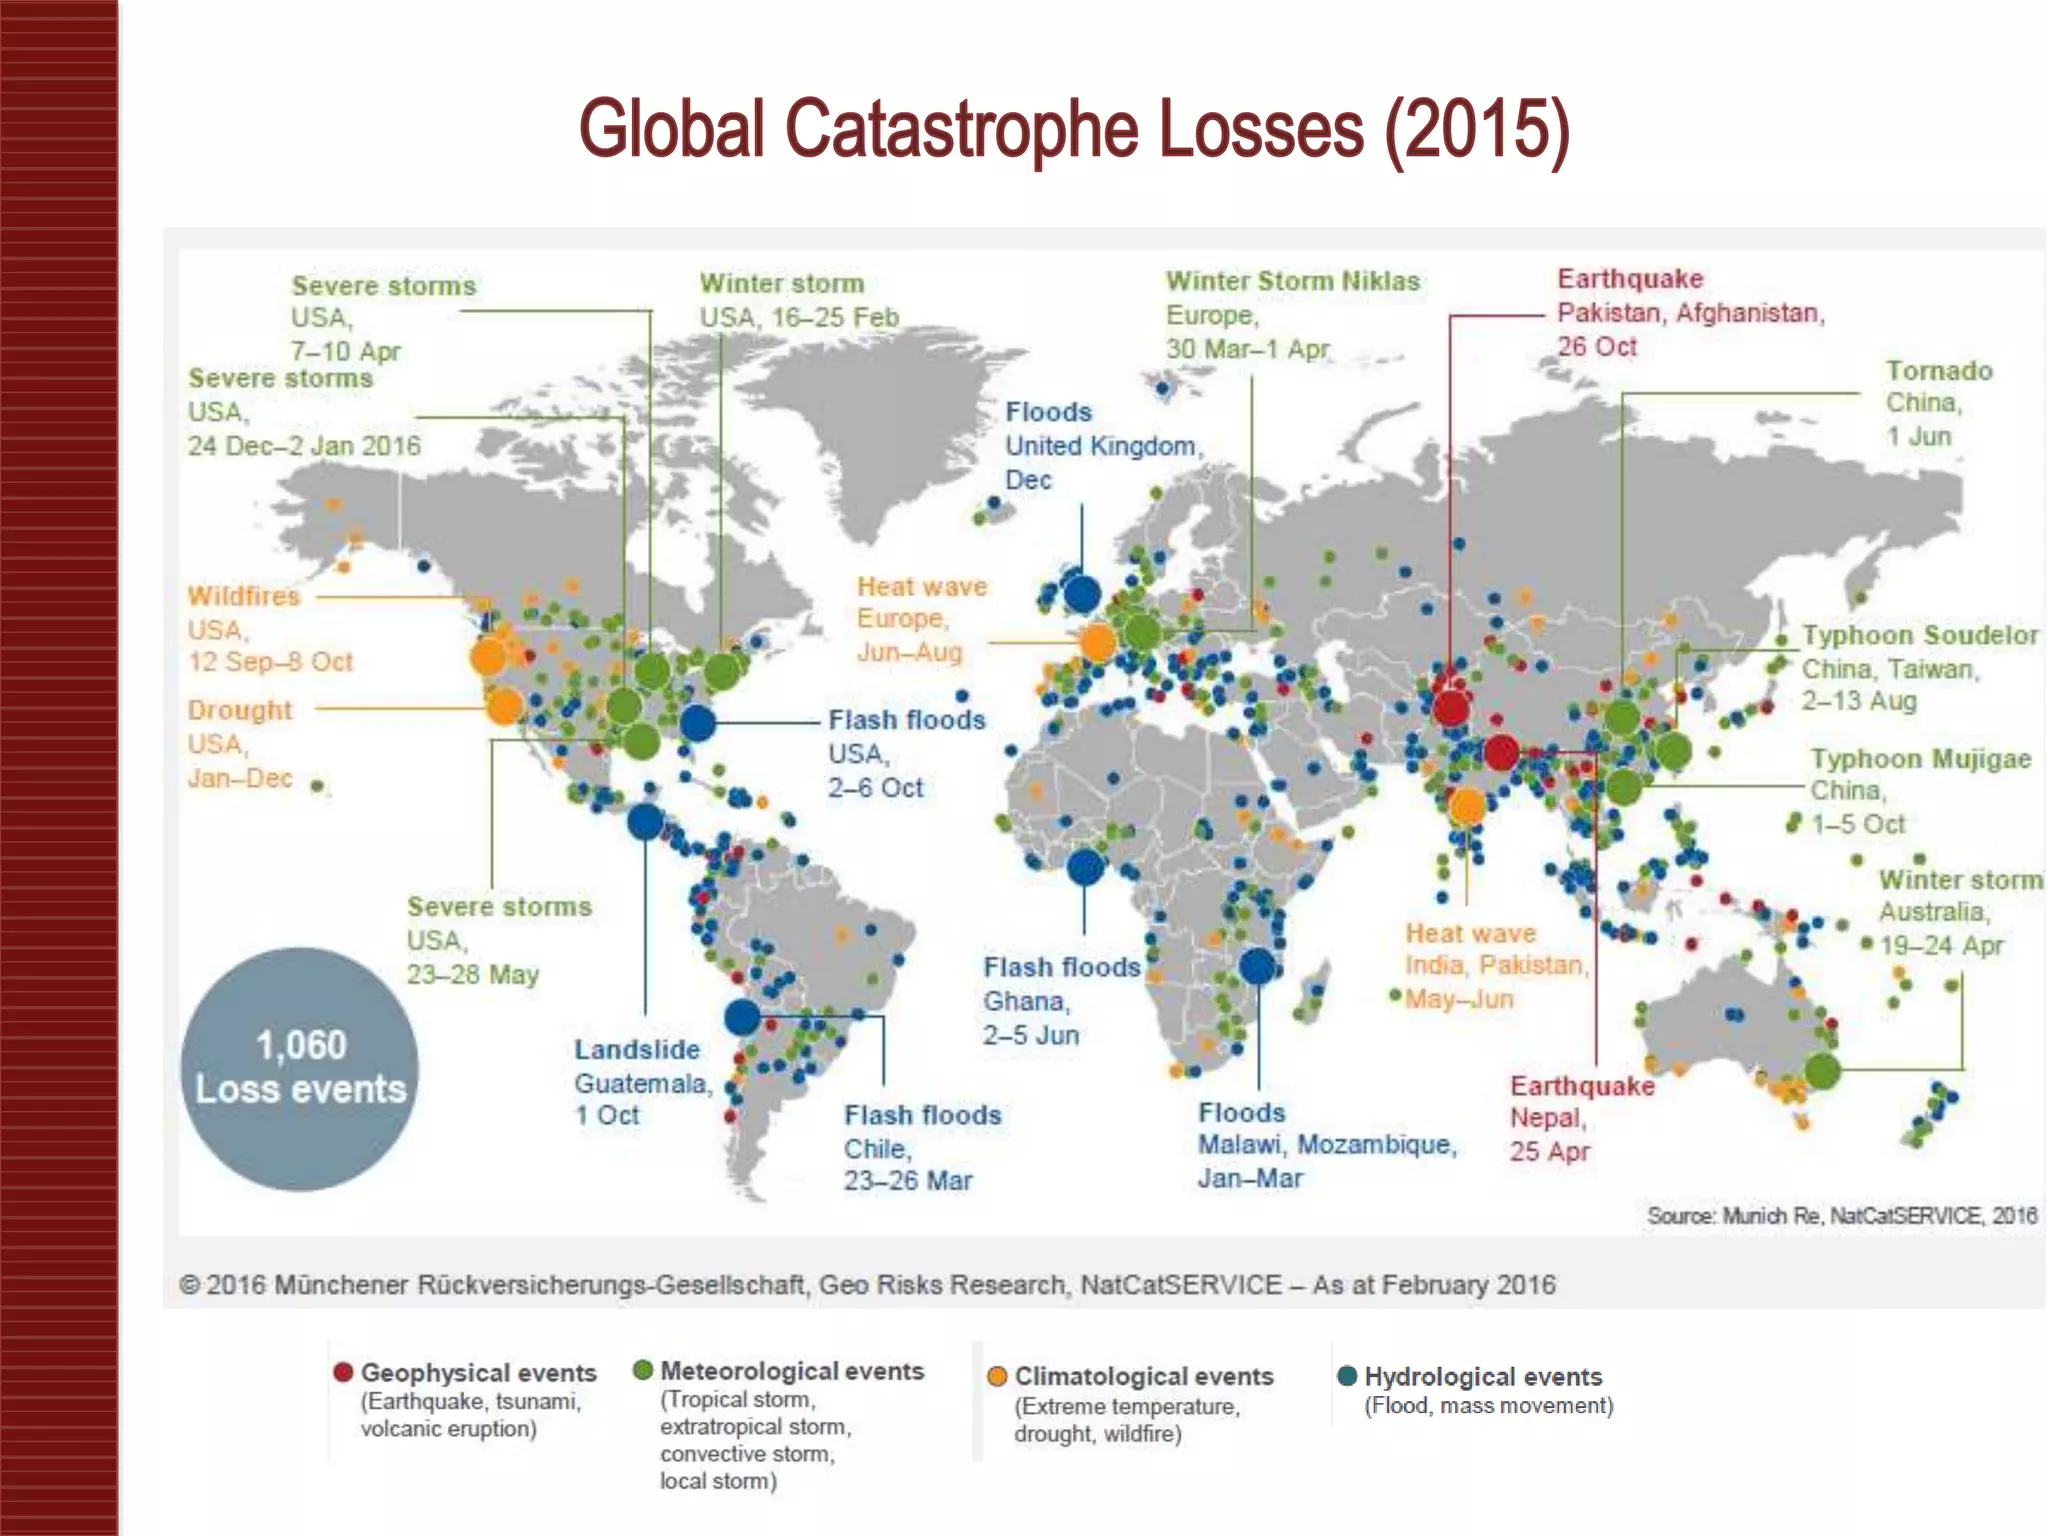
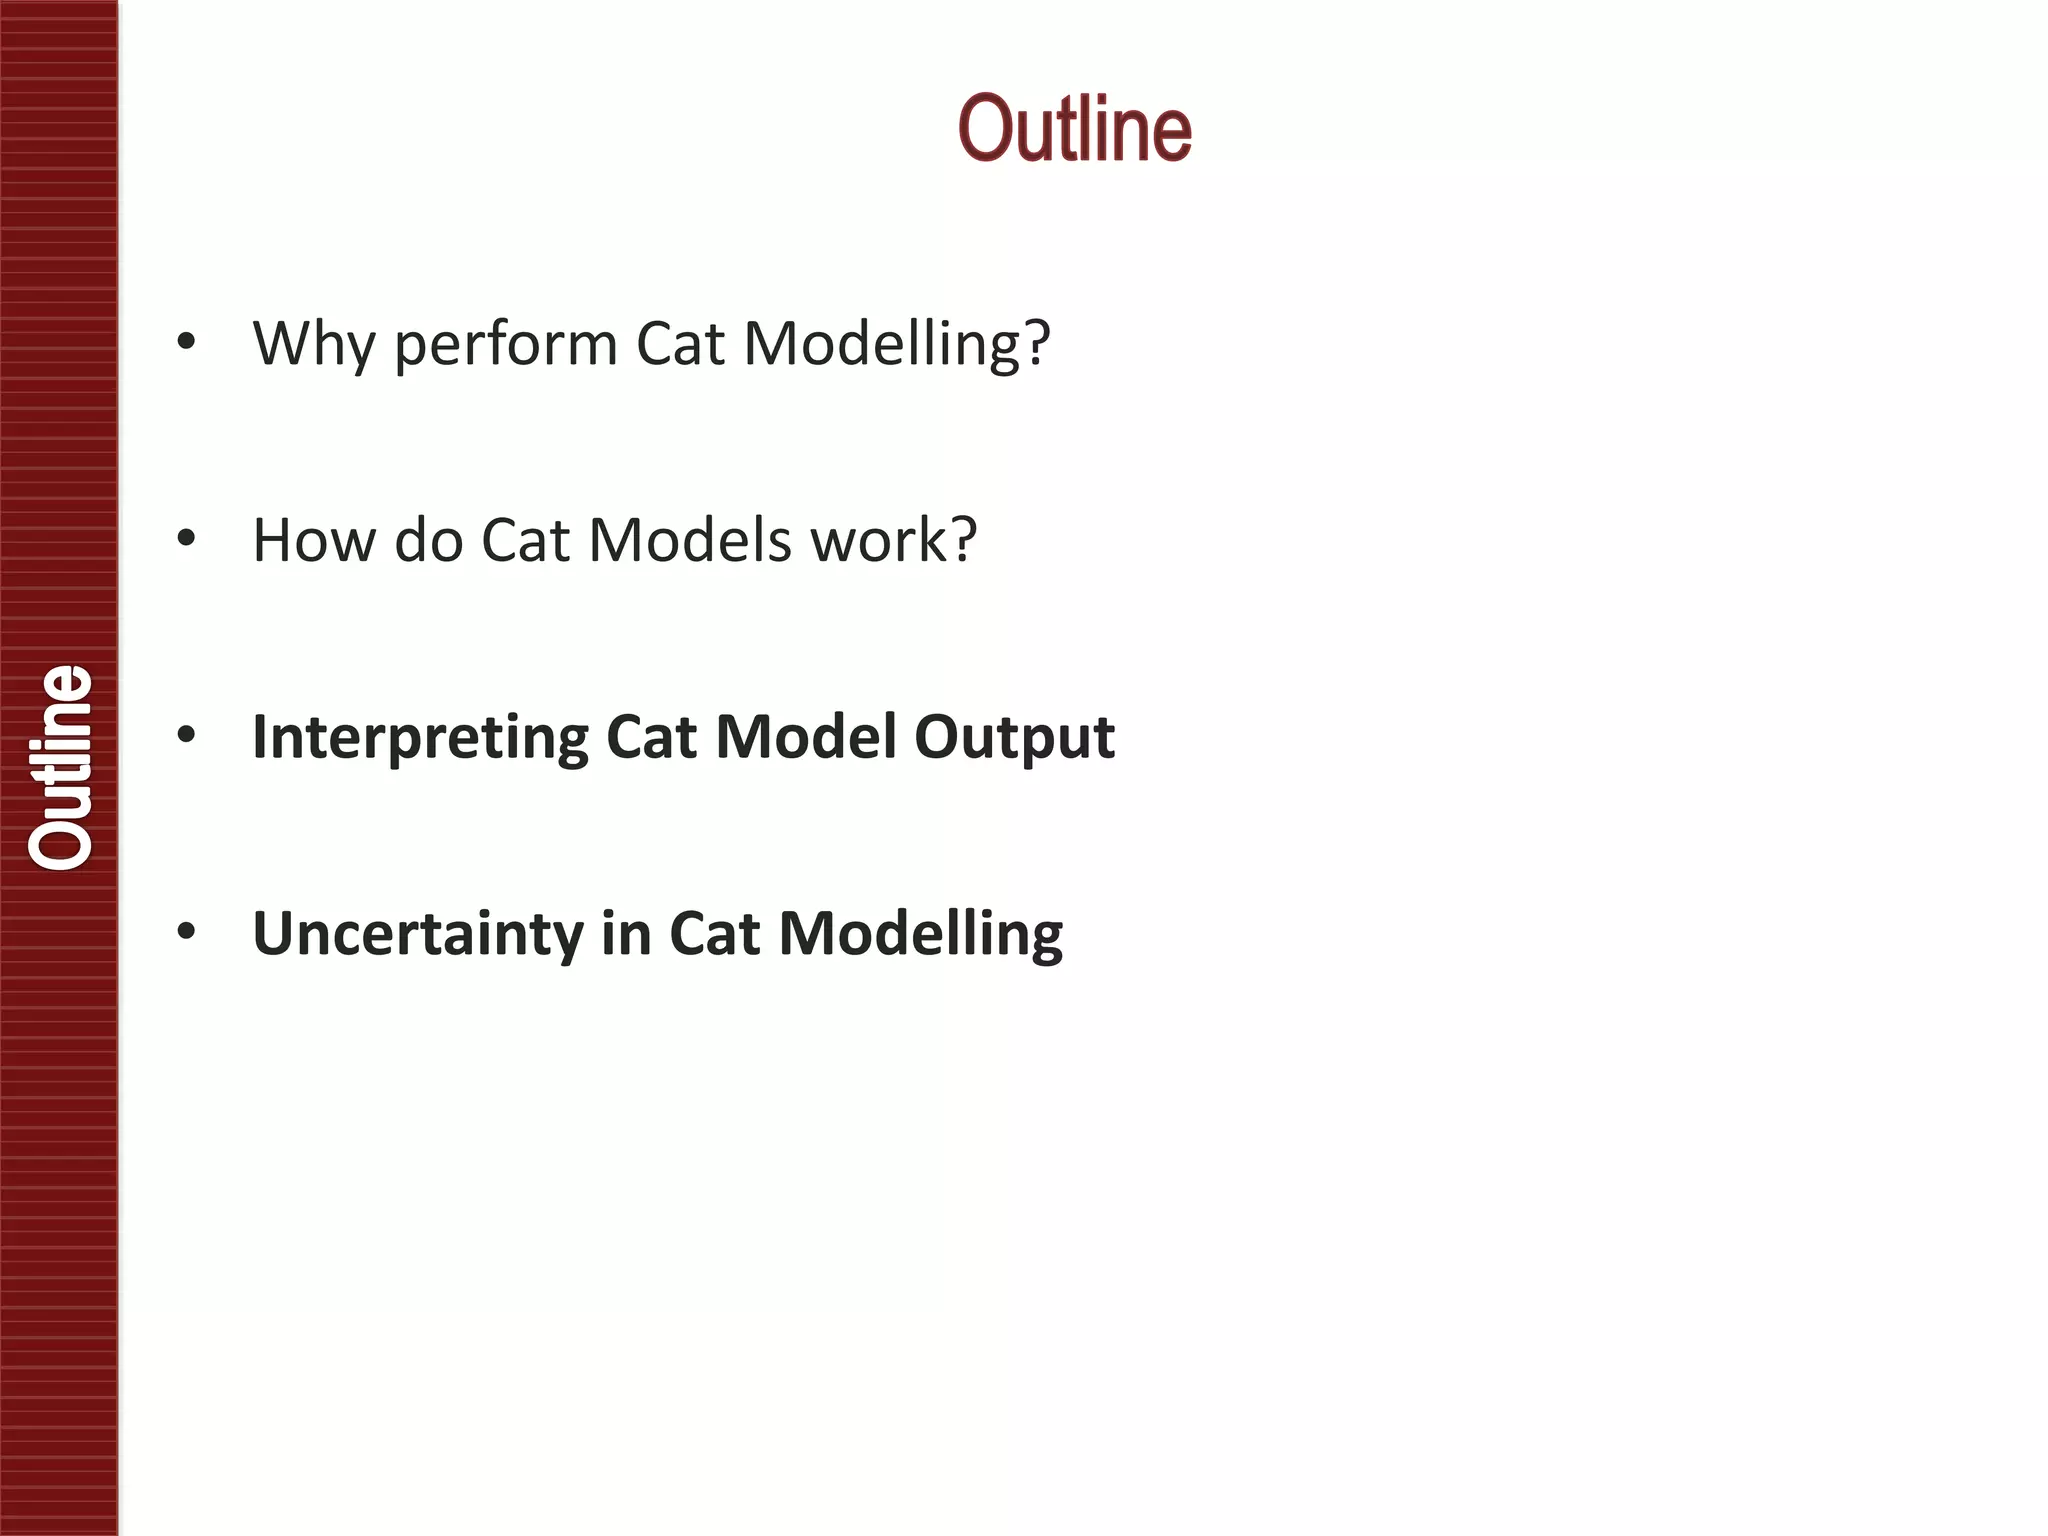
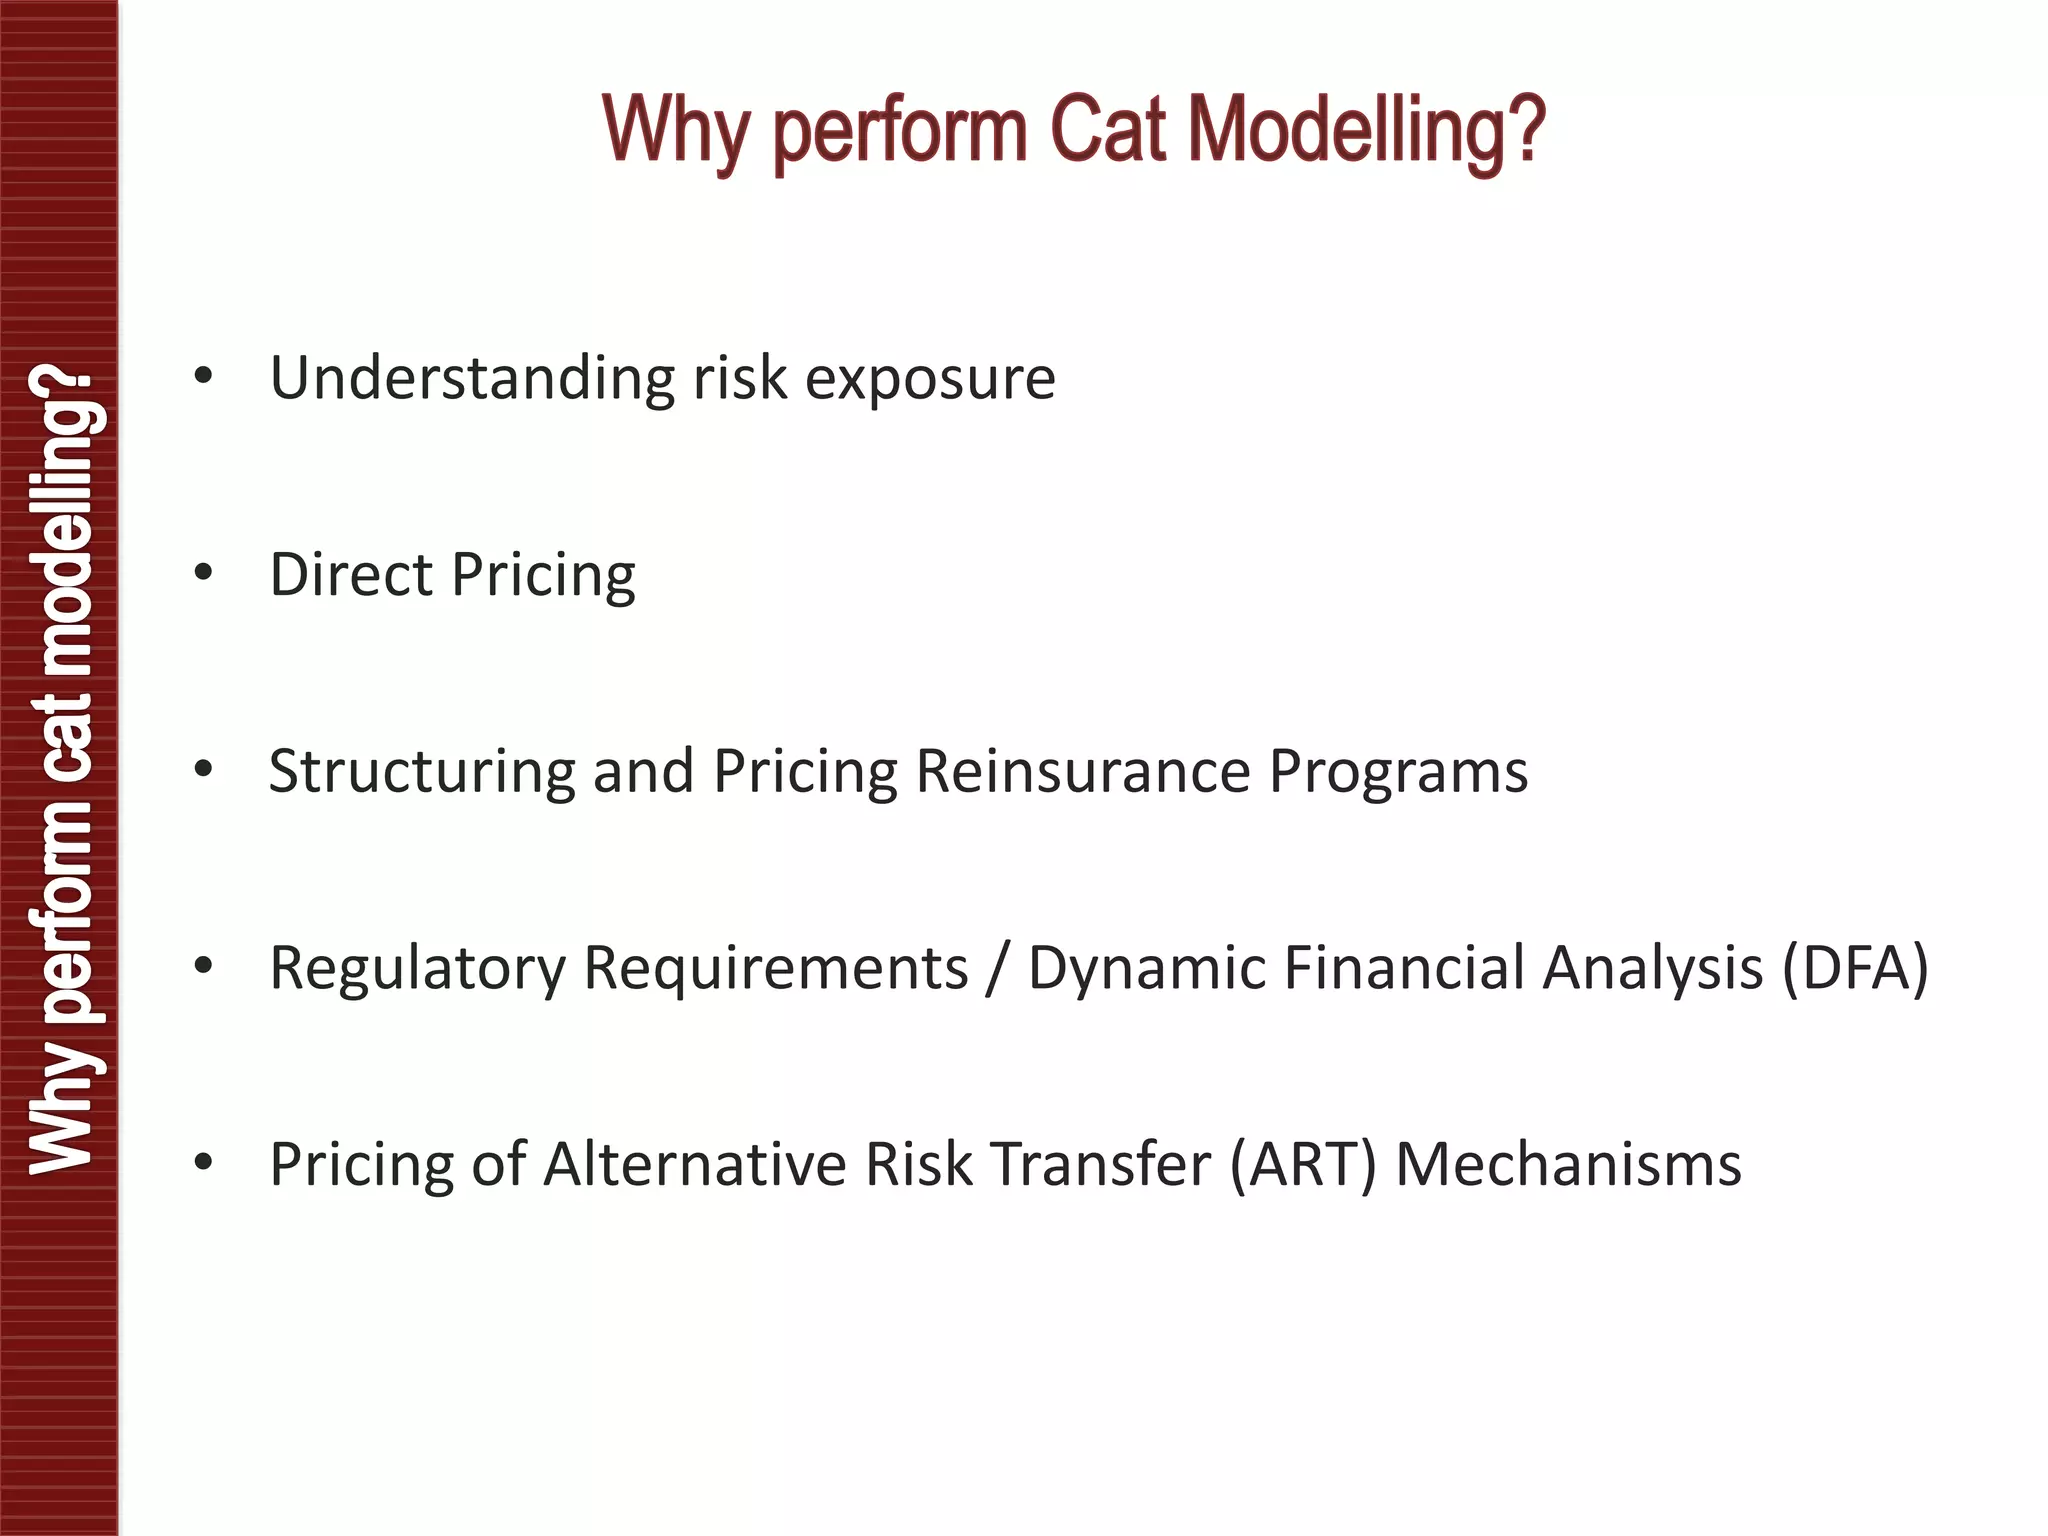
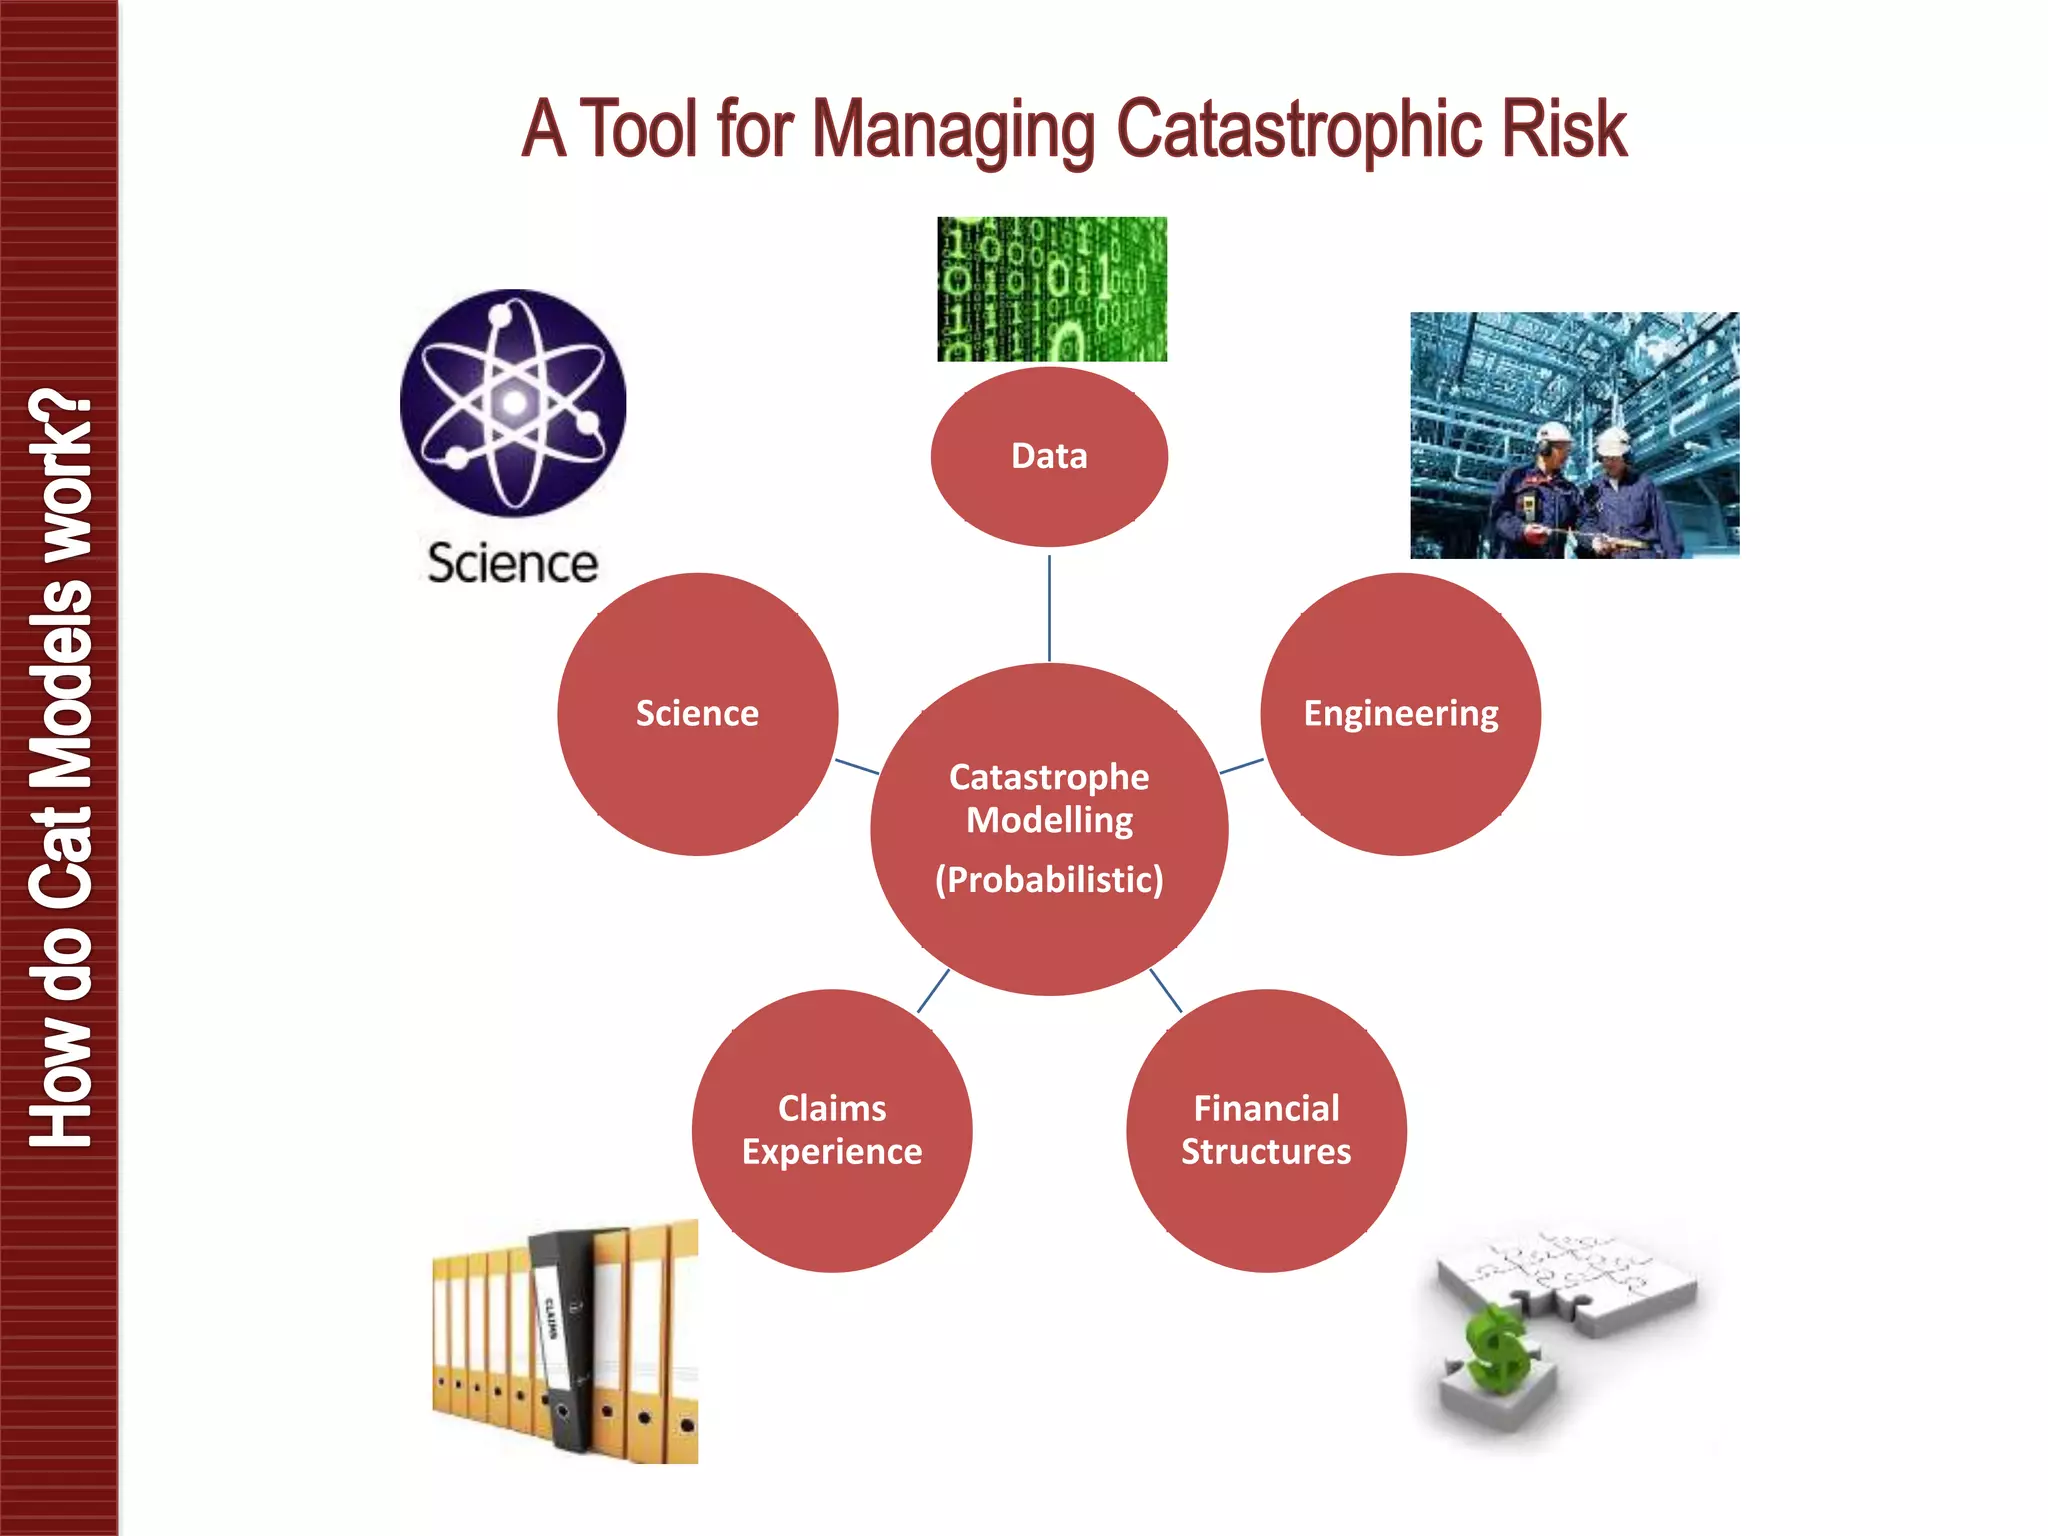
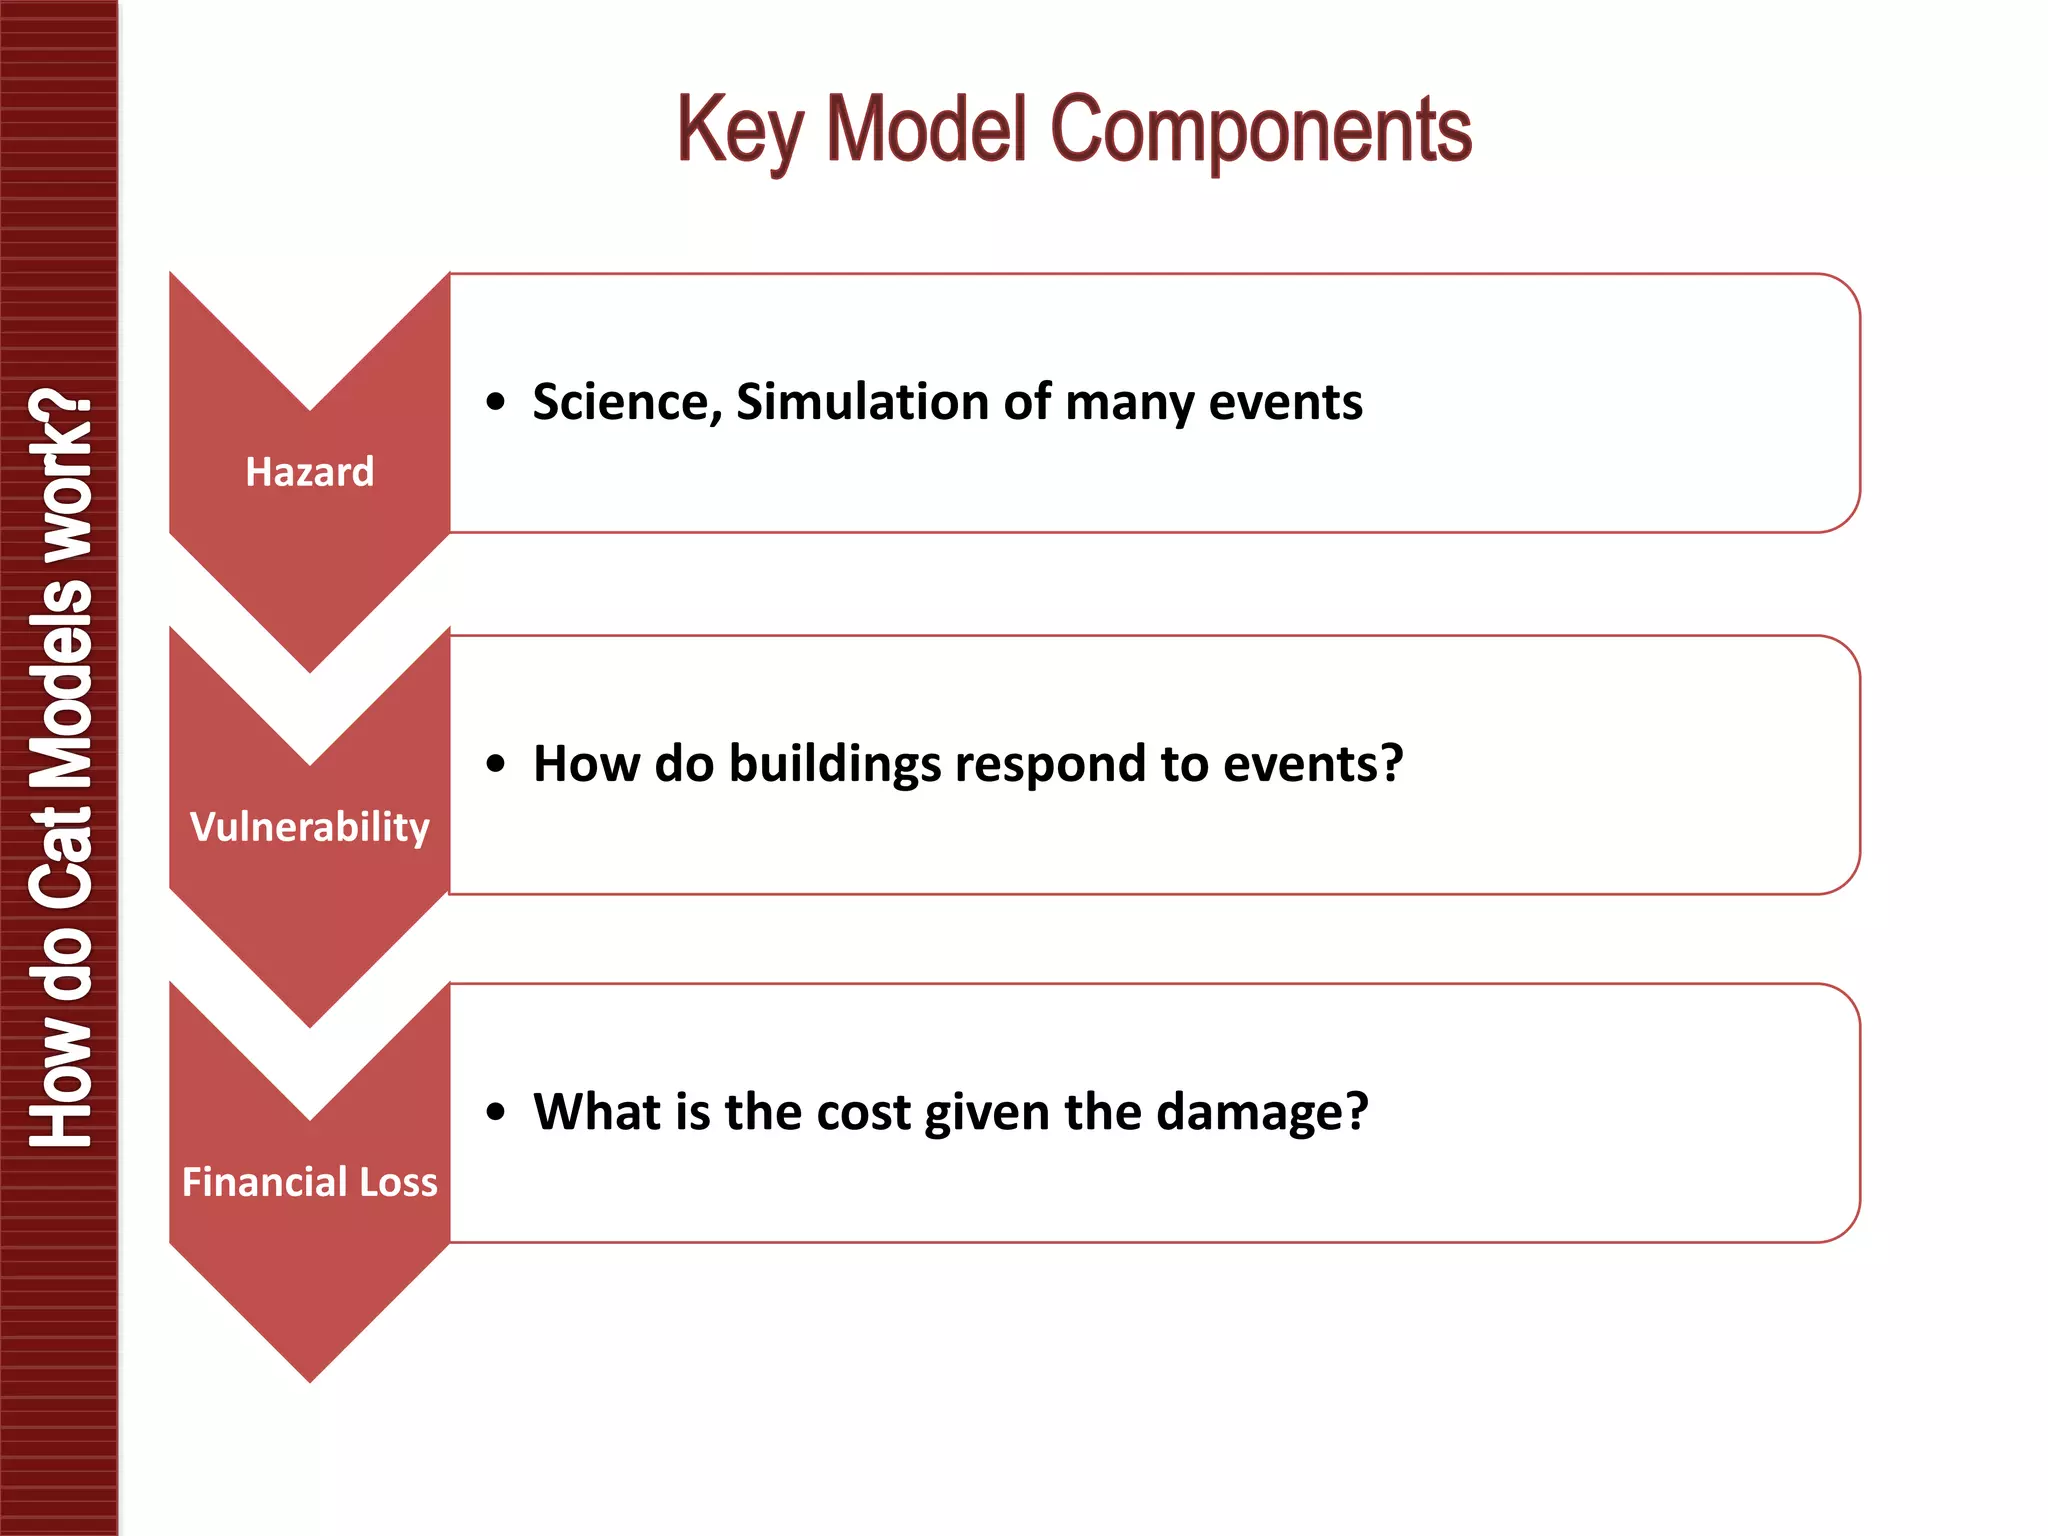
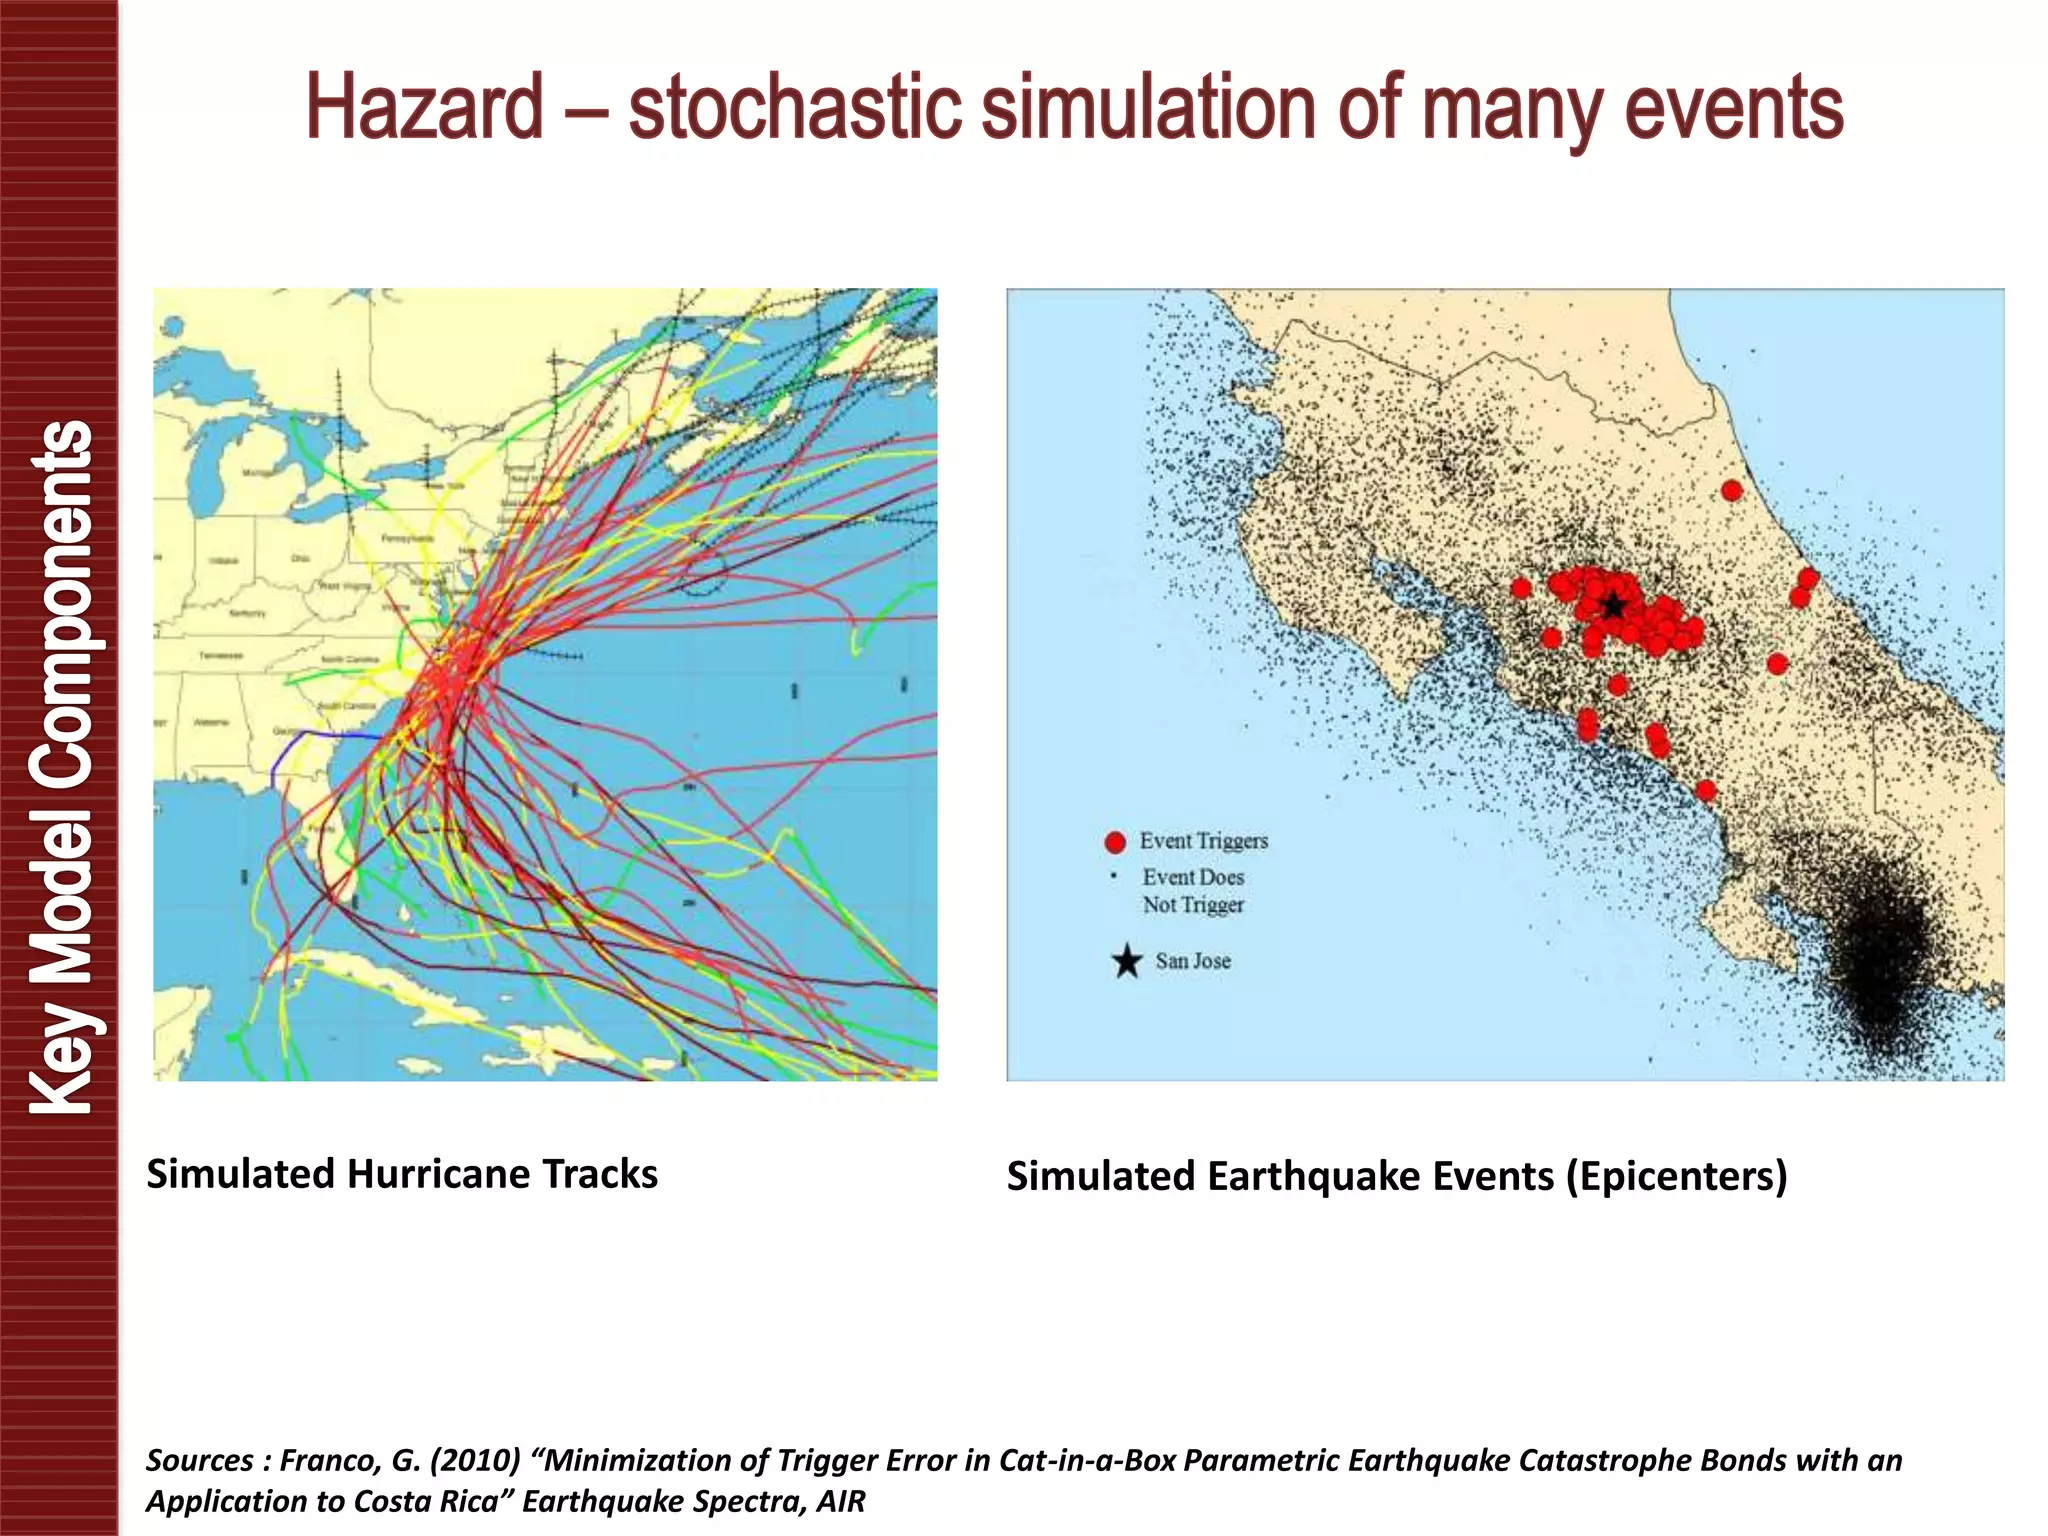
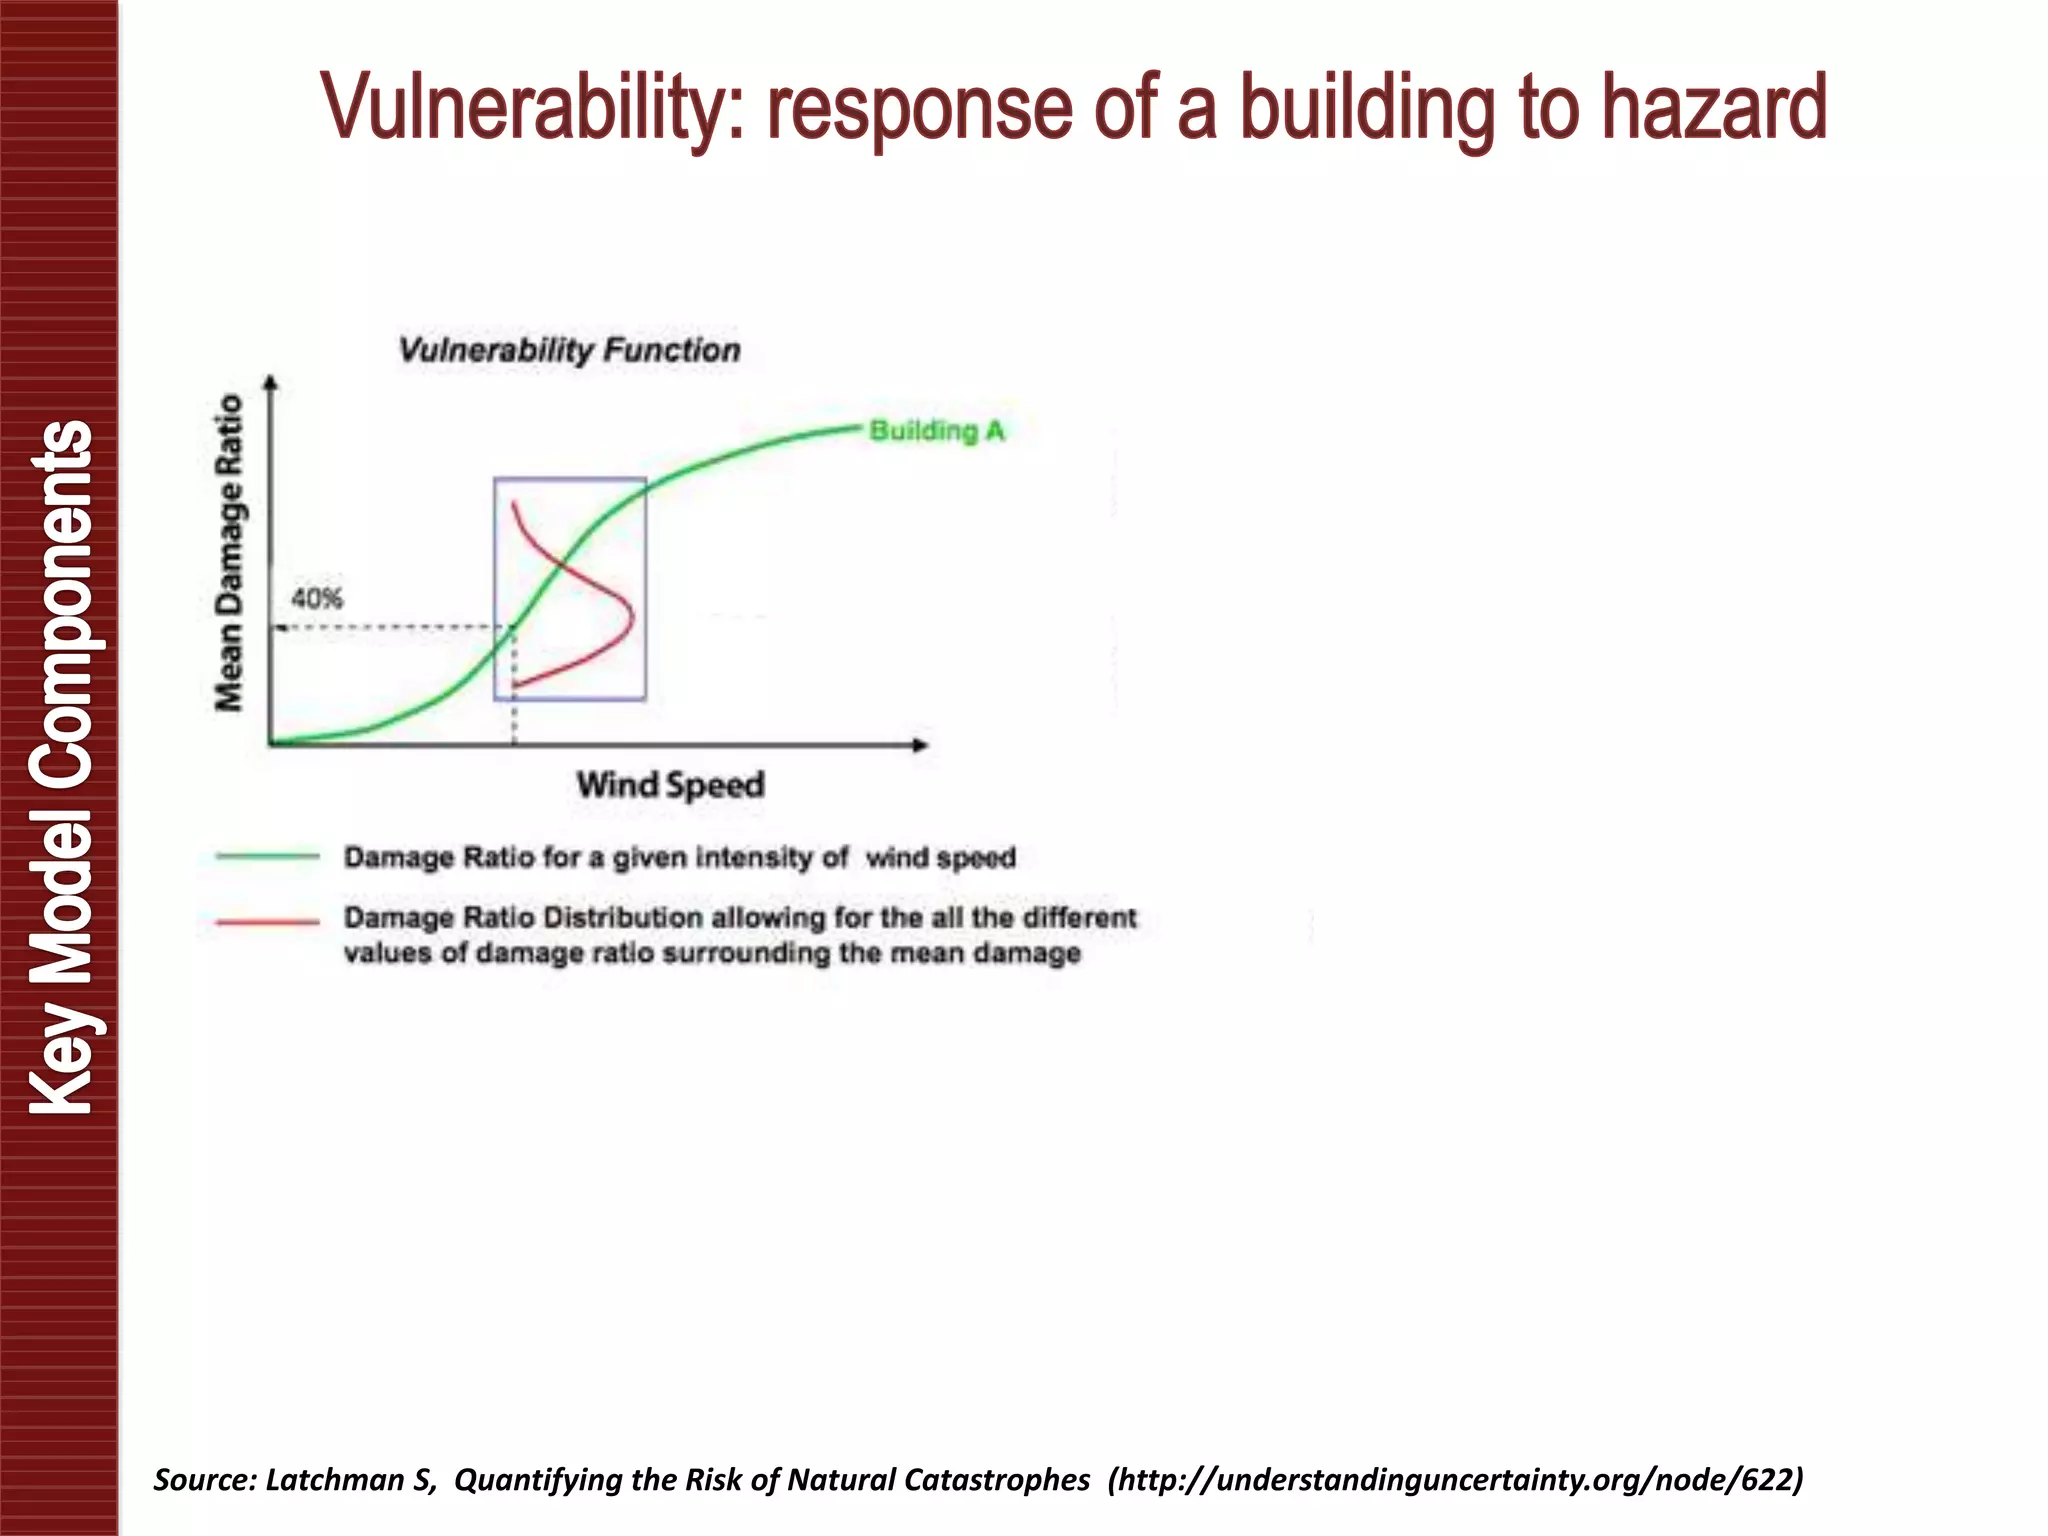
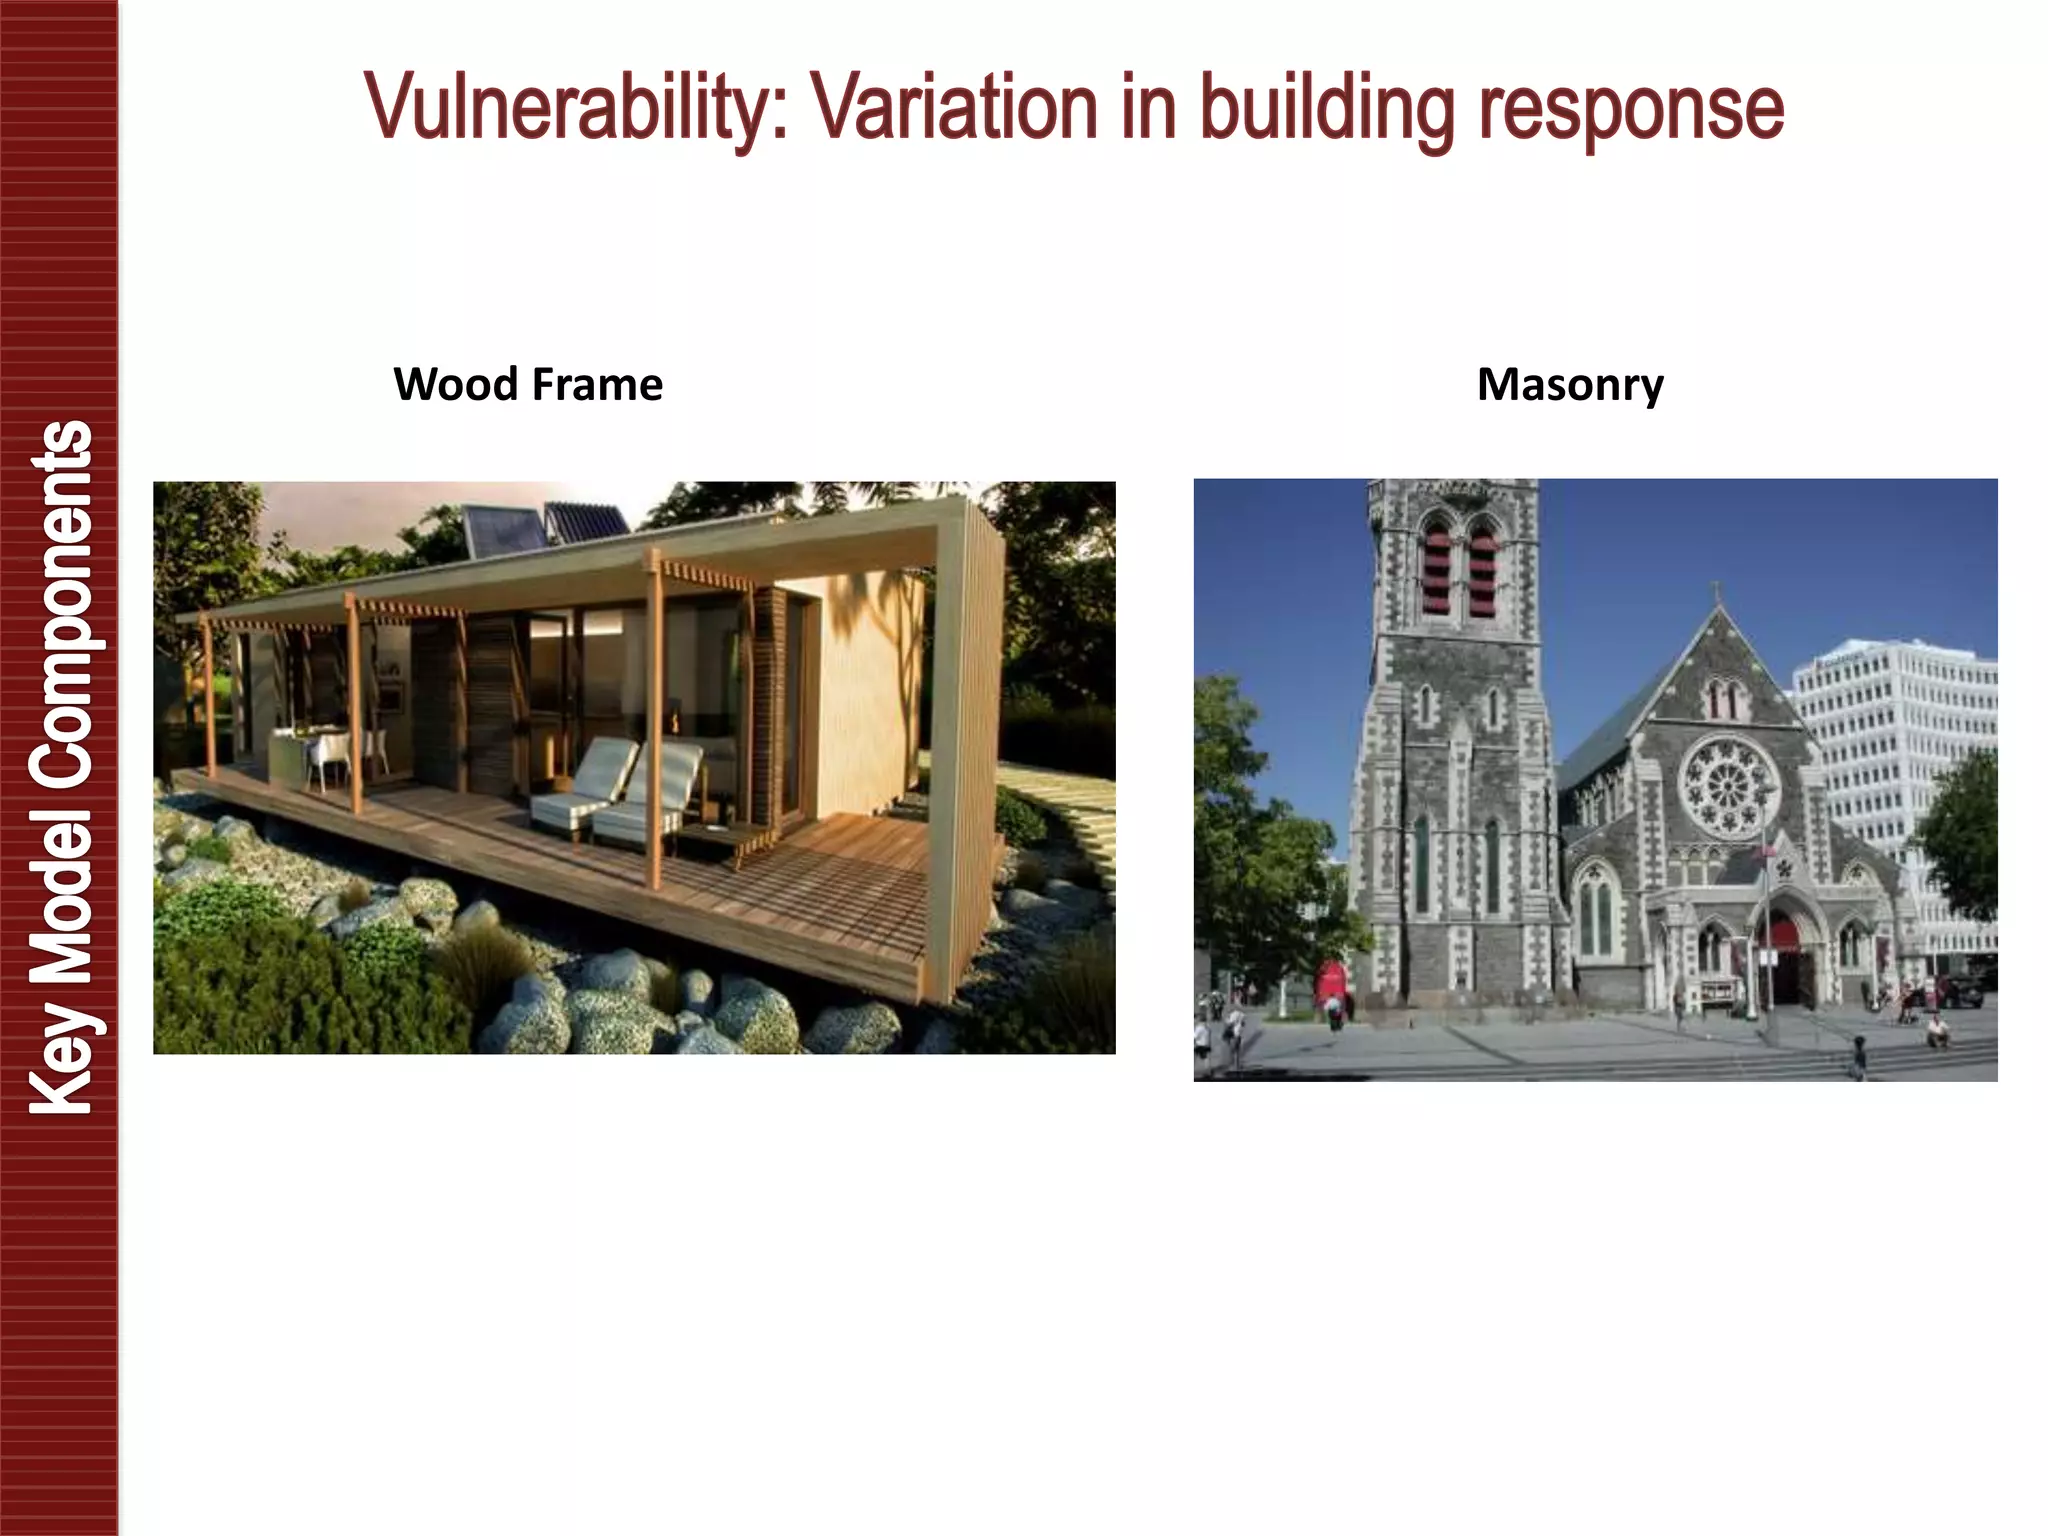
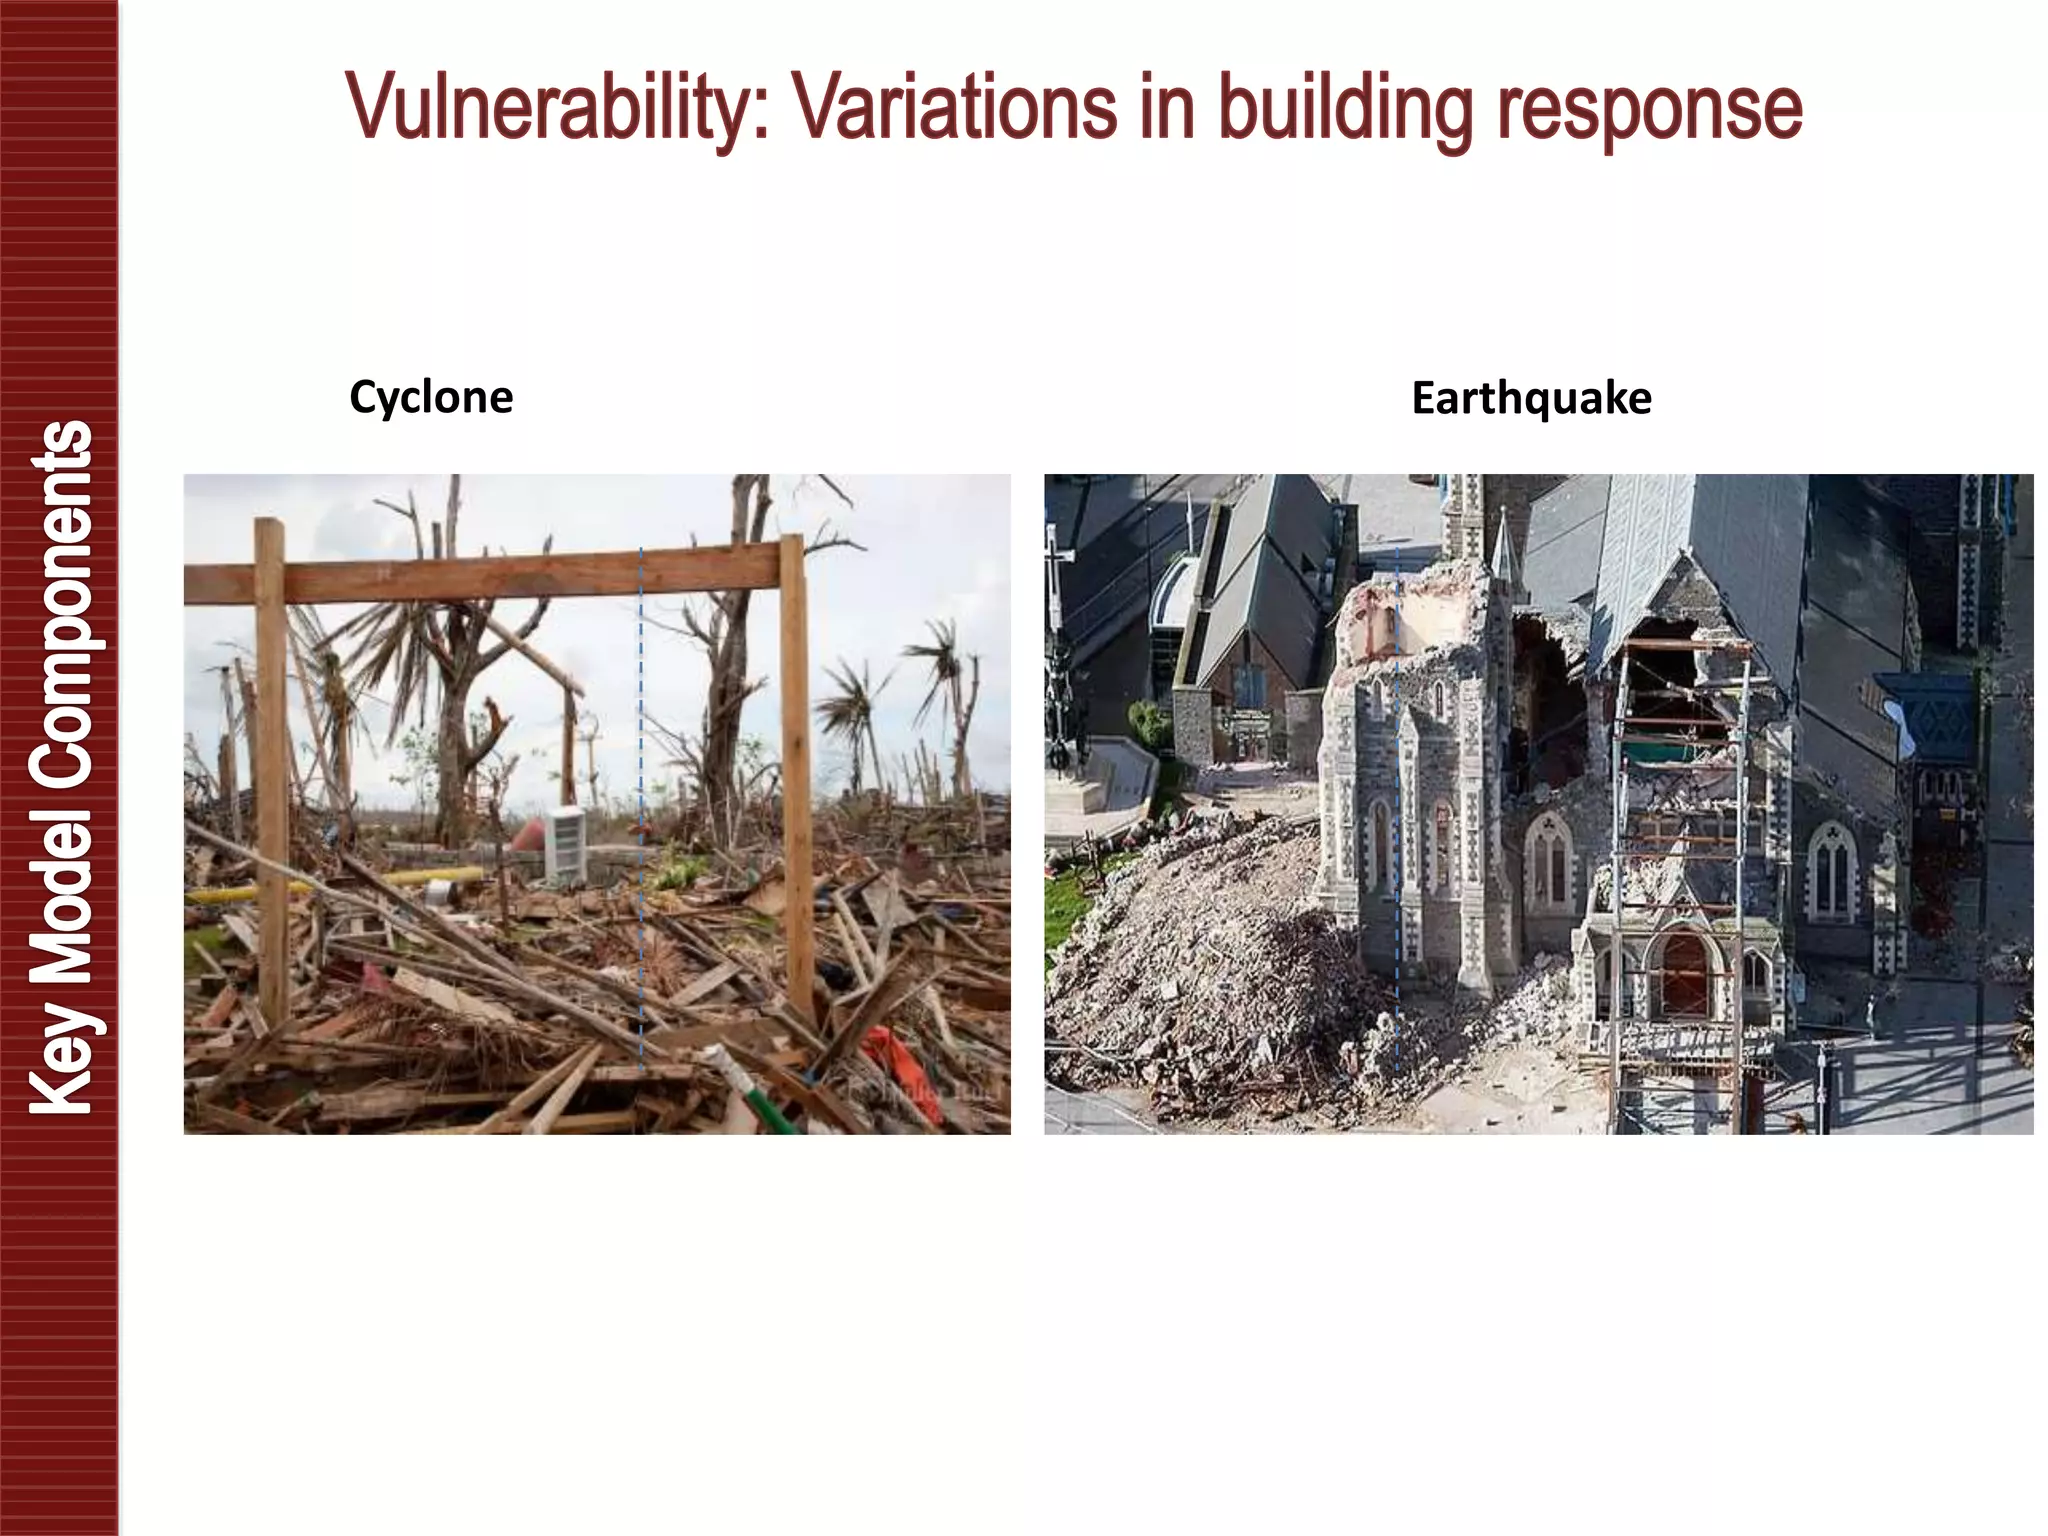
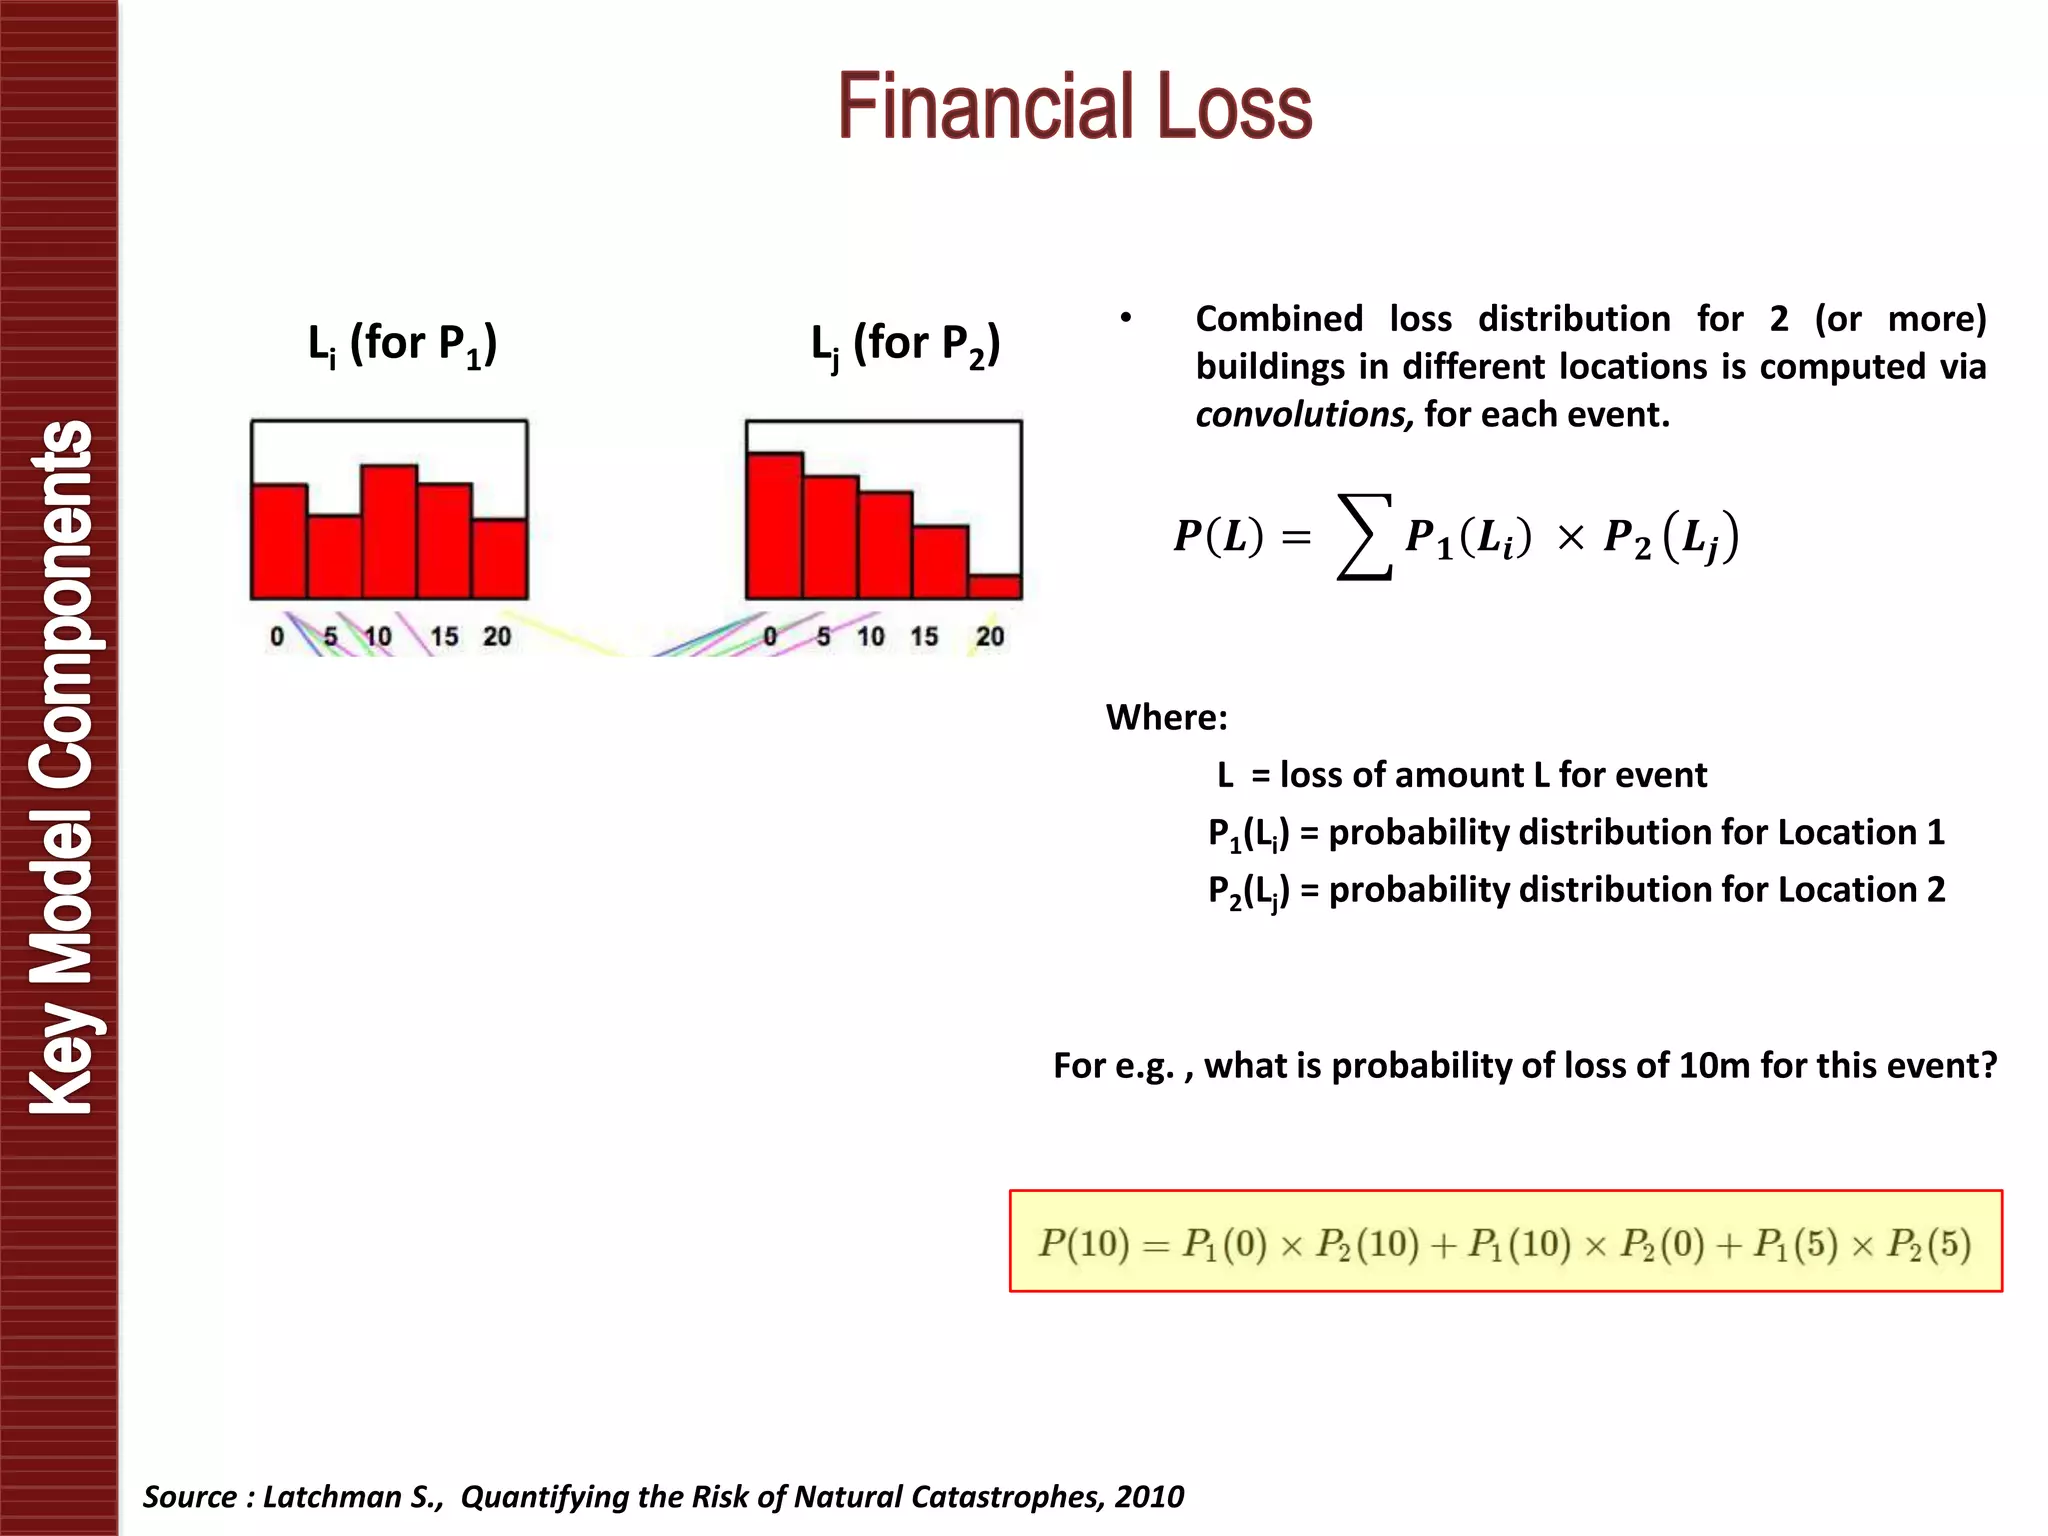
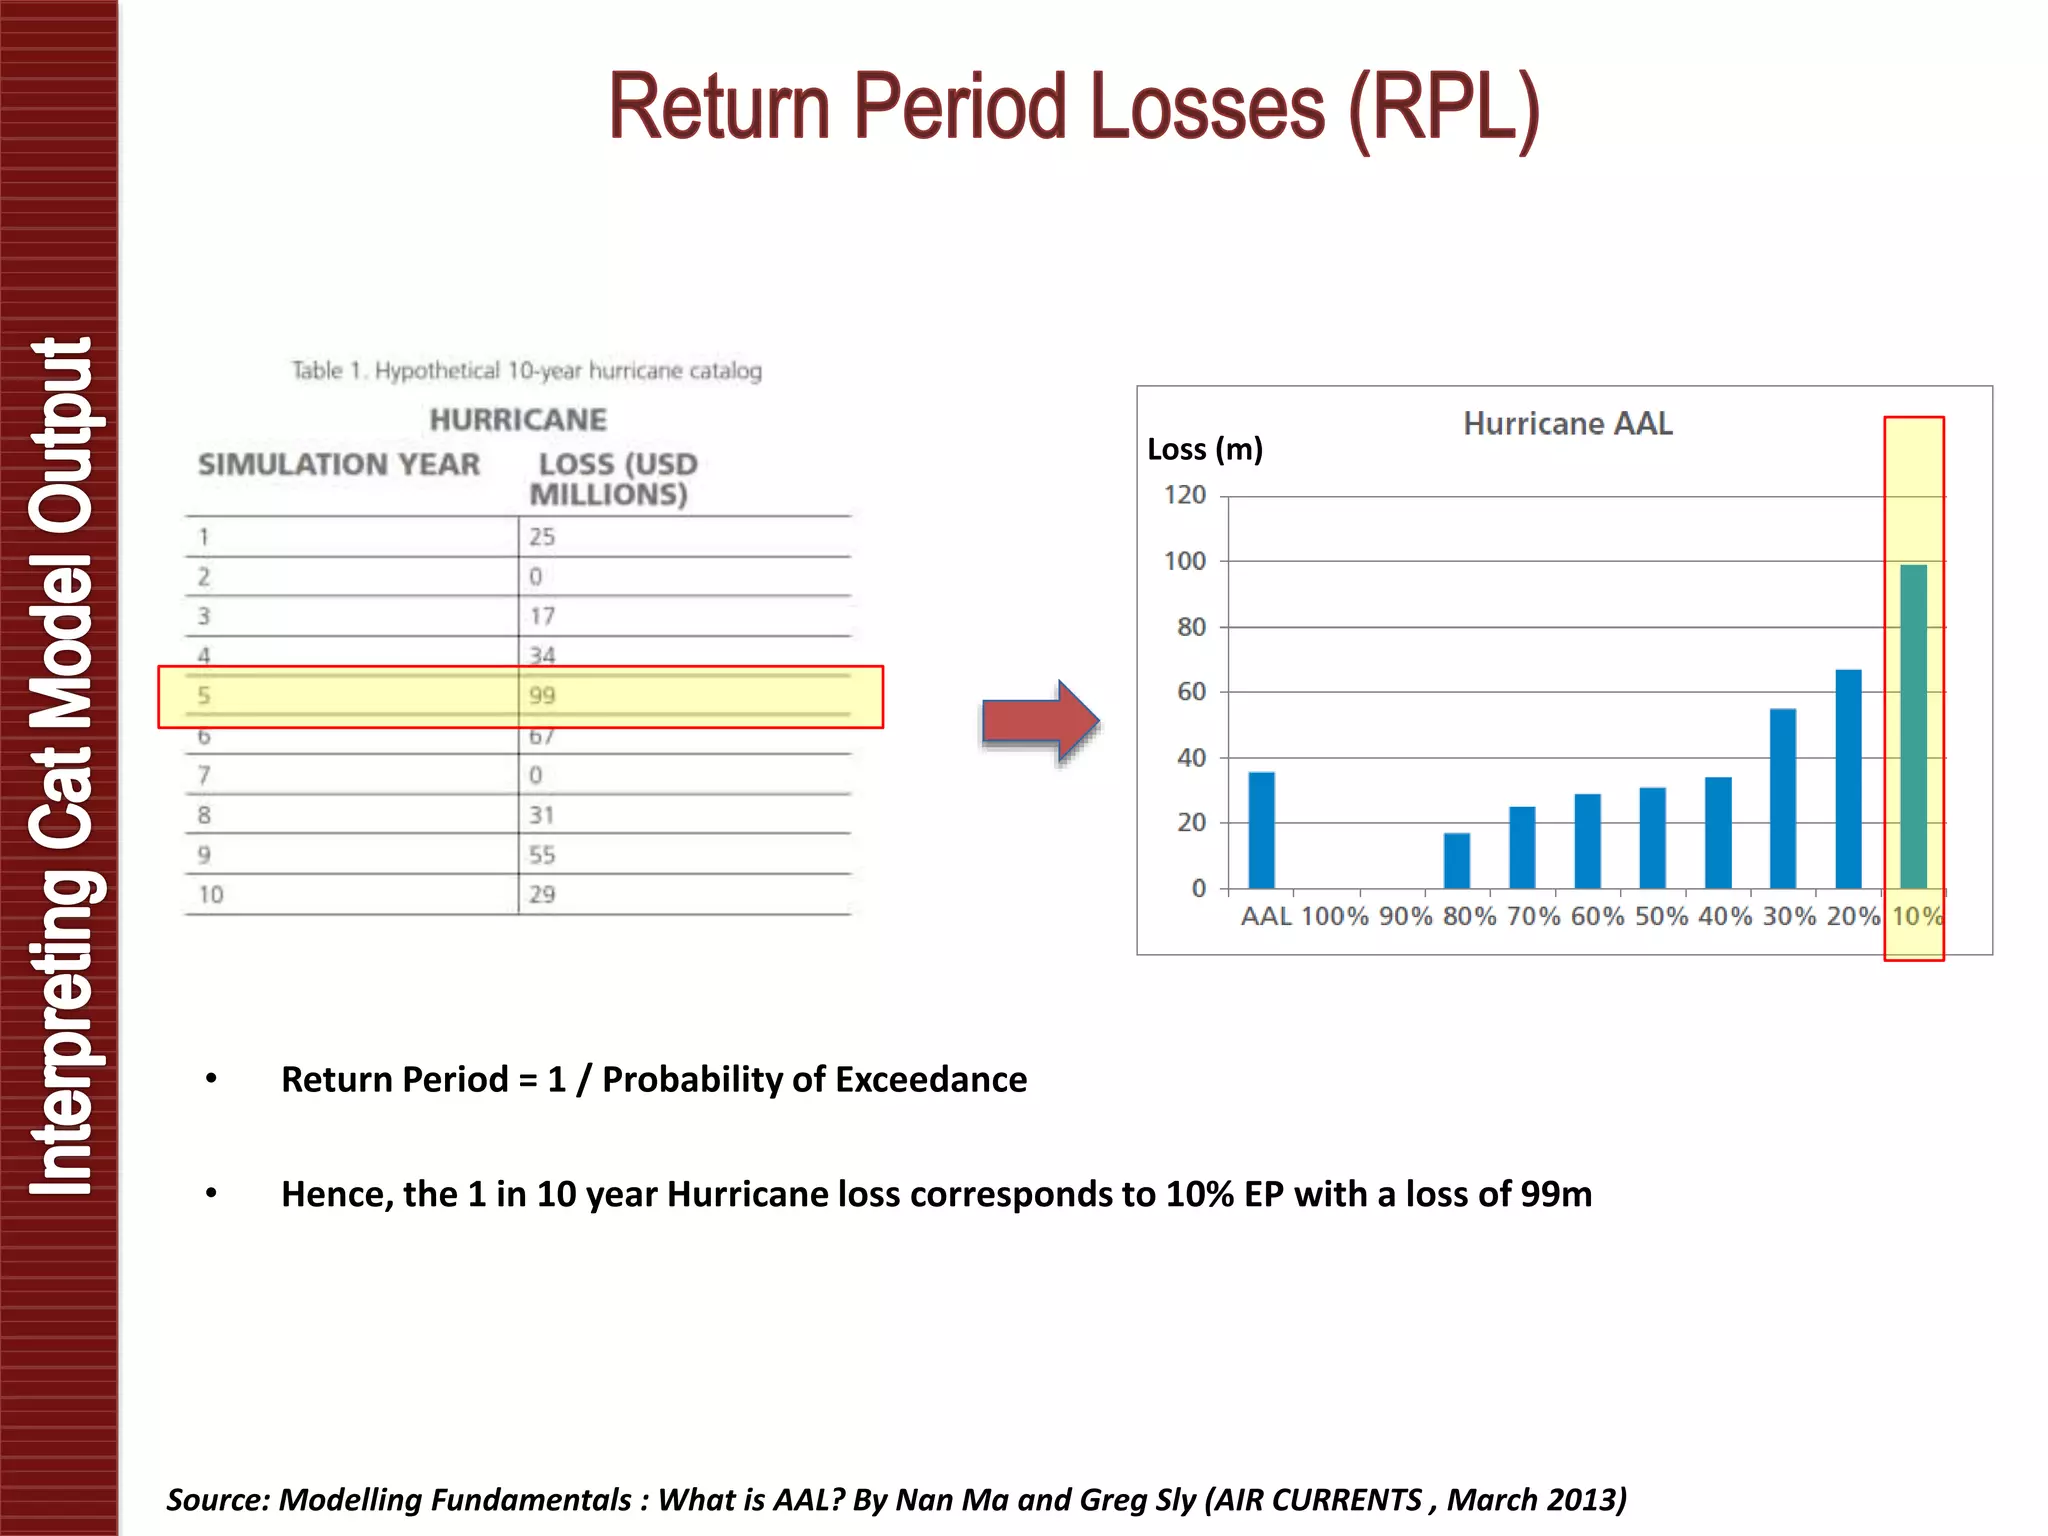
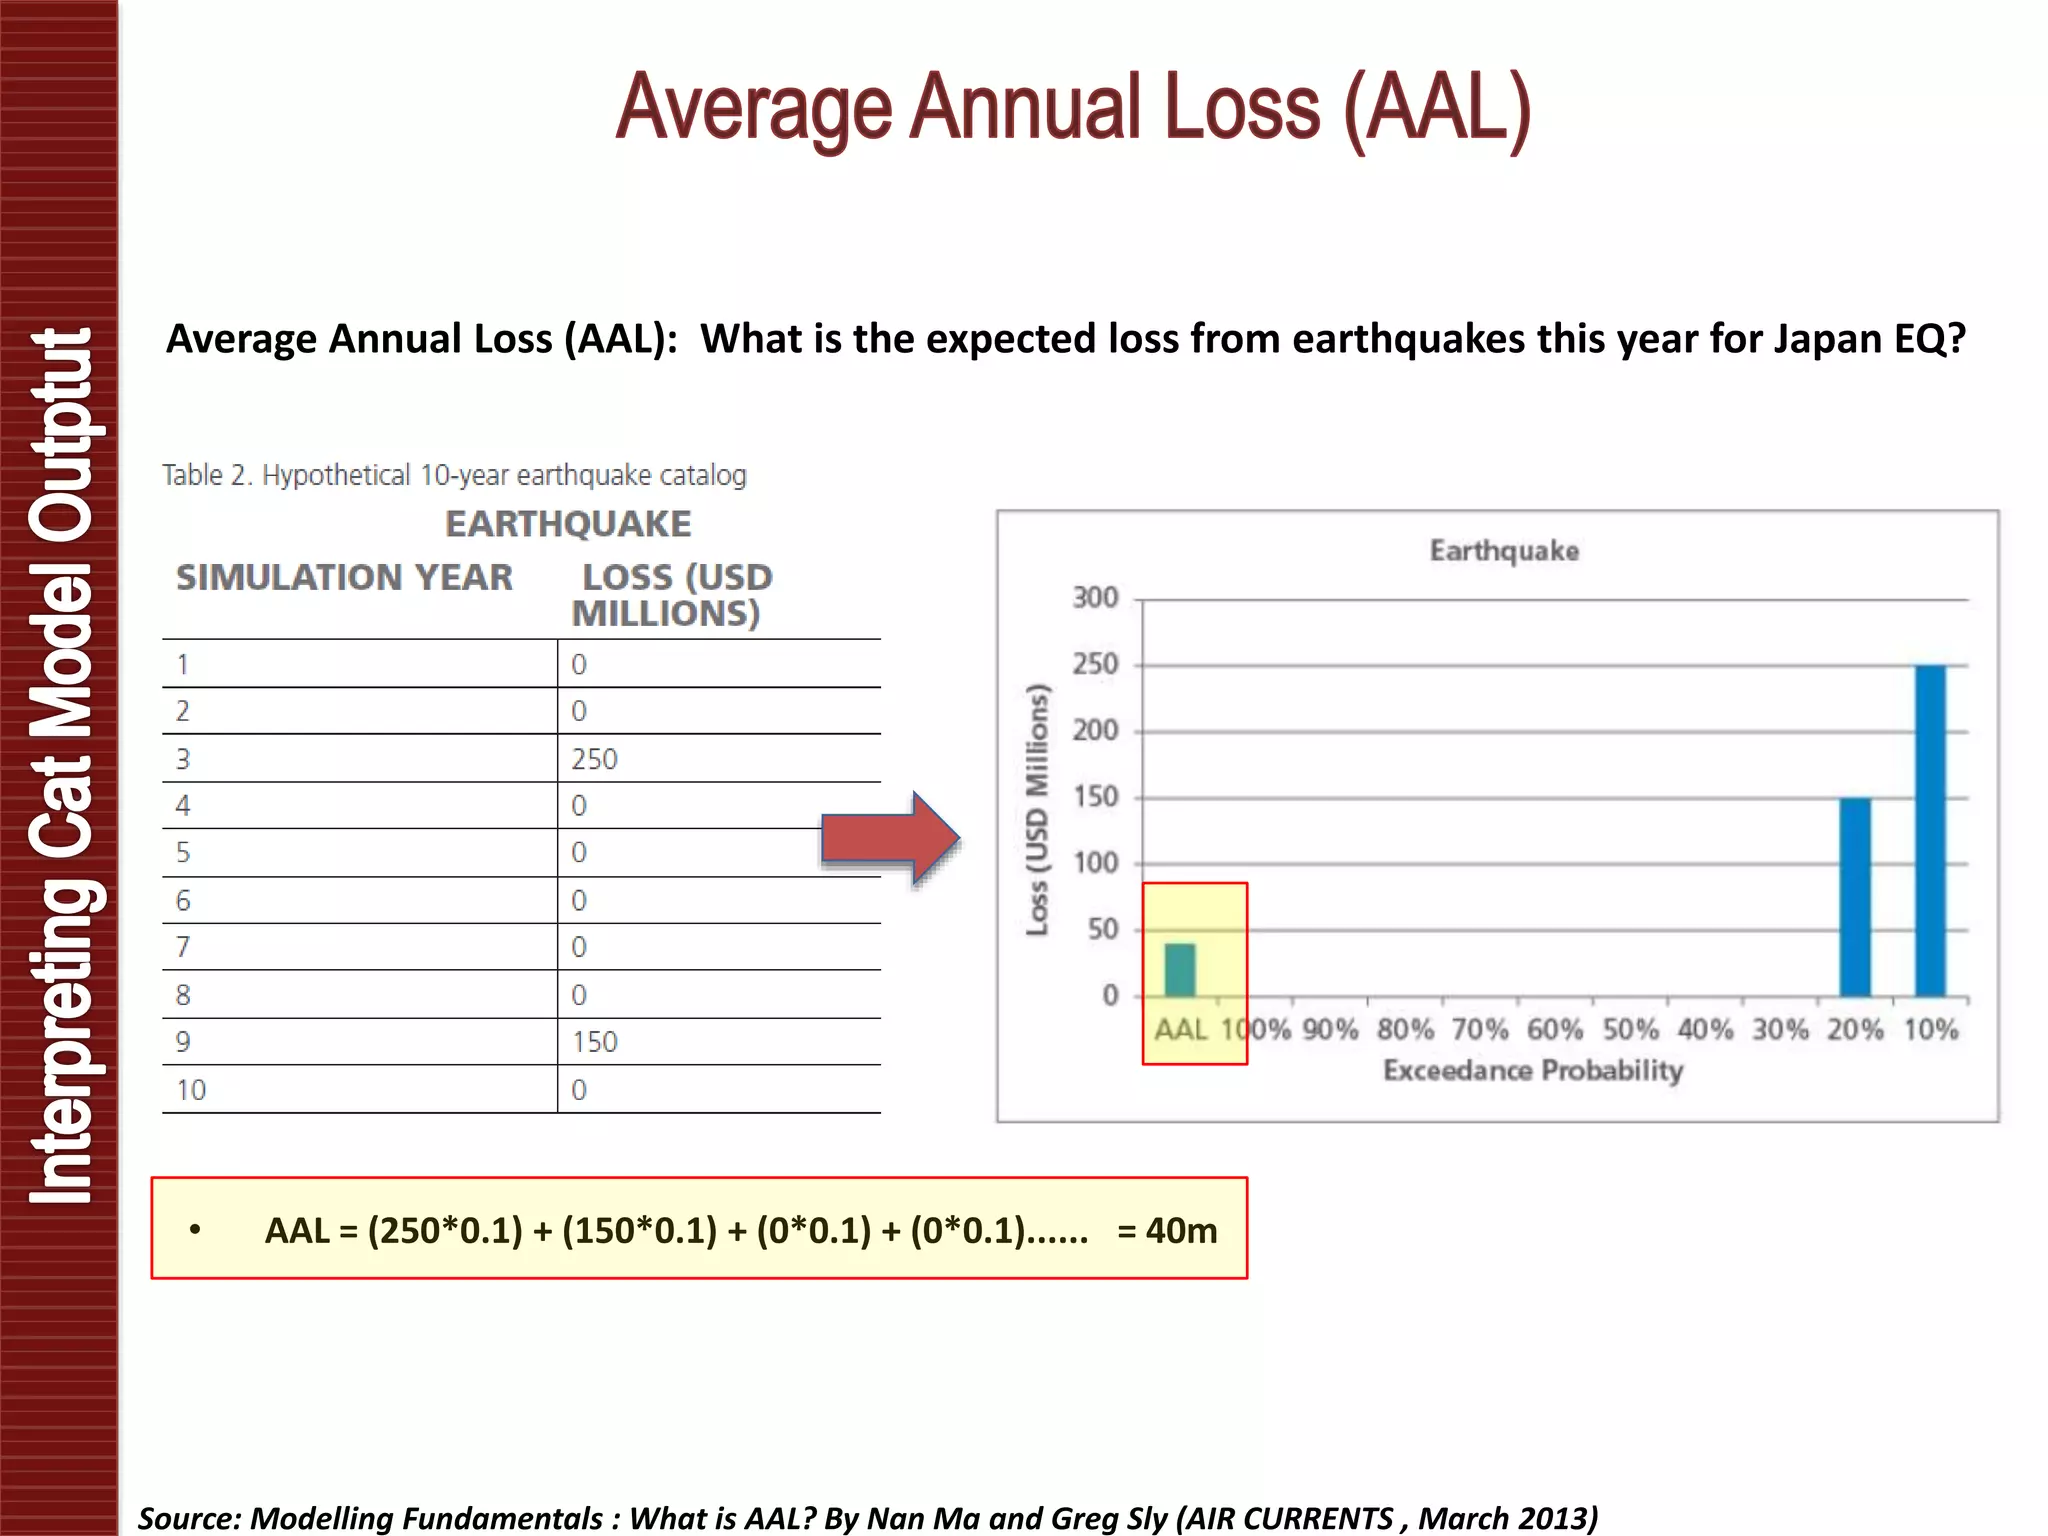
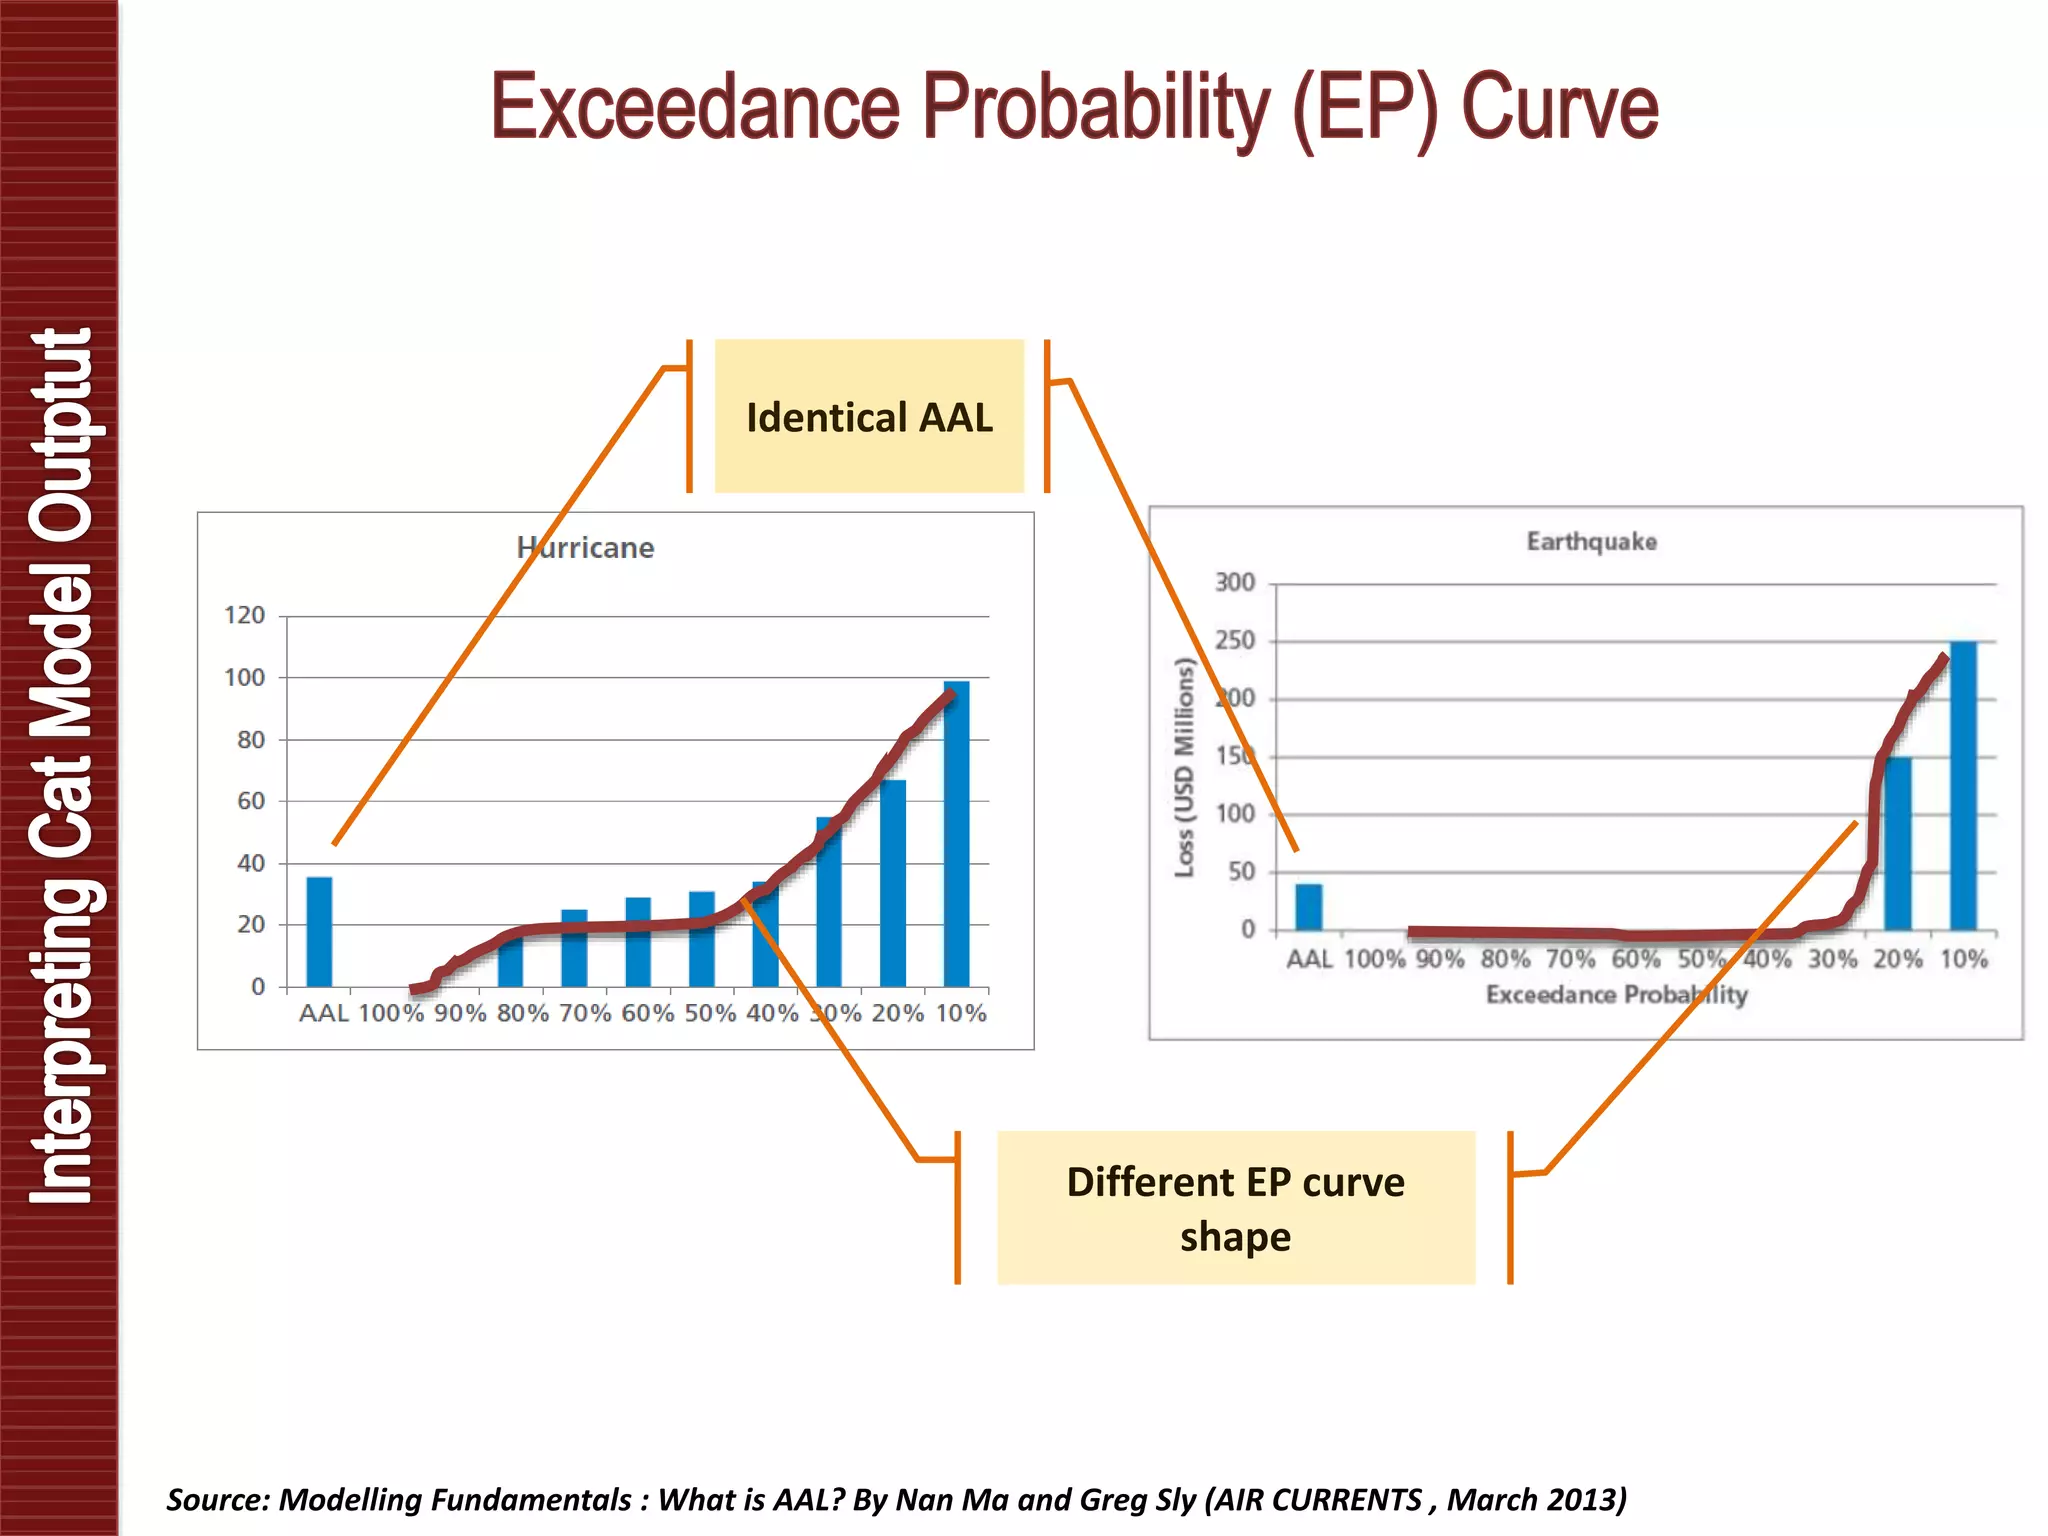
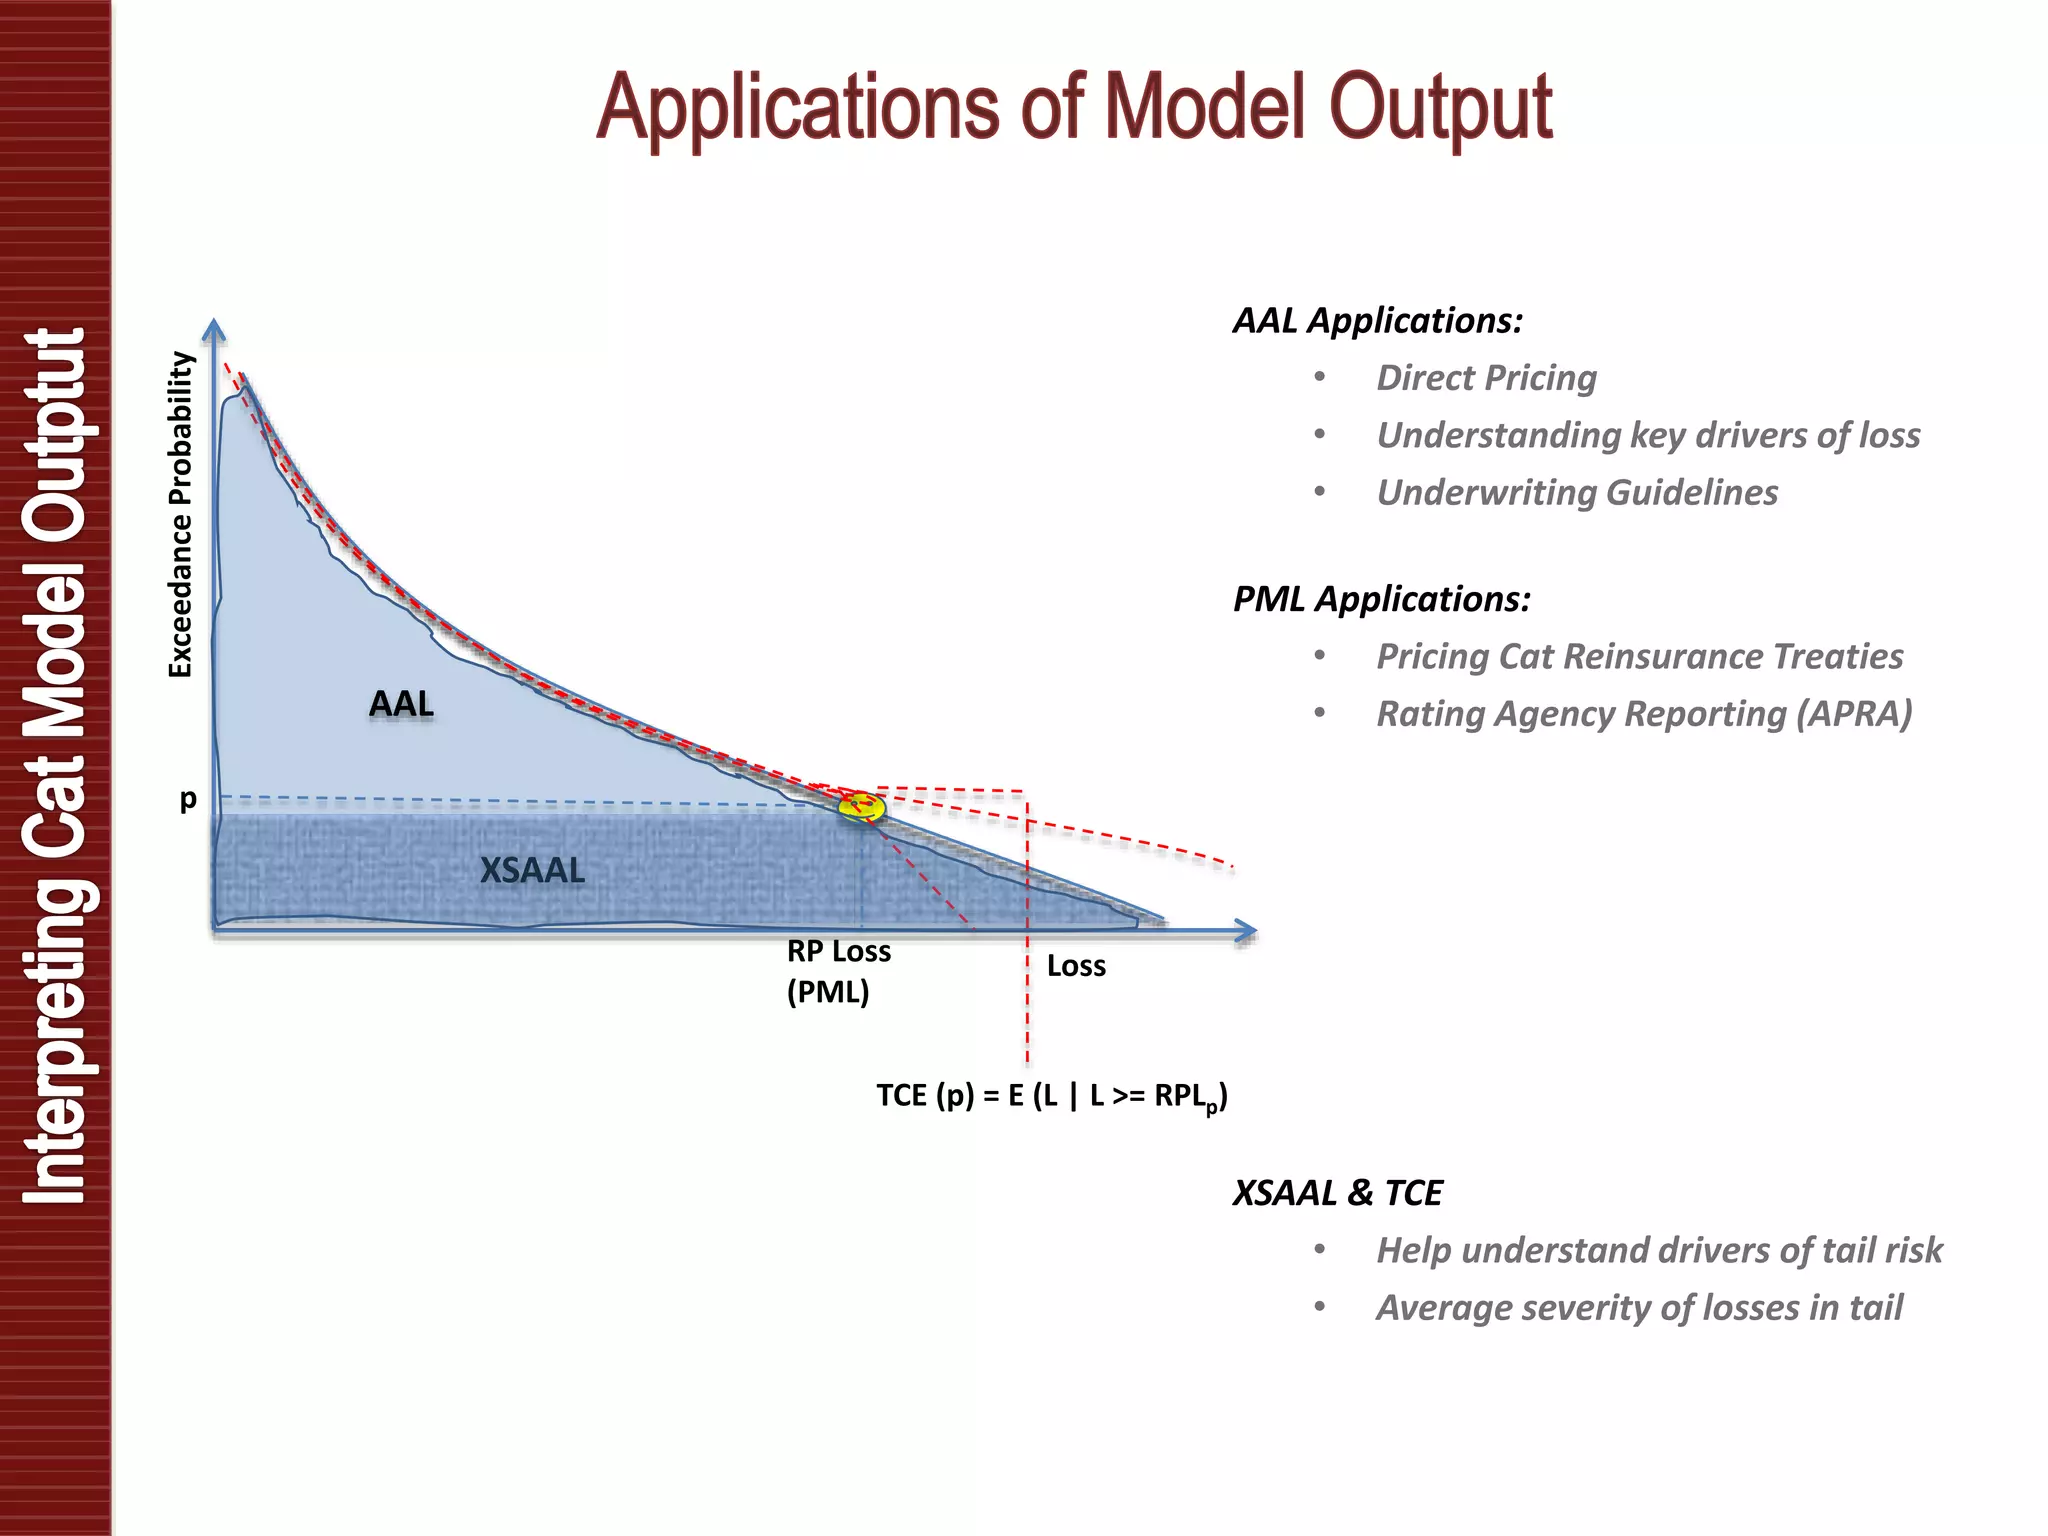
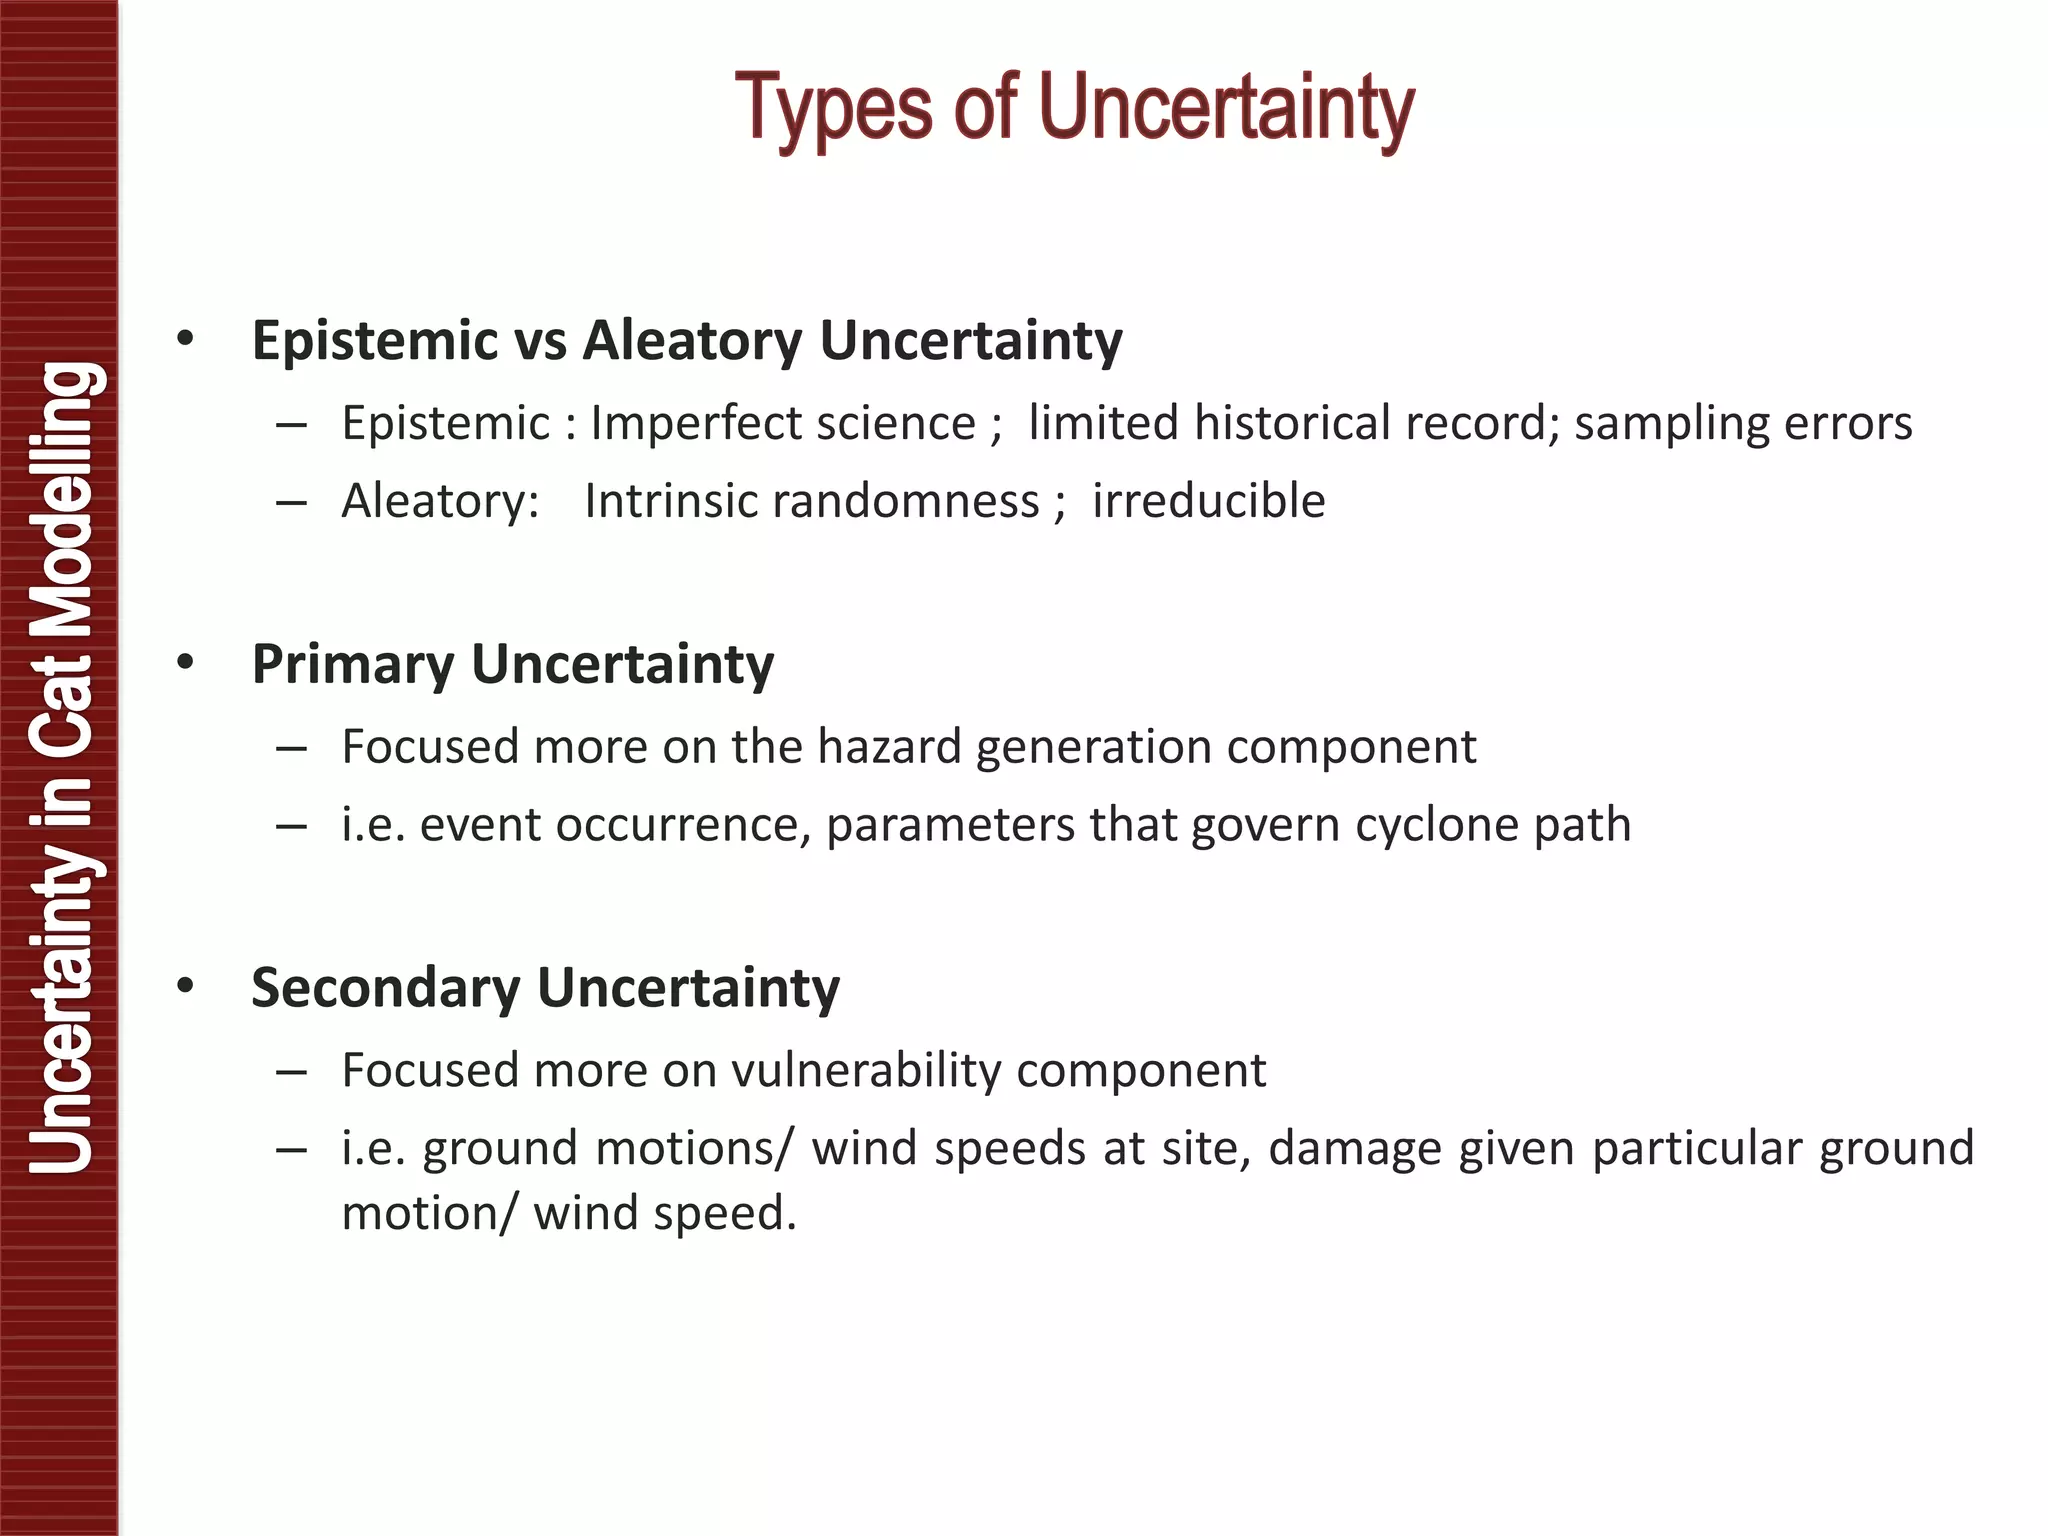
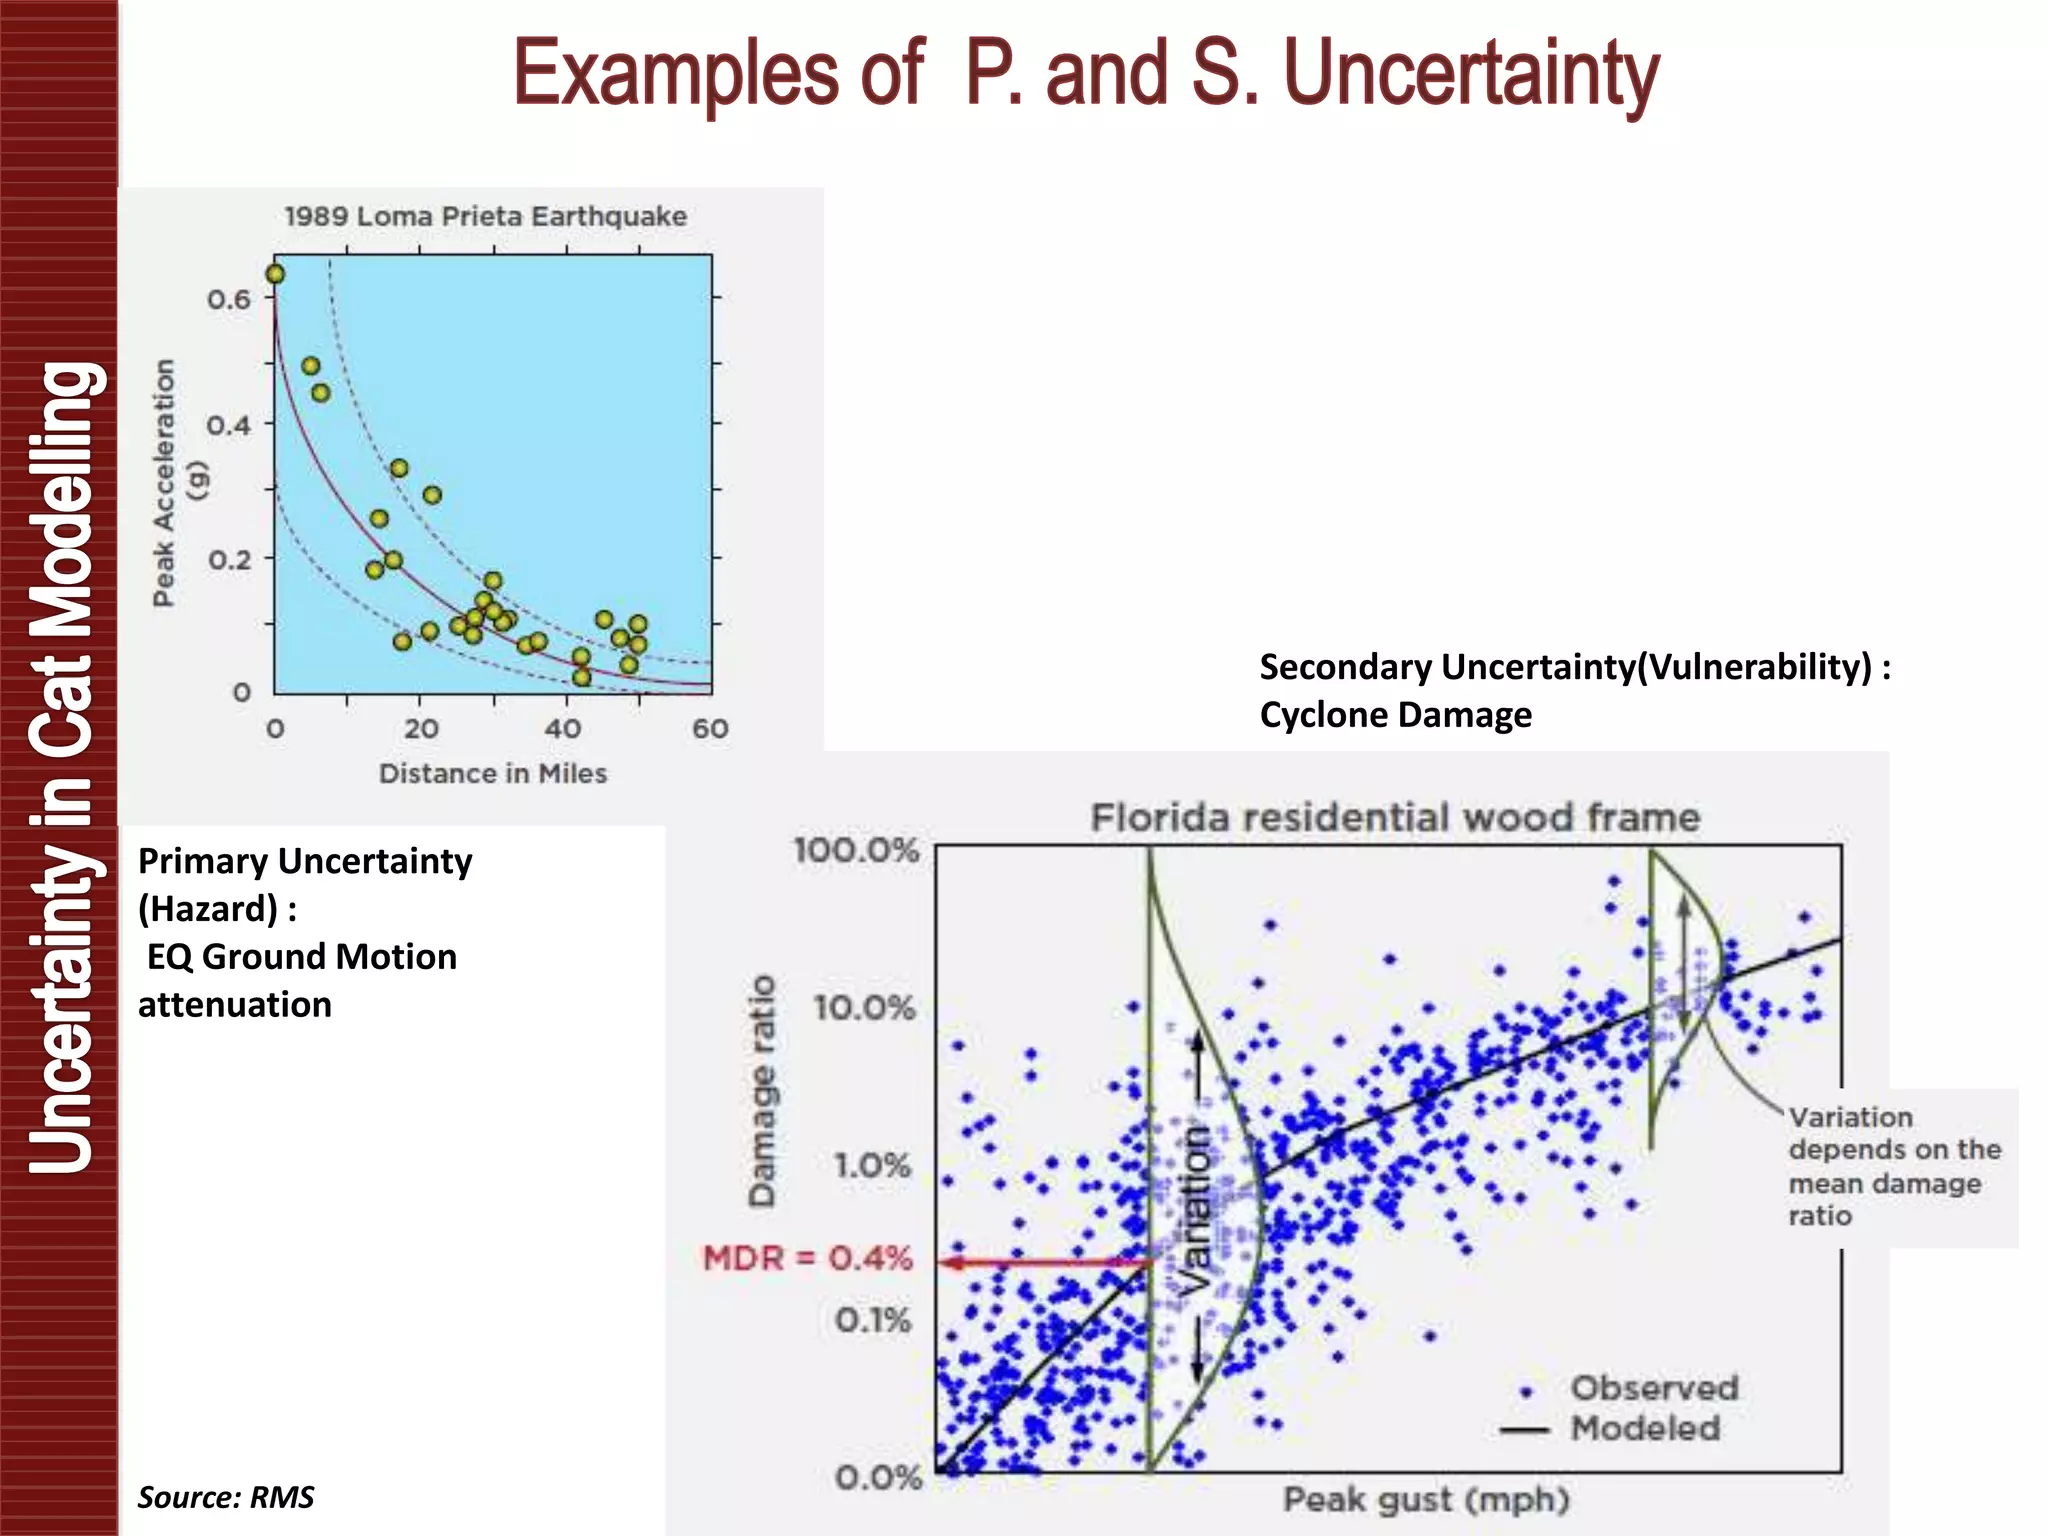
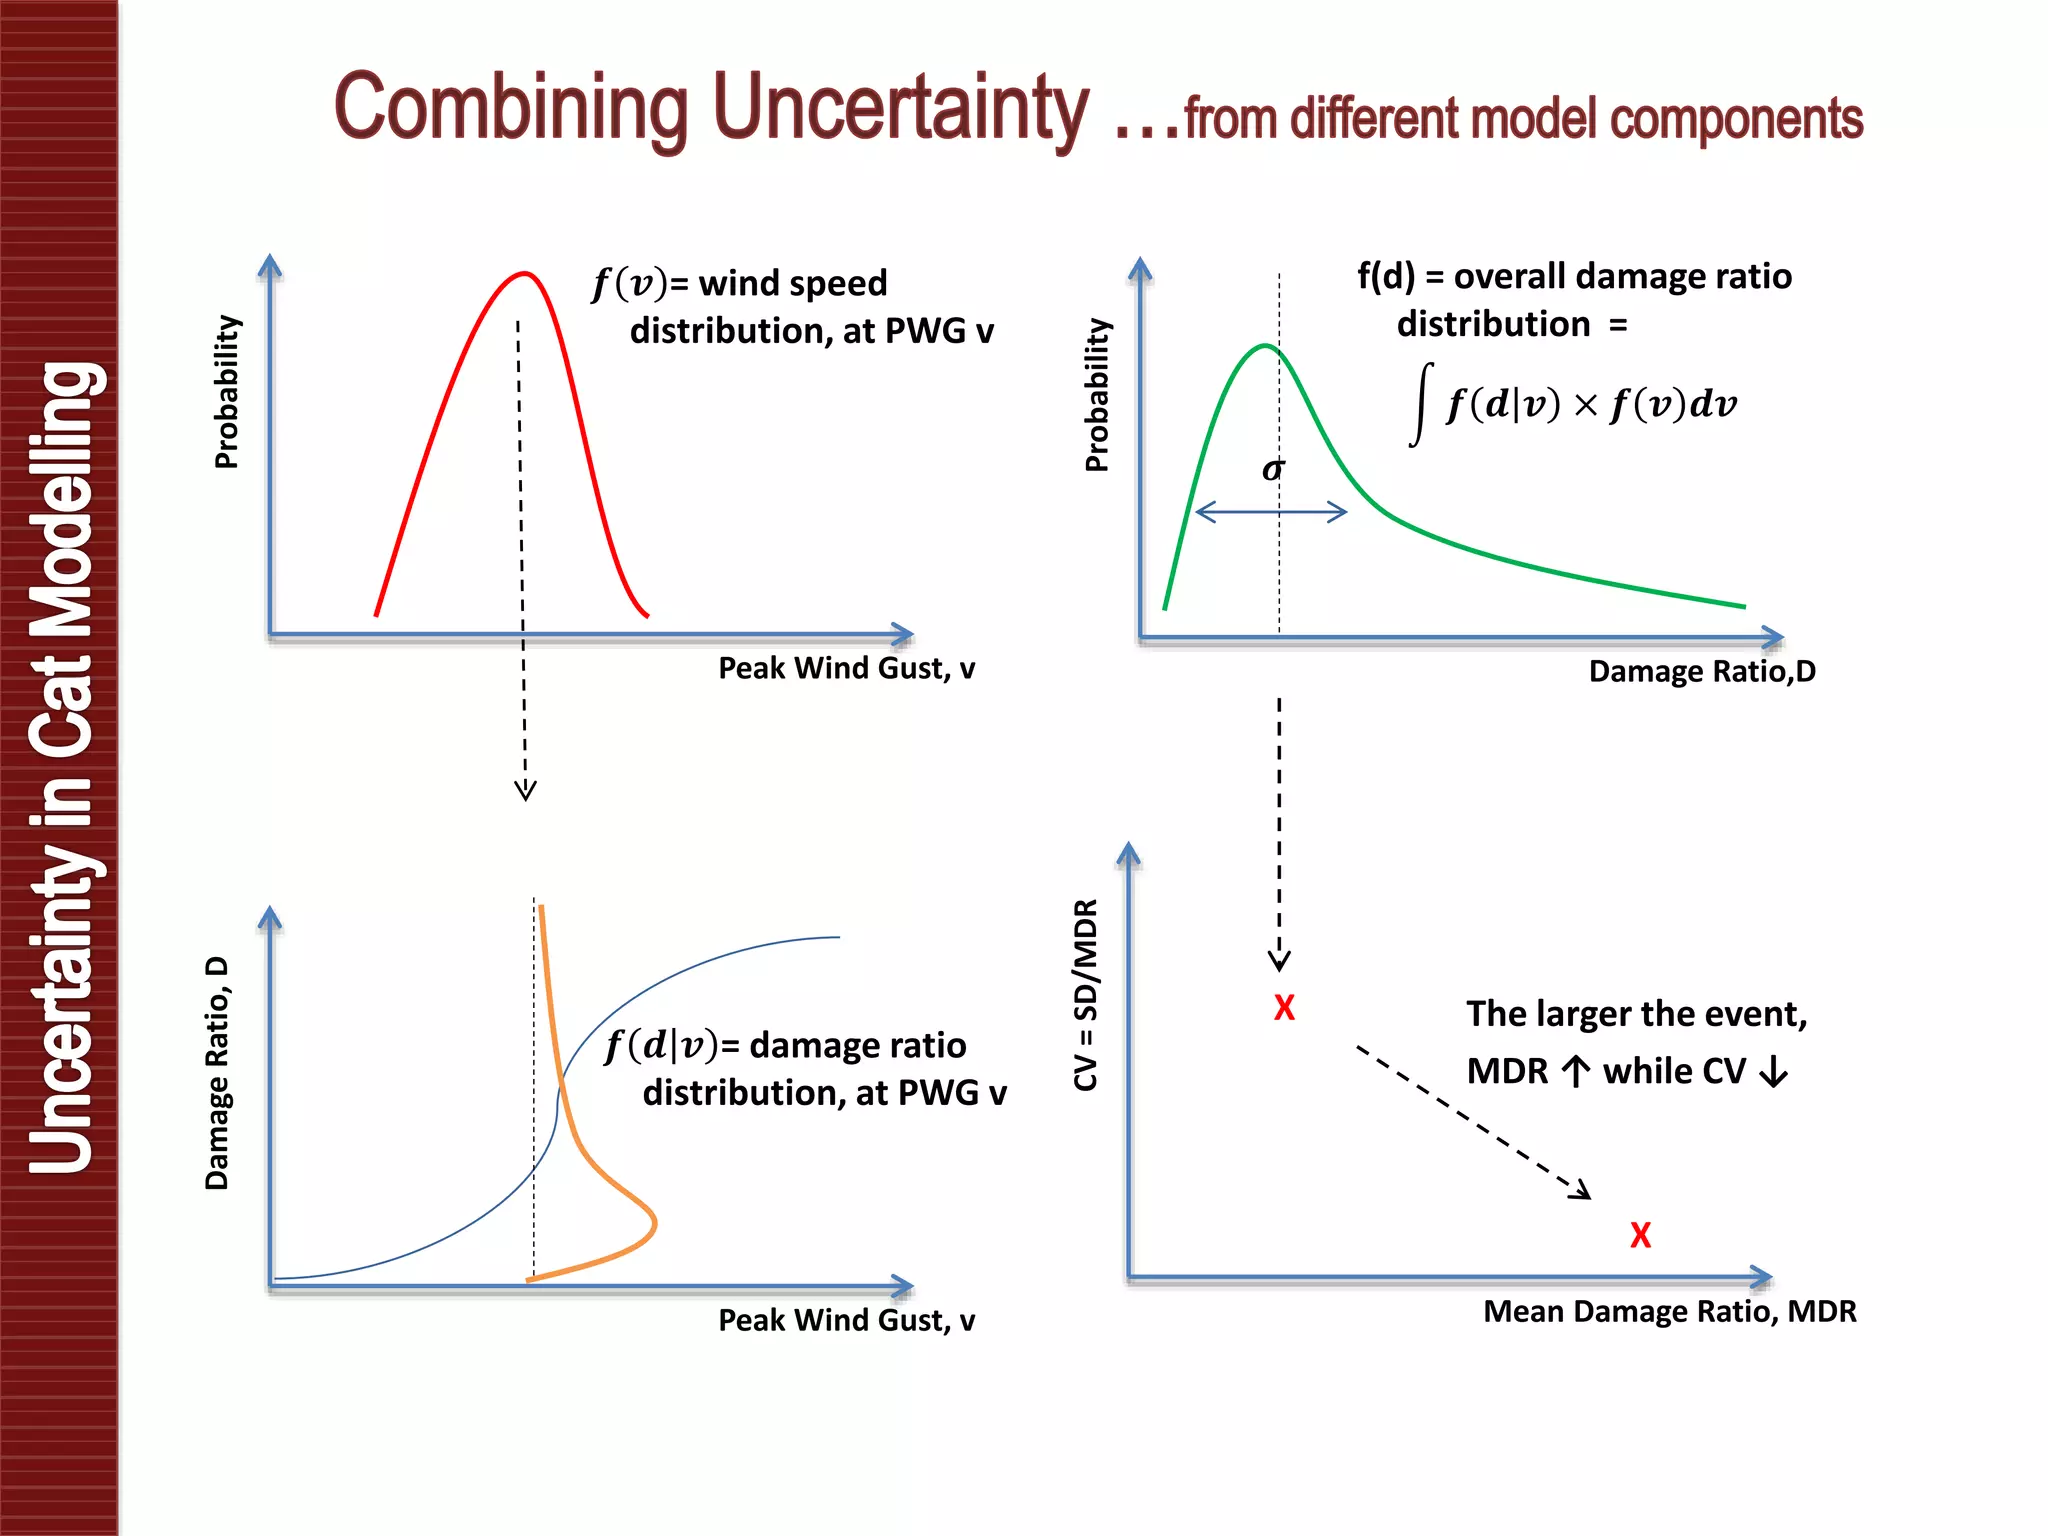
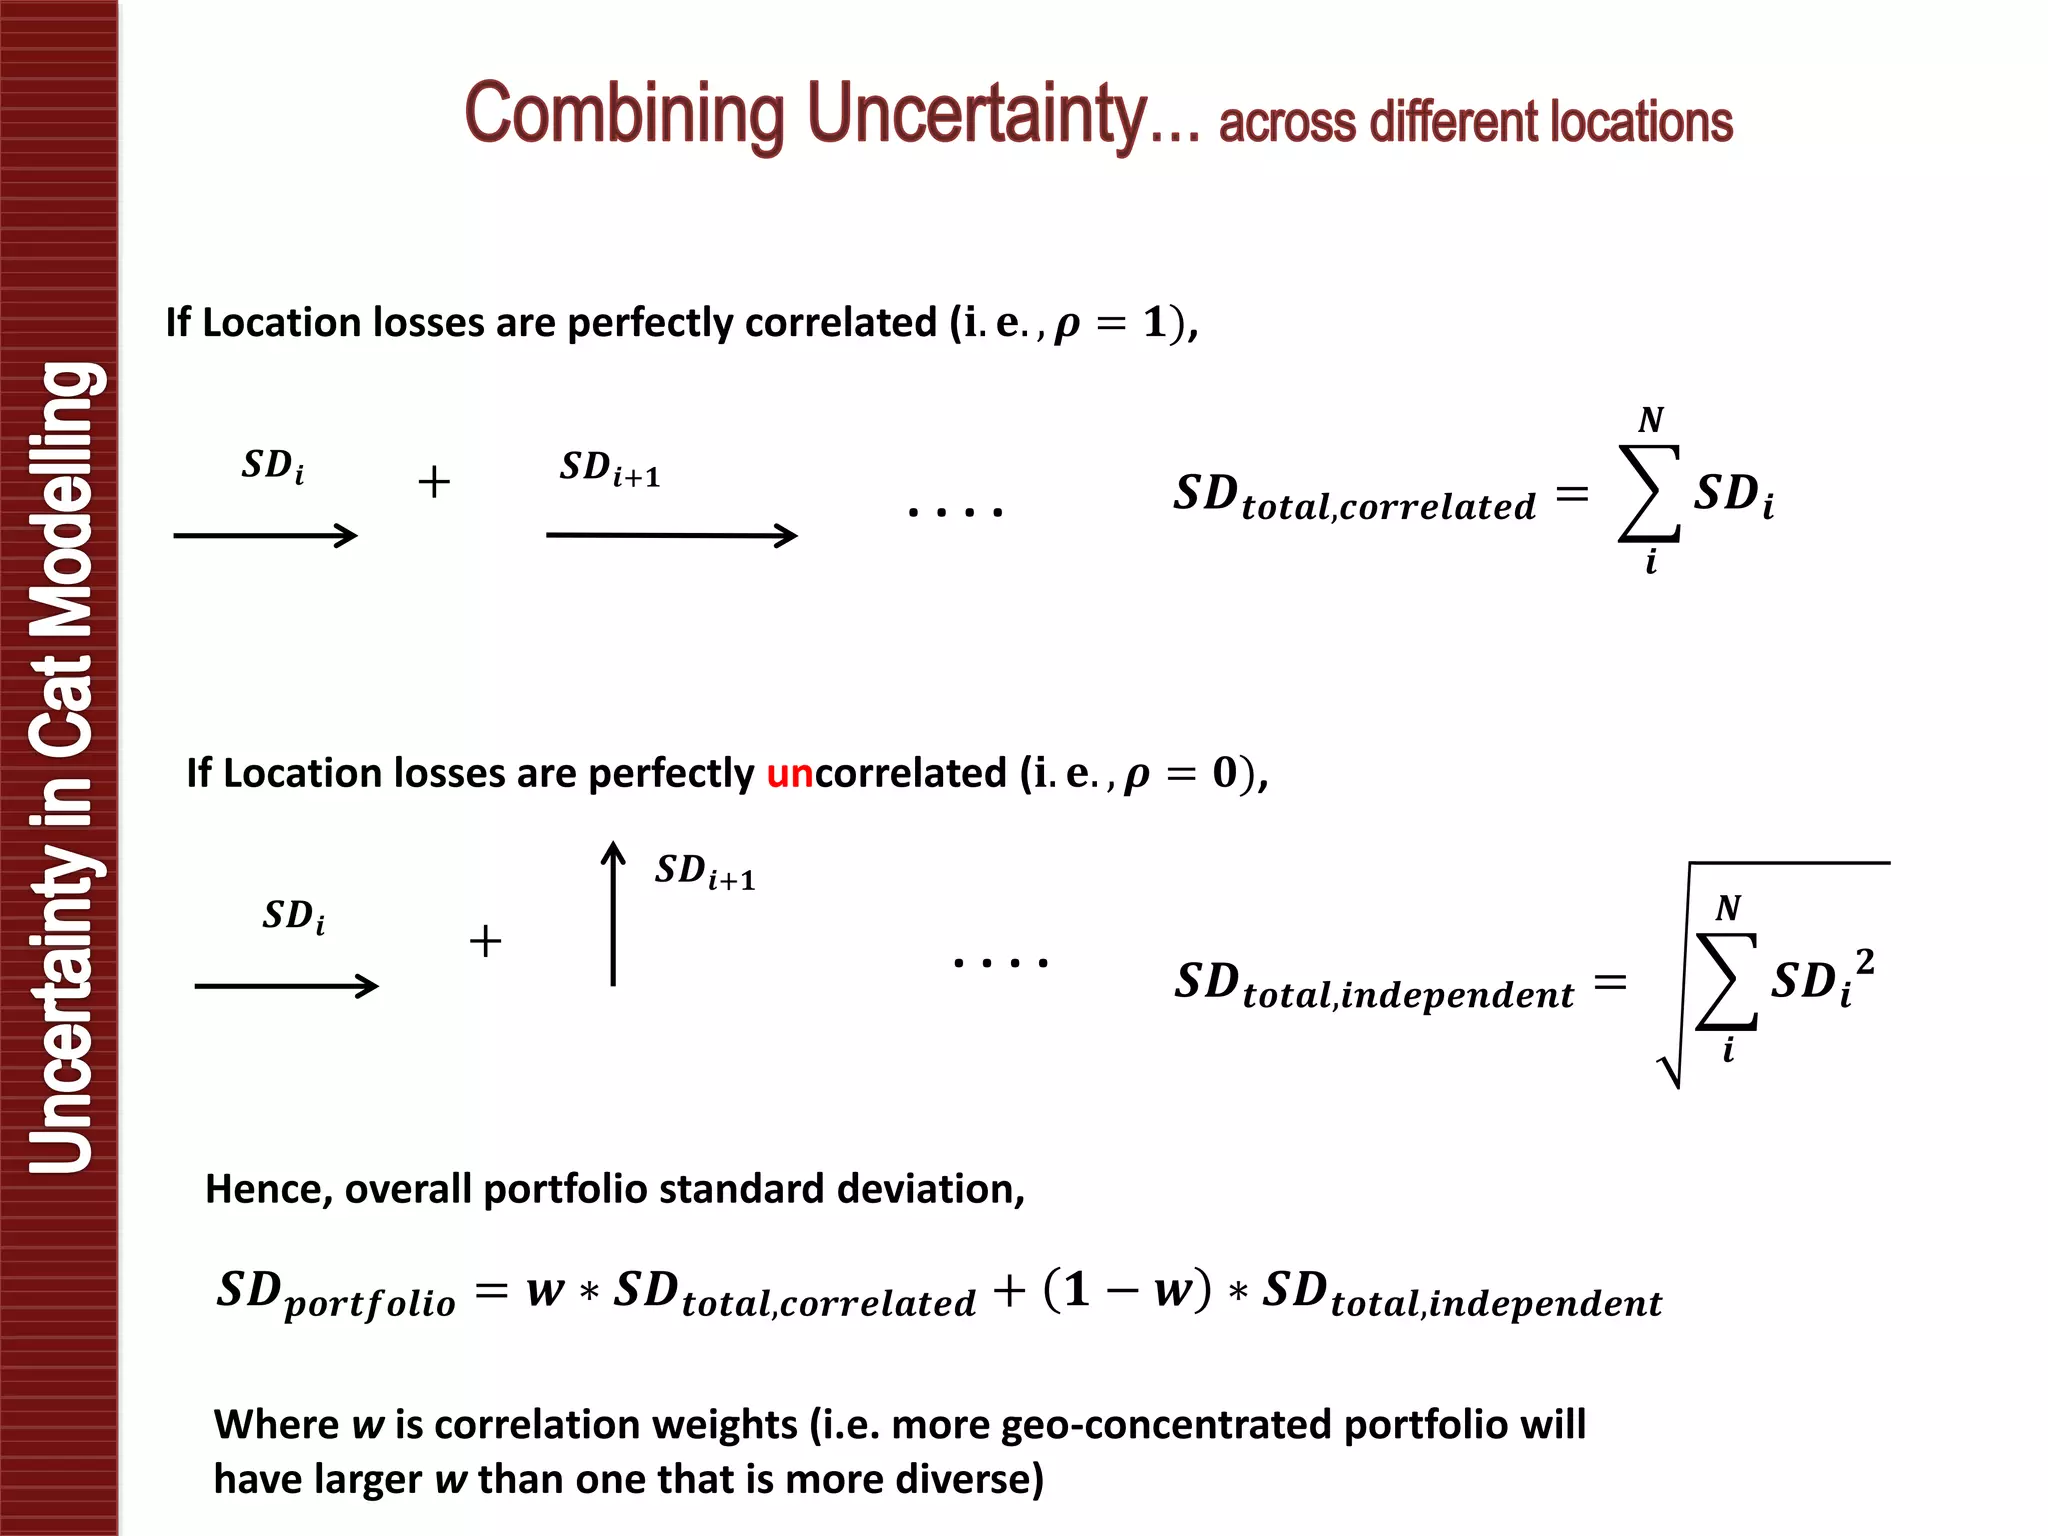
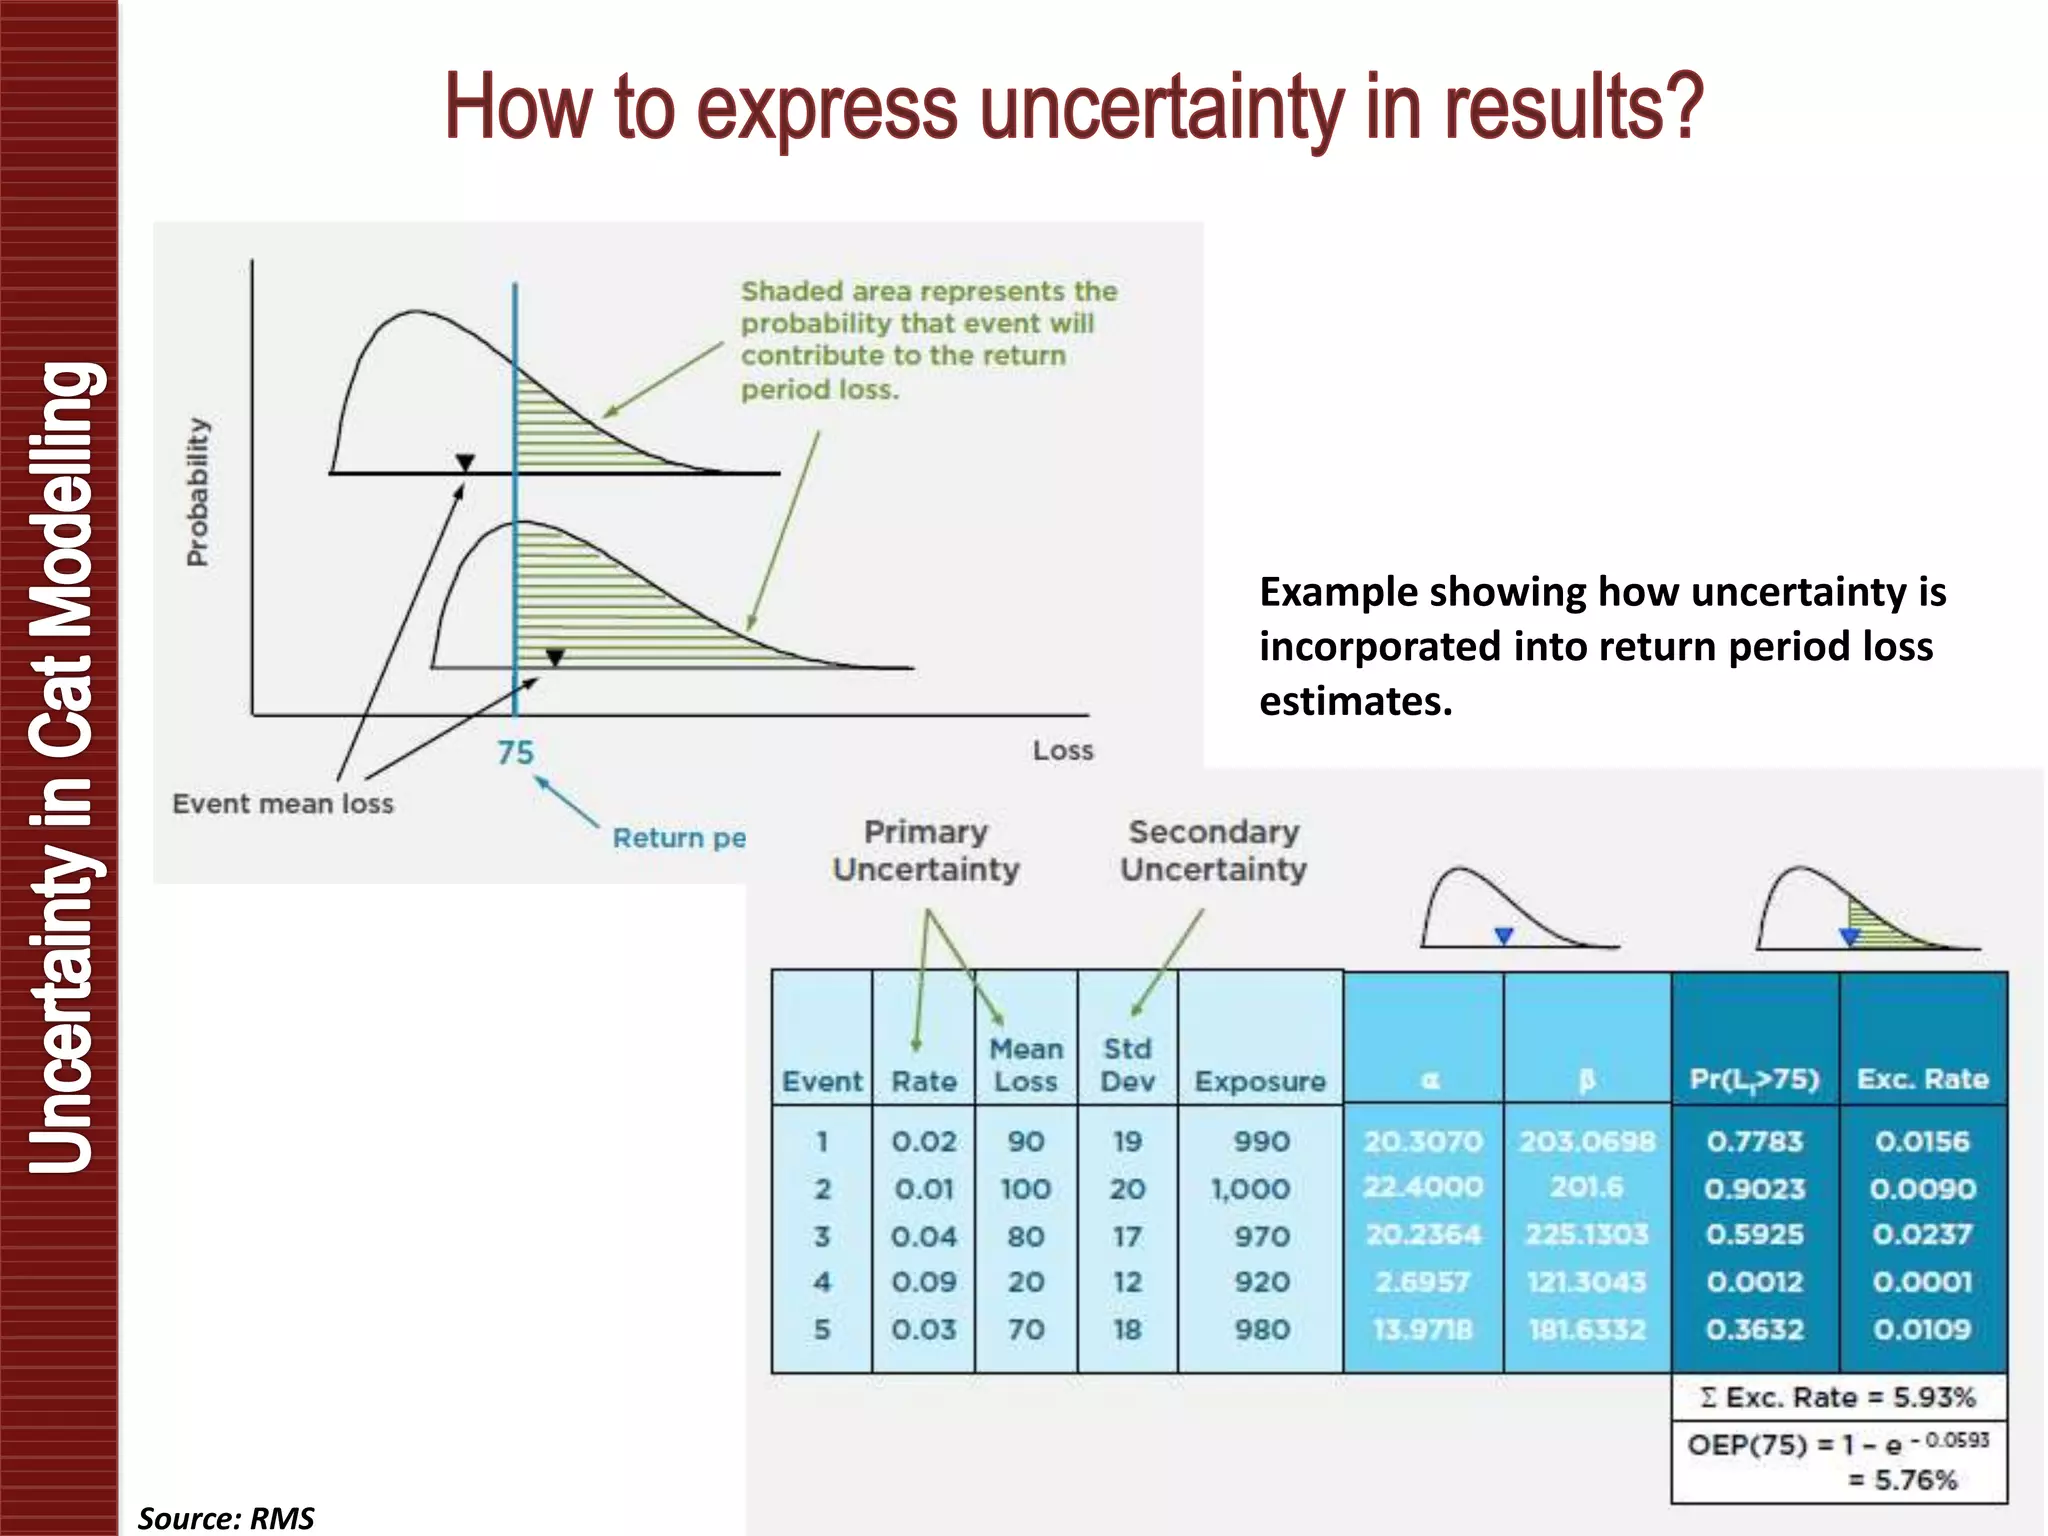
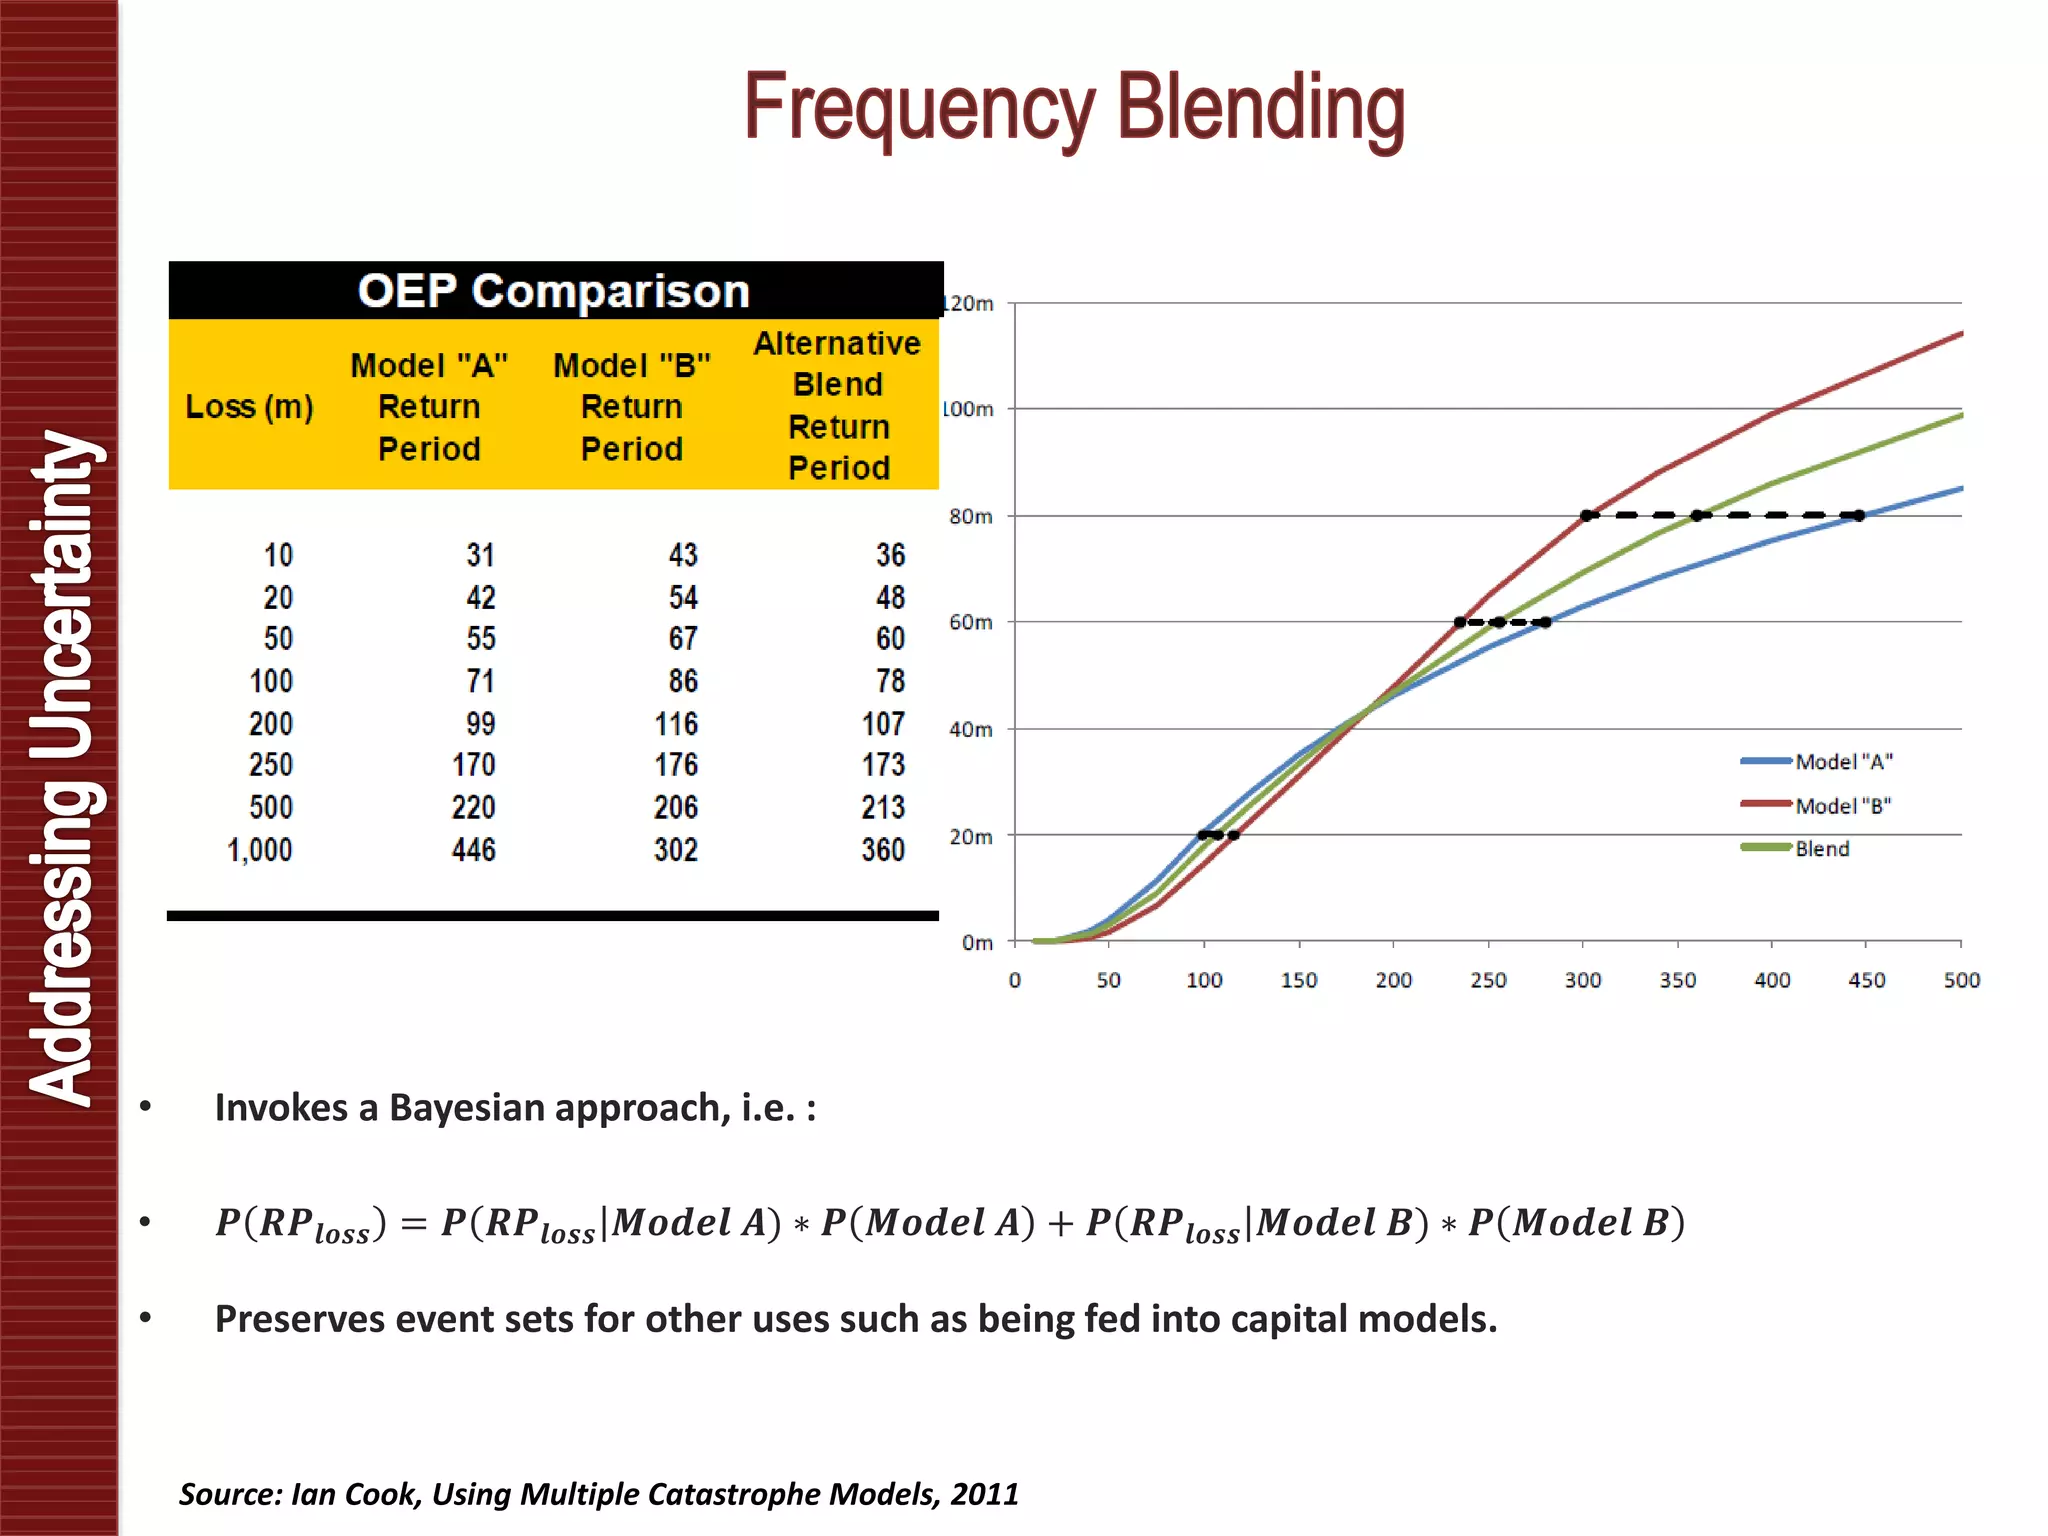
By: Alexander Pui
H. Katrina (2005)
Japan/NZ EQ,
Thai Floods
(2011)
Northridge EQ
(1994)
Source :Swiss Re Economic Consulting and Research
• Why perform Cat Modelling?
• How do Cat Models work?
• Interpreting Cat Model Output
• Uncertainty in Cat Modelling
• Understanding risk exposure
• Direct Pricing
• Structuring and Pricing Reinsurance Programs
• Regulatory Requirements / Dynamic Financial Analysis (DFA)
• Pricing of Alternative Risk Transfer (ART) Mechanisms
Catastrophe
Modelling
(Probabilistic)
Data
Engineering
Financial
Structures
Claims
Experience
Science
Hazard
• Science, Simulation of many events
Vulnerability
• How do buildings respond to events?
Financial Loss
• What is the cost given the damage?
Simulated Hurricane Tracks Simulated Earthquake Events (Epicenters)
Sources : Franco, G. (2010) “Minimization of Trigger Error in Cat-in-a-Box Parametric Earthquake Catastrophe Bonds with an
Application to Costa Rica” Earthquake Spectra, AIR
Source: Latchman S, Quantifying the Risk of Natural Catastrophes (http://understandinguncertainty.org/node/622)
Wood Frame Masonry
Earthquake
MDR
Peak Ground Acceleration
Wood
Frame
Masonry
Cyclone
MDR
Peak Wind Gust
Wood Frame
Masonry
• Combined loss distribution for 2 (or more)
buildings in different locations is computed via
convolutions, for each event.
Where:
L = loss of amount L for event
P1(Li) = probability distribution for Location 1
P2(Lj) = probability distribution for Location 2
Li (for P1)
Li + Lj
For e.g. , what is probability of loss of 10m for this event?
Lj (for P2)
Source : Latchman S., Quantifying the Risk of Natural Catastrophes, 2010
𝑷 𝑳 = 𝑷 𝟏 𝑳𝒊 × 𝑷 𝟐 𝑳𝒋
• Return Period = 1 / Probability of Exceedance
• Hence, the 1 in 10 year Hurricane loss corresponds to 10% EP with a loss of 99m
Loss (m)
Source: Modelling Fundamentals : What is AAL? By Nan Ma and Greg Sly (AIR CURRENTS , March 2013)
• AAL = (250*0.1) + (150*0.1) + (0*0.1) + (0*0.1)...... = 40m
Average Annual Loss (AAL): What is the expected loss from earthquakes this year for Japan EQ?
Source: Modelling Fundamentals : What is AAL? By Nan Ma and Greg Sly (AIR CURRENTS , March 2013)
Different EP curve
shape
Identical AAL
Source: Modelling Fundamentals : What is AAL? By Nan Ma and Greg Sly (AIR CURRENTS , March 2013)
ExceedanceProbability
Loss
XSAAL
p
RP Loss
(PML)
TCE (p) = E (L | L >= RPLp)
AAL
AAL Applications:
• Direct Pricing
• Understanding key drivers of loss
• Underwriting Guidelines
PML Applications:
• Pricing Cat Reinsurance Treaties
• Rating Agency Reporting (APRA)
XSAAL & TCE
• Help understand drivers of tail risk
• Average severity of losses in tail
• Epistemic vs Aleatory Uncertainty
– Epistemic : Imperfect science ; limited historical record; sampling errors
– Aleatory: Intrinsic randomness ; irreducible
• Primary Uncertainty
– Focused more on the hazard generation component
– i.e. event occurrence, parameters that govern cyclone path
• Secondary Uncertainty
– Focused more on vulnerability component
– i.e. ground motions/ wind speeds at site, damage given particular ground
motion/ wind speed.
Primary Uncertainty
(Hazard) :
EQ Ground Motion
attenuation
Secondary Uncertainty(Vulnerability) :
Cyclone Damage
Source: RMS
CV=SD/MDR
Mean Damage Ratio, MDR
DamageRatio,D
Peak Wind Gust, v
𝒇 𝒅 𝒗 = damage ratio
distribution, at PWG v
Probability
Peak Wind Gust, v
𝒇 𝒗 = wind speed
distribution, at PWG v
Probability
Damage Ratio,D
f(d) = overall damage ratio
distribution =
𝒇 𝒅 𝒗 × 𝒇 𝒗 𝒅𝒗
𝝈
X
X
The larger the event,
MDR ↑ while CV ↓
𝑺𝑫𝒊 𝑺𝑫𝒊+𝟏
. . . .
If Location losses are perfectly correlated (𝐢. 𝐞. , 𝝆 = 𝟏),
𝑺𝑫 𝒕𝒐𝒕𝒂𝒍,𝒄𝒐𝒓𝒓𝒆𝒍𝒂𝒕𝒆𝒅 =
𝒊
𝑵
𝑺𝑫𝒊
𝑺𝑫𝒊
𝑺𝑫𝒊+𝟏
. . . .
If Location losses are perfectly uncorrelated (𝐢. 𝐞. , 𝝆 = 𝟎),
𝑺𝑫 𝒕𝒐𝒕𝒂𝒍,𝒊𝒏𝒅𝒆𝒑𝒆𝒏𝒅𝒆𝒏𝒕 =
𝒊
𝑵
𝑺𝑫𝒊
𝟐+
+
𝑺𝑫 𝒑𝒐𝒓𝒕𝒇𝒐𝒍𝒊𝒐 = 𝒘 ∗ 𝑺𝑫 𝒕𝒐𝒕𝒂𝒍,𝒄𝒐𝒓𝒓𝒆𝒍𝒂𝒕𝒆𝒅 + 𝟏 − 𝒘 ∗ 𝑺𝑫 𝒕𝒐𝒕𝒂𝒍,𝒊𝒏𝒅𝒆𝒑𝒆𝒏𝒅𝒆𝒏𝒕
Hence, overall portfolio standard deviation,
Where w is correlation weights (i.e. more geo-concentrated portfolio will
have larger w than one that is more diverse)
Source: RMS
Example showing how uncertainty is
incorporated into return period loss
estimates.
• Repeated resampling of
Event List Table (ELT)
• Plot new EP curve with
each realization, and sort
them
• Build confidence intervals
for desired percentiles
• Reduce model risk from reliance on single vendor opinion
• May diversify away ‘independent imperfections’
• But, may introduce new uncertainties in the process!
Model A
Model B
Blended Model
Source: Ian Cook, Using Multiple Catastrophe Models, 2011
• If we have good reason to believe that, say at 400 year RP:
– Greater chance the ‘true’ 1 in 400 year loss to be below B than above B
– Greater chance the ‘true’ 1 in 400 year loss to be above A than below A
• Then weighted average of A and B may be ‘less wrong’ than pure A or B alone.
• Invokes a Bayesian approach, i.e. :
• 𝑷 𝑹𝑷𝒍𝒐𝒔𝒔 = 𝑷 𝑹𝑷𝒍𝒐𝒔𝒔 𝑴𝒐𝒅𝒆𝒍 𝑨) ∗ 𝑷 𝑴𝒐𝒅𝒆𝒍 𝑨 + 𝑷 𝑹𝑷𝒍𝒐𝒔𝒔 𝑴𝒐𝒅𝒆𝒍 𝑩) ∗ 𝑷 𝑴𝒐𝒅𝒆𝒍 𝑩
• Preserves event sets for other uses such as being fed into capital models.
Source: Ian Cook, Using Multiple Catastrophe Models, 2011
• Sensitivity testing/ Stress Testing of model assumptions
• Historical Event validation
• Expert Judgment / Consultation with model vendors
• Bias Correction Methods
Alexander Pui
Email: alexpui8@gmail.com
Linkedin : https://au.linkedin.com/in/alexander-pui-94a33821

Dealing with Uncertainty in Catastrophe Modelling

  • 1.
  • 2.
    H. Katrina (2005) Japan/NZEQ, Thai Floods (2011) Northridge EQ (1994) Source :Swiss Re Economic Consulting and Research
  • 4.
    • Why performCat Modelling? • How do Cat Models work? • Interpreting Cat Model Output • Uncertainty in Cat Modelling
  • 5.
    • Understanding riskexposure • Direct Pricing • Structuring and Pricing Reinsurance Programs • Regulatory Requirements / Dynamic Financial Analysis (DFA) • Pricing of Alternative Risk Transfer (ART) Mechanisms
  • 6.
  • 7.
    Hazard • Science, Simulationof many events Vulnerability • How do buildings respond to events? Financial Loss • What is the cost given the damage?
  • 8.
    Simulated Hurricane TracksSimulated Earthquake Events (Epicenters) Sources : Franco, G. (2010) “Minimization of Trigger Error in Cat-in-a-Box Parametric Earthquake Catastrophe Bonds with an Application to Costa Rica” Earthquake Spectra, AIR
  • 9.
    Source: Latchman S,Quantifying the Risk of Natural Catastrophes (http://understandinguncertainty.org/node/622)
  • 10.
  • 11.
  • 12.
    • Combined lossdistribution for 2 (or more) buildings in different locations is computed via convolutions, for each event. Where: L = loss of amount L for event P1(Li) = probability distribution for Location 1 P2(Lj) = probability distribution for Location 2 Li (for P1) Li + Lj For e.g. , what is probability of loss of 10m for this event? Lj (for P2) Source : Latchman S., Quantifying the Risk of Natural Catastrophes, 2010 𝑷 𝑳 = 𝑷 𝟏 𝑳𝒊 × 𝑷 𝟐 𝑳𝒋
  • 13.
    • Return Period= 1 / Probability of Exceedance • Hence, the 1 in 10 year Hurricane loss corresponds to 10% EP with a loss of 99m Loss (m) Source: Modelling Fundamentals : What is AAL? By Nan Ma and Greg Sly (AIR CURRENTS , March 2013)
  • 14.
    • AAL =(250*0.1) + (150*0.1) + (0*0.1) + (0*0.1)...... = 40m Average Annual Loss (AAL): What is the expected loss from earthquakes this year for Japan EQ? Source: Modelling Fundamentals : What is AAL? By Nan Ma and Greg Sly (AIR CURRENTS , March 2013)
  • 15.
    Different EP curve shape IdenticalAAL Source: Modelling Fundamentals : What is AAL? By Nan Ma and Greg Sly (AIR CURRENTS , March 2013)
  • 16.
    ExceedanceProbability Loss XSAAL p RP Loss (PML) TCE (p)= E (L | L >= RPLp) AAL AAL Applications: • Direct Pricing • Understanding key drivers of loss • Underwriting Guidelines PML Applications: • Pricing Cat Reinsurance Treaties • Rating Agency Reporting (APRA) XSAAL & TCE • Help understand drivers of tail risk • Average severity of losses in tail
  • 17.
    • Epistemic vsAleatory Uncertainty – Epistemic : Imperfect science ; limited historical record; sampling errors – Aleatory: Intrinsic randomness ; irreducible • Primary Uncertainty – Focused more on the hazard generation component – i.e. event occurrence, parameters that govern cyclone path • Secondary Uncertainty – Focused more on vulnerability component – i.e. ground motions/ wind speeds at site, damage given particular ground motion/ wind speed.
  • 18.
    Primary Uncertainty (Hazard) : EQGround Motion attenuation Secondary Uncertainty(Vulnerability) : Cyclone Damage Source: RMS
  • 19.
    CV=SD/MDR Mean Damage Ratio,MDR DamageRatio,D Peak Wind Gust, v 𝒇 𝒅 𝒗 = damage ratio distribution, at PWG v Probability Peak Wind Gust, v 𝒇 𝒗 = wind speed distribution, at PWG v Probability Damage Ratio,D f(d) = overall damage ratio distribution = 𝒇 𝒅 𝒗 × 𝒇 𝒗 𝒅𝒗 𝝈 X X The larger the event, MDR ↑ while CV ↓
  • 20.
    𝑺𝑫𝒊 𝑺𝑫𝒊+𝟏 . .. . If Location losses are perfectly correlated (𝐢. 𝐞. , 𝝆 = 𝟏), 𝑺𝑫 𝒕𝒐𝒕𝒂𝒍,𝒄𝒐𝒓𝒓𝒆𝒍𝒂𝒕𝒆𝒅 = 𝒊 𝑵 𝑺𝑫𝒊 𝑺𝑫𝒊 𝑺𝑫𝒊+𝟏 . . . . If Location losses are perfectly uncorrelated (𝐢. 𝐞. , 𝝆 = 𝟎), 𝑺𝑫 𝒕𝒐𝒕𝒂𝒍,𝒊𝒏𝒅𝒆𝒑𝒆𝒏𝒅𝒆𝒏𝒕 = 𝒊 𝑵 𝑺𝑫𝒊 𝟐+ + 𝑺𝑫 𝒑𝒐𝒓𝒕𝒇𝒐𝒍𝒊𝒐 = 𝒘 ∗ 𝑺𝑫 𝒕𝒐𝒕𝒂𝒍,𝒄𝒐𝒓𝒓𝒆𝒍𝒂𝒕𝒆𝒅 + 𝟏 − 𝒘 ∗ 𝑺𝑫 𝒕𝒐𝒕𝒂𝒍,𝒊𝒏𝒅𝒆𝒑𝒆𝒏𝒅𝒆𝒏𝒕 Hence, overall portfolio standard deviation, Where w is correlation weights (i.e. more geo-concentrated portfolio will have larger w than one that is more diverse)
  • 21.
    Source: RMS Example showinghow uncertainty is incorporated into return period loss estimates.
  • 22.
    • Repeated resamplingof Event List Table (ELT) • Plot new EP curve with each realization, and sort them • Build confidence intervals for desired percentiles
  • 23.
    • Reduce modelrisk from reliance on single vendor opinion • May diversify away ‘independent imperfections’ • But, may introduce new uncertainties in the process! Model A Model B Blended Model
  • 24.
    Source: Ian Cook,Using Multiple Catastrophe Models, 2011 • If we have good reason to believe that, say at 400 year RP: – Greater chance the ‘true’ 1 in 400 year loss to be below B than above B – Greater chance the ‘true’ 1 in 400 year loss to be above A than below A • Then weighted average of A and B may be ‘less wrong’ than pure A or B alone.
  • 25.
    • Invokes aBayesian approach, i.e. : • 𝑷 𝑹𝑷𝒍𝒐𝒔𝒔 = 𝑷 𝑹𝑷𝒍𝒐𝒔𝒔 𝑴𝒐𝒅𝒆𝒍 𝑨) ∗ 𝑷 𝑴𝒐𝒅𝒆𝒍 𝑨 + 𝑷 𝑹𝑷𝒍𝒐𝒔𝒔 𝑴𝒐𝒅𝒆𝒍 𝑩) ∗ 𝑷 𝑴𝒐𝒅𝒆𝒍 𝑩 • Preserves event sets for other uses such as being fed into capital models. Source: Ian Cook, Using Multiple Catastrophe Models, 2011
  • 26.
    • Sensitivity testing/Stress Testing of model assumptions • Historical Event validation • Expert Judgment / Consultation with model vendors • Bias Correction Methods
  • 27.
    Alexander Pui Email: alexpui8@gmail.com Linkedin: https://au.linkedin.com/in/alexander-pui-94a33821