SlideShare a Scribd company logo
15
1. The Group
De Agostini S.p.A. owns a group of operating companies organised by business. Its structure
can be summarised as follows:
▪ Businesses
o Publishing
o Media & communication
o Gaming & services
▪ Finance
Each business comes under the responsibility of a sub-holding company which co-ordinates,
manages and controls all the operating companies in that sector.
Alongside the business/financial activities, holding company activities are carried out by
companies in the holding company structure, which includes De Agostini S.p.A. and other
direct and indirect financial subsidiaries.
A diagram summarizing the Group structure at 31 December 2018 is shown below, followed
by a brief description of the activities carried out by each sector.
De Agostini
S.p.A.
Ass. Generali
De Agostini Editore
DeA
Communications
IGT (Plc.) DeA Capital
Italy
Partworks
North America Gam.
and Inter.
Private Equity
Investment
Books
Grupo Pl.-
DeA (JV)
Banijay
Group
Holding
North America Lottery
Alternative Asset
Management
PUBLISHING MEDIA & COMM. GAMING & SERVICES FINANCE
Digital / Direct
Marketing
International
AtresmediaPublishing Activities
16
PUBLISHING
This sector is organised by business unit, based on the nature of products provided and the
channels used:
▪ Partworks, which includes Italian and international activities managed by the
subsidiary De Agostini Publishing. In this business unit, the Group supplies
collectable products aimed at different market ranging from hobbies to cinema and
music, products for children and cooking classes through news-stands, the Internet
and subscriptions.
▪ Books, which includes traditional publishing activities in Italy, in the school texts and
bookshop business areas, managed by the subsidiary De Agostini Libri. In the school
texts business, the Group mainly operates in the Italian market through De Agostini
Scuola under a number of brands in the primary and secondary school, university and
dictionary sectors. In the bookshop business, the Group operates through the affiliate
DeA Planeta Books, with a presence primarily in “Children’s books”, “Fiction”,
“General reference” and “Non-fiction”;
▪ Digital, which includes activities relating to thematic TV channels, real estate
advertised on digital platforms and websites managed partly directly by the company
and partly by its affiliates;
▪ Direct Marketing, for which a progressive phase-out process was decided the
previous year, includes mail-order channel activities aimed at consumers in many
European countries.
The sub-holding company for the Publishing activities is De Agostini Editore S.p.A. (De
Agostini Editore), which is fully-owned directly by De Agostini S.p.A.
17
MEDIA & COMMUNICATION
The sector includes the Group's interests in media & communication; the relevant sub-holding
company is DeA Communications S.A. (DeA Communications), which is fully-owned directly
by De Agostini S.p.A.
At December 31, 2017, the business included the following companies:
▪ Banijay Group Holding (parent company of the Banijay Group), which is
approximately 34% held on a fully diluted basis through LDH, a holding company that
is 49.9% owned by DeA Communications which, in turn, is the holder of a 68.6%
controlling stake in Banijay Group Holding.
Banijay Group Holding is the largest independent producer of TV and multi-media
content in the world, and is present in 16 countries (with fiction, factual, reality
entertainment and docu-drama entertainment productions, and children’s and
animation programs) and 61 brands (with a catalogue of over 20,000 hours of content
distributed worldwide);
▪ Grupo Planeta-De Agostini, a 50:50 joint venture with Planeta Corporación, which
controls:
- Atresmedia, a Spanish national radio/TV broadcaster listed on the Madrid stock
exchange;
- DeA Planeta, active in cinema and content distribution in Spain.
Based on the IAS/IFRS international accounting standards adopted by the Group in
preparing the consolidated financial statements, the activities in question are
recorded under "Investments in associates and joint ventures" and measured at
equity.
18
GAMING & SERVICES
The sector includes the Group’s activities in Gaming & Services. The sub-holding company for
these activities is IGT Plc, with its registered office in the UK and listed on the NYSE and
which is 50.64% controlled by De Agostini S.p.A. (At 31 December 2018).
IGT operates with the following structure:
▪ North America Gaming & Interactive (NAGI). Based in Las Vegas, Nevada, the
business offers a complete suite of casino products and solutions for the US and
Canadian markets through the development and delivery of games, systems and
solutions for traditional casinos and interactive online betting systems, and develops,
sells and licenses casino management systems that help casinos to improve their
operational efficiency and to provide customised services and promotional offerings.
The business's revenues are generated both by the sale/rental of gaming machines
and software to casinos and by services relating to the maintenance of machines and
systems.
▪ North America Lottery (NALO). This business, which is headquartered in
Providence, Rhode Island, develops and provides innovative solutions for lotteries and
performs research and development for all lottery-related products worldwide. These
solutions have enabled IGT to become the sole point of contact for most WLA (World
Lottery Association) customers in North America by providing support to 37 of 45
lotteries in the US. Business revenues are derived from both the sale and rental of
hardware, software and terminals for lotteries, and from the direct management of
two lotteries in Indiana and New Jersey through LMA (Lottery Management
Agreement) contracts. Lastly, NALO generates revenues from the sale of instant
lottery tickets;
▪ International In this business area, IGT is the world's leading provider of innovative
services and end-to-end solutions for all the regulated gaming channels and areas; it
also provides a variety of interactive games, such as poker, casino and bingo. The
business area is responsible for the strategic development and operational
management of IGT's full product portfolio for the following markets: Europe
(excluding Italy), the Middle East, Central America, Latin America, the Caribbean, Asia
and Oceania. Business revenues are generated by both the sale and rental of gaming
machines, software, centralized systems and other services to casinos, the sale of
games and interactive solutions and sport betting, the sale and rental of hardware,
software, terminals and services for lotteries, and the sale of instant lottery tickets,
professional services in the form of lottery facility management, and lottery operation
fees. Another source of revenues is the provision of processing services to a number
of lotteries in Latin America and the Caribbean, such as top-up services for mobile
phones and utility payments.
▪ Italy. This business area provides a broad range of business-to-consumer (B2C)
games with five product lines: (i) lotteries; (ii) gaming machines; (iii) sports betting;
(iv) commercial services; (v) interactive games.
- Lotteries: since 1998, IGT has been the concession-holder for Gioco del Lotto
in Italy, allowing it to capitalize on its significant experience in managing all
activities throughout the entire lottery value chain (collection of bets through
high-security processing systems, management of electronically connected
terminals at retail outlets, advertising and promotion, staff training, assistance
19
for license-holders and management of back office activities). In 2016, IGT
was awarded a new nine-year concession for Lotto, via its subsidiary
Lottomatica, acting in a consortium with other Italian and foreign operators.
Since 2004, Lottomatica has also acted as the sole concession-holder for
Gratta & Vinci (scratch & Win) acting in a consortium with other Italian and
foreign operators;
- Gaming machines: IGT directly operates AWP gaming machines and video
lottery terminals (VLT) that are installed in various retail outlets and connected
to a central system. The company also sells and rents systems, machines and
games to other concession-holders;
- Sports Betting: in Italy, IGT manages, as a dealer, an extensive network of
agencies and “corners” with the "Better" brand for the collection of sports and
non-sports betting linked to a proprietary platform; it also provides call centre
solutions/services, internet betting technology and other services related to
sports betting;
- Interactive games: IGT provides interactive games authorized in the Italian
market, such as online poker, casino, bingo, roulette, blackjack and other skill-
based games, sports and horse race betting, and online betting on car and
motorcycle races in addition to the games ‘10 e Lotto’, ‘Win for Life’,
‘Eurojackpot’ and online ‘Gratta e Vinci’.
- Commercial services: IGT offers processing services for high volumes of
commercial transactions not connected with lotteries, including top-up services
for mobile phones, payments for utilities and taxes/stamp duties, reloading
prepaid cards, and transport ticketing services.
20
FINANCE
This business area includes the activities carried out by the Group in alternative investment,
which are broken down into alternative asset management and private equity investment.
The sub-holding company for the Finance business is DeA Capital S.p.A. (DeA Capital), which
is listed on the FTSE Italia STAR segment of the Milan stock exchange and is directly controlled
by De Agostini S.p.A. with a stake of around 58.3% at 31 December 2018.
With assets under management of about EUR 11,900 million and an investment portfolio of
more than EUR 350 million, DeA Capital S.p.A. is one of Italy's largest alternative investment
operators.
▪ Alternative asset management
- In the Alternative Asset Management business, DeA Capital – through its
subsidiaries DeA Capital Real Estate SGR and DeA Capital Alternative Funds
SGR – is engaged in the promotion, management and enhancement of
investment funds in real estate, private equity and credit. Both investment
management companies have an approach based on their expertise in the
sector and ability to identify the best opportunities for return. Alternative Asset
Management has been DeA Capital’s main focus for strategic development in
recent years.
▪ Private equity investment
- In the Private Equity Investment business, DeA Capital has "permanent"
capital, and therefore has the advantage – compared with traditional private
equity funds, which are normally restricted to a pre-determined duration – of
greater flexibility in optimizing the timing of entry into and exit from
investments. In terms of investment policy, this flexibility allows it to adopt an
approach based on value creation, including over the medium to long term.
The Sector also includes a minority shareholding in Assicurazioni Generali, a leading insurance
company in Europe and listed on the Milan Stock Exchange, directly and indirectly owned at
31 December 2018 by De Agostini S.p.A. (approximately 1.46% of the share capital). In this
regard, it should be noted that with effect from 1 January 2018, DeA Partecipazioni, a
company with a 1.29% shareholding in Assicurazioni Generali and fully controlled by De
Agostini S.p.A., had been merged by incorporation into the latter. The remaining 0.17%
shareholding indirectly owned by De Agostini S.p.A. is held through DeA Communications,
which in 2018 acquired and then merged by incorporation the company that previously owned
the shareholding (i.e. B&D Finance S.A.).
HOLDING COMPANY ACTIVITIES
Holding company activities, including the activities carried out by the companies within the
holding company structure, included De Agostini S.p.A. as well as other directly or
indirectly controlled financial companies. Specifically, these activities relate to the
management of shareholdings in the sub-holding companies of the Group’s individual
businesses, as well as its interests in non-strategic shareholdings and activities.
21
2. Significant events during the year
Publishing
➢ Streamlining of direct marketing activities
In Direct Marketing, the Group continued its progressive phase-out activities in 2018, reducing
launch campaigns and focusing the business as on serving existing collections and maximising
the use of existing inventories.
As part of these activities, the Group also sold the property located in Lausanne and
simultaneously signed a leaseback contract (realising a capital gain of some EUR 12 million).
➢ Notification of a 50-50 joint venture between De Agostini Publishing and
Editorial Planeta DeAgostini
In 2018, in order to consolidate its position as Europe’s leading Partworks operator,
agreements were signed to set up a 50-50 joint venture between De Agostini Publishing and
Editorial Planeta DeAgostini.
The initiative concerns all collectable products (with the exception of the 'Kids' area) that
would be launched by the two companies in all European markets from the first half of 2019.
Gaming & services
➢ Payment of remaining tranches for renewal of the Scratch & Win concession
During 2018, the two remaining tranches (totalling EUR 750 million) were paid for the
renewal, for a period of 9 years until 30 September 2028, of the exclusive Italian Scratch &
Win licence. The payment was made by the licensee, Lotteries National, of which
IGT/Lottomatica Holding owns a 64% shareholding. The other stakeholders are owned by
Scientific Games (20%) and Arianna 2001 (16%).
➢ Refinancing operations
During 2018, new bonds were issued to replace bonds maturing before 2020; in particular:
▪ in June 2018, senior secured notes at 3.50% were issued with a maturity date of 2024
and a nominal value of USD 500 million;
▪ in September 2018, senior secured notes at 6.25% were issued with a maturity date
of 2027 and a nominal value of USD 750 million.
22
Financial activities
➢ Business combination between Crescita SPAC and the Cellular Group
On 4 June 2018, the business combination between Crescita SPAC and the Cellular Group,
brand owner of Cellularline and Italian leader in the development and sale of accessories for
smart phones and tablets, was finalised. Following the operation, which resulted in 35% of
special shares held being converted into ordinary shares, DeA Capital S.p.A. held 3.8% of the
combined entity, which has been renamed Cellularline S.p.A.
Subsequently, in the last quarter of 2018, DeA Capital purchased other securities on the
market to give it 4.3% of Cellularline's share capital; it should be noted that the purchases
continued into the first few months of 2019, giving it 4.4% of Cellularline’s share capital.
➢ Establishment of DeA Capital Real Estate France and DeA Capital Real State
Iberia
As part of the Alternative Asset Management development strategy, the creation of DeA
Capital Real Estate France SAS was finalised on 21 September 2018. This is a company
incorporated in France that is 70%-owned by the DeA Capital Group, with the remainder
owned by local key managers.
The company's objective is to develop real estate advisory activities for fundraising and for
consultancy and management of real estate assets in the French market, with a particular
focus on the core+, value-added and opportunistic sectors.
Following the end of the 2018 financial year, on 27 February 2019, the creation of DeA Capital
Real Estate France SAS was finalised as part of the Alternative Asset Management
development strategy. This is a company incorporated in France that is 73%-owned by the
DeA Capital Group, with the remainder owned by local key managers. The company's
objective is to develop real-estate advisory activities for fundraising and for real-estate
consultancy and management in the French market, with a particular focus on the core+,
value-added and opportunistic sectors.
With this initiative, DeA Capital has launched a pan-European real estate platform through
companies controlled by the Group and, strategically, with the participation of local senior
management teams; these can support Italian investors in initiatives beyond national borders
and attract international investors with a pan-European focus.
➢ Purchase of minority shareholdings in DeA Capital Real Estate SGR
The purchase of minority shareholdings in DeA Capital Real Estate SGR was finalised in
November 2018, equating to 29.73% of the company’s share capital, for consideration of
approximately EUR 40 million (as well as a EUR 4.5 million earn-out to be paid on achievement
of targets set for obtaining new assets under management in the three-year period 2019-
2021). Following this transaction, the DeA Capital Group brought its stake in the company to
94.03% of DeA Capital Real Estate SGR capital.
Following the end of the financial year, the acquisition of the residual minority shareholdings
in DeA Capital Real Estate SGR (5.97%) was finalised on 1 March 2019, for a base
23
consideration of approximately EUR 8 million (in addition to an earn-out worth up to EUR 0.9
million, to be paid on achievement of targets set for obtaining new assets under management
in the three-year period 2019-2021). The basic consideration was paid with DeA Capital
Treasury shares (5,174,172 shares corresponding to approximately 1.7% of its share capital
at EUR 1.555 per share).
Holding company activities
➢ Acquisition of B&D Finance (S.A.) by DeA Communications
On 28 March 2018, the purchase and sale agreement between B&D Finance S.p.A. and DeA
Communications was signed and executed for the purchase by the latter of 100% of B&D
Finance (S.A.), owned by B&D Finance S.p.A.The transaction, which can be seen in the
context of concentrating and streamlining the Group’s presence in Luxembourg, involved a
consideration of EUR 215.9 million (in line with the relevant shareholders’ equity) for the
equity value of B&D Finance, of which EUR 74.6 million was settled in cash on the sale date,
and EUR 141.4 million through a vendor loan.
On 5 July 2018, B&D Finance S.A. was merged into DeA Communications.
➢ Collar option on about 9% of IGT
On 22 May 2018, as part of the process to rebalance the risk profile of its portfolio, De Agostini
S.p.A. signed a number of agreements with Credit Suisse regarding the participation of De
Agostini S.p.A. in a collar option structure for 18 million IGT shares (representing about 9%
of the subsidiary's share capital out of a total of about 51% held).
In preparation for signing the above agreements, Credit Suisse placed a fraction of the total
number of IGT shares underlying the transaction (borrowed from third parties) for the
purposes of “delta hedging” at a reference price of USD 28.25 per IGT share (with a discount
of about 5% on the previous day’s closing price).
For De Agostini S.p.A., the collar, which consists of tranches with semi-annual maturities of
4 to 5.5 years, entailed the purchase of put options and the sale of call options expressed as
a percentage (based on the maturity of the individual tranche) of the price on Credit Suisse's
placement.
Instead of physical settlement, De Agostini S.p.A. has the option to close out the transaction
via a cash settlement, as part of which the position’s mark-to-market would be paid.
➢ Dividends received/paid
In June 2018, the shareholders' meeting of De Agostini S.p.A. approved the financial
statements for the year ending December 31, 2017 reporting a net profit of EUR 58.4 million,
and voted:
- to pay a dividend totaling EUR 24.9 million (EUR 0.60 per share) on the eligible shares (from
the net profit for the period);
- the allocation of the remaining amount to the extraordinary reserve (the legal reserve having
already reached one fifth of the share capital).
24
In 2018 De Agostini S.p.A. recorded dividends from the operating companies amounting to
EUR 102.0 million, of which EUR 63.4 million related to IGT (four quarterly dividends of USD
0.20 per share each, net of the “reversal” related to Dauphine project) and EUR 21.5 million
related to DeA Capital (deriving from the partial distribution of the share premium reserve at
EUR 0.12 per share) and EUR 17.1 million related to Assicurazioni Generali.
25
3. Analysis of the Group’s operating performance and financial
position
3.1 Introduction
➢ Legislative framework for preparation of the financial statements
The consolidated financial statements for the year ended 31 December 2018 were prepared
on the basis of the international accounting standards (IAS/IFRS) approved by the European
Union.
All the interpretations issued by the International Financial Reporting Interpretations
Committee (IFRIC), including those previously issued by the Standing Interpretations
Committee (SIC), approved by the European Union, were also applied in preparing the
Consolidated Financial statements.
The consolidated financial statements for the year ended 31 December 2018 were prepared
under the same accounting standards as those used in the previous year, the sole exceptions
resulting from the application, effective 1 January 2014, of the following:
▪ IFRS 9 - Financial Instruments, which modifies the reporting and valuation of
financial assets and liabilities, fully replacing IAS 39. In particular, the standard
provides for the classification and valuation of financial assets on the basis of three
business models:
✓ Hold to collect, i.e. financial assets held with the aim of collecting the related
contractual cash flows; in this case, the valuation criterion that can be used is
the amortized cost (if the ‘SPPI’ test criteria are exceeded – Solely payment of
principal and interest) or Fair Value through profit and loss;
✓ Hold to collect and sell, i.e. financial assets held both with the aim of collecting
the related contractual cash flows and with the aim of selling; in this case, the
valuation criterion that can be used is Fair Value through other comprehensive
income or Fair Value through profit and loss;
✓ Other business models: in this case, the valuation criterion that can be adopted
is Fair value through profit and loss.
The standard also introduces:
✓ a new impairment model, which differs from that currently set out in IAS 39,
and is mainly based on the concept of expected losses;
✓ changes, albeit limited, in the treatment of financial liabilities, in particular, new
rules applicable to reporting the effects of renegotiating financial liabilities.
▪ IFRS 15 - Revenues from contracts with customers, which replaces IAS 18 -
Revenues, IAS 11 - Contracts, SIC 31, IFRIC 13 and IFRIC 15, and requires revenues
to be recognised at the time the goods or services are transferred to customers in an
amount that reflects the consideration expected to be received in exchange for those
goods or services applying a new five-step model:
26
✓ identification of contracts with the customer;
✓ identification of performance obligations, i.e. contractual undertakings to
transfer goods and services to a customer, identifying separate performance
obligations within the same contract which should therefore be treated
separately;
✓ determination of the transaction price;
✓ allocation of transaction prices to the performance obligations;
✓ reporting of revenues when the related performance obligation is met or when
an obligation to perform is fulfilled, transferring the good or service to the
customer, i.e. when the customer obtains control of the good or receives the
service. Control may be transferred progressively over time or at a specific
point in time.
The impact on the Group's consolidated financial statements of the application of IFRS 9 and
IFRS 15 standards is not highly significant with regard to the balance sheet. The 2017 Income
Statement did not require any restatement following the application of the new standards,
since it was not required under IFRS 9 and the Group adopted the Cumulative Catch-up
Method under IFRS 15 (and reported the cumulative effect of the standard to adjust the
opening balance for shareholders' equity).
The "Restated consolidated financial statements" included in the financial statements for the
year ended 31 December 2017 are given below. These statements were revised based on the
provisions of IFRS 9 and IFRS 15 to make them comparable with the statements for 2018 as
set out in this Report on Operations.
The provisions of Legislative Decree 38/2005 and of the IAS/IFRS constitute the legislative
framework for the Company in preparing the Consolidated Financial Statements.
In accordance with the provisions of Legislative Decree 38/2005, the Company prepares its
financial statements pursuant to arts. 2423 et seq. of the Italian Civil Code.
Figures in EUR million
Goodwill 5,005 - - 5,005
Other intangible assets 1,946 - - 1,946
Tangible assets 1,379 - - 1,379
Investments 1,535 (1) (6) 1,528
Cash and cash equivalents 1,192 - - 1,192
Other net assets 421 - 42 463
TOTAL 11,478 (1) 36 11,513
for hedging:
Financial liabilities 8,441 (14) - 8,427
Shareholders' equity 3,037 13 36 3,086
IFRS 9
Effect 1.1.2018
IFRS 15
Effect
31.12.2017
"As Reported"
27
➢ Reclassified Consolidated Financial Statements
The Consolidated Financial Statements and explanatory notes in this document have been
supplemented with a number of performance indicators that enable the management to
provide information on the performance of the Group’s businesses, in line with analysis and
control parameters.
For this reason, a set of reclassified Consolidated Financial Statements was prepared showing
performance indicators more commonly used by the management than those shown in the
above-mentioned Consolidated Financial Statements and explanatory notes. These are:
▪ Net revenues This represents the turnover of individual businesses and the Group
as a whole, calculated as the income from sales and services.
▪ EBITDA This represents operating profit/(loss) before tax, financial income/charges,
one-off items, profits/losses of shareholdings valued at equity, depreciation and
amortization, and other non-cash items (e.g. impairment losses and gains/losses on
the sale of tangible and intangible assets). Given the nature of the business carried
out by the companies in the Finance business and the holding company structure, the
net financial income relating to these activities is included in EBITDA (Earnings before
interest, tax, depreciation and amortisation).
▪ ORDINARY EBIT This is calculated using the EBITDA figure plus the profits/losses
on shareholdings valued at equity, depreciation and amortization and other ordinary
non-cash items.
▪ ORDINARY EBT This is calculated by subtracting the figure for net financial
income/expenses from ORDINARY EBIT.
This figure – like ORDINARY EBIT – does not include the effects of any
impairment or other non-recurring items included in the NON-ORDINARY
EBT figure, which is shown separately.
▪ NET FINANCIAL POSITION (NFP) This represents the difference between: (+)
cash and cash equivalents, as well as loans, receivables and certain financial assets
with changes in fair value recognized in Comprehensive Income (Other
comprehensive income - OCI) or in the Income Statement; (-) financial liabilities.
Net revenues, EBITDA, ORDINARY EBIT/EBT and net financial position are alternative
performance indicators not determined according to IAS/IFRS; they are reported to help show
performance trends, as well as to provide useful information on the Group’s ability to manage
debt, and to assist in estimating the value of group assets.
The reclassified Consolidated Financial Statements show the same net profit/(loss)
and shareholders’ equity as the Consolidated Financial Statements and are used
below to comment on both the consolidated results and those of the individual
business areas.
28
3.2 Reclassified Consolidated Financial Statements
A summary is given below of the Group’s key financial and operating performance indicators,
based on the reclassified Consolidated Financial Statements, prepared in line with the above
explanations.
It should first be noted that the comparison between revenues recorded in 2018 with those
recorded in 2017 is affected by:
▪ the disposal of Double Down Interactive which led to its deconsolidation from the date
of its disposal (June 2017);
▪ the introduction of IFRS 9 - Financial instruments and IFRS 15 - Revenues from
contracts with customers as from 1 January 2018. It should be noted, in particular,
that following the introduction of IFRS 9 from 1 January 2018 most of the changes in
the fair value of financial investments were recorded in the profit and loss account in
2018, thereby impacting the EBITDA for Financial Activities and Holdings, whereas
they were recorded directly as shareholders’ equity in 2017.
(*) As at 1 January 2018 (-7,011 EUR million at 31 December 2017).
Figures in EUR million 2018 2017 Absolute %
REVENUES 4,497 4,794 (297) -6%
EBITDA 1,546 1,484 62 4%
Deprec., amort. and other non-cash items (813) (922) 109
Income (loss) from equity investments 27 41 (14)
ORDINARY EBIT 760 603 157 26%
Financial income/(charges) (382) (417) 35
ORDINARY EBT (A) 378 186 192 103%
Impairment (166) (689) 523
Other non-recurring income/(charges) 67 (484) 551
NO - ORDINARY EBT (B) (99) (1,173) 1,074 n.a.
EBT (A+B) 279 (987) 1,266 n.a.
Taxes (155) 25 (180)
Net profit (loss) from assets sold/discontinued operations - 1 (1)
Consolidated net profit (loss) 124 (961) 1,085 n.a.
Of which:
Net profit (loss) pertaining to minorities 7 (444) 451 n.a.
Net profit (loss) pertaining to group 117 (517) 634 n.a.
Net Financial Position (7,589) (6,997) (592) n.a.
Of which:
Gaming and Services (7,186) (6,533) (653) n.a.
Change
(*)
29
3.3 Operating performance
➢ Net revenues
Consolidated net revenues in 2018 were EUR 4,497 million, a decrease of around 6% as
compared with 2017 (EUR 4,794 million). These figures break down as follows:
Net revenues from Editorial Activities were EUR 333 million, a decline of EUR 54 million
compared to 2017 (-14.0%) attributable to both Partworks (EUR -27 million, mainly due to
the fall in volumes of the European Core, especially in Germany and the UK), and of Direct
Marketing (EUR -30 million), following the phase-out process of activities.
Gaming & Services reported net revenues of EUR 4,101 million, down from 2017 (EUR 4,339
million) due mainly to the sale of Double Down Interactive (EUR -103 million) and the
unfavourable effect of the USD/EUR exchange rate.
The Finance business posted net revenues of EUR 65 million, a rise of EUR 5 million
compared with 2017. The revenue in question derived primarily from Alternative Asset
Management fees and income from service activities, and in particular those relating to
consultancy, management and the sale of properties in the real-estate funds portfolios
➢ EBITDA
The Group recorded EBITDA of EUR 1,546 million for the year ended 31 December 2018, an
increase as compared with the previous year. This breaks down as follows:
EBITDA for Publishing Activities of EUR 25 million, an increase of EUR 42 million compared
with 2017, mainly due to the performance of Partworks, which is beginning to benefit from
the restructuring process undertaken in previous years and from the phase-out activity of
Direct Marketing.
EBITDA for Gaming and Services was EUR 1,482 million, substantially in line with 2017,
despite the sale of Double Down Interactive (EUR -29 million) and the unfavourable effect of
the USD/EUR exchange rate.
Net Revenues
Figures in EUR million 2018 % 2017 % Change
Publishing 333 7.4% 387 8.1% (54)
Gaming & Services 4,101 91.2% 4,339 90.5% (238)
Finance 65 1.4% 60 1.3% 5
Holding Companies / Eliminations (2) 0.0% 8 0.2% (10)
Consolidated Total 4,497 100.0% 4,794 100.0% (297)
EBITDA
Figures in EUR million 2018 % 2017 % Change
Publishing 25 1.6% (17) -1.1% 42
Gaming & Services 1,482 95.9% 1,485 100.1% (3)
Finance 70 4.5% 35 2.4% 35
Holding Companies / Eliminations (31) -2.0% (19) -1.3% (12)
Consolidated Total 1,546 100.0% 1,484 100.0% 62
30
EBITDA for the Finance business was EUR 70 million (EUR 35 million in 2017), reflecting
the dividend received from Assicurazioni Generali (EUR 19 million, versus EUR 16 million in
2017) and the contribution made by DeA Capital’s activities. In particular, DeA Capital's
activities in 2018 reflected the capital gain from the sale of Corin (EUR +51 million) and the
fair value adjustment of Kenan Inv./Migros (EUR -25 million).
EBITDA for Holding company activities/other was negative at EUR -31 million, down by
EUR -12 million on 2017, mainly due to the increased costs for services, in particular those
relating to the Dauphine project.
➢ ORDINARY EBIT
The Group’s ORDINARY EBIT for the year ended 31 December 2017 was EUR 764 million,
after deducting depreciation/amortization charges and other ordinary non-cash items totalling
EUR 813 million, and income from shareholdings measured at equity totalling EUR 28 million.
Amortization, depreciation and other ordinary non-cash items break down as follows:
▪ EUR 433 million for amortization and write-downs of intangible assets (EUR 556 million
in 2017), especially for customer relationships;
▪ EUR 380 million relating to depreciation and write-downs of tangible assets (EUR 366
million in 2017).
In 2018, the Group reported a profit of EUR 27 million from shareholdings measured at equity,
compared with a profit of EUR 41 million in 2017; in particular, the 2018 figure included the
profit from Grupo Planeta-De Agostini of EUR +26 million (EUR +30 million in 2017) and of
LDH/Banijay Group Holding of +EUR 4 million (EUR +5 million in 2017).
ORDINARY EBIT
Figures in EUR million 2018 2017 Change
EBITDA 1,546 1,484 62
Deprec., amort. and other non-cash items (813) (922) 109
Income (loss) from equity investments 27 41 (14)
ORDINARY EBIT 760 603 157
31
➢ Net profit (loss)
The table below shows the relationship between ORDINARY EBIT and consolidated net
profit/(loss):
ORDINARY EBT for 2018 was positive at EUR 378 million, after deducting a negative financial
management balance of EUR 382 million.
With regard to financial management, the balance in 2018 (compared with the corresponding
values of 2017) breaks down as follows:
▪ EUR -2 million relating to Publishing Activities (EUR -7 million in 2017, after deduction
of foreign exchange charges and hedging transactions);
▪ EUR -353 million relating to the Gaming & Services business (EUR -396 million in
2017);
▪ EUR -27 million relating to Holding Activities (EUR -14 million in 2017), after deduction
of the transfer of IGT dividends related to the Dauphine Project.
Non-ordinary charges totalling EUR -99 million in 2018 (versus non-ordinary income of -EUR
1,173 million in 2017) were included in the NON-ORDINARY EBT figure. Particular note should
be taken of the following items recorded in 2018:
▪ Impairment of EUR -166 million, of which EUR -163 million related to the Gaming and
Services business, primarily goodwill on international activities. This alignment in
value, which has no monetary impact and therefore no bearing on the company's NFP,
was based on the outcome of an impairment test conducted following the 2018 results
(lower than expected) and a higher weighted average cost of capital.
Net profit (loss)
Figures in EUR million 2018 2017 Change
ORDINARY EBIT 760 603 157
Financial income/(charges) (382) (417) 35
ORDINARY EBT (A) 378 186 192
Impairment (166) (689) 523
Other non-recurring income/(charges) 67 (484) 551
NO - ORDINARY EBT (B) (99) (1,173) 1,074
EBT (A+B) 279 (987) 1,266
Taxes (155) 25 (180)
Net profit (loss) from assets sold/discontinued
operations - 1 (1)
Consolidated net profit (loss) 124 (961) 1,085
Of which:
Net profit (loss) pertaining to minorities 7 (444) 451
Net profit (loss) pertaining to group 117 (517) 634
32
▪ Other non-recurring income/(expenses) of EUR +67 million (EUR -484 million in 2017),
of which EUR +156 million relating to the fair value adjustment of the Dauphine
Project, EUR +113 million relating to the USD/EUR exchange rate effect (mainly for
conversion into EUR of the USD loans held by IGT), EUR -47 million relating to IGT
Liability Management costs, in particular, a buy-back of bonds, and EUR -127 million
relating to the minority interest in the Lottoitalia profit, reported in the consolidated
financial statements as remuneration for the financial debt recorded and not as income
attributable to minority interests (by virtue of specific contractual clauses existing
between Lottomatica, the controlling shareholder of Lottoitalia, and third party
shareholders).
In terms of taxes, a charge of EUR -155 million was posted in 2018 (compared with a gain of
EUR 25 million in 2017) due to the higher taxable income in 2018. It should also be noted
that 2017 included the tax benefit obtained from the change in tax regulations in the USA,
offset by the tax burden related to the sale of Double Down Interactive.
To summarise, the Consolidated Net Income was positive at EUR 124 million in 2018,
compared with a negative EUR -961 million in 2017, with a positive Net Income attributable
to the Group of EUR +117 million, compared with negative Net Income of EUR -517 million in
2017.
The Net Income attributable to minority interests, which was positive by EUR +7 million in
2018 (compared with the negative value of EUR -444 million in 2017), mainly reflected EUR
-12 million relating to the pro-rata share of the IGT Group's Net Income (EUR -428 million in
2017), EUR +19 million relating to the pro-rata share of the Net Income of the DeA Capital
Group/IDeA OPI I Group (EUR -18 million in 2017).
33
➢ Statement of Performance – IAS 1
A summary version of the Comprehensive Income or Statement of Performance – IAS 1, is
shown below. It reports the net profit/(loss) for the year as the sum of the portion recorded
on the Income Statement and that posted directly to shareholders' equity:
(/)
It should be noted that in 2017, this item reflected the changes in the fair value of financial
assets classified as "Available for Sale"; as laid down in IFRS 9, from 1 January 2018 the
changes in the fair value of these assets were mostly recognised in the Income statement.
Gains/(losses) related to Financial Activities at fair value in 2018 recorded a negative balance
of EUR 19 million (positive balance of EUR 33 million in 2017, which included a positive change
in the fair value of Assicurazioni Generali of EUR 22 million and of the IDeA Taste of Italy
group, managed by DeA Capital Alternative Funds, of EUR +10 million), attributable in
particular to negative changes in the fair value of Assicurazioni Generali (EUR -14 million) and
financial investments made by the IGT Group (EUR -5 million).
Exchange gains/(losses) mainly reflect the impact of the conversion into EUR of the Financial
Statements of Group companies prepared in different currencies, particularly in relation to
Gaming and Services (EUR +19 million, compared to EUR -232 million in 2017, mainly due to
the revaluation of the USD versus the EUR).
To summarise, comprehensive income totalled EUR +130 million in 2018, compared with a
negative figure of EUR -1,179 million in 2017; the portion attributable to the Group was
positive, amounting to EUR +114 million as compared with a negative figure of EUR -621
million in 2017.
Statement of Performance - IAS 1
Figures in EUR million 2018 2017
Net Profit/(Loss) (A) 124 (961)
Items that could be subsequently reclassified within the profit (loss) for the period
Profit / (loss) on available-for-sale financial assets n.a 33
Profit / (loss) on traslating foreign operations 19 (235)
Profit / (loss) on cash flow hedge 1 (4)
Profit / (loss) on investments valued at equity 1 (15)
Tax effect 1 1
Items that could be subsequently reclassified within the profit (loss) for the period
Profit / (loss) on financial assets at Fair Value (19) n.a
Profit/(loss) on remeasurement of defined benefit plans 4 2
Tax effect (1) -
Other comprehensive income/(loss) (B) 6 (218)
Total comprehensive income/(loss) (A+B) 130 (1,179)
Of which:
Net profit (loss) pertaining to minorities 16 (558)
Net profit (loss) pertaining to group 114 (621)
(/)
34
3.4 Statement of financial position
The table below provides a summary of the Group’s key figures from the statement of financial
position.
Goodwill
At 31 December 2018, goodwill was EUR 5,046 million (EUR 5,005 million at 31 December
2017), which broke down as follows:
▪ EUR 34 million relating to Publishing activities (unchanged from 31 December 2017),
entirely attributable to the School segment;
▪ EUR 4,918 relating to Gaming and Services (EUR 4,877 million at 31 December 2017);
the change with respect to 31 December 2017 of EUR +41 million, is due to the change
in the difference from conversions on goodwill in foreign currencies (EUR +202
million), partly offset by the impairment posted for International Activities;
▪ EUR 94 million related to Financial Activities (unchanged from 31 December 2017)
arising from the acquisition of DeA Capital Alternative Funds SGR (EUR 31 million) and
IFIM/FIMIT SGR, now called DeA Capital Real Estate SGR (EUR 62 million).
Other intangible assets
Other intangible assets include intellectual property rights, concessions, licenses and
trademarks, as well as other intangibles.
At 31 December 2018, Other intangible assets totalled EUR 1,835 million (EUR 1,946 million
at 31 December 2017), comprising:
▪ EUR 34 million relating to the Publishing business (EUR 33 million at 31 December
2017), mainly in respect of publishing investments relating to School Texts, intellectual
property rights and basic software and applications;
▪ EUR 1,780 million relating to the Gaming & Services business (EUR 1,890 million at
31 December 2017), primarily for customer agreements, concessions, licenses and
capitalized software. The decrease recorded in 2018 for a total of EUR 110 million was
mainly due to depreciation for the period (EUR -231 million), arising from the change
Figures in EUR million Change
Goodwill 5,046 5,005 41 5,005
Other intangible assets 1,835 1,946 (111) 1,946
Tangible assets 1,400 1,379 21 1,379
Investments 1,690 1,528 162 1,535
Cash and cash equivalents 555 1,192 (637) 1,192
Other net assets 1,135 463 672 421
TOTAL 11,661 11,513 148 11,478
for hedging:
Financial liabilities 8,421 8,427 (6) 8,441
Shareholders' equity 3,240 3,086 154 3,037
31.12.2018 31.12.20171.1.2018
35
in the difference from conversions (EUR +73 million) and increases made during the
year (EUR +49 million);
▪ EUR 21 million relating to Financial Activities (EUR 23 million at 31 December 2017),
chiefly due to customer contracts and performance fees for asset management, project
management and agency activities.
Tangible assets
At 31 December 2018, tangible assets totalled EUR 1,400 million (EUR 1,379 million at 31
December 2017), which broke down as follows:
▪ Real estate equating to EUR 72 million (EUR 81 million at 31 December 2017);
▪ Other tangible assets amounting to EUR 1,328 million (EUR 1,298 million at 31
December 2017).
Real estate, amounting to EUR 72 million, included:
▪ EUR 12 million relating to Publishing Activities (EUR 19 million at 31 December 2017);
The decline as compared with 2017 derived primarily from the disposal in 2018 of real
estate located in Losanna;
▪ EUR 59 million relating to the Gaming & Services business (EUR 61 million at 31
December 2017);
▪ EUR 1 million relating to the Financial Activities (EUR 1 million at 31 December 2017).
Other tangible assets totalled EUR 1,328 million, including:
▪ EUR 3 million relating to Publishing Activities (EUR 4 million at 31 December 2017);
▪ EUR 1,320 million relating to the Gaming & Services business (EUR 1,288 million at
31 December 2017), mainly for terminals and contract-related systems;
▪ EUR 5 million relating to Holding Company Activities (EUR 5 million at 31 December
2017).
Investments
At 31 December 2018, the Group’s investments totalled EUR 1,690 million. A breakdown of
this item is given below:
At 31 December 2018, investment property equated to EUR 40 million (EUR 51 million at 31
December 2017), attributable to the Venere Fund (managed by DeA Capital Alternative
Funds), De Agostini S.p.A. and Immobiliare San Rocco; the decrease from 31 December 2017
was due to sales of real-estate units held by the Venere Fund and to the disposal by De
Agostini S.p.A. of two buildings in Novara. Depreciation and write-downs of EUR 1 million
were charged for the period (in line with 2017).
Investments
Figures in EUR million 31.12.2018 1.1.2018 Change 31.12.2017
Investment properties 40 51 (11) 51
Equity Investments 538 539 (1) 546
Loans and receivables 236 198 38 198
Available-for-sale financial assets n.a. n.a. n.a. 683
Financial assets at fair value through OCI 345 310 35 n.a.
Financial assets at fair value through profit or loss 531 430 101 57
Total group 1,690 1,528 162 1,535
36
Shareholdings measured at equity included Grupo Planeta-De Agostini at EUR 341 million and
LDH/Banijay Group at EUR 131 million.
Loans and receivables totalled EUR 236 million, an increase of EUR 38 million on the balance
at 31 December 2017 (EUR 198 million), and mainly include the customer financing
receivables of IGT.
Financial assets valued at fair value with changes recognised in the other components of the
comprehensive income statement (OCI) amounted to EUR 345 million; these mainly reflected
the investment, recognised under Financial assets, in Assicurazioni Generali, recorded for a
value of EUR 333 million on the basis of the closing price on 31 December 2018 (EUR
14.60/share, compared with EUR 15.20/share on 31 December 2017). At 31 December 2018,
the Group owned 1.46% of the share capital of Assicurazioni Generali, i.e. 22,830,815 of its
shares (20,130,815 at 31 December 2017).
Financial assets valued at fair value with changes recognised in the income statement
amounted to EUR 531 million:
▪ derivatives for EUR 170 million, mainly attributable to the positive mark-to-market of
the Dauphine Project (EUR +163 million);
▪ investments in funds for EUR 182 million, of which EUR 154 million was held through
Financial Activities, EUR 24 million through Holding Company Activities and EUR 4
million through Gaming and Services;
▪ other equity investments/assets for EUR 179 million, of which EUR 75 million were
held through Financial Activities, EUR 98 million through Holding Company Activities
and EUR 6 million through Gaming and Services.
Other net current assets
At 31 December 2018, "Other net current assets" totalled EUR +1,135 million. The table below
shows the items included in this balance:
The net balance of "Trade receivables and payables" comprised trade receivables of EUR 902
million and trade payables of EUR 991 million.
The net balance of "Tax assets and liabilities” included deferred tax assets of EUR 56 million
and deferred tax liabilities of EUR 386 million.
The net balance of Other assets/liabilities included Other asset items totalling EUR 2,411
million (EUR 2,563 million at 1 January 2018, or EUR 2,530 million at 31 December 2017), of
which Inventories for EUR 269 million and Other liabilities for a total of EUR 674 million; in
particular, the decrease in Other liabilities was attributable to the payment of the residual
Other net assets
Figures in EUR million 31.12.2018 1.1.2018 Change 31.12.2017
Trade receivables/payables: net balance (89) (130) 41 (131)
Net balance of tax assets/liabilities (422) (461) 39 (452)
Net balance of other assets/liabilities 1,737 1,146 591 1,095
Provisions (91) (92) 1 (91)
Total group 1,135 463 672 421
37
portion of the Upfront Fee connected with the renewal, for 9 years until 30 September 2028,
of the Italian exclusive Scratch & Win licence (recognised in this item at the end of 2017).
At 31 December 2018, provisions amounting to EUR 91 million, mainly consisting of provisions
for employee severance indemnities of EUR 19 million, other provisions relating to personnel
for EUR 6 million, the agent severance fund for EUR 4 million and provisions for future risks
and charges, including those relating to investee companies, for EUR 62 million.
Shareholders' equity
At 31 December 2018, consolidated shareholders' equity (Group and minority interests)
amounted to EUR 3,240 million (compared with EUR 3,086 million at 1 January 2018, or EUR
3,037 million at 31 December 2017); the Group's share of shareholders' equity stood at EUR
1,763 million (compared to EUR 1,680 million at 1 January 2018, or EUR 1,651 million at 31
December 2017), while minority interests in shareholders' equity amounted to EUR 1,477
million (compared to EUR 1,406 million at 1 January 2018, or EUR 1,386 million at 31
December 2017).
The increase in net equity attributable to the Group is mainly reflected by the following:
▪ net gain of EUR +117 million for 2018;
▪ the payment of dividends totalling EUR -25 million;
▪ other changes totalling EUR -9 million.
The increase in net equity attributable to minority interests was due to the following:
▪ net gain of EUR +7 million for 2018;
▪ the payment of dividends totalling EUR -116 million (to the minority shareholders of
IGT and DeA Capital);
▪ other variations for a total of EUR +180 million, related in particular to the net capital
increases attributable to minority interests in Lotterie Nazionale for payment of the
remaining tranches for renewal of the Scratch & Win licence.
Net Financial Position (NFP)
The table below shows the Group’s net financial position broken down by business area:
The main change in the net financial position in terms of NFP, both at Group level and with
regard to Gaming and Services, is mainly due to the payment of the remaining tranches for
the renewal of the Scratch & Win licence in Italy (EUR -750 million).
With specific reference to Holding Company Activities, the NFP balance at 31 December 2018
was negative at EUR -493 million, of which EUR -550 million due to banks, EUR -80 million
Net Financial Position
Figures in EUR million 31.12.2018 1.1.2018 Change 31.12.2017
Publishing (64) (108) 44 (108)
Gaming & Services (7,186) (6,533) (653) (6,533)
Finance 154 133 21 133
Holding (493) (489) (4) (503)
Total group (7,589) (6,997) (592) (7,011)
38
due to the De Agostini S.p.A. convertible bond, EUR +125 million due to liquid assets and
EUR +12 million due to Other activities/liabilities. The NFP balance at 31 December 2018
decrease by EUR -4 million due to the combined effect of dividends received from investee
companies of EUR +119 million (net of the "transfer" of IGT dividends relating to the Dauphine
Project) and dividends paid to the shareholders of EUR -25 million, net disbursement linked
to the purchase of B&D Finance (S.A.) by DeA Communications for EUR -62 million, receipts
from distributions by IDeA OF I (EUR +20 million) and structural and financial charges/other
(EUR -56 million) (including underwriting fees and bonuses paid in relation to the Dauphine
Project).
As mentioned earlier, the net financial position is calculated using the figures reported in the
financial statements and is the difference between: (+) cash and cash equivalents, as well as
loans, receivables and certain financial assets with changes in fair value recognized in
Comprehensive Income (OCI) or in the Income Statement; (-) financial liabilities.
The reconciliation statement below shows the key figures in the Consolidated Statement of
Financial Position at 31 December 2018 as compared with the amounts included in the net
financial position.
The differences seen, in particular between Financial Activities with variations in fair value
recognised under Comprehensive Income (OCI) or in the Income statement, are essentially
related to the classification within these items of Activities that qualify for inclusion in the
management indicator of Net Financial Positions in accordance with the Group Accounting
Principles; in particular, at 31 December 2018, and was the case at 31 December 2017, the
most significant differences related to the value of investments in Assicurazione Generali, in
funds and in other financial investments.
For information on the use of financial instruments, pursuant to art. 2428(2)(6-bis) of the
Italian Civil Code, please refer to the notes to the consolidated financial statements for the
year ending 31 December 2018.
Figures in EUR million
Carrying
amount at
31.12.2018
of which in
Net Financial
Position
INVESTMENTS - NON-CURRENT ASSETS 850 16
Financial assets at fair value through OCI 339 6
Financial assets at fair value through profit or loss 511 10
LOANS AND RECEIVABLES - NON-CURRENT ASSETS 79 79
INVESTMENTS - CURRENT ASSETS 25 25
Financial assets at fair value through OCI 6 6
Financial assets at fair value through profit or loss 19 19
LOANS AND RECEIVABLES - CURRENT ASSETS 157 157
CASH AND CASH EQUIVALENTS 555 555
NON-CURRENT FINANCIAL LIABILITIES (7,905) (7,905)
CURRENT FINANCIAL LIABILITIES (516) (516)
Net Financial Position - Group (6,755) (7,589)
39
* * *
In addition to the commentary on the consolidated results, with the related breakdown by
business, see the following websites for details of the financial information for the Group’s
main businesses, which mainly consist of companies whose shares are traded on regulated
markets:
▪ www.atresmedia.com
▪ www.igt.com
▪ www.deacapital.it
▪ www.generali.com.
40
3.5 Main risks and uncertainties to which the Parent Company and consolidated
Group companies are exposed
As mentioned in the first section of the Report on Operations, the Group operates in a number
of business sectors and in finance and is organized accordingly; each business activity
comes under a sub-holding company, which is responsible for the coordination, management
and control of all the companies that pertain to it. Alongside the above-mentioned activities,
Holding Company Activities are carried out by companies in the holding company
structure, which includes the Parent Company and other directly and indirectly controlled
financial companies.
Given its structure and the international arena in which it operates, the Group is exposed to
a number of risks and uncertainties, which can be categorized as either systemic risks or
specific risks.
Such risks may significantly affect the operating performance and financial position of the
Parent Company and the other companies included in the Group's Consolidated Financial
Statements.
Systemic risks relate to trends in macroeconomic variables in the different countries in which
the Group operates, and at global level, including GDP, interest rates, inflation, exchange
rates and unemployment, as well as the state of the financial markets – which particularly
affects access to capital and return on investment (especially financial investment).
Specific risks can be analysed according to individual business areas, and include:
▪ for the Publishing business, risks connected with the demand for published products
(i.e. partworks, school texts and others), the costs of producing these items, legislative
changes and the efficiency and effectiveness of logistics systems;
▪ for the Media & Communications business, risks associated with the performance of
TV broadcasters (in turn affected by trends in advertising revenues) and the creative
abilities required to launch new program formats on the market;
▪ for the Gaming & Services business, risks connected with the renewal of existing
contracts or licenses, the innovation required to launch new gaming and services
products, production capacity for new gaming/lottery management systems, the
possibility of a technological malfunction (system and/or terminals) that prevents
collection of receipts, and fixed-odds sports betting, where the operator bears the
bookmaking risk;
▪ for Financial Activities, risks connected with typical private equity activity and
alternative asset management activity (undertaken by DeA Capital Real Estate SGR
and DeA Capital Alternative Funds SGR), and the performance of the investments
made.
Risks for each business, common to all business areas in which the Group is highly diversified,
are also associated with the attitude of management, relationships with employees and
suppliers, and integration policies.
The specific risks relating to the holding company activities – in addition to those connected
with the management of the operations in the above-mentioned business sectors and Finance,
41
and the associated effects on cash flow or dividends – include exposure to specific sectors or
investments and the difficulties of identifying opportunities for investments or disposals.
Although we stress the significance of the above-mentioned risks for the Group’s operating
performance and financial position, we have put in place appropriate measures to limit the
impact of any serious negative developments.
With regard to systemic risks, in the early 2000s the Group started to diversify its
investments, both by sector and by geographical area. It now has a widely diversified portfolio
of activities combining resilient businesses (such as gaming and related services) with others
that have good long-term growth prospects (such as media and content production), all with
a strong international footprint.
With regard to specific risks, the Group believes it has adopted a modern system of
governance for its businesses, facilitating the effective management of complexity and the
achievement of the strategic goals of the sub-holding companies and the Group. Specifically,
this governance system has set out the procedures for managing relationships between the
Parent Company and sub-holding companies, and the responsibilities of the latter concerning
the coordination, management and control of all operating companies under their
responsibility.

More Related Content

Similar to De Agostini SpA - Bilancio 2018 English

De Agostini 2021 highlights.pdf
De Agostini 2021 highlights.pdfDe Agostini 2021 highlights.pdf
De Agostini 2021 highlights.pdf
DeA Capital S.p.A.
 
THE GAME COMPANY - Farvi comunicare per noi è un gioco!
THE GAME COMPANY - Farvi comunicare per noi è un gioco!THE GAME COMPANY - Farvi comunicare per noi è un gioco!
THE GAME COMPANY - Farvi comunicare per noi è un gioco!
Stefano Momoni
 
Austria Pitch Deck
Austria Pitch DeckAustria Pitch Deck
Austria Pitch Deck
iyzico
 
Abstract - Italian Gambling market report - Oct 2010
Abstract - Italian Gambling market report - Oct 2010Abstract - Italian Gambling market report - Oct 2010
Abstract - Italian Gambling market report - Oct 2010
TrustPartners
 
Get Italy Corp 2011.Pptx
Get Italy Corp 2011.PptxGet Italy Corp 2011.Pptx
Get Italy Corp 2011.Pptx
lallateo
 
Get Italy Corporate 2011
Get Italy Corporate 2011Get Italy Corporate 2011
Get Italy Corporate 2011lallateo
 
SYNOT-companyprofile.pdf
SYNOT-companyprofile.pdfSYNOT-companyprofile.pdf
SYNOT-companyprofile.pdf
FrancisSalami
 
Predixit TecTour profile
Predixit TecTour profilePredixit TecTour profile
Predixit TecTour profile
Predixit
 
GO ITALY CARD - Increase sales by joining the number one discount pass for Italy
GO ITALY CARD - Increase sales by joining the number one discount pass for ItalyGO ITALY CARD - Increase sales by joining the number one discount pass for Italy
GO ITALY CARD - Increase sales by joining the number one discount pass for Italy
Italian Entertainment And More
 
PUBLIC GAMING INTERNATIONAL MAGAZINE - April 2015
PUBLIC GAMING INTERNATIONAL MAGAZINE - April 2015PUBLIC GAMING INTERNATIONAL MAGAZINE - April 2015
PUBLIC GAMING INTERNATIONAL MAGAZINE - April 2015
Oliver Grave
 
Catalan Exhibitors MWC 2018
Catalan Exhibitors MWC 2018Catalan Exhibitors MWC 2018
"Emprender en el sector de juegos online" Expojoc, Septiembre 2014
"Emprender en el sector de juegos online" Expojoc, Septiembre 2014"Emprender en el sector de juegos online" Expojoc, Septiembre 2014
"Emprender en el sector de juegos online" Expojoc, Septiembre 2014
Carlos Blanco
 
[Interreg YESS] Mobilizing the Startup Ecosystem of Greece - Greek Italian Ch...
[Interreg YESS] Mobilizing the Startup Ecosystem of Greece - Greek Italian Ch...[Interreg YESS] Mobilizing the Startup Ecosystem of Greece - Greek Italian Ch...
[Interreg YESS] Mobilizing the Startup Ecosystem of Greece - Greek Italian Ch...
WWW.ERFC.GR
 
Macdue profile 2010
Macdue profile 2010Macdue profile 2010
Macdue profile 2010dinojb17
 
IFRS in the media sector
IFRS in the media sector IFRS in the media sector
IFRS in the media sector Steve Leith
 
International Advertising Bureau
International Advertising BureauInternational Advertising Bureau
International Advertising Bureau
Gran Via Online
 
Ecommerce 'Report' Portugal 2017
Ecommerce 'Report' Portugal 2017Ecommerce 'Report' Portugal 2017
Ecommerce 'Report' Portugal 2017
Pedro Fonseca
 
Pr_Akamon closes first round of investment at 2.8 million euros
Pr_Akamon closes first round of investment at 2.8 million euros Pr_Akamon closes first round of investment at 2.8 million euros
Pr_Akamon closes first round of investment at 2.8 million euros
Akamon Entertainment
 
Welcome to RPBA - Brochure from 06.03.2024
Welcome to RPBA - Brochure from 06.03.2024Welcome to RPBA - Brochure from 06.03.2024
Rakuten ichiba
Rakuten ichibaRakuten ichiba
Rakuten ichiba
Crossprof.com
 

Similar to De Agostini SpA - Bilancio 2018 English (20)

De Agostini 2021 highlights.pdf
De Agostini 2021 highlights.pdfDe Agostini 2021 highlights.pdf
De Agostini 2021 highlights.pdf
 
THE GAME COMPANY - Farvi comunicare per noi è un gioco!
THE GAME COMPANY - Farvi comunicare per noi è un gioco!THE GAME COMPANY - Farvi comunicare per noi è un gioco!
THE GAME COMPANY - Farvi comunicare per noi è un gioco!
 
Austria Pitch Deck
Austria Pitch DeckAustria Pitch Deck
Austria Pitch Deck
 
Abstract - Italian Gambling market report - Oct 2010
Abstract - Italian Gambling market report - Oct 2010Abstract - Italian Gambling market report - Oct 2010
Abstract - Italian Gambling market report - Oct 2010
 
Get Italy Corp 2011.Pptx
Get Italy Corp 2011.PptxGet Italy Corp 2011.Pptx
Get Italy Corp 2011.Pptx
 
Get Italy Corporate 2011
Get Italy Corporate 2011Get Italy Corporate 2011
Get Italy Corporate 2011
 
SYNOT-companyprofile.pdf
SYNOT-companyprofile.pdfSYNOT-companyprofile.pdf
SYNOT-companyprofile.pdf
 
Predixit TecTour profile
Predixit TecTour profilePredixit TecTour profile
Predixit TecTour profile
 
GO ITALY CARD - Increase sales by joining the number one discount pass for Italy
GO ITALY CARD - Increase sales by joining the number one discount pass for ItalyGO ITALY CARD - Increase sales by joining the number one discount pass for Italy
GO ITALY CARD - Increase sales by joining the number one discount pass for Italy
 
PUBLIC GAMING INTERNATIONAL MAGAZINE - April 2015
PUBLIC GAMING INTERNATIONAL MAGAZINE - April 2015PUBLIC GAMING INTERNATIONAL MAGAZINE - April 2015
PUBLIC GAMING INTERNATIONAL MAGAZINE - April 2015
 
Catalan Exhibitors MWC 2018
Catalan Exhibitors MWC 2018Catalan Exhibitors MWC 2018
Catalan Exhibitors MWC 2018
 
"Emprender en el sector de juegos online" Expojoc, Septiembre 2014
"Emprender en el sector de juegos online" Expojoc, Septiembre 2014"Emprender en el sector de juegos online" Expojoc, Septiembre 2014
"Emprender en el sector de juegos online" Expojoc, Septiembre 2014
 
[Interreg YESS] Mobilizing the Startup Ecosystem of Greece - Greek Italian Ch...
[Interreg YESS] Mobilizing the Startup Ecosystem of Greece - Greek Italian Ch...[Interreg YESS] Mobilizing the Startup Ecosystem of Greece - Greek Italian Ch...
[Interreg YESS] Mobilizing the Startup Ecosystem of Greece - Greek Italian Ch...
 
Macdue profile 2010
Macdue profile 2010Macdue profile 2010
Macdue profile 2010
 
IFRS in the media sector
IFRS in the media sector IFRS in the media sector
IFRS in the media sector
 
International Advertising Bureau
International Advertising BureauInternational Advertising Bureau
International Advertising Bureau
 
Ecommerce 'Report' Portugal 2017
Ecommerce 'Report' Portugal 2017Ecommerce 'Report' Portugal 2017
Ecommerce 'Report' Portugal 2017
 
Pr_Akamon closes first round of investment at 2.8 million euros
Pr_Akamon closes first round of investment at 2.8 million euros Pr_Akamon closes first round of investment at 2.8 million euros
Pr_Akamon closes first round of investment at 2.8 million euros
 
Welcome to RPBA - Brochure from 06.03.2024
Welcome to RPBA - Brochure from 06.03.2024Welcome to RPBA - Brochure from 06.03.2024
Welcome to RPBA - Brochure from 06.03.2024
 
Rakuten ichiba
Rakuten ichibaRakuten ichiba
Rakuten ichiba
 

More from DeA Capital S.p.A.

De Agostini SpA - Bilancio 2021
 De Agostini SpA - Bilancio 2021 De Agostini SpA - Bilancio 2021
De Agostini SpA - Bilancio 2021
DeA Capital S.p.A.
 
De Agostini SpA - Bilancio 2020
De Agostini SpA - Bilancio 2020De Agostini SpA - Bilancio 2020
De Agostini SpA - Bilancio 2020
DeA Capital S.p.A.
 
De Agostini SpA - Bilancio 2019
De Agostini SpA - Bilancio 2019De Agostini SpA - Bilancio 2019
De Agostini SpA - Bilancio 2019
DeA Capital S.p.A.
 
De Agostini SpA - Bilancio 2018
De Agostini SpA - Bilancio 2018De Agostini SpA - Bilancio 2018
De Agostini SpA - Bilancio 2018
DeA Capital S.p.A.
 
DeA Capital Relazione Finanziaria Semestrale al 30 giugno 2018
DeA Capital Relazione Finanziaria Semestrale al 30 giugno 2018DeA Capital Relazione Finanziaria Semestrale al 30 giugno 2018
DeA Capital Relazione Finanziaria Semestrale al 30 giugno 2018
DeA Capital S.p.A.
 
DeA Capital Half-year Report to 30 June 2018
DeA Capital Half-year Report to 30 June 2018DeA Capital Half-year Report to 30 June 2018
DeA Capital Half-year Report to 30 June 2018
DeA Capital S.p.A.
 
DeA Capital Half-year Report to 30 June 2018
DeA Capital Half-year Report to 30 June 2018DeA Capital Half-year Report to 30 June 2018
DeA Capital Half-year Report to 30 June 2018
DeA Capital S.p.A.
 
DeA Capital Relazione Finanziaria Semestrale al 30 giugno 2018
DeA Capital Relazione Finanziaria Semestrale al 30 giugno 2018DeA Capital Relazione Finanziaria Semestrale al 30 giugno 2018
DeA Capital Relazione Finanziaria Semestrale al 30 giugno 2018
DeA Capital S.p.A.
 
De Agostini S.p.A. Bilancio 2017
 De Agostini S.p.A. Bilancio 2017 De Agostini S.p.A. Bilancio 2017
De Agostini S.p.A. Bilancio 2017
DeA Capital S.p.A.
 
DeA Capital 2017 Annual Report
DeA Capital 2017 Annual ReportDeA Capital 2017 Annual Report
DeA Capital 2017 Annual Report
DeA Capital S.p.A.
 
Bilancio DeA Capital 2017
Bilancio DeA Capital 2017Bilancio DeA Capital 2017
Bilancio DeA Capital 2017
DeA Capital S.p.A.
 
Relazione Finanziaria Semestrale al 30 giugno 2017
Relazione Finanziaria Semestrale al 30 giugno 2017Relazione Finanziaria Semestrale al 30 giugno 2017
Relazione Finanziaria Semestrale al 30 giugno 2017
DeA Capital S.p.A.
 
Half-year Report to 30 June 2017
Half-year Report to 30 June 2017Half-year Report to 30 June 2017
Half-year Report to 30 June 2017
DeA Capital S.p.A.
 
De Agostini S.p.A. Bilancio 2016
De Agostini S.p.A. Bilancio 2016De Agostini S.p.A. Bilancio 2016
De Agostini S.p.A. Bilancio 2016
DeA Capital S.p.A.
 
Bilancio DeA Capital 2016
Bilancio DeA Capital 2016Bilancio DeA Capital 2016
Bilancio DeA Capital 2016
DeA Capital S.p.A.
 
DeA Capital 2016 Annual Report
DeA Capital 2016 Annual ReportDeA Capital 2016 Annual Report
DeA Capital 2016 Annual Report
DeA Capital S.p.A.
 
Interim Management Report to 30 September 2016
Interim Management Report to 30 September 2016Interim Management Report to 30 September 2016
Interim Management Report to 30 September 2016
DeA Capital S.p.A.
 
Resoconto Intermedio di Gestione al 30 settembre 2016
Resoconto Intermedio di Gestione al 30 settembre 2016Resoconto Intermedio di Gestione al 30 settembre 2016
Resoconto Intermedio di Gestione al 30 settembre 2016
DeA Capital S.p.A.
 
Relazione Finanziaria Semestrale al 30 giugno 2016
Relazione Finanziaria Semestrale al 30 giugno 2016Relazione Finanziaria Semestrale al 30 giugno 2016
Relazione Finanziaria Semestrale al 30 giugno 2016
DeA Capital S.p.A.
 
Half-year Report to 30 June 2016
Half-year Report to 30 June 2016Half-year Report to 30 June 2016
Half-year Report to 30 June 2016
DeA Capital S.p.A.
 

More from DeA Capital S.p.A. (20)

De Agostini SpA - Bilancio 2021
 De Agostini SpA - Bilancio 2021 De Agostini SpA - Bilancio 2021
De Agostini SpA - Bilancio 2021
 
De Agostini SpA - Bilancio 2020
De Agostini SpA - Bilancio 2020De Agostini SpA - Bilancio 2020
De Agostini SpA - Bilancio 2020
 
De Agostini SpA - Bilancio 2019
De Agostini SpA - Bilancio 2019De Agostini SpA - Bilancio 2019
De Agostini SpA - Bilancio 2019
 
De Agostini SpA - Bilancio 2018
De Agostini SpA - Bilancio 2018De Agostini SpA - Bilancio 2018
De Agostini SpA - Bilancio 2018
 
DeA Capital Relazione Finanziaria Semestrale al 30 giugno 2018
DeA Capital Relazione Finanziaria Semestrale al 30 giugno 2018DeA Capital Relazione Finanziaria Semestrale al 30 giugno 2018
DeA Capital Relazione Finanziaria Semestrale al 30 giugno 2018
 
DeA Capital Half-year Report to 30 June 2018
DeA Capital Half-year Report to 30 June 2018DeA Capital Half-year Report to 30 June 2018
DeA Capital Half-year Report to 30 June 2018
 
DeA Capital Half-year Report to 30 June 2018
DeA Capital Half-year Report to 30 June 2018DeA Capital Half-year Report to 30 June 2018
DeA Capital Half-year Report to 30 June 2018
 
DeA Capital Relazione Finanziaria Semestrale al 30 giugno 2018
DeA Capital Relazione Finanziaria Semestrale al 30 giugno 2018DeA Capital Relazione Finanziaria Semestrale al 30 giugno 2018
DeA Capital Relazione Finanziaria Semestrale al 30 giugno 2018
 
De Agostini S.p.A. Bilancio 2017
 De Agostini S.p.A. Bilancio 2017 De Agostini S.p.A. Bilancio 2017
De Agostini S.p.A. Bilancio 2017
 
DeA Capital 2017 Annual Report
DeA Capital 2017 Annual ReportDeA Capital 2017 Annual Report
DeA Capital 2017 Annual Report
 
Bilancio DeA Capital 2017
Bilancio DeA Capital 2017Bilancio DeA Capital 2017
Bilancio DeA Capital 2017
 
Relazione Finanziaria Semestrale al 30 giugno 2017
Relazione Finanziaria Semestrale al 30 giugno 2017Relazione Finanziaria Semestrale al 30 giugno 2017
Relazione Finanziaria Semestrale al 30 giugno 2017
 
Half-year Report to 30 June 2017
Half-year Report to 30 June 2017Half-year Report to 30 June 2017
Half-year Report to 30 June 2017
 
De Agostini S.p.A. Bilancio 2016
De Agostini S.p.A. Bilancio 2016De Agostini S.p.A. Bilancio 2016
De Agostini S.p.A. Bilancio 2016
 
Bilancio DeA Capital 2016
Bilancio DeA Capital 2016Bilancio DeA Capital 2016
Bilancio DeA Capital 2016
 
DeA Capital 2016 Annual Report
DeA Capital 2016 Annual ReportDeA Capital 2016 Annual Report
DeA Capital 2016 Annual Report
 
Interim Management Report to 30 September 2016
Interim Management Report to 30 September 2016Interim Management Report to 30 September 2016
Interim Management Report to 30 September 2016
 
Resoconto Intermedio di Gestione al 30 settembre 2016
Resoconto Intermedio di Gestione al 30 settembre 2016Resoconto Intermedio di Gestione al 30 settembre 2016
Resoconto Intermedio di Gestione al 30 settembre 2016
 
Relazione Finanziaria Semestrale al 30 giugno 2016
Relazione Finanziaria Semestrale al 30 giugno 2016Relazione Finanziaria Semestrale al 30 giugno 2016
Relazione Finanziaria Semestrale al 30 giugno 2016
 
Half-year Report to 30 June 2016
Half-year Report to 30 June 2016Half-year Report to 30 June 2016
Half-year Report to 30 June 2016
 

Recently uploaded

Osisko Development - Investor Presentation - June 24
Osisko Development - Investor Presentation - June 24Osisko Development - Investor Presentation - June 24
Osisko Development - Investor Presentation - June 24
Philip Rabenok
 
Collective Mining | Corporate Presentation - May 2024
Collective Mining | Corporate Presentation - May 2024Collective Mining | Corporate Presentation - May 2024
Collective Mining | Corporate Presentation - May 2024
CollectiveMining1
 
Snam 2023-27 Industrial Plan - Financial Presentation
Snam 2023-27 Industrial Plan - Financial PresentationSnam 2023-27 Industrial Plan - Financial Presentation
Snam 2023-27 Industrial Plan - Financial Presentation
Valentina Ottini
 
Collective Mining | Corporate Presentation - May 2024
Collective Mining | Corporate Presentation - May 2024Collective Mining | Corporate Presentation - May 2024
Collective Mining | Corporate Presentation - May 2024
CollectiveMining1
 
Investor Day 2024 Presentation Sysco 2024
Investor Day 2024 Presentation Sysco 2024Investor Day 2024 Presentation Sysco 2024
Investor Day 2024 Presentation Sysco 2024
Sysco_Investors
 
Corporate Presentation Probe June 2024.pdf
Corporate Presentation Probe June 2024.pdfCorporate Presentation Probe June 2024.pdf
Corporate Presentation Probe June 2024.pdf
Probe Gold
 
cyberagent_For New Investors_EN_240424.pdf
cyberagent_For New Investors_EN_240424.pdfcyberagent_For New Investors_EN_240424.pdf
cyberagent_For New Investors_EN_240424.pdf
CyberAgent, Inc.
 
New Tax Regime User Guide Flexi Plan Revised (1).pptx
New Tax Regime User Guide Flexi Plan Revised (1).pptxNew Tax Regime User Guide Flexi Plan Revised (1).pptx
New Tax Regime User Guide Flexi Plan Revised (1).pptx
RajkumarRajamanikam
 

Recently uploaded (8)

Osisko Development - Investor Presentation - June 24
Osisko Development - Investor Presentation - June 24Osisko Development - Investor Presentation - June 24
Osisko Development - Investor Presentation - June 24
 
Collective Mining | Corporate Presentation - May 2024
Collective Mining | Corporate Presentation - May 2024Collective Mining | Corporate Presentation - May 2024
Collective Mining | Corporate Presentation - May 2024
 
Snam 2023-27 Industrial Plan - Financial Presentation
Snam 2023-27 Industrial Plan - Financial PresentationSnam 2023-27 Industrial Plan - Financial Presentation
Snam 2023-27 Industrial Plan - Financial Presentation
 
Collective Mining | Corporate Presentation - May 2024
Collective Mining | Corporate Presentation - May 2024Collective Mining | Corporate Presentation - May 2024
Collective Mining | Corporate Presentation - May 2024
 
Investor Day 2024 Presentation Sysco 2024
Investor Day 2024 Presentation Sysco 2024Investor Day 2024 Presentation Sysco 2024
Investor Day 2024 Presentation Sysco 2024
 
Corporate Presentation Probe June 2024.pdf
Corporate Presentation Probe June 2024.pdfCorporate Presentation Probe June 2024.pdf
Corporate Presentation Probe June 2024.pdf
 
cyberagent_For New Investors_EN_240424.pdf
cyberagent_For New Investors_EN_240424.pdfcyberagent_For New Investors_EN_240424.pdf
cyberagent_For New Investors_EN_240424.pdf
 
New Tax Regime User Guide Flexi Plan Revised (1).pptx
New Tax Regime User Guide Flexi Plan Revised (1).pptxNew Tax Regime User Guide Flexi Plan Revised (1).pptx
New Tax Regime User Guide Flexi Plan Revised (1).pptx
 

De Agostini SpA - Bilancio 2018 English

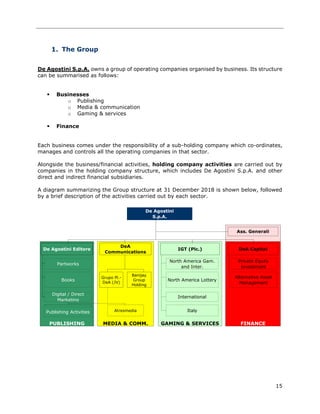
  • 1. 15 1. The Group De Agostini S.p.A. owns a group of operating companies organised by business. Its structure can be summarised as follows: ▪ Businesses o Publishing o Media & communication o Gaming & services ▪ Finance Each business comes under the responsibility of a sub-holding company which co-ordinates, manages and controls all the operating companies in that sector. Alongside the business/financial activities, holding company activities are carried out by companies in the holding company structure, which includes De Agostini S.p.A. and other direct and indirect financial subsidiaries. A diagram summarizing the Group structure at 31 December 2018 is shown below, followed by a brief description of the activities carried out by each sector. De Agostini S.p.A. Ass. Generali De Agostini Editore DeA Communications IGT (Plc.) DeA Capital Italy Partworks North America Gam. and Inter. Private Equity Investment Books Grupo Pl.- DeA (JV) Banijay Group Holding North America Lottery Alternative Asset Management PUBLISHING MEDIA & COMM. GAMING & SERVICES FINANCE Digital / Direct Marketing International AtresmediaPublishing Activities
  • 2. 16 PUBLISHING This sector is organised by business unit, based on the nature of products provided and the channels used: ▪ Partworks, which includes Italian and international activities managed by the subsidiary De Agostini Publishing. In this business unit, the Group supplies collectable products aimed at different market ranging from hobbies to cinema and music, products for children and cooking classes through news-stands, the Internet and subscriptions. ▪ Books, which includes traditional publishing activities in Italy, in the school texts and bookshop business areas, managed by the subsidiary De Agostini Libri. In the school texts business, the Group mainly operates in the Italian market through De Agostini Scuola under a number of brands in the primary and secondary school, university and dictionary sectors. In the bookshop business, the Group operates through the affiliate DeA Planeta Books, with a presence primarily in “Children’s books”, “Fiction”, “General reference” and “Non-fiction”; ▪ Digital, which includes activities relating to thematic TV channels, real estate advertised on digital platforms and websites managed partly directly by the company and partly by its affiliates; ▪ Direct Marketing, for which a progressive phase-out process was decided the previous year, includes mail-order channel activities aimed at consumers in many European countries. The sub-holding company for the Publishing activities is De Agostini Editore S.p.A. (De Agostini Editore), which is fully-owned directly by De Agostini S.p.A.
  • 3. 17 MEDIA & COMMUNICATION The sector includes the Group's interests in media & communication; the relevant sub-holding company is DeA Communications S.A. (DeA Communications), which is fully-owned directly by De Agostini S.p.A. At December 31, 2017, the business included the following companies: ▪ Banijay Group Holding (parent company of the Banijay Group), which is approximately 34% held on a fully diluted basis through LDH, a holding company that is 49.9% owned by DeA Communications which, in turn, is the holder of a 68.6% controlling stake in Banijay Group Holding. Banijay Group Holding is the largest independent producer of TV and multi-media content in the world, and is present in 16 countries (with fiction, factual, reality entertainment and docu-drama entertainment productions, and children’s and animation programs) and 61 brands (with a catalogue of over 20,000 hours of content distributed worldwide); ▪ Grupo Planeta-De Agostini, a 50:50 joint venture with Planeta Corporación, which controls: - Atresmedia, a Spanish national radio/TV broadcaster listed on the Madrid stock exchange; - DeA Planeta, active in cinema and content distribution in Spain. Based on the IAS/IFRS international accounting standards adopted by the Group in preparing the consolidated financial statements, the activities in question are recorded under "Investments in associates and joint ventures" and measured at equity.
  • 4. 18 GAMING & SERVICES The sector includes the Group’s activities in Gaming & Services. The sub-holding company for these activities is IGT Plc, with its registered office in the UK and listed on the NYSE and which is 50.64% controlled by De Agostini S.p.A. (At 31 December 2018). IGT operates with the following structure: ▪ North America Gaming & Interactive (NAGI). Based in Las Vegas, Nevada, the business offers a complete suite of casino products and solutions for the US and Canadian markets through the development and delivery of games, systems and solutions for traditional casinos and interactive online betting systems, and develops, sells and licenses casino management systems that help casinos to improve their operational efficiency and to provide customised services and promotional offerings. The business's revenues are generated both by the sale/rental of gaming machines and software to casinos and by services relating to the maintenance of machines and systems. ▪ North America Lottery (NALO). This business, which is headquartered in Providence, Rhode Island, develops and provides innovative solutions for lotteries and performs research and development for all lottery-related products worldwide. These solutions have enabled IGT to become the sole point of contact for most WLA (World Lottery Association) customers in North America by providing support to 37 of 45 lotteries in the US. Business revenues are derived from both the sale and rental of hardware, software and terminals for lotteries, and from the direct management of two lotteries in Indiana and New Jersey through LMA (Lottery Management Agreement) contracts. Lastly, NALO generates revenues from the sale of instant lottery tickets; ▪ International In this business area, IGT is the world's leading provider of innovative services and end-to-end solutions for all the regulated gaming channels and areas; it also provides a variety of interactive games, such as poker, casino and bingo. The business area is responsible for the strategic development and operational management of IGT's full product portfolio for the following markets: Europe (excluding Italy), the Middle East, Central America, Latin America, the Caribbean, Asia and Oceania. Business revenues are generated by both the sale and rental of gaming machines, software, centralized systems and other services to casinos, the sale of games and interactive solutions and sport betting, the sale and rental of hardware, software, terminals and services for lotteries, and the sale of instant lottery tickets, professional services in the form of lottery facility management, and lottery operation fees. Another source of revenues is the provision of processing services to a number of lotteries in Latin America and the Caribbean, such as top-up services for mobile phones and utility payments. ▪ Italy. This business area provides a broad range of business-to-consumer (B2C) games with five product lines: (i) lotteries; (ii) gaming machines; (iii) sports betting; (iv) commercial services; (v) interactive games. - Lotteries: since 1998, IGT has been the concession-holder for Gioco del Lotto in Italy, allowing it to capitalize on its significant experience in managing all activities throughout the entire lottery value chain (collection of bets through high-security processing systems, management of electronically connected terminals at retail outlets, advertising and promotion, staff training, assistance
  • 5. 19 for license-holders and management of back office activities). In 2016, IGT was awarded a new nine-year concession for Lotto, via its subsidiary Lottomatica, acting in a consortium with other Italian and foreign operators. Since 2004, Lottomatica has also acted as the sole concession-holder for Gratta & Vinci (scratch & Win) acting in a consortium with other Italian and foreign operators; - Gaming machines: IGT directly operates AWP gaming machines and video lottery terminals (VLT) that are installed in various retail outlets and connected to a central system. The company also sells and rents systems, machines and games to other concession-holders; - Sports Betting: in Italy, IGT manages, as a dealer, an extensive network of agencies and “corners” with the "Better" brand for the collection of sports and non-sports betting linked to a proprietary platform; it also provides call centre solutions/services, internet betting technology and other services related to sports betting; - Interactive games: IGT provides interactive games authorized in the Italian market, such as online poker, casino, bingo, roulette, blackjack and other skill- based games, sports and horse race betting, and online betting on car and motorcycle races in addition to the games ‘10 e Lotto’, ‘Win for Life’, ‘Eurojackpot’ and online ‘Gratta e Vinci’. - Commercial services: IGT offers processing services for high volumes of commercial transactions not connected with lotteries, including top-up services for mobile phones, payments for utilities and taxes/stamp duties, reloading prepaid cards, and transport ticketing services.
  • 6. 20 FINANCE This business area includes the activities carried out by the Group in alternative investment, which are broken down into alternative asset management and private equity investment. The sub-holding company for the Finance business is DeA Capital S.p.A. (DeA Capital), which is listed on the FTSE Italia STAR segment of the Milan stock exchange and is directly controlled by De Agostini S.p.A. with a stake of around 58.3% at 31 December 2018. With assets under management of about EUR 11,900 million and an investment portfolio of more than EUR 350 million, DeA Capital S.p.A. is one of Italy's largest alternative investment operators. ▪ Alternative asset management - In the Alternative Asset Management business, DeA Capital – through its subsidiaries DeA Capital Real Estate SGR and DeA Capital Alternative Funds SGR – is engaged in the promotion, management and enhancement of investment funds in real estate, private equity and credit. Both investment management companies have an approach based on their expertise in the sector and ability to identify the best opportunities for return. Alternative Asset Management has been DeA Capital’s main focus for strategic development in recent years. ▪ Private equity investment - In the Private Equity Investment business, DeA Capital has "permanent" capital, and therefore has the advantage – compared with traditional private equity funds, which are normally restricted to a pre-determined duration – of greater flexibility in optimizing the timing of entry into and exit from investments. In terms of investment policy, this flexibility allows it to adopt an approach based on value creation, including over the medium to long term. The Sector also includes a minority shareholding in Assicurazioni Generali, a leading insurance company in Europe and listed on the Milan Stock Exchange, directly and indirectly owned at 31 December 2018 by De Agostini S.p.A. (approximately 1.46% of the share capital). In this regard, it should be noted that with effect from 1 January 2018, DeA Partecipazioni, a company with a 1.29% shareholding in Assicurazioni Generali and fully controlled by De Agostini S.p.A., had been merged by incorporation into the latter. The remaining 0.17% shareholding indirectly owned by De Agostini S.p.A. is held through DeA Communications, which in 2018 acquired and then merged by incorporation the company that previously owned the shareholding (i.e. B&D Finance S.A.). HOLDING COMPANY ACTIVITIES Holding company activities, including the activities carried out by the companies within the holding company structure, included De Agostini S.p.A. as well as other directly or indirectly controlled financial companies. Specifically, these activities relate to the management of shareholdings in the sub-holding companies of the Group’s individual businesses, as well as its interests in non-strategic shareholdings and activities.
  • 7. 21 2. Significant events during the year Publishing ➢ Streamlining of direct marketing activities In Direct Marketing, the Group continued its progressive phase-out activities in 2018, reducing launch campaigns and focusing the business as on serving existing collections and maximising the use of existing inventories. As part of these activities, the Group also sold the property located in Lausanne and simultaneously signed a leaseback contract (realising a capital gain of some EUR 12 million). ➢ Notification of a 50-50 joint venture between De Agostini Publishing and Editorial Planeta DeAgostini In 2018, in order to consolidate its position as Europe’s leading Partworks operator, agreements were signed to set up a 50-50 joint venture between De Agostini Publishing and Editorial Planeta DeAgostini. The initiative concerns all collectable products (with the exception of the 'Kids' area) that would be launched by the two companies in all European markets from the first half of 2019. Gaming & services ➢ Payment of remaining tranches for renewal of the Scratch & Win concession During 2018, the two remaining tranches (totalling EUR 750 million) were paid for the renewal, for a period of 9 years until 30 September 2028, of the exclusive Italian Scratch & Win licence. The payment was made by the licensee, Lotteries National, of which IGT/Lottomatica Holding owns a 64% shareholding. The other stakeholders are owned by Scientific Games (20%) and Arianna 2001 (16%). ➢ Refinancing operations During 2018, new bonds were issued to replace bonds maturing before 2020; in particular: ▪ in June 2018, senior secured notes at 3.50% were issued with a maturity date of 2024 and a nominal value of USD 500 million; ▪ in September 2018, senior secured notes at 6.25% were issued with a maturity date of 2027 and a nominal value of USD 750 million.
  • 8. 22 Financial activities ➢ Business combination between Crescita SPAC and the Cellular Group On 4 June 2018, the business combination between Crescita SPAC and the Cellular Group, brand owner of Cellularline and Italian leader in the development and sale of accessories for smart phones and tablets, was finalised. Following the operation, which resulted in 35% of special shares held being converted into ordinary shares, DeA Capital S.p.A. held 3.8% of the combined entity, which has been renamed Cellularline S.p.A. Subsequently, in the last quarter of 2018, DeA Capital purchased other securities on the market to give it 4.3% of Cellularline's share capital; it should be noted that the purchases continued into the first few months of 2019, giving it 4.4% of Cellularline’s share capital. ➢ Establishment of DeA Capital Real Estate France and DeA Capital Real State Iberia As part of the Alternative Asset Management development strategy, the creation of DeA Capital Real Estate France SAS was finalised on 21 September 2018. This is a company incorporated in France that is 70%-owned by the DeA Capital Group, with the remainder owned by local key managers. The company's objective is to develop real estate advisory activities for fundraising and for consultancy and management of real estate assets in the French market, with a particular focus on the core+, value-added and opportunistic sectors. Following the end of the 2018 financial year, on 27 February 2019, the creation of DeA Capital Real Estate France SAS was finalised as part of the Alternative Asset Management development strategy. This is a company incorporated in France that is 73%-owned by the DeA Capital Group, with the remainder owned by local key managers. The company's objective is to develop real-estate advisory activities for fundraising and for real-estate consultancy and management in the French market, with a particular focus on the core+, value-added and opportunistic sectors. With this initiative, DeA Capital has launched a pan-European real estate platform through companies controlled by the Group and, strategically, with the participation of local senior management teams; these can support Italian investors in initiatives beyond national borders and attract international investors with a pan-European focus. ➢ Purchase of minority shareholdings in DeA Capital Real Estate SGR The purchase of minority shareholdings in DeA Capital Real Estate SGR was finalised in November 2018, equating to 29.73% of the company’s share capital, for consideration of approximately EUR 40 million (as well as a EUR 4.5 million earn-out to be paid on achievement of targets set for obtaining new assets under management in the three-year period 2019- 2021). Following this transaction, the DeA Capital Group brought its stake in the company to 94.03% of DeA Capital Real Estate SGR capital. Following the end of the financial year, the acquisition of the residual minority shareholdings in DeA Capital Real Estate SGR (5.97%) was finalised on 1 March 2019, for a base
  • 9. 23 consideration of approximately EUR 8 million (in addition to an earn-out worth up to EUR 0.9 million, to be paid on achievement of targets set for obtaining new assets under management in the three-year period 2019-2021). The basic consideration was paid with DeA Capital Treasury shares (5,174,172 shares corresponding to approximately 1.7% of its share capital at EUR 1.555 per share). Holding company activities ➢ Acquisition of B&D Finance (S.A.) by DeA Communications On 28 March 2018, the purchase and sale agreement between B&D Finance S.p.A. and DeA Communications was signed and executed for the purchase by the latter of 100% of B&D Finance (S.A.), owned by B&D Finance S.p.A.The transaction, which can be seen in the context of concentrating and streamlining the Group’s presence in Luxembourg, involved a consideration of EUR 215.9 million (in line with the relevant shareholders’ equity) for the equity value of B&D Finance, of which EUR 74.6 million was settled in cash on the sale date, and EUR 141.4 million through a vendor loan. On 5 July 2018, B&D Finance S.A. was merged into DeA Communications. ➢ Collar option on about 9% of IGT On 22 May 2018, as part of the process to rebalance the risk profile of its portfolio, De Agostini S.p.A. signed a number of agreements with Credit Suisse regarding the participation of De Agostini S.p.A. in a collar option structure for 18 million IGT shares (representing about 9% of the subsidiary's share capital out of a total of about 51% held). In preparation for signing the above agreements, Credit Suisse placed a fraction of the total number of IGT shares underlying the transaction (borrowed from third parties) for the purposes of “delta hedging” at a reference price of USD 28.25 per IGT share (with a discount of about 5% on the previous day’s closing price). For De Agostini S.p.A., the collar, which consists of tranches with semi-annual maturities of 4 to 5.5 years, entailed the purchase of put options and the sale of call options expressed as a percentage (based on the maturity of the individual tranche) of the price on Credit Suisse's placement. Instead of physical settlement, De Agostini S.p.A. has the option to close out the transaction via a cash settlement, as part of which the position’s mark-to-market would be paid. ➢ Dividends received/paid In June 2018, the shareholders' meeting of De Agostini S.p.A. approved the financial statements for the year ending December 31, 2017 reporting a net profit of EUR 58.4 million, and voted: - to pay a dividend totaling EUR 24.9 million (EUR 0.60 per share) on the eligible shares (from the net profit for the period); - the allocation of the remaining amount to the extraordinary reserve (the legal reserve having already reached one fifth of the share capital).
  • 10. 24 In 2018 De Agostini S.p.A. recorded dividends from the operating companies amounting to EUR 102.0 million, of which EUR 63.4 million related to IGT (four quarterly dividends of USD 0.20 per share each, net of the “reversal” related to Dauphine project) and EUR 21.5 million related to DeA Capital (deriving from the partial distribution of the share premium reserve at EUR 0.12 per share) and EUR 17.1 million related to Assicurazioni Generali.
  • 11. 25 3. Analysis of the Group’s operating performance and financial position 3.1 Introduction ➢ Legislative framework for preparation of the financial statements The consolidated financial statements for the year ended 31 December 2018 were prepared on the basis of the international accounting standards (IAS/IFRS) approved by the European Union. All the interpretations issued by the International Financial Reporting Interpretations Committee (IFRIC), including those previously issued by the Standing Interpretations Committee (SIC), approved by the European Union, were also applied in preparing the Consolidated Financial statements. The consolidated financial statements for the year ended 31 December 2018 were prepared under the same accounting standards as those used in the previous year, the sole exceptions resulting from the application, effective 1 January 2014, of the following: ▪ IFRS 9 - Financial Instruments, which modifies the reporting and valuation of financial assets and liabilities, fully replacing IAS 39. In particular, the standard provides for the classification and valuation of financial assets on the basis of three business models: ✓ Hold to collect, i.e. financial assets held with the aim of collecting the related contractual cash flows; in this case, the valuation criterion that can be used is the amortized cost (if the ‘SPPI’ test criteria are exceeded – Solely payment of principal and interest) or Fair Value through profit and loss; ✓ Hold to collect and sell, i.e. financial assets held both with the aim of collecting the related contractual cash flows and with the aim of selling; in this case, the valuation criterion that can be used is Fair Value through other comprehensive income or Fair Value through profit and loss; ✓ Other business models: in this case, the valuation criterion that can be adopted is Fair value through profit and loss. The standard also introduces: ✓ a new impairment model, which differs from that currently set out in IAS 39, and is mainly based on the concept of expected losses; ✓ changes, albeit limited, in the treatment of financial liabilities, in particular, new rules applicable to reporting the effects of renegotiating financial liabilities. ▪ IFRS 15 - Revenues from contracts with customers, which replaces IAS 18 - Revenues, IAS 11 - Contracts, SIC 31, IFRIC 13 and IFRIC 15, and requires revenues to be recognised at the time the goods or services are transferred to customers in an amount that reflects the consideration expected to be received in exchange for those goods or services applying a new five-step model:
  • 12. 26 ✓ identification of contracts with the customer; ✓ identification of performance obligations, i.e. contractual undertakings to transfer goods and services to a customer, identifying separate performance obligations within the same contract which should therefore be treated separately; ✓ determination of the transaction price; ✓ allocation of transaction prices to the performance obligations; ✓ reporting of revenues when the related performance obligation is met or when an obligation to perform is fulfilled, transferring the good or service to the customer, i.e. when the customer obtains control of the good or receives the service. Control may be transferred progressively over time or at a specific point in time. The impact on the Group's consolidated financial statements of the application of IFRS 9 and IFRS 15 standards is not highly significant with regard to the balance sheet. The 2017 Income Statement did not require any restatement following the application of the new standards, since it was not required under IFRS 9 and the Group adopted the Cumulative Catch-up Method under IFRS 15 (and reported the cumulative effect of the standard to adjust the opening balance for shareholders' equity). The "Restated consolidated financial statements" included in the financial statements for the year ended 31 December 2017 are given below. These statements were revised based on the provisions of IFRS 9 and IFRS 15 to make them comparable with the statements for 2018 as set out in this Report on Operations. The provisions of Legislative Decree 38/2005 and of the IAS/IFRS constitute the legislative framework for the Company in preparing the Consolidated Financial Statements. In accordance with the provisions of Legislative Decree 38/2005, the Company prepares its financial statements pursuant to arts. 2423 et seq. of the Italian Civil Code. Figures in EUR million Goodwill 5,005 - - 5,005 Other intangible assets 1,946 - - 1,946 Tangible assets 1,379 - - 1,379 Investments 1,535 (1) (6) 1,528 Cash and cash equivalents 1,192 - - 1,192 Other net assets 421 - 42 463 TOTAL 11,478 (1) 36 11,513 for hedging: Financial liabilities 8,441 (14) - 8,427 Shareholders' equity 3,037 13 36 3,086 IFRS 9 Effect 1.1.2018 IFRS 15 Effect 31.12.2017 "As Reported"
  • 13. 27 ➢ Reclassified Consolidated Financial Statements The Consolidated Financial Statements and explanatory notes in this document have been supplemented with a number of performance indicators that enable the management to provide information on the performance of the Group’s businesses, in line with analysis and control parameters. For this reason, a set of reclassified Consolidated Financial Statements was prepared showing performance indicators more commonly used by the management than those shown in the above-mentioned Consolidated Financial Statements and explanatory notes. These are: ▪ Net revenues This represents the turnover of individual businesses and the Group as a whole, calculated as the income from sales and services. ▪ EBITDA This represents operating profit/(loss) before tax, financial income/charges, one-off items, profits/losses of shareholdings valued at equity, depreciation and amortization, and other non-cash items (e.g. impairment losses and gains/losses on the sale of tangible and intangible assets). Given the nature of the business carried out by the companies in the Finance business and the holding company structure, the net financial income relating to these activities is included in EBITDA (Earnings before interest, tax, depreciation and amortisation). ▪ ORDINARY EBIT This is calculated using the EBITDA figure plus the profits/losses on shareholdings valued at equity, depreciation and amortization and other ordinary non-cash items. ▪ ORDINARY EBT This is calculated by subtracting the figure for net financial income/expenses from ORDINARY EBIT. This figure – like ORDINARY EBIT – does not include the effects of any impairment or other non-recurring items included in the NON-ORDINARY EBT figure, which is shown separately. ▪ NET FINANCIAL POSITION (NFP) This represents the difference between: (+) cash and cash equivalents, as well as loans, receivables and certain financial assets with changes in fair value recognized in Comprehensive Income (Other comprehensive income - OCI) or in the Income Statement; (-) financial liabilities. Net revenues, EBITDA, ORDINARY EBIT/EBT and net financial position are alternative performance indicators not determined according to IAS/IFRS; they are reported to help show performance trends, as well as to provide useful information on the Group’s ability to manage debt, and to assist in estimating the value of group assets. The reclassified Consolidated Financial Statements show the same net profit/(loss) and shareholders’ equity as the Consolidated Financial Statements and are used below to comment on both the consolidated results and those of the individual business areas.
  • 14. 28 3.2 Reclassified Consolidated Financial Statements A summary is given below of the Group’s key financial and operating performance indicators, based on the reclassified Consolidated Financial Statements, prepared in line with the above explanations. It should first be noted that the comparison between revenues recorded in 2018 with those recorded in 2017 is affected by: ▪ the disposal of Double Down Interactive which led to its deconsolidation from the date of its disposal (June 2017); ▪ the introduction of IFRS 9 - Financial instruments and IFRS 15 - Revenues from contracts with customers as from 1 January 2018. It should be noted, in particular, that following the introduction of IFRS 9 from 1 January 2018 most of the changes in the fair value of financial investments were recorded in the profit and loss account in 2018, thereby impacting the EBITDA for Financial Activities and Holdings, whereas they were recorded directly as shareholders’ equity in 2017. (*) As at 1 January 2018 (-7,011 EUR million at 31 December 2017). Figures in EUR million 2018 2017 Absolute % REVENUES 4,497 4,794 (297) -6% EBITDA 1,546 1,484 62 4% Deprec., amort. and other non-cash items (813) (922) 109 Income (loss) from equity investments 27 41 (14) ORDINARY EBIT 760 603 157 26% Financial income/(charges) (382) (417) 35 ORDINARY EBT (A) 378 186 192 103% Impairment (166) (689) 523 Other non-recurring income/(charges) 67 (484) 551 NO - ORDINARY EBT (B) (99) (1,173) 1,074 n.a. EBT (A+B) 279 (987) 1,266 n.a. Taxes (155) 25 (180) Net profit (loss) from assets sold/discontinued operations - 1 (1) Consolidated net profit (loss) 124 (961) 1,085 n.a. Of which: Net profit (loss) pertaining to minorities 7 (444) 451 n.a. Net profit (loss) pertaining to group 117 (517) 634 n.a. Net Financial Position (7,589) (6,997) (592) n.a. Of which: Gaming and Services (7,186) (6,533) (653) n.a. Change (*)
  • 15. 29 3.3 Operating performance ➢ Net revenues Consolidated net revenues in 2018 were EUR 4,497 million, a decrease of around 6% as compared with 2017 (EUR 4,794 million). These figures break down as follows: Net revenues from Editorial Activities were EUR 333 million, a decline of EUR 54 million compared to 2017 (-14.0%) attributable to both Partworks (EUR -27 million, mainly due to the fall in volumes of the European Core, especially in Germany and the UK), and of Direct Marketing (EUR -30 million), following the phase-out process of activities. Gaming & Services reported net revenues of EUR 4,101 million, down from 2017 (EUR 4,339 million) due mainly to the sale of Double Down Interactive (EUR -103 million) and the unfavourable effect of the USD/EUR exchange rate. The Finance business posted net revenues of EUR 65 million, a rise of EUR 5 million compared with 2017. The revenue in question derived primarily from Alternative Asset Management fees and income from service activities, and in particular those relating to consultancy, management and the sale of properties in the real-estate funds portfolios ➢ EBITDA The Group recorded EBITDA of EUR 1,546 million for the year ended 31 December 2018, an increase as compared with the previous year. This breaks down as follows: EBITDA for Publishing Activities of EUR 25 million, an increase of EUR 42 million compared with 2017, mainly due to the performance of Partworks, which is beginning to benefit from the restructuring process undertaken in previous years and from the phase-out activity of Direct Marketing. EBITDA for Gaming and Services was EUR 1,482 million, substantially in line with 2017, despite the sale of Double Down Interactive (EUR -29 million) and the unfavourable effect of the USD/EUR exchange rate. Net Revenues Figures in EUR million 2018 % 2017 % Change Publishing 333 7.4% 387 8.1% (54) Gaming & Services 4,101 91.2% 4,339 90.5% (238) Finance 65 1.4% 60 1.3% 5 Holding Companies / Eliminations (2) 0.0% 8 0.2% (10) Consolidated Total 4,497 100.0% 4,794 100.0% (297) EBITDA Figures in EUR million 2018 % 2017 % Change Publishing 25 1.6% (17) -1.1% 42 Gaming & Services 1,482 95.9% 1,485 100.1% (3) Finance 70 4.5% 35 2.4% 35 Holding Companies / Eliminations (31) -2.0% (19) -1.3% (12) Consolidated Total 1,546 100.0% 1,484 100.0% 62
  • 16. 30 EBITDA for the Finance business was EUR 70 million (EUR 35 million in 2017), reflecting the dividend received from Assicurazioni Generali (EUR 19 million, versus EUR 16 million in 2017) and the contribution made by DeA Capital’s activities. In particular, DeA Capital's activities in 2018 reflected the capital gain from the sale of Corin (EUR +51 million) and the fair value adjustment of Kenan Inv./Migros (EUR -25 million). EBITDA for Holding company activities/other was negative at EUR -31 million, down by EUR -12 million on 2017, mainly due to the increased costs for services, in particular those relating to the Dauphine project. ➢ ORDINARY EBIT The Group’s ORDINARY EBIT for the year ended 31 December 2017 was EUR 764 million, after deducting depreciation/amortization charges and other ordinary non-cash items totalling EUR 813 million, and income from shareholdings measured at equity totalling EUR 28 million. Amortization, depreciation and other ordinary non-cash items break down as follows: ▪ EUR 433 million for amortization and write-downs of intangible assets (EUR 556 million in 2017), especially for customer relationships; ▪ EUR 380 million relating to depreciation and write-downs of tangible assets (EUR 366 million in 2017). In 2018, the Group reported a profit of EUR 27 million from shareholdings measured at equity, compared with a profit of EUR 41 million in 2017; in particular, the 2018 figure included the profit from Grupo Planeta-De Agostini of EUR +26 million (EUR +30 million in 2017) and of LDH/Banijay Group Holding of +EUR 4 million (EUR +5 million in 2017). ORDINARY EBIT Figures in EUR million 2018 2017 Change EBITDA 1,546 1,484 62 Deprec., amort. and other non-cash items (813) (922) 109 Income (loss) from equity investments 27 41 (14) ORDINARY EBIT 760 603 157
  • 17. 31 ➢ Net profit (loss) The table below shows the relationship between ORDINARY EBIT and consolidated net profit/(loss): ORDINARY EBT for 2018 was positive at EUR 378 million, after deducting a negative financial management balance of EUR 382 million. With regard to financial management, the balance in 2018 (compared with the corresponding values of 2017) breaks down as follows: ▪ EUR -2 million relating to Publishing Activities (EUR -7 million in 2017, after deduction of foreign exchange charges and hedging transactions); ▪ EUR -353 million relating to the Gaming & Services business (EUR -396 million in 2017); ▪ EUR -27 million relating to Holding Activities (EUR -14 million in 2017), after deduction of the transfer of IGT dividends related to the Dauphine Project. Non-ordinary charges totalling EUR -99 million in 2018 (versus non-ordinary income of -EUR 1,173 million in 2017) were included in the NON-ORDINARY EBT figure. Particular note should be taken of the following items recorded in 2018: ▪ Impairment of EUR -166 million, of which EUR -163 million related to the Gaming and Services business, primarily goodwill on international activities. This alignment in value, which has no monetary impact and therefore no bearing on the company's NFP, was based on the outcome of an impairment test conducted following the 2018 results (lower than expected) and a higher weighted average cost of capital. Net profit (loss) Figures in EUR million 2018 2017 Change ORDINARY EBIT 760 603 157 Financial income/(charges) (382) (417) 35 ORDINARY EBT (A) 378 186 192 Impairment (166) (689) 523 Other non-recurring income/(charges) 67 (484) 551 NO - ORDINARY EBT (B) (99) (1,173) 1,074 EBT (A+B) 279 (987) 1,266 Taxes (155) 25 (180) Net profit (loss) from assets sold/discontinued operations - 1 (1) Consolidated net profit (loss) 124 (961) 1,085 Of which: Net profit (loss) pertaining to minorities 7 (444) 451 Net profit (loss) pertaining to group 117 (517) 634
  • 18. 32 ▪ Other non-recurring income/(expenses) of EUR +67 million (EUR -484 million in 2017), of which EUR +156 million relating to the fair value adjustment of the Dauphine Project, EUR +113 million relating to the USD/EUR exchange rate effect (mainly for conversion into EUR of the USD loans held by IGT), EUR -47 million relating to IGT Liability Management costs, in particular, a buy-back of bonds, and EUR -127 million relating to the minority interest in the Lottoitalia profit, reported in the consolidated financial statements as remuneration for the financial debt recorded and not as income attributable to minority interests (by virtue of specific contractual clauses existing between Lottomatica, the controlling shareholder of Lottoitalia, and third party shareholders). In terms of taxes, a charge of EUR -155 million was posted in 2018 (compared with a gain of EUR 25 million in 2017) due to the higher taxable income in 2018. It should also be noted that 2017 included the tax benefit obtained from the change in tax regulations in the USA, offset by the tax burden related to the sale of Double Down Interactive. To summarise, the Consolidated Net Income was positive at EUR 124 million in 2018, compared with a negative EUR -961 million in 2017, with a positive Net Income attributable to the Group of EUR +117 million, compared with negative Net Income of EUR -517 million in 2017. The Net Income attributable to minority interests, which was positive by EUR +7 million in 2018 (compared with the negative value of EUR -444 million in 2017), mainly reflected EUR -12 million relating to the pro-rata share of the IGT Group's Net Income (EUR -428 million in 2017), EUR +19 million relating to the pro-rata share of the Net Income of the DeA Capital Group/IDeA OPI I Group (EUR -18 million in 2017).
  • 19. 33 ➢ Statement of Performance – IAS 1 A summary version of the Comprehensive Income or Statement of Performance – IAS 1, is shown below. It reports the net profit/(loss) for the year as the sum of the portion recorded on the Income Statement and that posted directly to shareholders' equity: (/) It should be noted that in 2017, this item reflected the changes in the fair value of financial assets classified as "Available for Sale"; as laid down in IFRS 9, from 1 January 2018 the changes in the fair value of these assets were mostly recognised in the Income statement. Gains/(losses) related to Financial Activities at fair value in 2018 recorded a negative balance of EUR 19 million (positive balance of EUR 33 million in 2017, which included a positive change in the fair value of Assicurazioni Generali of EUR 22 million and of the IDeA Taste of Italy group, managed by DeA Capital Alternative Funds, of EUR +10 million), attributable in particular to negative changes in the fair value of Assicurazioni Generali (EUR -14 million) and financial investments made by the IGT Group (EUR -5 million). Exchange gains/(losses) mainly reflect the impact of the conversion into EUR of the Financial Statements of Group companies prepared in different currencies, particularly in relation to Gaming and Services (EUR +19 million, compared to EUR -232 million in 2017, mainly due to the revaluation of the USD versus the EUR). To summarise, comprehensive income totalled EUR +130 million in 2018, compared with a negative figure of EUR -1,179 million in 2017; the portion attributable to the Group was positive, amounting to EUR +114 million as compared with a negative figure of EUR -621 million in 2017. Statement of Performance - IAS 1 Figures in EUR million 2018 2017 Net Profit/(Loss) (A) 124 (961) Items that could be subsequently reclassified within the profit (loss) for the period Profit / (loss) on available-for-sale financial assets n.a 33 Profit / (loss) on traslating foreign operations 19 (235) Profit / (loss) on cash flow hedge 1 (4) Profit / (loss) on investments valued at equity 1 (15) Tax effect 1 1 Items that could be subsequently reclassified within the profit (loss) for the period Profit / (loss) on financial assets at Fair Value (19) n.a Profit/(loss) on remeasurement of defined benefit plans 4 2 Tax effect (1) - Other comprehensive income/(loss) (B) 6 (218) Total comprehensive income/(loss) (A+B) 130 (1,179) Of which: Net profit (loss) pertaining to minorities 16 (558) Net profit (loss) pertaining to group 114 (621) (/)
  • 20. 34 3.4 Statement of financial position The table below provides a summary of the Group’s key figures from the statement of financial position. Goodwill At 31 December 2018, goodwill was EUR 5,046 million (EUR 5,005 million at 31 December 2017), which broke down as follows: ▪ EUR 34 million relating to Publishing activities (unchanged from 31 December 2017), entirely attributable to the School segment; ▪ EUR 4,918 relating to Gaming and Services (EUR 4,877 million at 31 December 2017); the change with respect to 31 December 2017 of EUR +41 million, is due to the change in the difference from conversions on goodwill in foreign currencies (EUR +202 million), partly offset by the impairment posted for International Activities; ▪ EUR 94 million related to Financial Activities (unchanged from 31 December 2017) arising from the acquisition of DeA Capital Alternative Funds SGR (EUR 31 million) and IFIM/FIMIT SGR, now called DeA Capital Real Estate SGR (EUR 62 million). Other intangible assets Other intangible assets include intellectual property rights, concessions, licenses and trademarks, as well as other intangibles. At 31 December 2018, Other intangible assets totalled EUR 1,835 million (EUR 1,946 million at 31 December 2017), comprising: ▪ EUR 34 million relating to the Publishing business (EUR 33 million at 31 December 2017), mainly in respect of publishing investments relating to School Texts, intellectual property rights and basic software and applications; ▪ EUR 1,780 million relating to the Gaming & Services business (EUR 1,890 million at 31 December 2017), primarily for customer agreements, concessions, licenses and capitalized software. The decrease recorded in 2018 for a total of EUR 110 million was mainly due to depreciation for the period (EUR -231 million), arising from the change Figures in EUR million Change Goodwill 5,046 5,005 41 5,005 Other intangible assets 1,835 1,946 (111) 1,946 Tangible assets 1,400 1,379 21 1,379 Investments 1,690 1,528 162 1,535 Cash and cash equivalents 555 1,192 (637) 1,192 Other net assets 1,135 463 672 421 TOTAL 11,661 11,513 148 11,478 for hedging: Financial liabilities 8,421 8,427 (6) 8,441 Shareholders' equity 3,240 3,086 154 3,037 31.12.2018 31.12.20171.1.2018
  • 21. 35 in the difference from conversions (EUR +73 million) and increases made during the year (EUR +49 million); ▪ EUR 21 million relating to Financial Activities (EUR 23 million at 31 December 2017), chiefly due to customer contracts and performance fees for asset management, project management and agency activities. Tangible assets At 31 December 2018, tangible assets totalled EUR 1,400 million (EUR 1,379 million at 31 December 2017), which broke down as follows: ▪ Real estate equating to EUR 72 million (EUR 81 million at 31 December 2017); ▪ Other tangible assets amounting to EUR 1,328 million (EUR 1,298 million at 31 December 2017). Real estate, amounting to EUR 72 million, included: ▪ EUR 12 million relating to Publishing Activities (EUR 19 million at 31 December 2017); The decline as compared with 2017 derived primarily from the disposal in 2018 of real estate located in Losanna; ▪ EUR 59 million relating to the Gaming & Services business (EUR 61 million at 31 December 2017); ▪ EUR 1 million relating to the Financial Activities (EUR 1 million at 31 December 2017). Other tangible assets totalled EUR 1,328 million, including: ▪ EUR 3 million relating to Publishing Activities (EUR 4 million at 31 December 2017); ▪ EUR 1,320 million relating to the Gaming & Services business (EUR 1,288 million at 31 December 2017), mainly for terminals and contract-related systems; ▪ EUR 5 million relating to Holding Company Activities (EUR 5 million at 31 December 2017). Investments At 31 December 2018, the Group’s investments totalled EUR 1,690 million. A breakdown of this item is given below: At 31 December 2018, investment property equated to EUR 40 million (EUR 51 million at 31 December 2017), attributable to the Venere Fund (managed by DeA Capital Alternative Funds), De Agostini S.p.A. and Immobiliare San Rocco; the decrease from 31 December 2017 was due to sales of real-estate units held by the Venere Fund and to the disposal by De Agostini S.p.A. of two buildings in Novara. Depreciation and write-downs of EUR 1 million were charged for the period (in line with 2017). Investments Figures in EUR million 31.12.2018 1.1.2018 Change 31.12.2017 Investment properties 40 51 (11) 51 Equity Investments 538 539 (1) 546 Loans and receivables 236 198 38 198 Available-for-sale financial assets n.a. n.a. n.a. 683 Financial assets at fair value through OCI 345 310 35 n.a. Financial assets at fair value through profit or loss 531 430 101 57 Total group 1,690 1,528 162 1,535
  • 22. 36 Shareholdings measured at equity included Grupo Planeta-De Agostini at EUR 341 million and LDH/Banijay Group at EUR 131 million. Loans and receivables totalled EUR 236 million, an increase of EUR 38 million on the balance at 31 December 2017 (EUR 198 million), and mainly include the customer financing receivables of IGT. Financial assets valued at fair value with changes recognised in the other components of the comprehensive income statement (OCI) amounted to EUR 345 million; these mainly reflected the investment, recognised under Financial assets, in Assicurazioni Generali, recorded for a value of EUR 333 million on the basis of the closing price on 31 December 2018 (EUR 14.60/share, compared with EUR 15.20/share on 31 December 2017). At 31 December 2018, the Group owned 1.46% of the share capital of Assicurazioni Generali, i.e. 22,830,815 of its shares (20,130,815 at 31 December 2017). Financial assets valued at fair value with changes recognised in the income statement amounted to EUR 531 million: ▪ derivatives for EUR 170 million, mainly attributable to the positive mark-to-market of the Dauphine Project (EUR +163 million); ▪ investments in funds for EUR 182 million, of which EUR 154 million was held through Financial Activities, EUR 24 million through Holding Company Activities and EUR 4 million through Gaming and Services; ▪ other equity investments/assets for EUR 179 million, of which EUR 75 million were held through Financial Activities, EUR 98 million through Holding Company Activities and EUR 6 million through Gaming and Services. Other net current assets At 31 December 2018, "Other net current assets" totalled EUR +1,135 million. The table below shows the items included in this balance: The net balance of "Trade receivables and payables" comprised trade receivables of EUR 902 million and trade payables of EUR 991 million. The net balance of "Tax assets and liabilities” included deferred tax assets of EUR 56 million and deferred tax liabilities of EUR 386 million. The net balance of Other assets/liabilities included Other asset items totalling EUR 2,411 million (EUR 2,563 million at 1 January 2018, or EUR 2,530 million at 31 December 2017), of which Inventories for EUR 269 million and Other liabilities for a total of EUR 674 million; in particular, the decrease in Other liabilities was attributable to the payment of the residual Other net assets Figures in EUR million 31.12.2018 1.1.2018 Change 31.12.2017 Trade receivables/payables: net balance (89) (130) 41 (131) Net balance of tax assets/liabilities (422) (461) 39 (452) Net balance of other assets/liabilities 1,737 1,146 591 1,095 Provisions (91) (92) 1 (91) Total group 1,135 463 672 421
  • 23. 37 portion of the Upfront Fee connected with the renewal, for 9 years until 30 September 2028, of the Italian exclusive Scratch & Win licence (recognised in this item at the end of 2017). At 31 December 2018, provisions amounting to EUR 91 million, mainly consisting of provisions for employee severance indemnities of EUR 19 million, other provisions relating to personnel for EUR 6 million, the agent severance fund for EUR 4 million and provisions for future risks and charges, including those relating to investee companies, for EUR 62 million. Shareholders' equity At 31 December 2018, consolidated shareholders' equity (Group and minority interests) amounted to EUR 3,240 million (compared with EUR 3,086 million at 1 January 2018, or EUR 3,037 million at 31 December 2017); the Group's share of shareholders' equity stood at EUR 1,763 million (compared to EUR 1,680 million at 1 January 2018, or EUR 1,651 million at 31 December 2017), while minority interests in shareholders' equity amounted to EUR 1,477 million (compared to EUR 1,406 million at 1 January 2018, or EUR 1,386 million at 31 December 2017). The increase in net equity attributable to the Group is mainly reflected by the following: ▪ net gain of EUR +117 million for 2018; ▪ the payment of dividends totalling EUR -25 million; ▪ other changes totalling EUR -9 million. The increase in net equity attributable to minority interests was due to the following: ▪ net gain of EUR +7 million for 2018; ▪ the payment of dividends totalling EUR -116 million (to the minority shareholders of IGT and DeA Capital); ▪ other variations for a total of EUR +180 million, related in particular to the net capital increases attributable to minority interests in Lotterie Nazionale for payment of the remaining tranches for renewal of the Scratch & Win licence. Net Financial Position (NFP) The table below shows the Group’s net financial position broken down by business area: The main change in the net financial position in terms of NFP, both at Group level and with regard to Gaming and Services, is mainly due to the payment of the remaining tranches for the renewal of the Scratch & Win licence in Italy (EUR -750 million). With specific reference to Holding Company Activities, the NFP balance at 31 December 2018 was negative at EUR -493 million, of which EUR -550 million due to banks, EUR -80 million Net Financial Position Figures in EUR million 31.12.2018 1.1.2018 Change 31.12.2017 Publishing (64) (108) 44 (108) Gaming & Services (7,186) (6,533) (653) (6,533) Finance 154 133 21 133 Holding (493) (489) (4) (503) Total group (7,589) (6,997) (592) (7,011)
  • 24. 38 due to the De Agostini S.p.A. convertible bond, EUR +125 million due to liquid assets and EUR +12 million due to Other activities/liabilities. The NFP balance at 31 December 2018 decrease by EUR -4 million due to the combined effect of dividends received from investee companies of EUR +119 million (net of the "transfer" of IGT dividends relating to the Dauphine Project) and dividends paid to the shareholders of EUR -25 million, net disbursement linked to the purchase of B&D Finance (S.A.) by DeA Communications for EUR -62 million, receipts from distributions by IDeA OF I (EUR +20 million) and structural and financial charges/other (EUR -56 million) (including underwriting fees and bonuses paid in relation to the Dauphine Project). As mentioned earlier, the net financial position is calculated using the figures reported in the financial statements and is the difference between: (+) cash and cash equivalents, as well as loans, receivables and certain financial assets with changes in fair value recognized in Comprehensive Income (OCI) or in the Income Statement; (-) financial liabilities. The reconciliation statement below shows the key figures in the Consolidated Statement of Financial Position at 31 December 2018 as compared with the amounts included in the net financial position. The differences seen, in particular between Financial Activities with variations in fair value recognised under Comprehensive Income (OCI) or in the Income statement, are essentially related to the classification within these items of Activities that qualify for inclusion in the management indicator of Net Financial Positions in accordance with the Group Accounting Principles; in particular, at 31 December 2018, and was the case at 31 December 2017, the most significant differences related to the value of investments in Assicurazione Generali, in funds and in other financial investments. For information on the use of financial instruments, pursuant to art. 2428(2)(6-bis) of the Italian Civil Code, please refer to the notes to the consolidated financial statements for the year ending 31 December 2018. Figures in EUR million Carrying amount at 31.12.2018 of which in Net Financial Position INVESTMENTS - NON-CURRENT ASSETS 850 16 Financial assets at fair value through OCI 339 6 Financial assets at fair value through profit or loss 511 10 LOANS AND RECEIVABLES - NON-CURRENT ASSETS 79 79 INVESTMENTS - CURRENT ASSETS 25 25 Financial assets at fair value through OCI 6 6 Financial assets at fair value through profit or loss 19 19 LOANS AND RECEIVABLES - CURRENT ASSETS 157 157 CASH AND CASH EQUIVALENTS 555 555 NON-CURRENT FINANCIAL LIABILITIES (7,905) (7,905) CURRENT FINANCIAL LIABILITIES (516) (516) Net Financial Position - Group (6,755) (7,589)
  • 25. 39 * * * In addition to the commentary on the consolidated results, with the related breakdown by business, see the following websites for details of the financial information for the Group’s main businesses, which mainly consist of companies whose shares are traded on regulated markets: ▪ www.atresmedia.com ▪ www.igt.com ▪ www.deacapital.it ▪ www.generali.com.
  • 26. 40 3.5 Main risks and uncertainties to which the Parent Company and consolidated Group companies are exposed As mentioned in the first section of the Report on Operations, the Group operates in a number of business sectors and in finance and is organized accordingly; each business activity comes under a sub-holding company, which is responsible for the coordination, management and control of all the companies that pertain to it. Alongside the above-mentioned activities, Holding Company Activities are carried out by companies in the holding company structure, which includes the Parent Company and other directly and indirectly controlled financial companies. Given its structure and the international arena in which it operates, the Group is exposed to a number of risks and uncertainties, which can be categorized as either systemic risks or specific risks. Such risks may significantly affect the operating performance and financial position of the Parent Company and the other companies included in the Group's Consolidated Financial Statements. Systemic risks relate to trends in macroeconomic variables in the different countries in which the Group operates, and at global level, including GDP, interest rates, inflation, exchange rates and unemployment, as well as the state of the financial markets – which particularly affects access to capital and return on investment (especially financial investment). Specific risks can be analysed according to individual business areas, and include: ▪ for the Publishing business, risks connected with the demand for published products (i.e. partworks, school texts and others), the costs of producing these items, legislative changes and the efficiency and effectiveness of logistics systems; ▪ for the Media & Communications business, risks associated with the performance of TV broadcasters (in turn affected by trends in advertising revenues) and the creative abilities required to launch new program formats on the market; ▪ for the Gaming & Services business, risks connected with the renewal of existing contracts or licenses, the innovation required to launch new gaming and services products, production capacity for new gaming/lottery management systems, the possibility of a technological malfunction (system and/or terminals) that prevents collection of receipts, and fixed-odds sports betting, where the operator bears the bookmaking risk; ▪ for Financial Activities, risks connected with typical private equity activity and alternative asset management activity (undertaken by DeA Capital Real Estate SGR and DeA Capital Alternative Funds SGR), and the performance of the investments made. Risks for each business, common to all business areas in which the Group is highly diversified, are also associated with the attitude of management, relationships with employees and suppliers, and integration policies. The specific risks relating to the holding company activities – in addition to those connected with the management of the operations in the above-mentioned business sectors and Finance,
  • 27. 41 and the associated effects on cash flow or dividends – include exposure to specific sectors or investments and the difficulties of identifying opportunities for investments or disposals. Although we stress the significance of the above-mentioned risks for the Group’s operating performance and financial position, we have put in place appropriate measures to limit the impact of any serious negative developments. With regard to systemic risks, in the early 2000s the Group started to diversify its investments, both by sector and by geographical area. It now has a widely diversified portfolio of activities combining resilient businesses (such as gaming and related services) with others that have good long-term growth prospects (such as media and content production), all with a strong international footprint. With regard to specific risks, the Group believes it has adopted a modern system of governance for its businesses, facilitating the effective management of complexity and the achievement of the strategic goals of the sub-holding companies and the Group. Specifically, this governance system has set out the procedures for managing relationships between the Parent Company and sub-holding companies, and the responsibilities of the latter concerning the coordination, management and control of all operating companies under their responsibility.