SlideShare a Scribd company logo
Financial statements
for the year ending 31 December 2014
12
THE GROUP’S KEY FIGURES (1)
(EUR million)
4,362 4,446
0
1.000
2.000
3.000
4.000
5.000
2014 2013
Net revenues
1,122 1,145
0
200
400
600
800
1,000
1,200
1,400
2014 2013
EBITDA
584
628
0
100
200
300
400
500
600
700
800
2014 2013
ORDINARY EBIT
(1)
Figures from the “Restated Consolidated Financial Statements”.
Financial statements
for the year ending 31 December 2014
13
THE GROUP’S KEY FIGURES (1)
(EUR million)
366 421
(276)
(182)
90
239
(400)
(200)
0
200
400
600
2014 2013
ORDINARY EBT (A) NO - ORDINARY EBT (B) EBT (A+B)
(90)
89
350
(12)
(300)
0
300
600
2014 2013
Consolidate Net Profit (loss)
Total Comprehensive Income
(Stat. of Perform. - IAS 1)
4,073 4,059
(3,548) (3,849)(6,000)
(3,000)
0
3,000
31-dic-2014 31-dic-2013
Shareholders' Equity (Group)
Net Financial Position
(1)
Figures from the “Restated Consolidated Financial Statements”.
Financial statements
for the year ending 31 December 2014
14
Report on Operations
Financial statements
for the year ending 31 December 2014
15
1. The Group
De Agostini S.p.a. controls a group of operating companies organised by business activity,
whose structure can be summarised as follows:
 Businesses
o Publishing
o Media & Communication
o Gaming & Services
 Finance
Each business comes under the responsibility of a sub-holding company, which co-ordinates,
manages and controls all the operating companies that pertain to it.
Alongside the above-mentioned activities, holding company activities are carried out by
companies in the holding company structure which, in addition to the Company, includes other
directly- and indirectly-controlled financial companies.
A diagram summarising the Group structure at 31 December 2014 is shown below, followed by
a brief description of the activities carried out by each business.
Financial statements
for the year ending 31 December 2014
16
PUBLISHING
This is the Group’s traditional business, and is organised by business unit, based on the nature
of products provided and the channels used, as detailed below:
 Partworks, which includes Italian and international partworks activities, coordinated
by De Agostini Publishing; in this business unit the Group produces collections – sold
through newsstands and on subscription - aimed at various target markets, including
hobbies, cinema, products for children and cookery courses;
 Direct Marketing, which includes the activities managed through the subsidiary De
Agostini Atlas Editions. In this business unit the Group operates with the product lines
"Print & Collectibles", "Consumables" and "Direct Sales" and with the "Atlas For Men"
catalogue sales offered to customers in various European countries and in Russia by
mail order and direct sales;
 Books, which includes the traditional publishing activities of books and school texts,
coordinated by De Agostini Libri. In the book business, the Group operates directly
through De Agostini Libri, which is active in "General and Illustrated Books", "Children's
Books" and "B2B" (special initiatives), and in foreign markets, through joint publications
and international distribution. In School Texts, the Group mainly operates on the Italian
market under a number of brands in the primary and secondary school, university and
dictionary areas. At the end of 2014, the Cartography division of the Books business
unit was sold.
The Group is also active in the Digital area, which encompasses activities relating to theme–
based TV channels and a series of properties on digital platforms. Specifically, the Group
manages products targeting children and families on both the satellite and terrestrial digital
platform of the following theme-based TV channels: 'DeA Kids', 'DeA Junior', 'DeA Sapere HD'
(now 'Explora HD' in order to be more responsive to the target market within Sky's '400'
channels) and 'Super!'.
The sub-holding company for the De Agostini Group's Publishing activities is De Agostini
Editore S.p.A. (De Agostini Editore), which is 100% owned by De Agostini S.p.A.
Publishing business of Grupo Planeta-De Agostini, a 50:50 joint venture with Planeta
Corporación, a subsidiary of DeA Communications responsible for Partworks and Training
activities in Spain, France, Portugal and Latin America, operates outside De Agostini Editore
Group structure.
Financial statements
for the year ending 31 December 2014
17
MEDIA & COMMUNICATION
This business includes the Group’s interests in the production and distribution of content for
television, cinema and other media.
In 2007, the business started to expand its "content" via a build-up process, which initially led
to the acquisition of controlling stakes in Magnolia and Marathon Group and subsequently in
Zodiak Television (2008) and RDF (2010); all investments made in the business – i.e. the total
holdings in Magnolia, Marathon Group, Zodiak Television and RDF Media – are now entirely
owned by the holding company Zodiak Media; at 31 December 2014, this was around 88%
owned by the De Agostini Group, with the remaining 12% owned by institutional investors and
managers of the operating companies.
De Agostini Communications S.A. (DeA Communications), a company 100%-owned by De
Agostini S.p.A., is the sub-holding company for Media and Communication.
At 31 December 2014, in addition to the above-mentioned Zodiak Media, the following
companies formed part of this business:
 Atresmedia, a Spanish national radio/TV broadcaster listed on Madrid stock exchange;
 DeA Planeta, active in cinema and content distribution in Spain.
Atresmedia and DeA Planeta are subsidiaries of Grupo Planeta-De Agostini, a 50:50 joint
venture with Planeta Corporación.
Financial statements
for the year ending 31 December 2014
18
GAMING & SERVICES
The business comprises the Group’s activities in Gaming & Services.
At 31 December 2014, the sub-holding company for these activities was Gtech S.p.A.
(Gtech), a company listed on Milan stock exchange and on the US over-the-counter market as
part of the Sponsored Level 1 American Depository Receipt (ADR) programme, which is
controlled by De Agostini S.p.A. directly, and indirectly (through DeA Partecipazioni), with a
majority stake totalling about 59%
In 2014, Gtech signed a number of agreements to acquire International Game Technology
(IGT), a global leader in the casino and gaming entertainment sector with registered office in
Las Vegas, Nevada (USA), through a merger of the two companies into a newly established
holding company with registered office in the UK (Holdco) listed on the New York Stock
Exchange - NYSE. Specifically, the merger agreements finalised on 7 April 2015 (after
obtaining the necessary authorisations) called for the following:
 an exchange of 1 Gtech share for every 1 Holdco share;
 allocation of a payment of USD 18.02 per share for each IGT share (initially set at USD
18.25 per share) including USD 14.34 in cash (80%) and USD 3.68 per share in kind
(20%) for a total payment of about USD 4.6 billion for the transaction.
Concurrent with the finalisation of the merger, Holdco has been renamed "IGT Plc", which is
held by De Agostini Group with a majority stake of 52.09% (including 47.02% held directly
through De Agostini S.p.A. and 5.07% held through DeA Partecipazioni).
Until the above-mentioned merger date (and thus, throughout 2014), Gtech operated in the
following businesses:
 Lotteries: as the global leader in high-security processing systems for online lotteries,
it plans, sells and manages a complete range of terminals for sales outlets authorised
to manage lotteries, electronically connected to a centralised system that serves as an
intermediary between the outlets, where individual transactions take place, and the
lottery regulatory authorities; provides instant ticket-printing and related services; has
developed, and continues to develop, new systems for lotteries, granting new gaming
brands under licence to the regulatory authorities in the various jurisdictions, and
installing its entire range of new lottery ticket distribution machines; in several
countries, it operates as a private manager, under government supervision, of all
lottery operations and the main associated activities; it operates as an exclusive
licence-holder for the Lotto and Gratta & Vinci (scratchcards) concession in Italy;
 Sports Betting: provides a sports betting platform which consists of a central core
with associated support modules; it holds numerous concessions for managing sports
and horse race betting, as well as non-sporting events relating to the world of theatre,
music, culture and national and international news;
 Gaming Machines: plans, develops, produces and supplies machines, games,
systems and software for the regulated gaming market; is the world leader in the
supply of video lotteries and centralised systems and games in North America and
Europe, and is the leading supplier of video lotteries and games in the US; it is the
leading supplier of traditional and video slot machines and in the production of gaming
systems in Europe, Asia, Latin America and the United States for Native American
casinos, as well as supplying AWPs and gaming software in Europe;
 Interactive Games: provides interactive games, such as online poker, casino, bingo
and other skill games;
Financial statements
for the year ending 31 December 2014
19
 Commercial Services: offers processing services for high volumes of commercial
transactions not connected with lotteries, including top-up services for mobile phones,
utility payments, and ticket sales for music and sporting events.
Financial statements
for the year ending 31 December 2014
20
FINANCE
This business includes the activities carried out within the Group in alternative investment,
particularly private equity investment and alternative asset management, or financial
investment activity in general:
 PRIVATE EQUITY INVESTMENT
 Direct investment in the services sector in Europe and Emerging Europe. Of
particular interest is the minority shareholding in Migros, Turkey's biggest food
retail chain (whose shares are listed on the Istanbul Stock Exchange).
 Indirect investment in private equity funds of funds, co-investment funds and
theme-based funds.
 ALTERNATIVE ASSET MANAGEMENT
 IDeA Capital Funds SGR, active in the management of private equity funds, funds
of funds, co-investment funds and theme-based funds (with assets under
management totalling about EUR 1.5 billion)
 IDeA FIMIT SGR, active in the management of real estate funds (with around EUR
9.0 billion assets under management)
 IRE / IRE Advisory, which operates in project, property and facility management,
as well as real estate brokerage
The sub-holding company for De Agostini Group Finance business is DeA Capital S.p.A. (DeA
Capital), which is listed on the FTSE Italia STAR segment of Milan stock exchange and is
directly controlled by De Agostini S.p.A. with a stake of around 58.3% at 31 December 2014.
The business also includes a minority shareholding (around 2.01% at 31 December 2014) in
Assicurazioni Generali, one of Europe’s leading insurance companies, which is listed on
Milan stock exchange. Around 2.01% of the stake is held via DeA Partecipazioni (a company
directly and totally controlled by De Agostini S.p.A.).
Financial statements
for the year ending 31 December 2014
21
HOLDING COMPANY activities
Holding company activities, including the activities carried out by the companies within the
holding company structure, comprise - apart from the Company itself- other directly or
indirectly controlled financial companies; specifically, these activities relate to the management
of shareholdings in the sub-holding companies of the Group’s individual businesses, as well as
its interests in non-strategic shareholdings and activities.
At 31 December 2014, the main companies in the holding company structure were:
 DeA Partecipazioni, which holds 2.01% of the share capital of Assicurazioni Generali
(as well as a shareholding in Gtech, now IGT);
 De Agostini Invest, which holds a number of investments in non-strategic financial
activities;
 DeA Factor, which mainly carries out the factoring of receivables due to Group
companies from third parties.
Financial statements
for the year ending 31 December 2014
22
2. Significant events during the year
PUBLISHING
 Establishment of DeA 59 and acquisition of "Canale 59" business division
On 15 April 2014, De Agostini Publishing established the company DeA 59, which, effective 1
May 2014, purchased from Lottomatica Scommesse, the business division called "Canale 59",
which is engaged in the business of providing audio-visual media and data services nationwide
aimed at broadcasting terrestrial digital TV on Channel 59.
In order to enhance this channel, in 2014 DeA 59 signed agreements with RCS Mediagroup to
start up a joint project consisting in the launch of a sports television channel with all-news
programming and significant air time devoted to sports-related news and commentary.
On 29 January 2015, the joint project called for the establishment of a company in partnership
between DeA 59 (40%) and RCS Mediagroup (60%) called Digital Factory, to which the above-
mentioned business division has been also transferred (for about EUR 1.8 million).
On 26 February 2015, the partnership company began broadcasting on the new TV channel
called "GazzettaTV".
 Sale of the shareholding in Garzanti Editore
On 30 September 2014, De Agostini Libri completed the sale of the entire stake in Garzanti
Editore to Garzanti Libri equal to 51% of the share capital of the former for a total of EUR 0.3
million.
 Sale of the Cartography business division
Effective 31 December 2014, De Agostini Libri sold the Cartography business division to third
parties for a token amount of compensation. It was engaged in the publication of paper-based
and electronic multi-media works in the area of cartography and geography.
Financial statements
for the year ending 31 December 2014
23
MEDIA & COMMUNICATION
 Revision of earn-out agreements between Atresmedia and former Sexta
shareholders
In February 2014 the earn-out agreements between Atresmedia and former Sexta
shareholders were revised with a reduction in the number of Atresmedia own shares to be
delivered to shareholders in relation to the acquisition of the channel concerned (from the
previous level of about 7% to about 4.2% of capital).
Later, in March 2014, Atresmedia sold the own shares thus "released" (2.8% of share capital)
for a total amount of approximately EUR 80 million.
 Sale of interest in 2BCom
On 27 February 2014 Magnolia completed the sale of its entire shareholding in 2BCom, equal
to 80% of the company's share capital, to third parties for a token payment.
 Establishment of Zodiak Active Plus
On 21 March 2014, Zodiak Active established Zodiak Active Plus, and then on 22 April 2014,
with effect from 1 May 2014, it transferred the Advertising & Brands business division to
Zodiak Active Plus for a net carrying value of EUR 2.5 million.
Later, on 29 May 2014, Zodiak Active sold its entire stake in Zodiak Active Plus to DeA
Communications for a payment of about EUR 2.8 million in addition to an earn-out to be paid
on the achievement of certain goals.
 Refinancing of Zodiak Media
In April 2014 the amendment of Zodiak Media Facilities Agreement was finalised with De
Agostini S.p.A. providing a guarantee to cover Zodiak Media financial obligations (EUR 165
million at 31 December 2014 including EUR 140 million for the Term Loan, and up to EUR 25
million for the Revolving Credit Line) in exchange for the cancellation:
 of all covenants contained in the Facilities Agreement starting on the reporting date
until 31 December 2013;
 of the clean-down clause related to the Revolving Credit Line, which required the full
repayment of the line at least once annually.
Financial statements
for the year ending 31 December 2014
24
GAMING & SERVICES
 Exercise of call option on UniCredit's entire stake in “Gratta & Vinci”
(scratchcards concession)
In March 2014, Gtech acquired UniCredit's stake in SW Holding, the company holding the
scratchcards concession, for approximately EUR 72 million, by exercising a call option.
At the conclusion of the transaction, Gtech owned 64% (compared with 51.5% previously) of
the scratchcards business.
 Acquisition of Probability
In May 2014, Gtech finalised the acquisition of 100% of Probability, a UK company listed on
London Stock Exchange, and leader in games for tablets and smartphones, for a total of
approximately GBP 18 million.
 Sale of the Lis Ticket business division
In July 2014, Gtech finalised the sale to TicketOne of the Lis Ticket business division involved
in sports and entertainment ticketing for a total of about EUR 14 million.
 Acquisition of International Game Technology
As noted in the description of the Group's activities, in 2014 Gtech signed a number of
agreements to acquire International Game Technology ("IGT"), a global leader in the casino
and gaming entertainment sector with registered office in Las Vegas, Nevada (USA) by
merging the two companies into a newly established holding company with registered office in
the UK ("Holdco") listed on the New York Stock Exchange - NYSE. To be specific, the merger
agreements finalised on 7 April 2015 (after the necessary authorisation were obtained) called
for:
 an exchange of 1 Gtech share for every 1 Holdco share;
 the assignment of a payment of USD 18.02/share (initially set at USD 18.25/share) for
each IGT share, including USD 14.34 in cash (80%) and USD 3.68/share in kind (20%)
for a total payment of about USD 4.6 billion for the transaction.
Concurrent with the completion of the merger, Holdco has been renamed "IGT Plc", which is
held by De Agostini Group with a majority stake of 52.09% (including 47.02% held directly by
De Agostini S.p.A. and 5.07% held by DeA Partecipazioni).
In addition, with this merger, the right of Gtech shareholders to withdraw went into effect for
19,796,852 shares of the company representing about 11% of its share capital (at a price of
EUR 19.174/share).
Financial statements
for the year ending 31 December 2014
25
FINANCE
 Sale of the shareholding in Soprarno SGR
In May 2014, DeA Capital completed the sale of the shareholding in Soprarno SGR for a total
price of EUR 1.3 million, in line with the carrying value at 31 December 2013.
 Acquisition of a further shareholding in Innovation Real Estate
DeA Capital Real Estate, a wholly owned subsidiary of DeA Capital, acquired a 13.3% stake in
Innovation Real Estate bringing its holding up to 96.99% of the related share capital, for a
total of EUR 2.2 million.
 Sale of interest in GDS
On 1 October 2014, following approval by the competent authorities, the associate Santé SA
(in which DeA Capital holds a 43% stake) and its subsidiary Santé Dévéloppement Europe SAS
(SDE) sold their entire 83.43% stake in Générale de Santé ("GDS") to Ramsay Health Care
and Crédit Agricole Assurances at a price of EUR 16.00 per share after cashing in the dividend
of EUR 0.75 per share due to them.
As a result of the transaction, Santé and SDE collected a total of approximately EUR 788
million (including the dividend), which was partlially used to fully repay all loans obtained to
acquire GDS (EUR 407 million on the repayment date), and partlially for a distribution to
shareholders (EUR 374 million net of the amount withheld to cover the guarantees issued for
the benefit of the buyers).
For DeA Capital the sale of GDS has generated total proceeds of approximately EUR 164
million.
 2014 Oscar di Bilancio (Financial Statements Oscar) award
On 1 December 2014, DeA Capital S.p.A. won the 2014 Oscar di Bilancio (Financial Statements
Oscar) award, the prestigious recognition promoted by Ferpi (the Italian Public Relations
Federation) awarded annually to companies which distinguish themselves for the transparency
and quality of their corporate reporting, in the category "Listed and Unlisted Medium-sized and
Small Banking and Financial Companies in relation to the financial statements as at 31
December 2013.
DeA Capital continues to be committed to the transparency and quality of its financial
reporting, and has set itself the goal of making constant refinements.
 First closing of “IDeA Taste of Italy” private equity fund
On 30 December 2014, the first closing of the IDeA Taste of Italy fund was completed. This is
a closed-end mutual fund under Italian law managed by IDeA Capital Funds SGR for qualified
investors. Focusing on the agricultural foods sector, its objective is to invest along the entire
chain of the sector, from raw materials to processing, distribution and catering. The fund
achieved commitments in the aforementioned first closing of about EUR 86 million, with a final
goal to reach of EUR 200 million.
Financial statements
for the year ending 31 December 2014
26
 Agreement for the sale of stakes in Migros
On 31 December 2014, Moonlight Capital, a wholly-owned special purpose vehicle of Kenan
Investments S.A. (in which DeA Capital holds a stake of about 17%) and the direct and
indirect owner of an 80.5% stake in Migros, signed an agreement with Anadolu Endüstri
Holding (“Anadolu”), a leading Turkish conglomerate, for the sale of 40.25% of Migros to the
latter.
This agreement also called for the exchange of put and call options between the parties, which
can be exercised between 24 months and 30 months after the first sale, for a further 9.75%
stake in Migros.
The sale of the first 40.25% and any future sale of the subsequent 9.75% are projected using
a base valuation for Migros of TRY 26 per share.
For the portion relating to DeA Capital, at the TRY/EUR exchange rate on 31 December 2014,
the sale of the first 40.25% equates to approximately EUR 110 million, while any future sale of
the subsequent 9.75% equates to approximately EUR 26 million.
The execution of the share transfer is subject to the necessary approvals of the relevant
authorities (scheduled by the end of the first half of 2015).
 Performance of the investment in Assicurazioni Generali
During November 2014 DeA Partecipazioni sold n. 3,892,183 of Assicurazioni Generali shares,
equal to 0.25% of the share capital of the latter, to B&D Finance for a total amount of EUR 64
million (with a consolidated capital gain of approximately EUR 19 million).
At 31 December 2014, the Group owned 2.01% of the share capital of Assicurazioni Generali,
i.e. 31,297,817 of its shares (35,190,000 shares compared with 31 December 2013).
These shares have been valued in the consolidated financial statements at approximately EUR
532 million, based on the market price at 31 December 2014 (EUR 17.0 per share, compared
with EUR 17.1 per share at 31 December 2013).
Financial statements
for the year ending 31 December 2014
27
HOLDING COMPANY activities
 Sale of UniCredit CASHES securities
In February 2014, De Agostini S.p.A. completed the sale of all its CASHES – Convertible And
Subordinated Hybrid Equity-linked Securities – with an underlying of UniCredit shares
(subscribed in February 2009), for a total cash-in of EUR 64 million (and generating a gain
posted to the consolidated income statement of De Agostini Group for 2014 of around EUR 18
million).
 Dividends received/paid
In June 2014, the Company’s Shareholders’ Meeting approved the financial statements for the
year ending 31 December 2013, which closed with a net profit of EUR 35.8 million. The
shareholders approved the partial distribution as dividend of the amount of EUR 35.2 million.
In 2014, in addition to the dividends received by the companies included in the holding
company structure (EUR 0.6 million), the Company received dividends from subsidiaries
totalling EUR 138.8 million, wholly from Gtech; of these, approximately EUR 69.4 million are
attributable to the interim dividend approved on December 17 by the Board of Directors of
Gtech - interim dividend of 0.75 euros / share - and paid in the month of January 2015.
 Refinancing of holding company activities
On 29 October 2014 De Agostini S.p.A. signed new credit lines up to EUR 600 million with a
syndicate of banks consisting of Intesa Sanpaolo (EUR 250 million), UniCredit (EUR 250
million) and Mediobanca (EUR 100 million) with an average term of over 4.5 years (amortising
loans with repayments of EUR 480 million in the fifth year).
Utilisation under these new lines totalled EUR 500 million to repay previous existing lines of the
same amount made to De Agostini S.p.A. (EUR 150 million) and DeA Partecipazioni (EUR 350
million). The latter obtained the funds needed for the repayment through an intercompany
loan from the Parent Company. The remaining EUR 100 million can be used by April 2016.
Financial statements
for the year ending 31 December 2014
28
3. Analysis of the Group’s operating performance and financial
position
3.1 Preliminary remarks
 Legislative framework for the preparation of the financial statements
The consolidated financial statements for the year ending 31 December 2014 were prepared on
the basis of the international accounting standards (IAS/IFRS) approved by the European
Union.
The terms IAS and IFRS refer to all International Accounting Standards (IAS), International
Financial Reporting Standards (IFRS) and associated interpretations of the International
Financial Reporting Interpretations Committee (IFRIC) or its predecessor, the Standing
Interpretations Committee (SIC).
The consolidated financial statements for the year ending 31 December 2014 were prepared
under the same accounting standards as those used in the previous year, with the sole
exceptions resulting from the application, effective 1 January 2014, of the following:
 IFRS 11 (Joint arrangements), which governs the reporting of all interests in
joint ventures breaking them down into:
 joint operations, whereby the parties to the arrangement acquire rights to
certain assets and assume obligations for certain liabilities;
 joint ventures, whereby the parties have rights to the net value of a set of
jointly controlled assets and liabilities.
In the first case, individual assets, liabilities, revenues and costs are recognised on
the basis of the relevant IAS/IFRS; in the second case, the pro-rata interest in the
joint venture recorded using the equity method is recognised
 IFRS 10 (Consolidated financial statements), which defines the new notion of
control based on the concurrent presence of essentially three elements:
 power over the investee company;
 exposure to or the right to variable returns from its involvement with the
investee company;
 the ability to use that power over the investee to affect the amount of the
returns due.
The impact of IFRS 11 and IFRS 10 on the Group's consolidated financial statements is not
significant with respect to key operating and financial figures, such as net profit/(loss) and
shareholders' equity, but instead changed the consolidation method of the two main
investments in joint ventures held, i.e., M-Dis Distribuzione Media and Grupo Planeta-De
Agostini (previously carried out using the proportional method), and the new consolidation of
two real estate funds, AVA and IDeA Fimit Sviluppo.
Below are the "Reclassified consolidated financial statements" included in the financial
statements for the year ending 31 December 2013. These statements were revised based on
the provisions of IFRS 11 and IFRS 10 and on the basis of IFRS 5 following the sale of the
Cartography business division in 2014, in order to make them comparable to these same
statements for 2014 as indicated in this Report on Operations:
Financial statements
for the year ending 31 December 2014
29
EUR million
Net revenues 4,906 (462) 2 4,446
Operating costs
EBITDA 1,155 (7) (3) 1,145
Deprec., amort. and other non-cash items (525) - - (525)
Income (loss) from equity investments 7 3 (2) 8
ORDINARY EBIT 637 (4) (5) 628
Financial income/(charges) (195) - (12) (207)
ORDINARY EBT (A) 442 (4) (17) 421
Impairment (97) - - (97)
Other non-recurring income/(charges) (101) - 16 (85)
NO - ORDINARY EBT (B) (198) - 16 (182)
EBT (A+B) 244 (4) (1) 239
Taxes (151) 2 - (149)
Net profit (loss) from assets sold/discontinued opera (2) 2 (1) (1)
Consolidated net profit (loss) 91 - (2) 89
Of which:
Net profit (loss) pertaining to minorities 67 - (2) 65
Net profit (loss) pertaining to group 24 - - 24
Net Financial Position (4,011) 171 (9) (3,849)
Of which:
Games and Services (2,478) - (3) (2,481)
2013
"As Restated"
2013
"As Reported"
IFRS 11
Effect
IFRS 10
Effect /
Other
2013
"As Restated"
2013
"As Reported"
IFRS 11
Effect
IFRS 10
Effect /
Other
The provisions of Legislative Decree 38/2005 and of the IAS/IFRS constitute the company’s
legislative framework for preparing the Consolidated Financial Statements.
In accordance with the provisions of Legislative Decree 38/2005, the company prepares its
financial statements pursuant to art. 2423 et seq. of the Italian Civil Code.
Financial statements
for the year ending 31 December 2014
30
 Restated Consolidated Financial Statements
The Consolidated Financial Statements and explanatory notes in this document have been
supplemented with a number of management indicators that enable the management to
provide information on the performance of the Group’s businesses in line with analysis and
audit parameters.
For this reason, a set of restated Consolidated Financial Statements were prepared showing
performance indicators more commonly used by the management than those shown in the
above-mentioned Consolidated Financial Statements and explanatory notes. These are:
 Net revenues. This represents the turnover of individual businesses and the Group as
a whole, calculated as the income from sales and services.
 EBITDA. This represents operating profit/loss before tax, financial income/charges,
one-off items, profits/losses from shareholdings valued at equity, depreciation and
amortisation, and other non-cash items (e.g. impairment losses and gains/losses on
the sale of tangible and intangible assets). Given the nature of the business carried out
by the companies in Finance business and the holding company structure, the net
financial income relating to these activities is included in EBITDA.
 ORDINARY EBIT. This is calculated using the EBITDA figure plus the profits/losses
from shareholdings valued at equity, depreciation and amortisation and other non-cash
items.
 ORDINARY EBT. This is calculated by subtracting the figure for net financial income
from ORDINARY EBIT.
This figure – like ORDINARY EBIT – does not include the effects of any
impairment or other non-recurring items included in the NON-ORDINARY EBT
figure, which is shown separately.
 NET FINANCIAL POSITION (NFP). This represents the difference between: a) cash
and cash equivalents, as well as loans, receivables and other financial assets available
for sale or recorded at fair value in the income statement; and b) financial liabilities.
Net revenues, EBITDA, ORDINARY EBIT/EBT and net financial position are alternative
performance indicators not determined according to IAS/IFRS; they are reported to help show
performance trends, as well as to provide useful information on the Group’s ability to manage
debt, and to assist in estimating the value of group assets.
The restated Consolidated Financial Statements show the same net profit and
shareholders’ equity as the Consolidated Financial Statements and are used below to
comment on both the consolidated results and those of the individual business areas.
Financial statements
for the year ending 31 December 2014
31
3.2 Restated Consolidated Financial Statements
Below is a summary of the Group’s key financial and operating performance indicators, based
on the restated Consolidated Financial Statements, prepared in accordance with the above
comments.
Figures in EUR million Absolute %
Net revenues 4,362 4,446 (84) -2%
EBITDA 1,122 1,145 (23) -2%
Deprec., amort. and other non-cash items (535) (525) (10)
ncome (loss) from equity investments (3) 8 (11)
ORDINARY EBIT 584 628 (44) -7%
Financial income/(charges) (218) (207) (11)
ORDINARY EBT (A) 366 421 (55) -13%
mpairment (76) (97) 21
Other non-recurring income/(charges) (200) (85) (115)
NO - ORDINARY EBT (B) (276) (182) (94) -52%
EBT (A+B) 90 239 (149) -62%
Taxes (179) (149) (30) n.a.
Net profit (loss) from assets sold/discontinued operations (1) (1) - n.a.
Consolidated net profit (loss) (90) 89 (179) n.a.
Of which:
Net profit (loss) pertaining to minorities 12 65 (53) n.a
Net profit (loss) pertaining to group (102) 24 (126) n.a.
Absolute %
Net Financial Position (3,548) (3,849) 301 8%
Of which:
Games and Services (2,564) (2,481) (83) -3%
2014 2013
Change
12.31.2014 12.31.2013
Change
Financial statements
for the year ending 31 December 2014
32
3.3 Operating performance
 Net revenues
Consolidated net revenues in 2014 were EUR 4,362 million, a decrease of EUR 84 million on
2013 (EUR 4,446 million). A breakdown of these figures is shown in the table below.
Net Revenues
Figures in EUR million 2014 % 2013 % Change
Publishing 781 17.9% 855 19.2% (74)
Media & Communication 432 9.9% 443 10.0% (11)
Games & Services 3,070 70.4% 3,063 68.9% 7
Finance 83 1.9% 93 2.1% (10)
Holding Companies /
Eliminations
(4) -0.1% (8) -0.2% 4
Consolidated Total 4,362 100.0% 4,446 100.0% (84)
Publishing business posted net revenues of EUR 781 million, a fall of EUR 74 million (-8.7%)
compared with 2013, which mainly affected the Partworks (down EUR 38 million) and Direct
Marketing (down EUR 42 million) business areas.
Media & Communication business generated revenues of EUR 432 thousand, a fall of EUR
11 thousand compared with 2013 (-2.5%), reflecting mainly the smaller contribution of Zodiak
Media.
Gaming & Services business posted net revenues of EUR 3,070 million, up slightly from
2013 (EUR 3,063 million), mainly due to Italy (up EUR 8 million) and the International
business (up EUR 4 million), net of the amount related to the Americas (down EUR -5 million).
Net revenues for Finance business fell by EUR 10 million versus 2013, totalling EUR 83 million
for the year. This was mainly due to fees from Alternative Asset Management.
 EBITDA
The Group recorded EBITDA of EUR 1,122 million for the year ending 31 December 2014, a
decrease from the figure for the previous year. This breaks down as follows:
EBITDA
Figures in EUR million 2014 % 2013 % Change
Publishing 5 0.4% 46 4.0% (41)
Media & Communication 35 3.1% 34 3.0% 1
Games & Services 1,078 96.1% 1,067 93.2% 11
Finance 32 2.9% 44 3.8% (12)
Holding Companies / Eliminations (28) -2.5% (46) -4.0% 18
Consolidated Total 1,122 100% 1,145 100% (23)
Financial statements
for the year ending 31 December 2014
33
Publishing business posted EBITDA of EUR 5 million, down EUR 41 million from 2013, mainly
owing to lower revenues of the Continuity businesses and the crisis in Russia and Ukraine,
which were only in part offset by savings made on overheads following the implementation of
the restructuring plans.
EBITDA for Media & Communication business was EUR 35 million, which was largely in line
with 2013.
Gaming & Services business posted EBITDA of EUR 1,078 million, an increase of EUR 11
million on 2013 (+1.0%), mainly due to the positive performance of Italy and International,
which offset the less impressive performance in the Americas.
EBITDA for Finance business was EUR 32 million and reflected both the contribution of DeA
Capital’s activities and the receipt of a dividend of EUR 16 million from Assicurazioni Generali
(EUR 7 million in 2013); the EUR -12 million overall decrease on 2013 mainly reflects the lower
contribution from Alternative Asset Management.
The EBITDA of Holding company activities/inter-business eliminations was EUR -28
million, which was a slight improvement over 2013 (EUR 18 million) due to the capital gain
realized on the sale of 0.25% of Assicurazioni Generali (EUR 19 million).
 ORDINARY EBIT
The group’s ordinary EBIT for the year ending December 31, 2014 was EUR 584 million, after
taking into account depreciation/amortisation and other ordinary non-cash items totalling
EUR 535 million and losses from investments valued at equity totalling EUR 3 million.
The deterioration in ordinary EBIT 2014 compared to the figure for 2013 included a figure of
EUR -44 million for the decrease in EBITDA, EUR -23 million for higher depreciation and
amortisation, and other non-monetary items totalling EUR -10 million and lower profits from
investments valued at equity totalling EUR -11 million.
ORDINARY EBIT
Figures in EUR million 2014 2013 Change
EBITDA 1,122 1,145 (23)
Deprec., amort. and other non-cash items (535) (525) (10)
Income (loss) from equity investments (3) 8 (11)
ORDINARY EBIT 584 628 (44)
Amortisation, depreciation and other ordinary non-cash items break down as follows:
 EUR 278 million relating to amortisation and write-downs of intangible assets (EUR 265
million in 2013);
 EUR 257 million relating to depreciation and write-downs of tangible assets (EUR 260
million in 2013).
In 2014, the Group reported a loss of EUR 3 million from shareholdings valued at equity,
compared with a profit of EUR 8 million in 2013; in particular, the 2013 figure included the
Financial statements
for the year ending 31 December 2014
34
profit related to Santè, the parent company of GDS, which has been sold in 2014 for EUR 7
million.
 Net profit (loss)
The table below shows the relationship between ORDINARY EBIT and consolidated net loss:
Net profit (loss)
EUR million 2014 2013 Change
ORDINARY EBIT 584 628 (44)
Financial income/(charges) (218) (207) (11)
ORDINARY EBT (A) 366 421 (55)
Other impairment (76) (97) 21
Other non-recurring income/(charges) (200) (85) (115)
NO - ORDINARY EBT (B) (276) (182) (94)
EBT (A+B) 90 239 (149)
Taxes (179) (149) (30)
Net profit (loss) from assets sold/discontinued operations (1) (1) -
Consolidated net profit (loss) (90) 89 (179)
Of which:
Net profit (loss) pertaining to minorities 12 65 (53)
Net profit (loss) pertaining to group (102) 24 (126)
ORDINARY EBT for 2014 was a positive figure of EUR 366 million, down by -13% on the 2013
figure, after taking into account a net financial loss of EUR -218 million (EUR -207 million in
2013).
A breakdown of the net financial income figure for 2014 (compared with the corresponding
values for 2013) is as follows:
 EUR -9 million relating to Publishing business (EUR -9 million in 2013);
 EUR -19 million relating to Media & Communication business (EUR -18 million in 2013);
 EUR -166 million relating to Gaming & Services business (EUR -162 million in 2013);
 EUR -24 million relating to holding company activities (EUR -18 million in 2013)
Non-ordinary charges of EUR 276 million in 2014 (versus EUR 182 million in 2013) were
included in the NON-ORDINARY EBT figure. Note in particular the following items recorded in
2014:
 Impairment of EUR 76 million, including EUR 65 million relating to Media &
Communication, EUR 11 million relating to Finance;
 Other non-recurring income/(charges) totalling EUR -200 million including EUR -147
million for costs connected with the IGT acquisition (including financial components
related to the acquisition) and EUR -39 million tied to the sale of Générale de Santé
(net of the risk provision recorded at 31 December 2013).
Financial statements
for the year ending 31 December 2014
35
The tax burden for 2014 was EUR 179 million (compared with EUR 149 million in 2013) due to
one-off items related to the reorganisation of the Italian operations of Gaming & Services and
non-deductible acquisition costs related to the IGT acquisition.
The net loss from discontinued operations was EUR 1 million in 2014 (in line with 2013)
reflecting the contribution of the Cartography business division and the Centre Européen de
Formation (CEF) in Italy. In 2013 the net loss from discontinued operations included the
contribution of UTET and UTET Scienze Mediche.
To summarise, the consolidated net loss for 2014 was EUR 90 million, compared with a profit
of EUR 89 million in 2013.
In 2014, the net loss attributable to minorities was EUR 12 million (compared with a profit of
EUR 65 million in 2013), and mainly reflected:
 EUR -13 million relating to the pro-rata portion of the net profit/(loss) of Zodiak Media
Group, previously recorded at the consolidated level of De Agostini S.p.A. Group (EUR -
9 million in 2013);
 EUR +48 million relating to the pro-rata portion of the net profit/(loss) of Gtech Group,
including the portion relating to Lotterie Nazionali, the holder of the scratch cards
concession, previously recorded at the consolidated level of De Agostini S.p.A. Group
(EUR +102 million in 2013);
 EUR -22 million related to the pro-rata share of the net profit/(loss) of DeA Capital
Group, IDeA Opportunity Fund I and AVA that were previously recorded at the
consolidated level of De Agostini S.p.A. Group (EUR -28 million in 2013).
The net loss attributable to the Group came in at approximately EUR -102 million compared
with EUR +24 million in the previous year.
Financial statements
for the year ending 31 December 2014
36
3.4 Statement of Performance – IAS 1
A summary version of the Comprehensive Income or Statement of Performance - IAS 1, is
shown below. It reports the net income for the year, summarising the portion posted to the
income statement and directly to shareholders' equity:
Statement of Performance - IAS 1
Figures in EUR million 2014 2013
Net Profit/(Loss) (A) (90) 89
Items that could be subsequently reclassified within the profit (loss) for the period
Profit / (loss) on available-for-sale financial assets 87 55
Profit / (loss) on traslating foreign operations 370 (166)
Profit / (loss) on cash flow hedge 8 7
Profit / (loss) on investments valued at equity 1 9
Tax effect (22) (2)
Items that could be subsequently reclassified within the profit (loss) for the period
Profit/(loss) on remeasurement of defined benefit plans (4) (4)
Tax effect
Other comprehensive income/(loss) (B) 440 (101)
Total comprehensive income/(loss) (A+B) 350 (12)
Of which:
Net profit (loss) pertaining to minorities 193 (12)
Net profit (loss) pertaining to group 157 -
Profits/(losses) relating to available-for-sale financial assets posted a positive balance of EUR
87 million in 2014 (EUR 55 million in 2013) due in particular to the appreciation in the value of
Kenan Investments of EUR 77 million (EUR -91 million in 2013) and Banijai of EUR 17 million,
partially offset by the recycling to profit or loss of the fair value reserve relating to the shares
of Assicurazioni Generali sold during 2014 (EUR -21 million). The 2013 item included a positive
fair value adjustment of EUR +118 million to the investment in Assicurazioni Generali.
Profits/(losses) on exchange rate differences largely reflected the effects of the translation into
euro of the financial statements of the Group’s companies that are prepared in different
currencies, particularly relating to Games & Services business (EUR +369 million in 2014
compared with - EUR 152 million in 2013) mainly due to the appreciation of the US dollar
against the euro.
The item "Tax effect of components that may be subsequently restated under Profit/(loss) for
the period" is mainly related to the tax effect related to profits/(losses) from exchange rate
differences, and especially in Gaming & Services business (EUR -14 million in 2014 compared
with EUR +5 million in 2013).
To summarise, comprehensive income totalled EUR 350 million in 2014 compared with a figure
of EUR -12 million in 2013; the portion attributable to the Group totalled EUR 157 million
compared with a balance in 2013.
Financial statements
for the year ending 31 December 2014
37
3.5 Statement of financial position
The table below shows a summary of the Group’s key figures from the statement of financial
position:
Absolute
EUR million change
Goodwill 3,989 3,746 243
Other intangible assets 1,283 1,407 (124)
Tangible assets 1,038 1,033 5
Investments 1,658 1,961 (303)
Cash and cash equivalents 462 729 (267)
Other net assets (274) (136) (138)
TOTAL 8,156 8,740 (584)
for hedging:
Financial liabilities 4,083 4,681 (598)
Shareholders' equity 4,073 4,059 14
31.12.2014 31.12.2013
Goodwill
At 31 December 2014, goodwill was EUR 3,989 million (EUR 3,746 million at 31 December
2013), broken down as follows:
 EUR 37 million attributable to Publishing business (unchanged from 31 December
2013), of which EUR 34 million relates to School Texts;
 EUR 373 million relating to Media & Communication business (EUR 437 million at 31
December 2013), attributable to the acquisitions made in the content production area.
The change in comparison to 31 December 2013 reflects, in particular, impairment
totalling EUR 65 million applied during the year on the goodwill of Zodiak Media;
 EUR 3,422 million related to Gaming & Services business (EUR 3,115 million at 31
December 2013); the change in comparison to 31 December 2013 (EUR +307 million)
was mainly due to translation differences on goodwill denominated in foreign currencies
(EUR +301 million) and the 2014 acquisition of Probability (EUR +10 million) and the
sale of the Lis Ticket business division (EUR -8 million);
 EUR 157 million relating to Finance business (largely unchanged from 31 December
2013), mainly in respect of IDeA FIMIT SGR/DeA Capital Real Estate (EUR 124 million
at 31 December 2014, unchanged compared with 31 December 2013).
Other intangible assets
Other intangible assets include intellectual property rights, concessions, licences and
trademarks as well as other intangibles.
At 31 December 2014, Other intangible assets totalled EUR 1,283 million (EUR 1,407 million at
31 December 2013), comprising:
 EUR 43 million relating to Publishing business (EUR 44 million at 31 December 2013),
mainly in respect of publishing investments relating to School texts, intellectual
property rights and basic software and applications;
Financial statements
for the year ending 31 December 2014
38
 EUR 24 million relating to Media & Communication business (EUR 27 million at 31
December 2013), the main component of which was rights and formats;
 EUR 1,152 million relating to Gaming & Services business (EUR 1,257 million at 31
December 2013), primarily for customer agreements, concessions, licences and
capitalised software;
 EUR 63 million relating to Finance business (EUR 79 million at 31 December 2013),
chiefly due to customer contracts and performance fees for asset management, project
management and agency activities relating to DeA Capital.
The item takes into account amortisation and impairment totalling EUR 278 million (EUR 265
million in 2013); this item also reflects an increase due to the exchange rate effect of EUR +66
million (EUR -24 million in 2013).
Tangible assets
At 31 December 2014, tangible assets totalled EUR 1,038 million (EUR 1,033 million at 31
December 2013), which breaks down as follows:
 real estate totalling EUR 96 million (EUR 93 million at 31 December 2013);
 other tangible assets of EUR 942 million (EUR 940 million at 31 December 2013).
Real estate (EUR 96 million) includes:
 EUR 22 million relating to Publishing business (EUR 24 million at 31 December 2013);
 EUR 3 million relating to Media & Communication business (EUR 4 million at 31
December 2013);
 EUR 68 million relating to Gaming & Services business (EUR 62 million at 31 December
2013);
 EUR 3 million relating to Finance business (EUR 3 million at 31 December 2013).
Amortisation and impairment of EUR 14 million were charged for the period (EUR 11 million in
2013).
Other tangible assets totalled EUR 942 million, including:
 EUR 8 million relating to Publishing business (EUR 9 million at 31 December 2013);
 EUR 6 million relating to Media & Communication business (EUR 7 million at 31
December 2013);
 EUR 920 million relating to Gaming & Services business (EUR 914 million at 31
December 2013), mainly for terminals and systems;
 EUR 1 million relating to Finance business (EUR 2 million at 31 December 2013);
 EUR 7 million relating to holding company activities (EUR 8 million at 31 December
2013).
The item reflects depreciation, impairment and reversals during the period totalling EUR 242
million (EUR 248 million in 2013).
Investments
At 31 December 2014, the Group’s investments totalled EUR 1,658 million, a decrease of EUR
303 million on the figure of EUR 1,961 million at the end of 2013. The table below shows a
breakdown of this item:
Financial statements
for the year ending 31 December 2014
39
Investments
EUR million 31.12.2014 31.12.2013 Change
Investment properties 87 95 (8)
Equity Investments 366 619 (253)
Loans and receivables 26 56 (30)
Available-for-sale financial assets 1,115 1,125 (10)
Financial assets at fair value through profit or loss 64 66 (2)
Total group 1,658 1,961 (303)
At 31 December 2014 real estate investments totalled EUR 87 million (EUR 95 million at 31
December 2013) of which EUR 61 million (EUR 68 million at 31 December 2013) was due to
AVA fund managed by IDeA Capital Funds, EUR 10 million (unchanged from 31 December
2013) was due to De Agostini S.p.A., and EUR 16 million (also unchanged from 31 December
2013) was due to Nova Immobiliare. Depreciation and write-downs of EUR 1 million were
charged for the period (in line with 2013).
Investments valued at equity chiefly include EUR 306 million for Grupo Planeta-De Agostini
(EUR 331 million at 31 December 2013), EUR 11 million for Sigla Luxembourg (EUR 12 million
at 31 December 2013); at 31 December 2013 the balance also included EUR 221 million for
Sigla included in the scope of consolidation of DeA Capital and sold in 2014.
Loans and receivables totalled EUR 26 million, a decrease of EUR 30 million compared with the
balance of EUR 56 million at 31 December 2013 mainly due to the repayment received in
relation to the “quasi-equity“ loan made to the subsidiary Santé (EUR 29 million).
At 31 December 2014, Available-for-sale financial assets totalled EUR 1,115 million, compared
with EUR 1,125 million at 31 December 2013. These mainly include equity investments not
held for trading and units in mutual investment funds. A breakdown of “Available-for-sale
financial assets” by business area is shown in the table below.
Available-for-sale financial assets
EUR million 31.12.2014 % 31.12.2013 % Change
Publishing 2 0.2% 1 0.1% 1
Media & Communication 2 0.2% 2 0.2% -
Games and Services 15 1.3% 11 1.0% 4
Finance 961 86.2% 953 84.7% 8
Holding Companies 135 12.1% 158 14.0% (23)
Total group 1,115 100% 1,125 100% (10)
The largest component relates to the investment (included under financial assets) in
Assicurazioni Generali shares, recorded at a value of EUR 532 million (EUR 602 million at 31
December 2013), which was the closing price on 31 December 2014 (EUR 17.0 per share).
“Available-for-sale financial assets” also includes investments in funds (EUR 180 million, of
which EUR 177 million is held through Finance business and EUR 3 million through holding
company activities, compared with EUR 174 million at 31 December 2013) and other equity
investments/assets (EUR 403 million, of which EUR 252 million relates to Finance business,
and in particular, the equity investment in Kenan Investments/Migros, and EUR 132 million to
holding company activities, compared with EUR 349 million at 31 December 2013).
Financial statements
for the year ending 31 December 2014
40
The EUR 54 million increase in other equity investments/assets includes EUR +77 million
relating to Kenan Investments (EUR 209 million at 31 December 2014, compared with EUR
132 million at 31 December 2013, due entirely to the increase in fair value).
At 31 December 2014, “Financial assets at fair value through profit and loss” totalled EUR 64
million (EUR 66 million at 31 December 2013); these break down into EUR 7 million relating to
Publishing activities (zero at 31 December 2013), EUR 2 million relating to Gaming & Services
business (EUR 12 million at 31 December 2013), EUR 40 million relating to Finance business
(EUR 36 million at 31 December 2013), and EUR 15 million relating to holding company
activities (EUR 18 million at 31 December 2013).
Other net current assets
At 31 December 2014, other net current assets totalled EUR -274 million (EUR -136 million at
31 December 2013). The table below shows the items included in this balance, compared with
the corresponding values at the end of 2013.
Other net assets
EUR million 31.12.2014 31.12.2013 Change
Trade receivables/payables: net balance (232) (56) (176)
Net balance of non-current assets/liabilities or
of discontinued operations held for sale
- 1 (1)
Net balance of tax assets/liabilities (233) (150) (83)
Net balance of other assets/liabilities 343 247 96
Provisions (152) (178) 26
Total group (274) (136) (138)
The balance of trade receivables and payables comprises trade receivables of EUR 1,014
million (EUR 1,154 million at 31 December 2013) and trade payables of EUR 1,246 million
(EUR 1,210 million at 31 December 2013).
Since the investment in Soprarno SGR (EUR 1 million at 31 December 2013) was sold in 2014,
"Held-for-sale assets/liabilities" had a zero balance.
The balance of "Tax assets and liabilities” includes deferred tax assets of EUR 82 million
(EUR 71 million at 31 December 2013) and deferred tax liabilities of EUR 208 million (EUR 166
million at 31 December 2013).
The net balance of “Other assets/liabilities” includes other assets totalling EUR 788 million
(EUR 678 million at 31 December 2013), of which EUR 354 million relates to inventories
(EUR 333 million at 31 December 2013), and other liabilities totalling EUR 445 million
(EUR 431 million at 31 December 2013).
At 31 December 2014, “Provisions” of EUR 152 million (EUR 178 million at 31 December 2013)
mainly related to employment severance indemnity (EUR 22 million; EUR 19 million at 31
December 2013), other employee benefits (EUR 61 million; EUR 54 million at 31 December
2013), the agent severance fund (EUR 5 million; EUR 5 million at 31 December 2013) and
provisions for risks and charges, including those for investee companies (EUR 62 million; EUR
97 million at 31 December 2013).
Financial statements
for the year ending 31 December 2014
41
Shareholders' equity
At 31 December 2014, group and minorities' consolidated shareholders’ equity totalled EUR
4,073 million (versus EUR 4,059 million at the end of 2013); group shareholders’ equity was
EUR 2,534 million (EUR 2,427 million at 31 December 2013), while minority interests
accounted for EUR 1,539 million (EUR 1,632 million at the end of 2013).
The increase of EUR 107 million in the Group’s shareholders’ equity in 2014 was due to:
 a net loss of EUR 102 million for 2014;
 distribution of dividends totalling EUR 35 million;
 the impact of the fair value adjustment of assets held for sale, totalling EUR +46
million, particularly in relation to the appreciation in the value of Kenan Investments
(fully-diluted, pro-rata value of EUR +50 million), and Banijai (fully-diluted, pro-rata
value of EUR +17 million), partially offset by the recycling to profit or loss of the fair
value reserve relating to the shares of Assicurazioni Generali sold during 2014 (EUR -21
million);
 the impact of the exchange rate differences arising from the conversion of the financial
statements of the Group's foreign subsidiaries that have a functional currency other
than the euro (totalling EUR +211 million, of which EUR +210 million relates to Gaming
and Services business);
 other changes of EUR -13 million.
Shareholders' equity relating to minority interests fell by a total of EUR 93 million due to:
 net result of EUR +12 million for 2014;
 dividend payouts totalling EUR 142 million, almost entirely attributable to the minority
shareholders of Gtech;
 the impact of the exchange rate differences arising from the conversion of the financial
statements of the Group’s foreign subsidiaries that have a functional currency other
than the euro, totalling EUR +145 million, and especially related to Gaming & Services
business;
 capital transactions related to Gaming & Services business totalling EUR -38 million
mainly relating to the repayment to the minority shareholders of Lotterie Nazionali, SW
Holding and Consorzio Lotterie Nazionali of EUR 55 million that was previously paid for
the scratchcard concession, and the capital increase subscribed by minority
shareholders as a part of the management companies of the New Jersey Lotteries
totalling EUR 17 million;
 purchase of minority interests in subsidiaries totalling EUR 76 million, including EUR 64
million related to the purchase in March 2014, by exercising the call option, of the
entire stake held by UniCredit in SW Holding, the holder of the scratchcards concession;
 other changes totalling EUR +6 million.
Financial statements
for the year ending 31 December 2014
42
Net Financial Position (NFP)
The table below shows the Group’s net financial position broken down by business area:
Net Financial Position
EUR million 31.12.2014 31.12.2013 Change
Publishing (110) (120) 10
Media & Communication (236) (220) (16)
Games and Services (2,564) (2,481) (83)
Finance 48 (132) 180
Holding Companies (686) (896) 210
Total group (3,548) (3,849) 301
For more details on the changes in the net financial position relating to Business Activities -
Publishing, Media & Communication and Gaming & Services businesses - please see the section
of the Report on Operations entitled “Primary and secondary reporting formats”.
The NFP for Finance business reflects the figures recorded by DeA Capital, which had a net
financial position of of EUR +58 million at 31 December 2014 (EUR -127 million at 31
December 2013), as well as those relating to AVA fund, which was consolidated on a line-by-
line basis, taking into account the percentage interest held (EUR -10 million at 31 December
2014 versus EUR -5 million at 31 December 2013). The change in the net financial position of
Finance business in 2014 was mainly due to the receipt of proceeds of EUR +164 million from
the sale of Générale de Santé, liquidity of EUR +11 million generated by investments in private
equity funds of DeA Capital and operational cash flows generated by the asset management
platforms.
Holding company activities recorded a net financial position of EUR - 686 million at 31
December 2014, including payables to banks of EUR -832 million, De Agostini S.p.A.
convertible bond issue (EUR -80 million), cash and cash equivalents of EUR +67 million and
other assets and liabilities of EUR +159 million (including intercompany loans and the
receivable accrued for the interim dividend approved by Gtech in December 2014 and paid by
it in January 2015).
At 31 December 2014, there was an improvement of EUR +210 million in net financial
position over the end of 2013 balance, mainly due to dividends from investee companies
totalling EUR +170 million (including Gtech's interim dividend), dividends paid/purchases of
own shares of EUR -35 million, proceeds from the sale of the UniCredit CASHES totalling EUR
+64 million, proceeds from the sale of 0.25% of Assicurazioni Generali totalling EUR +64
million and structure costs and financial/other charges of EUR -53 million.
* * *
As previously indicated, the net financial position is calculated - using the financial statements
- as the difference between: a) cash and cash equivalents, as well as loans, receivables and
certain financial assets available for sale or recorded at fair value through profit or loss; and b)
financial liabilities.
Financial statements
for the year ending 31 December 2014
43
The reconciliation statement below shows the key figures in the consolidated statement of
financial position at December 31, 2014 as compared to the amounts included in net financial
position.
EUR million
Carrying
amount at
12.31.2014
of which in Net
Financial
Position
INVESTMENTS - NON-CURRENT ASSETS 1,152 20
Available-for-sale financial assets 1,110 18
Financial assets at fair value through profit or loss 42 2
LOANS AND RECEIVABLES - NON-CURRENT ASSETS 12 12
INVESTMENTS - CURRENT ASSETS 27 27
Available-for-sale financial assets 5 5
Financial assets at fair value through profit or loss 22 22
LOANS AND RECEIVABLES - CURRENT ASSETS 14 14
CASH AND CASH EQUIVALENTS 462 462
NON-CURRENT FINANCIAL LIABILITIES (2,798) (2,798)
CURRENT FINANCIAL LIABILITIES (1,285) (1,285)
Net Financial Position - Group (excluding Joint Venture) (2,416) (3,548)
The differences, related in particular to “Available-for-sale financial assets”, broadly relate to
the classification under this item of assets that do not meet the requirements for being
included in the calculation of net financial position, according to the Group’s accounting
principles; specifically, at 31 December 2014, and at 31 December 2013, the most significant
differences related to the value of the investments in Assicurazioni Generali shares, funds and
other financial investments.
For information on the use of financial instruments, pursuant to art. 2428, para. 2, point 6-bis
of the Italian Civil Code, please refer to the notes to the consolidated financial statements for
the year ending 31 December 2014.
Financial statements
for the year ending 31 December 2014
44
3.6 Main risks and uncertainties to which the parent company and consolidated
Group companies are exposed
As mentioned in the first section of the Report on Operations, the Group operates in a number
of industrial and financial sectors and is organised accordingly; each business activity
comes under a sub-holding company, which is responsible for the co-ordination, management
and control of all the companies that pertain to it. Alongside the above-mentioned activities,
holding company activities are carried out by companies in the holding company structure
which include the Parent Company and other directly- and indirectly-controlled financial
companies.
Given its structure and the international arena in which it operates, the Group is exposed to a
number of risks and uncertainties, which can be categorised as systemic risks or specific
risks.
Such risks may significantly affect the operating performance and financial position of the
Parent Company and the other companies included in the Group's consolidated financial
statements.
Systemic risks relate to trends in macro-economic variables in the different countries in which
the Group operates, and at global level, including GDP, interest rates, inflation, exchange rates
and unemployment, as well as the state of the financial markets – which particularly affects
access to capital and return on investment (especially financial investment).
Specific risks can be analysed according to individual business areas, and include:
 for Publishing business, risks connected with the demand for published products (i.e.
partworks, school texts and others), the costs of producing these products, legislative
changes and the efficiency and effectiveness of logistics systems;
 for Media & Communication business, risks associated with the performance of TV
broadcasters (in turn affected by trends in advertising revenues) and the creative
capacity required to launch new formats on the market;
 for Gaming & Services business, risks connected with the renewal of existing contracts
or licences, the innovation required to launch new “gaming” and “services” products,
production capacity for new gaming/lottery management systems, the possibility of a
technological malfunction (system and/or terminals) that prevents collection of receipts
and gives rise to compensation requests, and fixed-odds betting systems activity,
where the operator bears the bookmaking risk;
 for Finance business, risks connected with private equity activity (carried out by DeA
Capital) and alternative asset management activity (undertaken by IDeA FIMIT SGR,
IDeA Capital Funds SGR and IRE/IRE Advisory), and the performance of the
investments made.
Some risks are common to each business, even though the Group is highly diversified, and are
associated with the availability of management, relationships with employees and suppliers,
and integration policies.
The specific risks relating to the holding company activities – in addition to those connected
with the management of the operations in the above-mentioned business sectors and finance,
and the associated effects on cash flow or dividends – include exposure to specific sectors or
investments and the difficulties of identifying opportunities for investments or disposals.
Financial statements
for the year ending 31 December 2014
45
Although we stress the significance of the above-mentioned risks for the Group’s operating
performance and financial position, we have put in place appropriate measures to limit the
impact of any serious negative developments.
With regard to systemic risks, in early 2000 the Group started to diversify its investments –
both by sector and by geographical area. It now has a widely diversified portfolio of activities
combining resilient businesses (such as lotteries and asset management) with others that have
good long-term growth prospects (such as media and content production), all with a strong
international footprint.
With regard to specific risks, the Group believes it has adopted a modern system of
governance for its businesses making it possible to effectively manage the complexity and
achievement of the strategic goals of the sub-holding companies and the Group. Specifically,
this governance system has set out the procedures for managing relationships between the
Parent Company and sub-holding companies, and the responsibilities of the latter concerning
the co-ordination, management and control of all operating companies under their
responsibility.

More Related Content

Similar to De Agostini Annual report 2014

De Agostini 2021 highlights.pdf
De Agostini 2021 highlights.pdfDe Agostini 2021 highlights.pdf
De Agostini 2021 highlights.pdf
DeA Capital S.p.A.
 
Company profile rcs en
Company profile rcs  enCompany profile rcs  en
Company profile rcs enEnrico Fili
 
Media Concentration
Media ConcentrationMedia Concentration
Media Concentration
yuklan
 
The Walt Disney Company - Critique Report
The Walt Disney Company - Critique ReportThe Walt Disney Company - Critique Report
The Walt Disney Company - Critique ReportJayson French, M.B.A.
 
Exportar Foundation Magazine #8 - English version
Exportar Foundation Magazine #8 - English versionExportar Foundation Magazine #8 - English version
Exportar Foundation Magazine #8 - English version
Noticias de Exportar
 
Product Brochure: Global Collect: Company Profile 2015: Online Payment Services
Product Brochure: Global Collect: Company Profile 2015: Online Payment ServicesProduct Brochure: Global Collect: Company Profile 2015: Online Payment Services
Product Brochure: Global Collect: Company Profile 2015: Online Payment Services
yStats.com
 
GCF - Présentation Media, Culture & Entertainment - 1222_.pdf
GCF - Présentation Media, Culture & Entertainment - 1222_.pdfGCF - Présentation Media, Culture & Entertainment - 1222_.pdf
GCF - Présentation Media, Culture & Entertainment - 1222_.pdf
HlnePEYRUSQUE
 
GCF - Présentation Media, Culture & Entertainment - 1022.pdf
GCF - Présentation Media, Culture & Entertainment - 1022.pdfGCF - Présentation Media, Culture & Entertainment - 1022.pdf
GCF - Présentation Media, Culture & Entertainment - 1022.pdf
Lucas518833
 
THE GAME COMPANY - Farvi comunicare per noi è un gioco!
THE GAME COMPANY - Farvi comunicare per noi è un gioco!THE GAME COMPANY - Farvi comunicare per noi è un gioco!
THE GAME COMPANY - Farvi comunicare per noi è un gioco!
Stefano Momoni
 
Np tv the-social-medium-final-21-nov-2014
Np tv the-social-medium-final-21-nov-2014Np tv the-social-medium-final-21-nov-2014
Np tv the-social-medium-final-21-nov-2014
OptimediaSpain
 
Communifix! - Integrated Marketing Firm: Strategy.Creative.Digital.Content: C...
Communifix! - Integrated Marketing Firm: Strategy.Creative.Digital.Content: C...Communifix! - Integrated Marketing Firm: Strategy.Creative.Digital.Content: C...
Communifix! - Integrated Marketing Firm: Strategy.Creative.Digital.Content: C...
Communifix Communication Pvt. Ltd.
 
Accounting report tod's
Accounting report tod'sAccounting report tod's
Accounting report tod's
Xaxis
 
Résultats annuels OneLife
Résultats annuels OneLifeRésultats annuels OneLife
Résultats annuels OneLife
Paperjam_redaction
 
Krešo Gudelj: Adriatic-Home.Com
Krešo Gudelj: Adriatic-Home.ComKrešo Gudelj: Adriatic-Home.Com
Krešo Gudelj: Adriatic-Home.ComInitium
 
Hampleton internet commerce report, september 2014
Hampleton internet commerce report, september 2014Hampleton internet commerce report, september 2014
Hampleton internet commerce report, september 2014
Rachel Muzyczka
 
Creative europe vg 21 may
Creative europe vg 21 mayCreative europe vg 21 may
Creative europe vg 21 may
Mediadesk2015
 
Open ended investment-managers_poster_feb2017
Open ended investment-managers_poster_feb2017Open ended investment-managers_poster_feb2017
Open ended investment-managers_poster_feb2017
Balint Marcell Juhasz
 
Company Presentation - Settembre 2017
Company Presentation - Settembre 2017Company Presentation - Settembre 2017
Company Presentation - Settembre 2017
Italiaonline
 
Publi groupe presentation swiss equity forum version 7 september 2011 present...
Publi groupe presentation swiss equity forum version 7 september 2011 present...Publi groupe presentation swiss equity forum version 7 september 2011 present...
Publi groupe presentation swiss equity forum version 7 september 2011 present...PubliGroupe
 

Similar to De Agostini Annual report 2014 (20)

De Agostini 2021 highlights.pdf
De Agostini 2021 highlights.pdfDe Agostini 2021 highlights.pdf
De Agostini 2021 highlights.pdf
 
Company profile rcs en
Company profile rcs  enCompany profile rcs  en
Company profile rcs en
 
Media Concentration
Media ConcentrationMedia Concentration
Media Concentration
 
The Walt Disney Company - Critique Report
The Walt Disney Company - Critique ReportThe Walt Disney Company - Critique Report
The Walt Disney Company - Critique Report
 
Case study umg vinyl
Case study umg vinylCase study umg vinyl
Case study umg vinyl
 
Exportar Foundation Magazine #8 - English version
Exportar Foundation Magazine #8 - English versionExportar Foundation Magazine #8 - English version
Exportar Foundation Magazine #8 - English version
 
Product Brochure: Global Collect: Company Profile 2015: Online Payment Services
Product Brochure: Global Collect: Company Profile 2015: Online Payment ServicesProduct Brochure: Global Collect: Company Profile 2015: Online Payment Services
Product Brochure: Global Collect: Company Profile 2015: Online Payment Services
 
GCF - Présentation Media, Culture & Entertainment - 1222_.pdf
GCF - Présentation Media, Culture & Entertainment - 1222_.pdfGCF - Présentation Media, Culture & Entertainment - 1222_.pdf
GCF - Présentation Media, Culture & Entertainment - 1222_.pdf
 
GCF - Présentation Media, Culture & Entertainment - 1022.pdf
GCF - Présentation Media, Culture & Entertainment - 1022.pdfGCF - Présentation Media, Culture & Entertainment - 1022.pdf
GCF - Présentation Media, Culture & Entertainment - 1022.pdf
 
THE GAME COMPANY - Farvi comunicare per noi è un gioco!
THE GAME COMPANY - Farvi comunicare per noi è un gioco!THE GAME COMPANY - Farvi comunicare per noi è un gioco!
THE GAME COMPANY - Farvi comunicare per noi è un gioco!
 
Np tv the-social-medium-final-21-nov-2014
Np tv the-social-medium-final-21-nov-2014Np tv the-social-medium-final-21-nov-2014
Np tv the-social-medium-final-21-nov-2014
 
Communifix! - Integrated Marketing Firm: Strategy.Creative.Digital.Content: C...
Communifix! - Integrated Marketing Firm: Strategy.Creative.Digital.Content: C...Communifix! - Integrated Marketing Firm: Strategy.Creative.Digital.Content: C...
Communifix! - Integrated Marketing Firm: Strategy.Creative.Digital.Content: C...
 
Accounting report tod's
Accounting report tod'sAccounting report tod's
Accounting report tod's
 
Résultats annuels OneLife
Résultats annuels OneLifeRésultats annuels OneLife
Résultats annuels OneLife
 
Krešo Gudelj: Adriatic-Home.Com
Krešo Gudelj: Adriatic-Home.ComKrešo Gudelj: Adriatic-Home.Com
Krešo Gudelj: Adriatic-Home.Com
 
Hampleton internet commerce report, september 2014
Hampleton internet commerce report, september 2014Hampleton internet commerce report, september 2014
Hampleton internet commerce report, september 2014
 
Creative europe vg 21 may
Creative europe vg 21 mayCreative europe vg 21 may
Creative europe vg 21 may
 
Open ended investment-managers_poster_feb2017
Open ended investment-managers_poster_feb2017Open ended investment-managers_poster_feb2017
Open ended investment-managers_poster_feb2017
 
Company Presentation - Settembre 2017
Company Presentation - Settembre 2017Company Presentation - Settembre 2017
Company Presentation - Settembre 2017
 
Publi groupe presentation swiss equity forum version 7 september 2011 present...
Publi groupe presentation swiss equity forum version 7 september 2011 present...Publi groupe presentation swiss equity forum version 7 september 2011 present...
Publi groupe presentation swiss equity forum version 7 september 2011 present...
 

More from DeA Capital S.p.A.

De Agostini SpA - Bilancio 2021
 De Agostini SpA - Bilancio 2021 De Agostini SpA - Bilancio 2021
De Agostini SpA - Bilancio 2021
DeA Capital S.p.A.
 
De Agostini SpA - Bilancio 2020
De Agostini SpA - Bilancio 2020De Agostini SpA - Bilancio 2020
De Agostini SpA - Bilancio 2020
DeA Capital S.p.A.
 
De Agostini SpA - Bilancio 2019
De Agostini SpA - Bilancio 2019De Agostini SpA - Bilancio 2019
De Agostini SpA - Bilancio 2019
DeA Capital S.p.A.
 
De Agostini SpA - Bilancio 2018
De Agostini SpA - Bilancio 2018De Agostini SpA - Bilancio 2018
De Agostini SpA - Bilancio 2018
DeA Capital S.p.A.
 
DeA Capital Relazione Finanziaria Semestrale al 30 giugno 2018
DeA Capital Relazione Finanziaria Semestrale al 30 giugno 2018DeA Capital Relazione Finanziaria Semestrale al 30 giugno 2018
DeA Capital Relazione Finanziaria Semestrale al 30 giugno 2018
DeA Capital S.p.A.
 
DeA Capital Half-year Report to 30 June 2018
DeA Capital Half-year Report to 30 June 2018DeA Capital Half-year Report to 30 June 2018
DeA Capital Half-year Report to 30 June 2018
DeA Capital S.p.A.
 
DeA Capital Half-year Report to 30 June 2018
DeA Capital Half-year Report to 30 June 2018DeA Capital Half-year Report to 30 June 2018
DeA Capital Half-year Report to 30 June 2018
DeA Capital S.p.A.
 
DeA Capital Relazione Finanziaria Semestrale al 30 giugno 2018
DeA Capital Relazione Finanziaria Semestrale al 30 giugno 2018DeA Capital Relazione Finanziaria Semestrale al 30 giugno 2018
DeA Capital Relazione Finanziaria Semestrale al 30 giugno 2018
DeA Capital S.p.A.
 
De Agostini S.p.A. Bilancio 2017
 De Agostini S.p.A. Bilancio 2017 De Agostini S.p.A. Bilancio 2017
De Agostini S.p.A. Bilancio 2017
DeA Capital S.p.A.
 
DeA Capital 2017 Annual Report
DeA Capital 2017 Annual ReportDeA Capital 2017 Annual Report
DeA Capital 2017 Annual Report
DeA Capital S.p.A.
 
Bilancio DeA Capital 2017
Bilancio DeA Capital 2017Bilancio DeA Capital 2017
Bilancio DeA Capital 2017
DeA Capital S.p.A.
 
Relazione Finanziaria Semestrale al 30 giugno 2017
Relazione Finanziaria Semestrale al 30 giugno 2017Relazione Finanziaria Semestrale al 30 giugno 2017
Relazione Finanziaria Semestrale al 30 giugno 2017
DeA Capital S.p.A.
 
Half-year Report to 30 June 2017
Half-year Report to 30 June 2017Half-year Report to 30 June 2017
Half-year Report to 30 June 2017
DeA Capital S.p.A.
 
De Agostini S.p.A. Bilancio 2016
De Agostini S.p.A. Bilancio 2016De Agostini S.p.A. Bilancio 2016
De Agostini S.p.A. Bilancio 2016
DeA Capital S.p.A.
 
Bilancio DeA Capital 2016
Bilancio DeA Capital 2016Bilancio DeA Capital 2016
Bilancio DeA Capital 2016
DeA Capital S.p.A.
 
DeA Capital 2016 Annual Report
DeA Capital 2016 Annual ReportDeA Capital 2016 Annual Report
DeA Capital 2016 Annual Report
DeA Capital S.p.A.
 
Interim Management Report to 30 September 2016
Interim Management Report to 30 September 2016Interim Management Report to 30 September 2016
Interim Management Report to 30 September 2016
DeA Capital S.p.A.
 
Resoconto Intermedio di Gestione al 30 settembre 2016
Resoconto Intermedio di Gestione al 30 settembre 2016Resoconto Intermedio di Gestione al 30 settembre 2016
Resoconto Intermedio di Gestione al 30 settembre 2016
DeA Capital S.p.A.
 
Relazione Finanziaria Semestrale al 30 giugno 2016
Relazione Finanziaria Semestrale al 30 giugno 2016Relazione Finanziaria Semestrale al 30 giugno 2016
Relazione Finanziaria Semestrale al 30 giugno 2016
DeA Capital S.p.A.
 
Half-year Report to 30 June 2016
Half-year Report to 30 June 2016Half-year Report to 30 June 2016
Half-year Report to 30 June 2016
DeA Capital S.p.A.
 

More from DeA Capital S.p.A. (20)

De Agostini SpA - Bilancio 2021
 De Agostini SpA - Bilancio 2021 De Agostini SpA - Bilancio 2021
De Agostini SpA - Bilancio 2021
 
De Agostini SpA - Bilancio 2020
De Agostini SpA - Bilancio 2020De Agostini SpA - Bilancio 2020
De Agostini SpA - Bilancio 2020
 
De Agostini SpA - Bilancio 2019
De Agostini SpA - Bilancio 2019De Agostini SpA - Bilancio 2019
De Agostini SpA - Bilancio 2019
 
De Agostini SpA - Bilancio 2018
De Agostini SpA - Bilancio 2018De Agostini SpA - Bilancio 2018
De Agostini SpA - Bilancio 2018
 
DeA Capital Relazione Finanziaria Semestrale al 30 giugno 2018
DeA Capital Relazione Finanziaria Semestrale al 30 giugno 2018DeA Capital Relazione Finanziaria Semestrale al 30 giugno 2018
DeA Capital Relazione Finanziaria Semestrale al 30 giugno 2018
 
DeA Capital Half-year Report to 30 June 2018
DeA Capital Half-year Report to 30 June 2018DeA Capital Half-year Report to 30 June 2018
DeA Capital Half-year Report to 30 June 2018
 
DeA Capital Half-year Report to 30 June 2018
DeA Capital Half-year Report to 30 June 2018DeA Capital Half-year Report to 30 June 2018
DeA Capital Half-year Report to 30 June 2018
 
DeA Capital Relazione Finanziaria Semestrale al 30 giugno 2018
DeA Capital Relazione Finanziaria Semestrale al 30 giugno 2018DeA Capital Relazione Finanziaria Semestrale al 30 giugno 2018
DeA Capital Relazione Finanziaria Semestrale al 30 giugno 2018
 
De Agostini S.p.A. Bilancio 2017
 De Agostini S.p.A. Bilancio 2017 De Agostini S.p.A. Bilancio 2017
De Agostini S.p.A. Bilancio 2017
 
DeA Capital 2017 Annual Report
DeA Capital 2017 Annual ReportDeA Capital 2017 Annual Report
DeA Capital 2017 Annual Report
 
Bilancio DeA Capital 2017
Bilancio DeA Capital 2017Bilancio DeA Capital 2017
Bilancio DeA Capital 2017
 
Relazione Finanziaria Semestrale al 30 giugno 2017
Relazione Finanziaria Semestrale al 30 giugno 2017Relazione Finanziaria Semestrale al 30 giugno 2017
Relazione Finanziaria Semestrale al 30 giugno 2017
 
Half-year Report to 30 June 2017
Half-year Report to 30 June 2017Half-year Report to 30 June 2017
Half-year Report to 30 June 2017
 
De Agostini S.p.A. Bilancio 2016
De Agostini S.p.A. Bilancio 2016De Agostini S.p.A. Bilancio 2016
De Agostini S.p.A. Bilancio 2016
 
Bilancio DeA Capital 2016
Bilancio DeA Capital 2016Bilancio DeA Capital 2016
Bilancio DeA Capital 2016
 
DeA Capital 2016 Annual Report
DeA Capital 2016 Annual ReportDeA Capital 2016 Annual Report
DeA Capital 2016 Annual Report
 
Interim Management Report to 30 September 2016
Interim Management Report to 30 September 2016Interim Management Report to 30 September 2016
Interim Management Report to 30 September 2016
 
Resoconto Intermedio di Gestione al 30 settembre 2016
Resoconto Intermedio di Gestione al 30 settembre 2016Resoconto Intermedio di Gestione al 30 settembre 2016
Resoconto Intermedio di Gestione al 30 settembre 2016
 
Relazione Finanziaria Semestrale al 30 giugno 2016
Relazione Finanziaria Semestrale al 30 giugno 2016Relazione Finanziaria Semestrale al 30 giugno 2016
Relazione Finanziaria Semestrale al 30 giugno 2016
 
Half-year Report to 30 June 2016
Half-year Report to 30 June 2016Half-year Report to 30 June 2016
Half-year Report to 30 June 2016
 

Recently uploaded

New Tax Regime User Guide Flexi Plan Revised (1).pptx
New Tax Regime User Guide Flexi Plan Revised (1).pptxNew Tax Regime User Guide Flexi Plan Revised (1).pptx
New Tax Regime User Guide Flexi Plan Revised (1).pptx
RajkumarRajamanikam
 
Investor Day 2024 Presentation Sysco 2024
Investor Day 2024 Presentation Sysco 2024Investor Day 2024 Presentation Sysco 2024
Investor Day 2024 Presentation Sysco 2024
Sysco_Investors
 
Snam 2023-27 Industrial Plan - Financial Presentation
Snam 2023-27 Industrial Plan - Financial PresentationSnam 2023-27 Industrial Plan - Financial Presentation
Snam 2023-27 Industrial Plan - Financial Presentation
Valentina Ottini
 
cyberagent_For New Investors_EN_240424.pdf
cyberagent_For New Investors_EN_240424.pdfcyberagent_For New Investors_EN_240424.pdf
cyberagent_For New Investors_EN_240424.pdf
CyberAgent, Inc.
 
Collective Mining | Corporate Presentation - May 2024
Collective Mining | Corporate Presentation - May 2024Collective Mining | Corporate Presentation - May 2024
Collective Mining | Corporate Presentation - May 2024
CollectiveMining1
 
Collective Mining | Corporate Presentation - May 2024
Collective Mining | Corporate Presentation - May 2024Collective Mining | Corporate Presentation - May 2024
Collective Mining | Corporate Presentation - May 2024
CollectiveMining1
 
Osisko Development - Investor Presentation - June 24
Osisko Development - Investor Presentation - June 24Osisko Development - Investor Presentation - June 24
Osisko Development - Investor Presentation - June 24
Philip Rabenok
 
Corporate Presentation Probe June 2024.pdf
Corporate Presentation Probe June 2024.pdfCorporate Presentation Probe June 2024.pdf
Corporate Presentation Probe June 2024.pdf
Probe Gold
 

Recently uploaded (8)

New Tax Regime User Guide Flexi Plan Revised (1).pptx
New Tax Regime User Guide Flexi Plan Revised (1).pptxNew Tax Regime User Guide Flexi Plan Revised (1).pptx
New Tax Regime User Guide Flexi Plan Revised (1).pptx
 
Investor Day 2024 Presentation Sysco 2024
Investor Day 2024 Presentation Sysco 2024Investor Day 2024 Presentation Sysco 2024
Investor Day 2024 Presentation Sysco 2024
 
Snam 2023-27 Industrial Plan - Financial Presentation
Snam 2023-27 Industrial Plan - Financial PresentationSnam 2023-27 Industrial Plan - Financial Presentation
Snam 2023-27 Industrial Plan - Financial Presentation
 
cyberagent_For New Investors_EN_240424.pdf
cyberagent_For New Investors_EN_240424.pdfcyberagent_For New Investors_EN_240424.pdf
cyberagent_For New Investors_EN_240424.pdf
 
Collective Mining | Corporate Presentation - May 2024
Collective Mining | Corporate Presentation - May 2024Collective Mining | Corporate Presentation - May 2024
Collective Mining | Corporate Presentation - May 2024
 
Collective Mining | Corporate Presentation - May 2024
Collective Mining | Corporate Presentation - May 2024Collective Mining | Corporate Presentation - May 2024
Collective Mining | Corporate Presentation - May 2024
 
Osisko Development - Investor Presentation - June 24
Osisko Development - Investor Presentation - June 24Osisko Development - Investor Presentation - June 24
Osisko Development - Investor Presentation - June 24
 
Corporate Presentation Probe June 2024.pdf
Corporate Presentation Probe June 2024.pdfCorporate Presentation Probe June 2024.pdf
Corporate Presentation Probe June 2024.pdf
 

De Agostini Annual report 2014

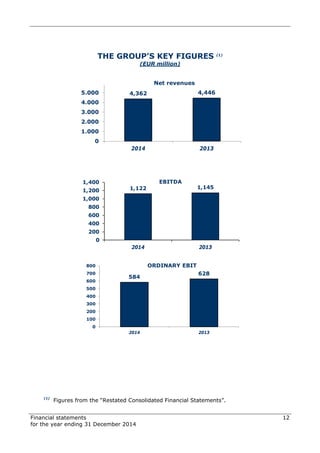
  • 1. Financial statements for the year ending 31 December 2014 12 THE GROUP’S KEY FIGURES (1) (EUR million) 4,362 4,446 0 1.000 2.000 3.000 4.000 5.000 2014 2013 Net revenues 1,122 1,145 0 200 400 600 800 1,000 1,200 1,400 2014 2013 EBITDA 584 628 0 100 200 300 400 500 600 700 800 2014 2013 ORDINARY EBIT (1) Figures from the “Restated Consolidated Financial Statements”.
  • 2. Financial statements for the year ending 31 December 2014 13 THE GROUP’S KEY FIGURES (1) (EUR million) 366 421 (276) (182) 90 239 (400) (200) 0 200 400 600 2014 2013 ORDINARY EBT (A) NO - ORDINARY EBT (B) EBT (A+B) (90) 89 350 (12) (300) 0 300 600 2014 2013 Consolidate Net Profit (loss) Total Comprehensive Income (Stat. of Perform. - IAS 1) 4,073 4,059 (3,548) (3,849)(6,000) (3,000) 0 3,000 31-dic-2014 31-dic-2013 Shareholders' Equity (Group) Net Financial Position (1) Figures from the “Restated Consolidated Financial Statements”.
  • 3. Financial statements for the year ending 31 December 2014 14 Report on Operations
  • 4. Financial statements for the year ending 31 December 2014 15 1. The Group De Agostini S.p.a. controls a group of operating companies organised by business activity, whose structure can be summarised as follows:  Businesses o Publishing o Media & Communication o Gaming & Services  Finance Each business comes under the responsibility of a sub-holding company, which co-ordinates, manages and controls all the operating companies that pertain to it. Alongside the above-mentioned activities, holding company activities are carried out by companies in the holding company structure which, in addition to the Company, includes other directly- and indirectly-controlled financial companies. A diagram summarising the Group structure at 31 December 2014 is shown below, followed by a brief description of the activities carried out by each business.
  • 5. Financial statements for the year ending 31 December 2014 16 PUBLISHING This is the Group’s traditional business, and is organised by business unit, based on the nature of products provided and the channels used, as detailed below:  Partworks, which includes Italian and international partworks activities, coordinated by De Agostini Publishing; in this business unit the Group produces collections – sold through newsstands and on subscription - aimed at various target markets, including hobbies, cinema, products for children and cookery courses;  Direct Marketing, which includes the activities managed through the subsidiary De Agostini Atlas Editions. In this business unit the Group operates with the product lines "Print & Collectibles", "Consumables" and "Direct Sales" and with the "Atlas For Men" catalogue sales offered to customers in various European countries and in Russia by mail order and direct sales;  Books, which includes the traditional publishing activities of books and school texts, coordinated by De Agostini Libri. In the book business, the Group operates directly through De Agostini Libri, which is active in "General and Illustrated Books", "Children's Books" and "B2B" (special initiatives), and in foreign markets, through joint publications and international distribution. In School Texts, the Group mainly operates on the Italian market under a number of brands in the primary and secondary school, university and dictionary areas. At the end of 2014, the Cartography division of the Books business unit was sold. The Group is also active in the Digital area, which encompasses activities relating to theme– based TV channels and a series of properties on digital platforms. Specifically, the Group manages products targeting children and families on both the satellite and terrestrial digital platform of the following theme-based TV channels: 'DeA Kids', 'DeA Junior', 'DeA Sapere HD' (now 'Explora HD' in order to be more responsive to the target market within Sky's '400' channels) and 'Super!'. The sub-holding company for the De Agostini Group's Publishing activities is De Agostini Editore S.p.A. (De Agostini Editore), which is 100% owned by De Agostini S.p.A. Publishing business of Grupo Planeta-De Agostini, a 50:50 joint venture with Planeta Corporación, a subsidiary of DeA Communications responsible for Partworks and Training activities in Spain, France, Portugal and Latin America, operates outside De Agostini Editore Group structure.
  • 6. Financial statements for the year ending 31 December 2014 17 MEDIA & COMMUNICATION This business includes the Group’s interests in the production and distribution of content for television, cinema and other media. In 2007, the business started to expand its "content" via a build-up process, which initially led to the acquisition of controlling stakes in Magnolia and Marathon Group and subsequently in Zodiak Television (2008) and RDF (2010); all investments made in the business – i.e. the total holdings in Magnolia, Marathon Group, Zodiak Television and RDF Media – are now entirely owned by the holding company Zodiak Media; at 31 December 2014, this was around 88% owned by the De Agostini Group, with the remaining 12% owned by institutional investors and managers of the operating companies. De Agostini Communications S.A. (DeA Communications), a company 100%-owned by De Agostini S.p.A., is the sub-holding company for Media and Communication. At 31 December 2014, in addition to the above-mentioned Zodiak Media, the following companies formed part of this business:  Atresmedia, a Spanish national radio/TV broadcaster listed on Madrid stock exchange;  DeA Planeta, active in cinema and content distribution in Spain. Atresmedia and DeA Planeta are subsidiaries of Grupo Planeta-De Agostini, a 50:50 joint venture with Planeta Corporación.
  • 7. Financial statements for the year ending 31 December 2014 18 GAMING & SERVICES The business comprises the Group’s activities in Gaming & Services. At 31 December 2014, the sub-holding company for these activities was Gtech S.p.A. (Gtech), a company listed on Milan stock exchange and on the US over-the-counter market as part of the Sponsored Level 1 American Depository Receipt (ADR) programme, which is controlled by De Agostini S.p.A. directly, and indirectly (through DeA Partecipazioni), with a majority stake totalling about 59% In 2014, Gtech signed a number of agreements to acquire International Game Technology (IGT), a global leader in the casino and gaming entertainment sector with registered office in Las Vegas, Nevada (USA), through a merger of the two companies into a newly established holding company with registered office in the UK (Holdco) listed on the New York Stock Exchange - NYSE. Specifically, the merger agreements finalised on 7 April 2015 (after obtaining the necessary authorisations) called for the following:  an exchange of 1 Gtech share for every 1 Holdco share;  allocation of a payment of USD 18.02 per share for each IGT share (initially set at USD 18.25 per share) including USD 14.34 in cash (80%) and USD 3.68 per share in kind (20%) for a total payment of about USD 4.6 billion for the transaction. Concurrent with the finalisation of the merger, Holdco has been renamed "IGT Plc", which is held by De Agostini Group with a majority stake of 52.09% (including 47.02% held directly through De Agostini S.p.A. and 5.07% held through DeA Partecipazioni). Until the above-mentioned merger date (and thus, throughout 2014), Gtech operated in the following businesses:  Lotteries: as the global leader in high-security processing systems for online lotteries, it plans, sells and manages a complete range of terminals for sales outlets authorised to manage lotteries, electronically connected to a centralised system that serves as an intermediary between the outlets, where individual transactions take place, and the lottery regulatory authorities; provides instant ticket-printing and related services; has developed, and continues to develop, new systems for lotteries, granting new gaming brands under licence to the regulatory authorities in the various jurisdictions, and installing its entire range of new lottery ticket distribution machines; in several countries, it operates as a private manager, under government supervision, of all lottery operations and the main associated activities; it operates as an exclusive licence-holder for the Lotto and Gratta & Vinci (scratchcards) concession in Italy;  Sports Betting: provides a sports betting platform which consists of a central core with associated support modules; it holds numerous concessions for managing sports and horse race betting, as well as non-sporting events relating to the world of theatre, music, culture and national and international news;  Gaming Machines: plans, develops, produces and supplies machines, games, systems and software for the regulated gaming market; is the world leader in the supply of video lotteries and centralised systems and games in North America and Europe, and is the leading supplier of video lotteries and games in the US; it is the leading supplier of traditional and video slot machines and in the production of gaming systems in Europe, Asia, Latin America and the United States for Native American casinos, as well as supplying AWPs and gaming software in Europe;  Interactive Games: provides interactive games, such as online poker, casino, bingo and other skill games;
  • 8. Financial statements for the year ending 31 December 2014 19  Commercial Services: offers processing services for high volumes of commercial transactions not connected with lotteries, including top-up services for mobile phones, utility payments, and ticket sales for music and sporting events.
  • 9. Financial statements for the year ending 31 December 2014 20 FINANCE This business includes the activities carried out within the Group in alternative investment, particularly private equity investment and alternative asset management, or financial investment activity in general:  PRIVATE EQUITY INVESTMENT  Direct investment in the services sector in Europe and Emerging Europe. Of particular interest is the minority shareholding in Migros, Turkey's biggest food retail chain (whose shares are listed on the Istanbul Stock Exchange).  Indirect investment in private equity funds of funds, co-investment funds and theme-based funds.  ALTERNATIVE ASSET MANAGEMENT  IDeA Capital Funds SGR, active in the management of private equity funds, funds of funds, co-investment funds and theme-based funds (with assets under management totalling about EUR 1.5 billion)  IDeA FIMIT SGR, active in the management of real estate funds (with around EUR 9.0 billion assets under management)  IRE / IRE Advisory, which operates in project, property and facility management, as well as real estate brokerage The sub-holding company for De Agostini Group Finance business is DeA Capital S.p.A. (DeA Capital), which is listed on the FTSE Italia STAR segment of Milan stock exchange and is directly controlled by De Agostini S.p.A. with a stake of around 58.3% at 31 December 2014. The business also includes a minority shareholding (around 2.01% at 31 December 2014) in Assicurazioni Generali, one of Europe’s leading insurance companies, which is listed on Milan stock exchange. Around 2.01% of the stake is held via DeA Partecipazioni (a company directly and totally controlled by De Agostini S.p.A.).
  • 10. Financial statements for the year ending 31 December 2014 21 HOLDING COMPANY activities Holding company activities, including the activities carried out by the companies within the holding company structure, comprise - apart from the Company itself- other directly or indirectly controlled financial companies; specifically, these activities relate to the management of shareholdings in the sub-holding companies of the Group’s individual businesses, as well as its interests in non-strategic shareholdings and activities. At 31 December 2014, the main companies in the holding company structure were:  DeA Partecipazioni, which holds 2.01% of the share capital of Assicurazioni Generali (as well as a shareholding in Gtech, now IGT);  De Agostini Invest, which holds a number of investments in non-strategic financial activities;  DeA Factor, which mainly carries out the factoring of receivables due to Group companies from third parties.
  • 11. Financial statements for the year ending 31 December 2014 22 2. Significant events during the year PUBLISHING  Establishment of DeA 59 and acquisition of "Canale 59" business division On 15 April 2014, De Agostini Publishing established the company DeA 59, which, effective 1 May 2014, purchased from Lottomatica Scommesse, the business division called "Canale 59", which is engaged in the business of providing audio-visual media and data services nationwide aimed at broadcasting terrestrial digital TV on Channel 59. In order to enhance this channel, in 2014 DeA 59 signed agreements with RCS Mediagroup to start up a joint project consisting in the launch of a sports television channel with all-news programming and significant air time devoted to sports-related news and commentary. On 29 January 2015, the joint project called for the establishment of a company in partnership between DeA 59 (40%) and RCS Mediagroup (60%) called Digital Factory, to which the above- mentioned business division has been also transferred (for about EUR 1.8 million). On 26 February 2015, the partnership company began broadcasting on the new TV channel called "GazzettaTV".  Sale of the shareholding in Garzanti Editore On 30 September 2014, De Agostini Libri completed the sale of the entire stake in Garzanti Editore to Garzanti Libri equal to 51% of the share capital of the former for a total of EUR 0.3 million.  Sale of the Cartography business division Effective 31 December 2014, De Agostini Libri sold the Cartography business division to third parties for a token amount of compensation. It was engaged in the publication of paper-based and electronic multi-media works in the area of cartography and geography.
  • 12. Financial statements for the year ending 31 December 2014 23 MEDIA & COMMUNICATION  Revision of earn-out agreements between Atresmedia and former Sexta shareholders In February 2014 the earn-out agreements between Atresmedia and former Sexta shareholders were revised with a reduction in the number of Atresmedia own shares to be delivered to shareholders in relation to the acquisition of the channel concerned (from the previous level of about 7% to about 4.2% of capital). Later, in March 2014, Atresmedia sold the own shares thus "released" (2.8% of share capital) for a total amount of approximately EUR 80 million.  Sale of interest in 2BCom On 27 February 2014 Magnolia completed the sale of its entire shareholding in 2BCom, equal to 80% of the company's share capital, to third parties for a token payment.  Establishment of Zodiak Active Plus On 21 March 2014, Zodiak Active established Zodiak Active Plus, and then on 22 April 2014, with effect from 1 May 2014, it transferred the Advertising & Brands business division to Zodiak Active Plus for a net carrying value of EUR 2.5 million. Later, on 29 May 2014, Zodiak Active sold its entire stake in Zodiak Active Plus to DeA Communications for a payment of about EUR 2.8 million in addition to an earn-out to be paid on the achievement of certain goals.  Refinancing of Zodiak Media In April 2014 the amendment of Zodiak Media Facilities Agreement was finalised with De Agostini S.p.A. providing a guarantee to cover Zodiak Media financial obligations (EUR 165 million at 31 December 2014 including EUR 140 million for the Term Loan, and up to EUR 25 million for the Revolving Credit Line) in exchange for the cancellation:  of all covenants contained in the Facilities Agreement starting on the reporting date until 31 December 2013;  of the clean-down clause related to the Revolving Credit Line, which required the full repayment of the line at least once annually.
  • 13. Financial statements for the year ending 31 December 2014 24 GAMING & SERVICES  Exercise of call option on UniCredit's entire stake in “Gratta & Vinci” (scratchcards concession) In March 2014, Gtech acquired UniCredit's stake in SW Holding, the company holding the scratchcards concession, for approximately EUR 72 million, by exercising a call option. At the conclusion of the transaction, Gtech owned 64% (compared with 51.5% previously) of the scratchcards business.  Acquisition of Probability In May 2014, Gtech finalised the acquisition of 100% of Probability, a UK company listed on London Stock Exchange, and leader in games for tablets and smartphones, for a total of approximately GBP 18 million.  Sale of the Lis Ticket business division In July 2014, Gtech finalised the sale to TicketOne of the Lis Ticket business division involved in sports and entertainment ticketing for a total of about EUR 14 million.  Acquisition of International Game Technology As noted in the description of the Group's activities, in 2014 Gtech signed a number of agreements to acquire International Game Technology ("IGT"), a global leader in the casino and gaming entertainment sector with registered office in Las Vegas, Nevada (USA) by merging the two companies into a newly established holding company with registered office in the UK ("Holdco") listed on the New York Stock Exchange - NYSE. To be specific, the merger agreements finalised on 7 April 2015 (after the necessary authorisation were obtained) called for:  an exchange of 1 Gtech share for every 1 Holdco share;  the assignment of a payment of USD 18.02/share (initially set at USD 18.25/share) for each IGT share, including USD 14.34 in cash (80%) and USD 3.68/share in kind (20%) for a total payment of about USD 4.6 billion for the transaction. Concurrent with the completion of the merger, Holdco has been renamed "IGT Plc", which is held by De Agostini Group with a majority stake of 52.09% (including 47.02% held directly by De Agostini S.p.A. and 5.07% held by DeA Partecipazioni). In addition, with this merger, the right of Gtech shareholders to withdraw went into effect for 19,796,852 shares of the company representing about 11% of its share capital (at a price of EUR 19.174/share).
  • 14. Financial statements for the year ending 31 December 2014 25 FINANCE  Sale of the shareholding in Soprarno SGR In May 2014, DeA Capital completed the sale of the shareholding in Soprarno SGR for a total price of EUR 1.3 million, in line with the carrying value at 31 December 2013.  Acquisition of a further shareholding in Innovation Real Estate DeA Capital Real Estate, a wholly owned subsidiary of DeA Capital, acquired a 13.3% stake in Innovation Real Estate bringing its holding up to 96.99% of the related share capital, for a total of EUR 2.2 million.  Sale of interest in GDS On 1 October 2014, following approval by the competent authorities, the associate Santé SA (in which DeA Capital holds a 43% stake) and its subsidiary Santé Dévéloppement Europe SAS (SDE) sold their entire 83.43% stake in Générale de Santé ("GDS") to Ramsay Health Care and Crédit Agricole Assurances at a price of EUR 16.00 per share after cashing in the dividend of EUR 0.75 per share due to them. As a result of the transaction, Santé and SDE collected a total of approximately EUR 788 million (including the dividend), which was partlially used to fully repay all loans obtained to acquire GDS (EUR 407 million on the repayment date), and partlially for a distribution to shareholders (EUR 374 million net of the amount withheld to cover the guarantees issued for the benefit of the buyers). For DeA Capital the sale of GDS has generated total proceeds of approximately EUR 164 million.  2014 Oscar di Bilancio (Financial Statements Oscar) award On 1 December 2014, DeA Capital S.p.A. won the 2014 Oscar di Bilancio (Financial Statements Oscar) award, the prestigious recognition promoted by Ferpi (the Italian Public Relations Federation) awarded annually to companies which distinguish themselves for the transparency and quality of their corporate reporting, in the category "Listed and Unlisted Medium-sized and Small Banking and Financial Companies in relation to the financial statements as at 31 December 2013. DeA Capital continues to be committed to the transparency and quality of its financial reporting, and has set itself the goal of making constant refinements.  First closing of “IDeA Taste of Italy” private equity fund On 30 December 2014, the first closing of the IDeA Taste of Italy fund was completed. This is a closed-end mutual fund under Italian law managed by IDeA Capital Funds SGR for qualified investors. Focusing on the agricultural foods sector, its objective is to invest along the entire chain of the sector, from raw materials to processing, distribution and catering. The fund achieved commitments in the aforementioned first closing of about EUR 86 million, with a final goal to reach of EUR 200 million.
  • 15. Financial statements for the year ending 31 December 2014 26  Agreement for the sale of stakes in Migros On 31 December 2014, Moonlight Capital, a wholly-owned special purpose vehicle of Kenan Investments S.A. (in which DeA Capital holds a stake of about 17%) and the direct and indirect owner of an 80.5% stake in Migros, signed an agreement with Anadolu Endüstri Holding (“Anadolu”), a leading Turkish conglomerate, for the sale of 40.25% of Migros to the latter. This agreement also called for the exchange of put and call options between the parties, which can be exercised between 24 months and 30 months after the first sale, for a further 9.75% stake in Migros. The sale of the first 40.25% and any future sale of the subsequent 9.75% are projected using a base valuation for Migros of TRY 26 per share. For the portion relating to DeA Capital, at the TRY/EUR exchange rate on 31 December 2014, the sale of the first 40.25% equates to approximately EUR 110 million, while any future sale of the subsequent 9.75% equates to approximately EUR 26 million. The execution of the share transfer is subject to the necessary approvals of the relevant authorities (scheduled by the end of the first half of 2015).  Performance of the investment in Assicurazioni Generali During November 2014 DeA Partecipazioni sold n. 3,892,183 of Assicurazioni Generali shares, equal to 0.25% of the share capital of the latter, to B&D Finance for a total amount of EUR 64 million (with a consolidated capital gain of approximately EUR 19 million). At 31 December 2014, the Group owned 2.01% of the share capital of Assicurazioni Generali, i.e. 31,297,817 of its shares (35,190,000 shares compared with 31 December 2013). These shares have been valued in the consolidated financial statements at approximately EUR 532 million, based on the market price at 31 December 2014 (EUR 17.0 per share, compared with EUR 17.1 per share at 31 December 2013).
  • 16. Financial statements for the year ending 31 December 2014 27 HOLDING COMPANY activities  Sale of UniCredit CASHES securities In February 2014, De Agostini S.p.A. completed the sale of all its CASHES – Convertible And Subordinated Hybrid Equity-linked Securities – with an underlying of UniCredit shares (subscribed in February 2009), for a total cash-in of EUR 64 million (and generating a gain posted to the consolidated income statement of De Agostini Group for 2014 of around EUR 18 million).  Dividends received/paid In June 2014, the Company’s Shareholders’ Meeting approved the financial statements for the year ending 31 December 2013, which closed with a net profit of EUR 35.8 million. The shareholders approved the partial distribution as dividend of the amount of EUR 35.2 million. In 2014, in addition to the dividends received by the companies included in the holding company structure (EUR 0.6 million), the Company received dividends from subsidiaries totalling EUR 138.8 million, wholly from Gtech; of these, approximately EUR 69.4 million are attributable to the interim dividend approved on December 17 by the Board of Directors of Gtech - interim dividend of 0.75 euros / share - and paid in the month of January 2015.  Refinancing of holding company activities On 29 October 2014 De Agostini S.p.A. signed new credit lines up to EUR 600 million with a syndicate of banks consisting of Intesa Sanpaolo (EUR 250 million), UniCredit (EUR 250 million) and Mediobanca (EUR 100 million) with an average term of over 4.5 years (amortising loans with repayments of EUR 480 million in the fifth year). Utilisation under these new lines totalled EUR 500 million to repay previous existing lines of the same amount made to De Agostini S.p.A. (EUR 150 million) and DeA Partecipazioni (EUR 350 million). The latter obtained the funds needed for the repayment through an intercompany loan from the Parent Company. The remaining EUR 100 million can be used by April 2016.
  • 17. Financial statements for the year ending 31 December 2014 28 3. Analysis of the Group’s operating performance and financial position 3.1 Preliminary remarks  Legislative framework for the preparation of the financial statements The consolidated financial statements for the year ending 31 December 2014 were prepared on the basis of the international accounting standards (IAS/IFRS) approved by the European Union. The terms IAS and IFRS refer to all International Accounting Standards (IAS), International Financial Reporting Standards (IFRS) and associated interpretations of the International Financial Reporting Interpretations Committee (IFRIC) or its predecessor, the Standing Interpretations Committee (SIC). The consolidated financial statements for the year ending 31 December 2014 were prepared under the same accounting standards as those used in the previous year, with the sole exceptions resulting from the application, effective 1 January 2014, of the following:  IFRS 11 (Joint arrangements), which governs the reporting of all interests in joint ventures breaking them down into:  joint operations, whereby the parties to the arrangement acquire rights to certain assets and assume obligations for certain liabilities;  joint ventures, whereby the parties have rights to the net value of a set of jointly controlled assets and liabilities. In the first case, individual assets, liabilities, revenues and costs are recognised on the basis of the relevant IAS/IFRS; in the second case, the pro-rata interest in the joint venture recorded using the equity method is recognised  IFRS 10 (Consolidated financial statements), which defines the new notion of control based on the concurrent presence of essentially three elements:  power over the investee company;  exposure to or the right to variable returns from its involvement with the investee company;  the ability to use that power over the investee to affect the amount of the returns due. The impact of IFRS 11 and IFRS 10 on the Group's consolidated financial statements is not significant with respect to key operating and financial figures, such as net profit/(loss) and shareholders' equity, but instead changed the consolidation method of the two main investments in joint ventures held, i.e., M-Dis Distribuzione Media and Grupo Planeta-De Agostini (previously carried out using the proportional method), and the new consolidation of two real estate funds, AVA and IDeA Fimit Sviluppo. Below are the "Reclassified consolidated financial statements" included in the financial statements for the year ending 31 December 2013. These statements were revised based on the provisions of IFRS 11 and IFRS 10 and on the basis of IFRS 5 following the sale of the Cartography business division in 2014, in order to make them comparable to these same statements for 2014 as indicated in this Report on Operations:
  • 18. Financial statements for the year ending 31 December 2014 29 EUR million Net revenues 4,906 (462) 2 4,446 Operating costs EBITDA 1,155 (7) (3) 1,145 Deprec., amort. and other non-cash items (525) - - (525) Income (loss) from equity investments 7 3 (2) 8 ORDINARY EBIT 637 (4) (5) 628 Financial income/(charges) (195) - (12) (207) ORDINARY EBT (A) 442 (4) (17) 421 Impairment (97) - - (97) Other non-recurring income/(charges) (101) - 16 (85) NO - ORDINARY EBT (B) (198) - 16 (182) EBT (A+B) 244 (4) (1) 239 Taxes (151) 2 - (149) Net profit (loss) from assets sold/discontinued opera (2) 2 (1) (1) Consolidated net profit (loss) 91 - (2) 89 Of which: Net profit (loss) pertaining to minorities 67 - (2) 65 Net profit (loss) pertaining to group 24 - - 24 Net Financial Position (4,011) 171 (9) (3,849) Of which: Games and Services (2,478) - (3) (2,481) 2013 "As Restated" 2013 "As Reported" IFRS 11 Effect IFRS 10 Effect / Other 2013 "As Restated" 2013 "As Reported" IFRS 11 Effect IFRS 10 Effect / Other The provisions of Legislative Decree 38/2005 and of the IAS/IFRS constitute the company’s legislative framework for preparing the Consolidated Financial Statements. In accordance with the provisions of Legislative Decree 38/2005, the company prepares its financial statements pursuant to art. 2423 et seq. of the Italian Civil Code.
  • 19. Financial statements for the year ending 31 December 2014 30  Restated Consolidated Financial Statements The Consolidated Financial Statements and explanatory notes in this document have been supplemented with a number of management indicators that enable the management to provide information on the performance of the Group’s businesses in line with analysis and audit parameters. For this reason, a set of restated Consolidated Financial Statements were prepared showing performance indicators more commonly used by the management than those shown in the above-mentioned Consolidated Financial Statements and explanatory notes. These are:  Net revenues. This represents the turnover of individual businesses and the Group as a whole, calculated as the income from sales and services.  EBITDA. This represents operating profit/loss before tax, financial income/charges, one-off items, profits/losses from shareholdings valued at equity, depreciation and amortisation, and other non-cash items (e.g. impairment losses and gains/losses on the sale of tangible and intangible assets). Given the nature of the business carried out by the companies in Finance business and the holding company structure, the net financial income relating to these activities is included in EBITDA.  ORDINARY EBIT. This is calculated using the EBITDA figure plus the profits/losses from shareholdings valued at equity, depreciation and amortisation and other non-cash items.  ORDINARY EBT. This is calculated by subtracting the figure for net financial income from ORDINARY EBIT. This figure – like ORDINARY EBIT – does not include the effects of any impairment or other non-recurring items included in the NON-ORDINARY EBT figure, which is shown separately.  NET FINANCIAL POSITION (NFP). This represents the difference between: a) cash and cash equivalents, as well as loans, receivables and other financial assets available for sale or recorded at fair value in the income statement; and b) financial liabilities. Net revenues, EBITDA, ORDINARY EBIT/EBT and net financial position are alternative performance indicators not determined according to IAS/IFRS; they are reported to help show performance trends, as well as to provide useful information on the Group’s ability to manage debt, and to assist in estimating the value of group assets. The restated Consolidated Financial Statements show the same net profit and shareholders’ equity as the Consolidated Financial Statements and are used below to comment on both the consolidated results and those of the individual business areas.
  • 20. Financial statements for the year ending 31 December 2014 31 3.2 Restated Consolidated Financial Statements Below is a summary of the Group’s key financial and operating performance indicators, based on the restated Consolidated Financial Statements, prepared in accordance with the above comments. Figures in EUR million Absolute % Net revenues 4,362 4,446 (84) -2% EBITDA 1,122 1,145 (23) -2% Deprec., amort. and other non-cash items (535) (525) (10) ncome (loss) from equity investments (3) 8 (11) ORDINARY EBIT 584 628 (44) -7% Financial income/(charges) (218) (207) (11) ORDINARY EBT (A) 366 421 (55) -13% mpairment (76) (97) 21 Other non-recurring income/(charges) (200) (85) (115) NO - ORDINARY EBT (B) (276) (182) (94) -52% EBT (A+B) 90 239 (149) -62% Taxes (179) (149) (30) n.a. Net profit (loss) from assets sold/discontinued operations (1) (1) - n.a. Consolidated net profit (loss) (90) 89 (179) n.a. Of which: Net profit (loss) pertaining to minorities 12 65 (53) n.a Net profit (loss) pertaining to group (102) 24 (126) n.a. Absolute % Net Financial Position (3,548) (3,849) 301 8% Of which: Games and Services (2,564) (2,481) (83) -3% 2014 2013 Change 12.31.2014 12.31.2013 Change
  • 21. Financial statements for the year ending 31 December 2014 32 3.3 Operating performance  Net revenues Consolidated net revenues in 2014 were EUR 4,362 million, a decrease of EUR 84 million on 2013 (EUR 4,446 million). A breakdown of these figures is shown in the table below. Net Revenues Figures in EUR million 2014 % 2013 % Change Publishing 781 17.9% 855 19.2% (74) Media & Communication 432 9.9% 443 10.0% (11) Games & Services 3,070 70.4% 3,063 68.9% 7 Finance 83 1.9% 93 2.1% (10) Holding Companies / Eliminations (4) -0.1% (8) -0.2% 4 Consolidated Total 4,362 100.0% 4,446 100.0% (84) Publishing business posted net revenues of EUR 781 million, a fall of EUR 74 million (-8.7%) compared with 2013, which mainly affected the Partworks (down EUR 38 million) and Direct Marketing (down EUR 42 million) business areas. Media & Communication business generated revenues of EUR 432 thousand, a fall of EUR 11 thousand compared with 2013 (-2.5%), reflecting mainly the smaller contribution of Zodiak Media. Gaming & Services business posted net revenues of EUR 3,070 million, up slightly from 2013 (EUR 3,063 million), mainly due to Italy (up EUR 8 million) and the International business (up EUR 4 million), net of the amount related to the Americas (down EUR -5 million). Net revenues for Finance business fell by EUR 10 million versus 2013, totalling EUR 83 million for the year. This was mainly due to fees from Alternative Asset Management.  EBITDA The Group recorded EBITDA of EUR 1,122 million for the year ending 31 December 2014, a decrease from the figure for the previous year. This breaks down as follows: EBITDA Figures in EUR million 2014 % 2013 % Change Publishing 5 0.4% 46 4.0% (41) Media & Communication 35 3.1% 34 3.0% 1 Games & Services 1,078 96.1% 1,067 93.2% 11 Finance 32 2.9% 44 3.8% (12) Holding Companies / Eliminations (28) -2.5% (46) -4.0% 18 Consolidated Total 1,122 100% 1,145 100% (23)
  • 22. Financial statements for the year ending 31 December 2014 33 Publishing business posted EBITDA of EUR 5 million, down EUR 41 million from 2013, mainly owing to lower revenues of the Continuity businesses and the crisis in Russia and Ukraine, which were only in part offset by savings made on overheads following the implementation of the restructuring plans. EBITDA for Media & Communication business was EUR 35 million, which was largely in line with 2013. Gaming & Services business posted EBITDA of EUR 1,078 million, an increase of EUR 11 million on 2013 (+1.0%), mainly due to the positive performance of Italy and International, which offset the less impressive performance in the Americas. EBITDA for Finance business was EUR 32 million and reflected both the contribution of DeA Capital’s activities and the receipt of a dividend of EUR 16 million from Assicurazioni Generali (EUR 7 million in 2013); the EUR -12 million overall decrease on 2013 mainly reflects the lower contribution from Alternative Asset Management. The EBITDA of Holding company activities/inter-business eliminations was EUR -28 million, which was a slight improvement over 2013 (EUR 18 million) due to the capital gain realized on the sale of 0.25% of Assicurazioni Generali (EUR 19 million).  ORDINARY EBIT The group’s ordinary EBIT for the year ending December 31, 2014 was EUR 584 million, after taking into account depreciation/amortisation and other ordinary non-cash items totalling EUR 535 million and losses from investments valued at equity totalling EUR 3 million. The deterioration in ordinary EBIT 2014 compared to the figure for 2013 included a figure of EUR -44 million for the decrease in EBITDA, EUR -23 million for higher depreciation and amortisation, and other non-monetary items totalling EUR -10 million and lower profits from investments valued at equity totalling EUR -11 million. ORDINARY EBIT Figures in EUR million 2014 2013 Change EBITDA 1,122 1,145 (23) Deprec., amort. and other non-cash items (535) (525) (10) Income (loss) from equity investments (3) 8 (11) ORDINARY EBIT 584 628 (44) Amortisation, depreciation and other ordinary non-cash items break down as follows:  EUR 278 million relating to amortisation and write-downs of intangible assets (EUR 265 million in 2013);  EUR 257 million relating to depreciation and write-downs of tangible assets (EUR 260 million in 2013). In 2014, the Group reported a loss of EUR 3 million from shareholdings valued at equity, compared with a profit of EUR 8 million in 2013; in particular, the 2013 figure included the
  • 23. Financial statements for the year ending 31 December 2014 34 profit related to Santè, the parent company of GDS, which has been sold in 2014 for EUR 7 million.  Net profit (loss) The table below shows the relationship between ORDINARY EBIT and consolidated net loss: Net profit (loss) EUR million 2014 2013 Change ORDINARY EBIT 584 628 (44) Financial income/(charges) (218) (207) (11) ORDINARY EBT (A) 366 421 (55) Other impairment (76) (97) 21 Other non-recurring income/(charges) (200) (85) (115) NO - ORDINARY EBT (B) (276) (182) (94) EBT (A+B) 90 239 (149) Taxes (179) (149) (30) Net profit (loss) from assets sold/discontinued operations (1) (1) - Consolidated net profit (loss) (90) 89 (179) Of which: Net profit (loss) pertaining to minorities 12 65 (53) Net profit (loss) pertaining to group (102) 24 (126) ORDINARY EBT for 2014 was a positive figure of EUR 366 million, down by -13% on the 2013 figure, after taking into account a net financial loss of EUR -218 million (EUR -207 million in 2013). A breakdown of the net financial income figure for 2014 (compared with the corresponding values for 2013) is as follows:  EUR -9 million relating to Publishing business (EUR -9 million in 2013);  EUR -19 million relating to Media & Communication business (EUR -18 million in 2013);  EUR -166 million relating to Gaming & Services business (EUR -162 million in 2013);  EUR -24 million relating to holding company activities (EUR -18 million in 2013) Non-ordinary charges of EUR 276 million in 2014 (versus EUR 182 million in 2013) were included in the NON-ORDINARY EBT figure. Note in particular the following items recorded in 2014:  Impairment of EUR 76 million, including EUR 65 million relating to Media & Communication, EUR 11 million relating to Finance;  Other non-recurring income/(charges) totalling EUR -200 million including EUR -147 million for costs connected with the IGT acquisition (including financial components related to the acquisition) and EUR -39 million tied to the sale of Générale de Santé (net of the risk provision recorded at 31 December 2013).
  • 24. Financial statements for the year ending 31 December 2014 35 The tax burden for 2014 was EUR 179 million (compared with EUR 149 million in 2013) due to one-off items related to the reorganisation of the Italian operations of Gaming & Services and non-deductible acquisition costs related to the IGT acquisition. The net loss from discontinued operations was EUR 1 million in 2014 (in line with 2013) reflecting the contribution of the Cartography business division and the Centre Européen de Formation (CEF) in Italy. In 2013 the net loss from discontinued operations included the contribution of UTET and UTET Scienze Mediche. To summarise, the consolidated net loss for 2014 was EUR 90 million, compared with a profit of EUR 89 million in 2013. In 2014, the net loss attributable to minorities was EUR 12 million (compared with a profit of EUR 65 million in 2013), and mainly reflected:  EUR -13 million relating to the pro-rata portion of the net profit/(loss) of Zodiak Media Group, previously recorded at the consolidated level of De Agostini S.p.A. Group (EUR - 9 million in 2013);  EUR +48 million relating to the pro-rata portion of the net profit/(loss) of Gtech Group, including the portion relating to Lotterie Nazionali, the holder of the scratch cards concession, previously recorded at the consolidated level of De Agostini S.p.A. Group (EUR +102 million in 2013);  EUR -22 million related to the pro-rata share of the net profit/(loss) of DeA Capital Group, IDeA Opportunity Fund I and AVA that were previously recorded at the consolidated level of De Agostini S.p.A. Group (EUR -28 million in 2013). The net loss attributable to the Group came in at approximately EUR -102 million compared with EUR +24 million in the previous year.
  • 25. Financial statements for the year ending 31 December 2014 36 3.4 Statement of Performance – IAS 1 A summary version of the Comprehensive Income or Statement of Performance - IAS 1, is shown below. It reports the net income for the year, summarising the portion posted to the income statement and directly to shareholders' equity: Statement of Performance - IAS 1 Figures in EUR million 2014 2013 Net Profit/(Loss) (A) (90) 89 Items that could be subsequently reclassified within the profit (loss) for the period Profit / (loss) on available-for-sale financial assets 87 55 Profit / (loss) on traslating foreign operations 370 (166) Profit / (loss) on cash flow hedge 8 7 Profit / (loss) on investments valued at equity 1 9 Tax effect (22) (2) Items that could be subsequently reclassified within the profit (loss) for the period Profit/(loss) on remeasurement of defined benefit plans (4) (4) Tax effect Other comprehensive income/(loss) (B) 440 (101) Total comprehensive income/(loss) (A+B) 350 (12) Of which: Net profit (loss) pertaining to minorities 193 (12) Net profit (loss) pertaining to group 157 - Profits/(losses) relating to available-for-sale financial assets posted a positive balance of EUR 87 million in 2014 (EUR 55 million in 2013) due in particular to the appreciation in the value of Kenan Investments of EUR 77 million (EUR -91 million in 2013) and Banijai of EUR 17 million, partially offset by the recycling to profit or loss of the fair value reserve relating to the shares of Assicurazioni Generali sold during 2014 (EUR -21 million). The 2013 item included a positive fair value adjustment of EUR +118 million to the investment in Assicurazioni Generali. Profits/(losses) on exchange rate differences largely reflected the effects of the translation into euro of the financial statements of the Group’s companies that are prepared in different currencies, particularly relating to Games & Services business (EUR +369 million in 2014 compared with - EUR 152 million in 2013) mainly due to the appreciation of the US dollar against the euro. The item "Tax effect of components that may be subsequently restated under Profit/(loss) for the period" is mainly related to the tax effect related to profits/(losses) from exchange rate differences, and especially in Gaming & Services business (EUR -14 million in 2014 compared with EUR +5 million in 2013). To summarise, comprehensive income totalled EUR 350 million in 2014 compared with a figure of EUR -12 million in 2013; the portion attributable to the Group totalled EUR 157 million compared with a balance in 2013.
  • 26. Financial statements for the year ending 31 December 2014 37 3.5 Statement of financial position The table below shows a summary of the Group’s key figures from the statement of financial position: Absolute EUR million change Goodwill 3,989 3,746 243 Other intangible assets 1,283 1,407 (124) Tangible assets 1,038 1,033 5 Investments 1,658 1,961 (303) Cash and cash equivalents 462 729 (267) Other net assets (274) (136) (138) TOTAL 8,156 8,740 (584) for hedging: Financial liabilities 4,083 4,681 (598) Shareholders' equity 4,073 4,059 14 31.12.2014 31.12.2013 Goodwill At 31 December 2014, goodwill was EUR 3,989 million (EUR 3,746 million at 31 December 2013), broken down as follows:  EUR 37 million attributable to Publishing business (unchanged from 31 December 2013), of which EUR 34 million relates to School Texts;  EUR 373 million relating to Media & Communication business (EUR 437 million at 31 December 2013), attributable to the acquisitions made in the content production area. The change in comparison to 31 December 2013 reflects, in particular, impairment totalling EUR 65 million applied during the year on the goodwill of Zodiak Media;  EUR 3,422 million related to Gaming & Services business (EUR 3,115 million at 31 December 2013); the change in comparison to 31 December 2013 (EUR +307 million) was mainly due to translation differences on goodwill denominated in foreign currencies (EUR +301 million) and the 2014 acquisition of Probability (EUR +10 million) and the sale of the Lis Ticket business division (EUR -8 million);  EUR 157 million relating to Finance business (largely unchanged from 31 December 2013), mainly in respect of IDeA FIMIT SGR/DeA Capital Real Estate (EUR 124 million at 31 December 2014, unchanged compared with 31 December 2013). Other intangible assets Other intangible assets include intellectual property rights, concessions, licences and trademarks as well as other intangibles. At 31 December 2014, Other intangible assets totalled EUR 1,283 million (EUR 1,407 million at 31 December 2013), comprising:  EUR 43 million relating to Publishing business (EUR 44 million at 31 December 2013), mainly in respect of publishing investments relating to School texts, intellectual property rights and basic software and applications;
  • 27. Financial statements for the year ending 31 December 2014 38  EUR 24 million relating to Media & Communication business (EUR 27 million at 31 December 2013), the main component of which was rights and formats;  EUR 1,152 million relating to Gaming & Services business (EUR 1,257 million at 31 December 2013), primarily for customer agreements, concessions, licences and capitalised software;  EUR 63 million relating to Finance business (EUR 79 million at 31 December 2013), chiefly due to customer contracts and performance fees for asset management, project management and agency activities relating to DeA Capital. The item takes into account amortisation and impairment totalling EUR 278 million (EUR 265 million in 2013); this item also reflects an increase due to the exchange rate effect of EUR +66 million (EUR -24 million in 2013). Tangible assets At 31 December 2014, tangible assets totalled EUR 1,038 million (EUR 1,033 million at 31 December 2013), which breaks down as follows:  real estate totalling EUR 96 million (EUR 93 million at 31 December 2013);  other tangible assets of EUR 942 million (EUR 940 million at 31 December 2013). Real estate (EUR 96 million) includes:  EUR 22 million relating to Publishing business (EUR 24 million at 31 December 2013);  EUR 3 million relating to Media & Communication business (EUR 4 million at 31 December 2013);  EUR 68 million relating to Gaming & Services business (EUR 62 million at 31 December 2013);  EUR 3 million relating to Finance business (EUR 3 million at 31 December 2013). Amortisation and impairment of EUR 14 million were charged for the period (EUR 11 million in 2013). Other tangible assets totalled EUR 942 million, including:  EUR 8 million relating to Publishing business (EUR 9 million at 31 December 2013);  EUR 6 million relating to Media & Communication business (EUR 7 million at 31 December 2013);  EUR 920 million relating to Gaming & Services business (EUR 914 million at 31 December 2013), mainly for terminals and systems;  EUR 1 million relating to Finance business (EUR 2 million at 31 December 2013);  EUR 7 million relating to holding company activities (EUR 8 million at 31 December 2013). The item reflects depreciation, impairment and reversals during the period totalling EUR 242 million (EUR 248 million in 2013). Investments At 31 December 2014, the Group’s investments totalled EUR 1,658 million, a decrease of EUR 303 million on the figure of EUR 1,961 million at the end of 2013. The table below shows a breakdown of this item:
  • 28. Financial statements for the year ending 31 December 2014 39 Investments EUR million 31.12.2014 31.12.2013 Change Investment properties 87 95 (8) Equity Investments 366 619 (253) Loans and receivables 26 56 (30) Available-for-sale financial assets 1,115 1,125 (10) Financial assets at fair value through profit or loss 64 66 (2) Total group 1,658 1,961 (303) At 31 December 2014 real estate investments totalled EUR 87 million (EUR 95 million at 31 December 2013) of which EUR 61 million (EUR 68 million at 31 December 2013) was due to AVA fund managed by IDeA Capital Funds, EUR 10 million (unchanged from 31 December 2013) was due to De Agostini S.p.A., and EUR 16 million (also unchanged from 31 December 2013) was due to Nova Immobiliare. Depreciation and write-downs of EUR 1 million were charged for the period (in line with 2013). Investments valued at equity chiefly include EUR 306 million for Grupo Planeta-De Agostini (EUR 331 million at 31 December 2013), EUR 11 million for Sigla Luxembourg (EUR 12 million at 31 December 2013); at 31 December 2013 the balance also included EUR 221 million for Sigla included in the scope of consolidation of DeA Capital and sold in 2014. Loans and receivables totalled EUR 26 million, a decrease of EUR 30 million compared with the balance of EUR 56 million at 31 December 2013 mainly due to the repayment received in relation to the “quasi-equity“ loan made to the subsidiary Santé (EUR 29 million). At 31 December 2014, Available-for-sale financial assets totalled EUR 1,115 million, compared with EUR 1,125 million at 31 December 2013. These mainly include equity investments not held for trading and units in mutual investment funds. A breakdown of “Available-for-sale financial assets” by business area is shown in the table below. Available-for-sale financial assets EUR million 31.12.2014 % 31.12.2013 % Change Publishing 2 0.2% 1 0.1% 1 Media & Communication 2 0.2% 2 0.2% - Games and Services 15 1.3% 11 1.0% 4 Finance 961 86.2% 953 84.7% 8 Holding Companies 135 12.1% 158 14.0% (23) Total group 1,115 100% 1,125 100% (10) The largest component relates to the investment (included under financial assets) in Assicurazioni Generali shares, recorded at a value of EUR 532 million (EUR 602 million at 31 December 2013), which was the closing price on 31 December 2014 (EUR 17.0 per share). “Available-for-sale financial assets” also includes investments in funds (EUR 180 million, of which EUR 177 million is held through Finance business and EUR 3 million through holding company activities, compared with EUR 174 million at 31 December 2013) and other equity investments/assets (EUR 403 million, of which EUR 252 million relates to Finance business, and in particular, the equity investment in Kenan Investments/Migros, and EUR 132 million to holding company activities, compared with EUR 349 million at 31 December 2013).
  • 29. Financial statements for the year ending 31 December 2014 40 The EUR 54 million increase in other equity investments/assets includes EUR +77 million relating to Kenan Investments (EUR 209 million at 31 December 2014, compared with EUR 132 million at 31 December 2013, due entirely to the increase in fair value). At 31 December 2014, “Financial assets at fair value through profit and loss” totalled EUR 64 million (EUR 66 million at 31 December 2013); these break down into EUR 7 million relating to Publishing activities (zero at 31 December 2013), EUR 2 million relating to Gaming & Services business (EUR 12 million at 31 December 2013), EUR 40 million relating to Finance business (EUR 36 million at 31 December 2013), and EUR 15 million relating to holding company activities (EUR 18 million at 31 December 2013). Other net current assets At 31 December 2014, other net current assets totalled EUR -274 million (EUR -136 million at 31 December 2013). The table below shows the items included in this balance, compared with the corresponding values at the end of 2013. Other net assets EUR million 31.12.2014 31.12.2013 Change Trade receivables/payables: net balance (232) (56) (176) Net balance of non-current assets/liabilities or of discontinued operations held for sale - 1 (1) Net balance of tax assets/liabilities (233) (150) (83) Net balance of other assets/liabilities 343 247 96 Provisions (152) (178) 26 Total group (274) (136) (138) The balance of trade receivables and payables comprises trade receivables of EUR 1,014 million (EUR 1,154 million at 31 December 2013) and trade payables of EUR 1,246 million (EUR 1,210 million at 31 December 2013). Since the investment in Soprarno SGR (EUR 1 million at 31 December 2013) was sold in 2014, "Held-for-sale assets/liabilities" had a zero balance. The balance of "Tax assets and liabilities” includes deferred tax assets of EUR 82 million (EUR 71 million at 31 December 2013) and deferred tax liabilities of EUR 208 million (EUR 166 million at 31 December 2013). The net balance of “Other assets/liabilities” includes other assets totalling EUR 788 million (EUR 678 million at 31 December 2013), of which EUR 354 million relates to inventories (EUR 333 million at 31 December 2013), and other liabilities totalling EUR 445 million (EUR 431 million at 31 December 2013). At 31 December 2014, “Provisions” of EUR 152 million (EUR 178 million at 31 December 2013) mainly related to employment severance indemnity (EUR 22 million; EUR 19 million at 31 December 2013), other employee benefits (EUR 61 million; EUR 54 million at 31 December 2013), the agent severance fund (EUR 5 million; EUR 5 million at 31 December 2013) and provisions for risks and charges, including those for investee companies (EUR 62 million; EUR 97 million at 31 December 2013).
  • 30. Financial statements for the year ending 31 December 2014 41 Shareholders' equity At 31 December 2014, group and minorities' consolidated shareholders’ equity totalled EUR 4,073 million (versus EUR 4,059 million at the end of 2013); group shareholders’ equity was EUR 2,534 million (EUR 2,427 million at 31 December 2013), while minority interests accounted for EUR 1,539 million (EUR 1,632 million at the end of 2013). The increase of EUR 107 million in the Group’s shareholders’ equity in 2014 was due to:  a net loss of EUR 102 million for 2014;  distribution of dividends totalling EUR 35 million;  the impact of the fair value adjustment of assets held for sale, totalling EUR +46 million, particularly in relation to the appreciation in the value of Kenan Investments (fully-diluted, pro-rata value of EUR +50 million), and Banijai (fully-diluted, pro-rata value of EUR +17 million), partially offset by the recycling to profit or loss of the fair value reserve relating to the shares of Assicurazioni Generali sold during 2014 (EUR -21 million);  the impact of the exchange rate differences arising from the conversion of the financial statements of the Group's foreign subsidiaries that have a functional currency other than the euro (totalling EUR +211 million, of which EUR +210 million relates to Gaming and Services business);  other changes of EUR -13 million. Shareholders' equity relating to minority interests fell by a total of EUR 93 million due to:  net result of EUR +12 million for 2014;  dividend payouts totalling EUR 142 million, almost entirely attributable to the minority shareholders of Gtech;  the impact of the exchange rate differences arising from the conversion of the financial statements of the Group’s foreign subsidiaries that have a functional currency other than the euro, totalling EUR +145 million, and especially related to Gaming & Services business;  capital transactions related to Gaming & Services business totalling EUR -38 million mainly relating to the repayment to the minority shareholders of Lotterie Nazionali, SW Holding and Consorzio Lotterie Nazionali of EUR 55 million that was previously paid for the scratchcard concession, and the capital increase subscribed by minority shareholders as a part of the management companies of the New Jersey Lotteries totalling EUR 17 million;  purchase of minority interests in subsidiaries totalling EUR 76 million, including EUR 64 million related to the purchase in March 2014, by exercising the call option, of the entire stake held by UniCredit in SW Holding, the holder of the scratchcards concession;  other changes totalling EUR +6 million.
  • 31. Financial statements for the year ending 31 December 2014 42 Net Financial Position (NFP) The table below shows the Group’s net financial position broken down by business area: Net Financial Position EUR million 31.12.2014 31.12.2013 Change Publishing (110) (120) 10 Media & Communication (236) (220) (16) Games and Services (2,564) (2,481) (83) Finance 48 (132) 180 Holding Companies (686) (896) 210 Total group (3,548) (3,849) 301 For more details on the changes in the net financial position relating to Business Activities - Publishing, Media & Communication and Gaming & Services businesses - please see the section of the Report on Operations entitled “Primary and secondary reporting formats”. The NFP for Finance business reflects the figures recorded by DeA Capital, which had a net financial position of of EUR +58 million at 31 December 2014 (EUR -127 million at 31 December 2013), as well as those relating to AVA fund, which was consolidated on a line-by- line basis, taking into account the percentage interest held (EUR -10 million at 31 December 2014 versus EUR -5 million at 31 December 2013). The change in the net financial position of Finance business in 2014 was mainly due to the receipt of proceeds of EUR +164 million from the sale of Générale de Santé, liquidity of EUR +11 million generated by investments in private equity funds of DeA Capital and operational cash flows generated by the asset management platforms. Holding company activities recorded a net financial position of EUR - 686 million at 31 December 2014, including payables to banks of EUR -832 million, De Agostini S.p.A. convertible bond issue (EUR -80 million), cash and cash equivalents of EUR +67 million and other assets and liabilities of EUR +159 million (including intercompany loans and the receivable accrued for the interim dividend approved by Gtech in December 2014 and paid by it in January 2015). At 31 December 2014, there was an improvement of EUR +210 million in net financial position over the end of 2013 balance, mainly due to dividends from investee companies totalling EUR +170 million (including Gtech's interim dividend), dividends paid/purchases of own shares of EUR -35 million, proceeds from the sale of the UniCredit CASHES totalling EUR +64 million, proceeds from the sale of 0.25% of Assicurazioni Generali totalling EUR +64 million and structure costs and financial/other charges of EUR -53 million. * * * As previously indicated, the net financial position is calculated - using the financial statements - as the difference between: a) cash and cash equivalents, as well as loans, receivables and certain financial assets available for sale or recorded at fair value through profit or loss; and b) financial liabilities.
  • 32. Financial statements for the year ending 31 December 2014 43 The reconciliation statement below shows the key figures in the consolidated statement of financial position at December 31, 2014 as compared to the amounts included in net financial position. EUR million Carrying amount at 12.31.2014 of which in Net Financial Position INVESTMENTS - NON-CURRENT ASSETS 1,152 20 Available-for-sale financial assets 1,110 18 Financial assets at fair value through profit or loss 42 2 LOANS AND RECEIVABLES - NON-CURRENT ASSETS 12 12 INVESTMENTS - CURRENT ASSETS 27 27 Available-for-sale financial assets 5 5 Financial assets at fair value through profit or loss 22 22 LOANS AND RECEIVABLES - CURRENT ASSETS 14 14 CASH AND CASH EQUIVALENTS 462 462 NON-CURRENT FINANCIAL LIABILITIES (2,798) (2,798) CURRENT FINANCIAL LIABILITIES (1,285) (1,285) Net Financial Position - Group (excluding Joint Venture) (2,416) (3,548) The differences, related in particular to “Available-for-sale financial assets”, broadly relate to the classification under this item of assets that do not meet the requirements for being included in the calculation of net financial position, according to the Group’s accounting principles; specifically, at 31 December 2014, and at 31 December 2013, the most significant differences related to the value of the investments in Assicurazioni Generali shares, funds and other financial investments. For information on the use of financial instruments, pursuant to art. 2428, para. 2, point 6-bis of the Italian Civil Code, please refer to the notes to the consolidated financial statements for the year ending 31 December 2014.
  • 33. Financial statements for the year ending 31 December 2014 44 3.6 Main risks and uncertainties to which the parent company and consolidated Group companies are exposed As mentioned in the first section of the Report on Operations, the Group operates in a number of industrial and financial sectors and is organised accordingly; each business activity comes under a sub-holding company, which is responsible for the co-ordination, management and control of all the companies that pertain to it. Alongside the above-mentioned activities, holding company activities are carried out by companies in the holding company structure which include the Parent Company and other directly- and indirectly-controlled financial companies. Given its structure and the international arena in which it operates, the Group is exposed to a number of risks and uncertainties, which can be categorised as systemic risks or specific risks. Such risks may significantly affect the operating performance and financial position of the Parent Company and the other companies included in the Group's consolidated financial statements. Systemic risks relate to trends in macro-economic variables in the different countries in which the Group operates, and at global level, including GDP, interest rates, inflation, exchange rates and unemployment, as well as the state of the financial markets – which particularly affects access to capital and return on investment (especially financial investment). Specific risks can be analysed according to individual business areas, and include:  for Publishing business, risks connected with the demand for published products (i.e. partworks, school texts and others), the costs of producing these products, legislative changes and the efficiency and effectiveness of logistics systems;  for Media & Communication business, risks associated with the performance of TV broadcasters (in turn affected by trends in advertising revenues) and the creative capacity required to launch new formats on the market;  for Gaming & Services business, risks connected with the renewal of existing contracts or licences, the innovation required to launch new “gaming” and “services” products, production capacity for new gaming/lottery management systems, the possibility of a technological malfunction (system and/or terminals) that prevents collection of receipts and gives rise to compensation requests, and fixed-odds betting systems activity, where the operator bears the bookmaking risk;  for Finance business, risks connected with private equity activity (carried out by DeA Capital) and alternative asset management activity (undertaken by IDeA FIMIT SGR, IDeA Capital Funds SGR and IRE/IRE Advisory), and the performance of the investments made. Some risks are common to each business, even though the Group is highly diversified, and are associated with the availability of management, relationships with employees and suppliers, and integration policies. The specific risks relating to the holding company activities – in addition to those connected with the management of the operations in the above-mentioned business sectors and finance, and the associated effects on cash flow or dividends – include exposure to specific sectors or investments and the difficulties of identifying opportunities for investments or disposals.
  • 34. Financial statements for the year ending 31 December 2014 45 Although we stress the significance of the above-mentioned risks for the Group’s operating performance and financial position, we have put in place appropriate measures to limit the impact of any serious negative developments. With regard to systemic risks, in early 2000 the Group started to diversify its investments – both by sector and by geographical area. It now has a widely diversified portfolio of activities combining resilient businesses (such as lotteries and asset management) with others that have good long-term growth prospects (such as media and content production), all with a strong international footprint. With regard to specific risks, the Group believes it has adopted a modern system of governance for its businesses making it possible to effectively manage the complexity and achievement of the strategic goals of the sub-holding companies and the Group. Specifically, this governance system has set out the procedures for managing relationships between the Parent Company and sub-holding companies, and the responsibilities of the latter concerning the co-ordination, management and control of all operating companies under their responsibility.