Download to read offline


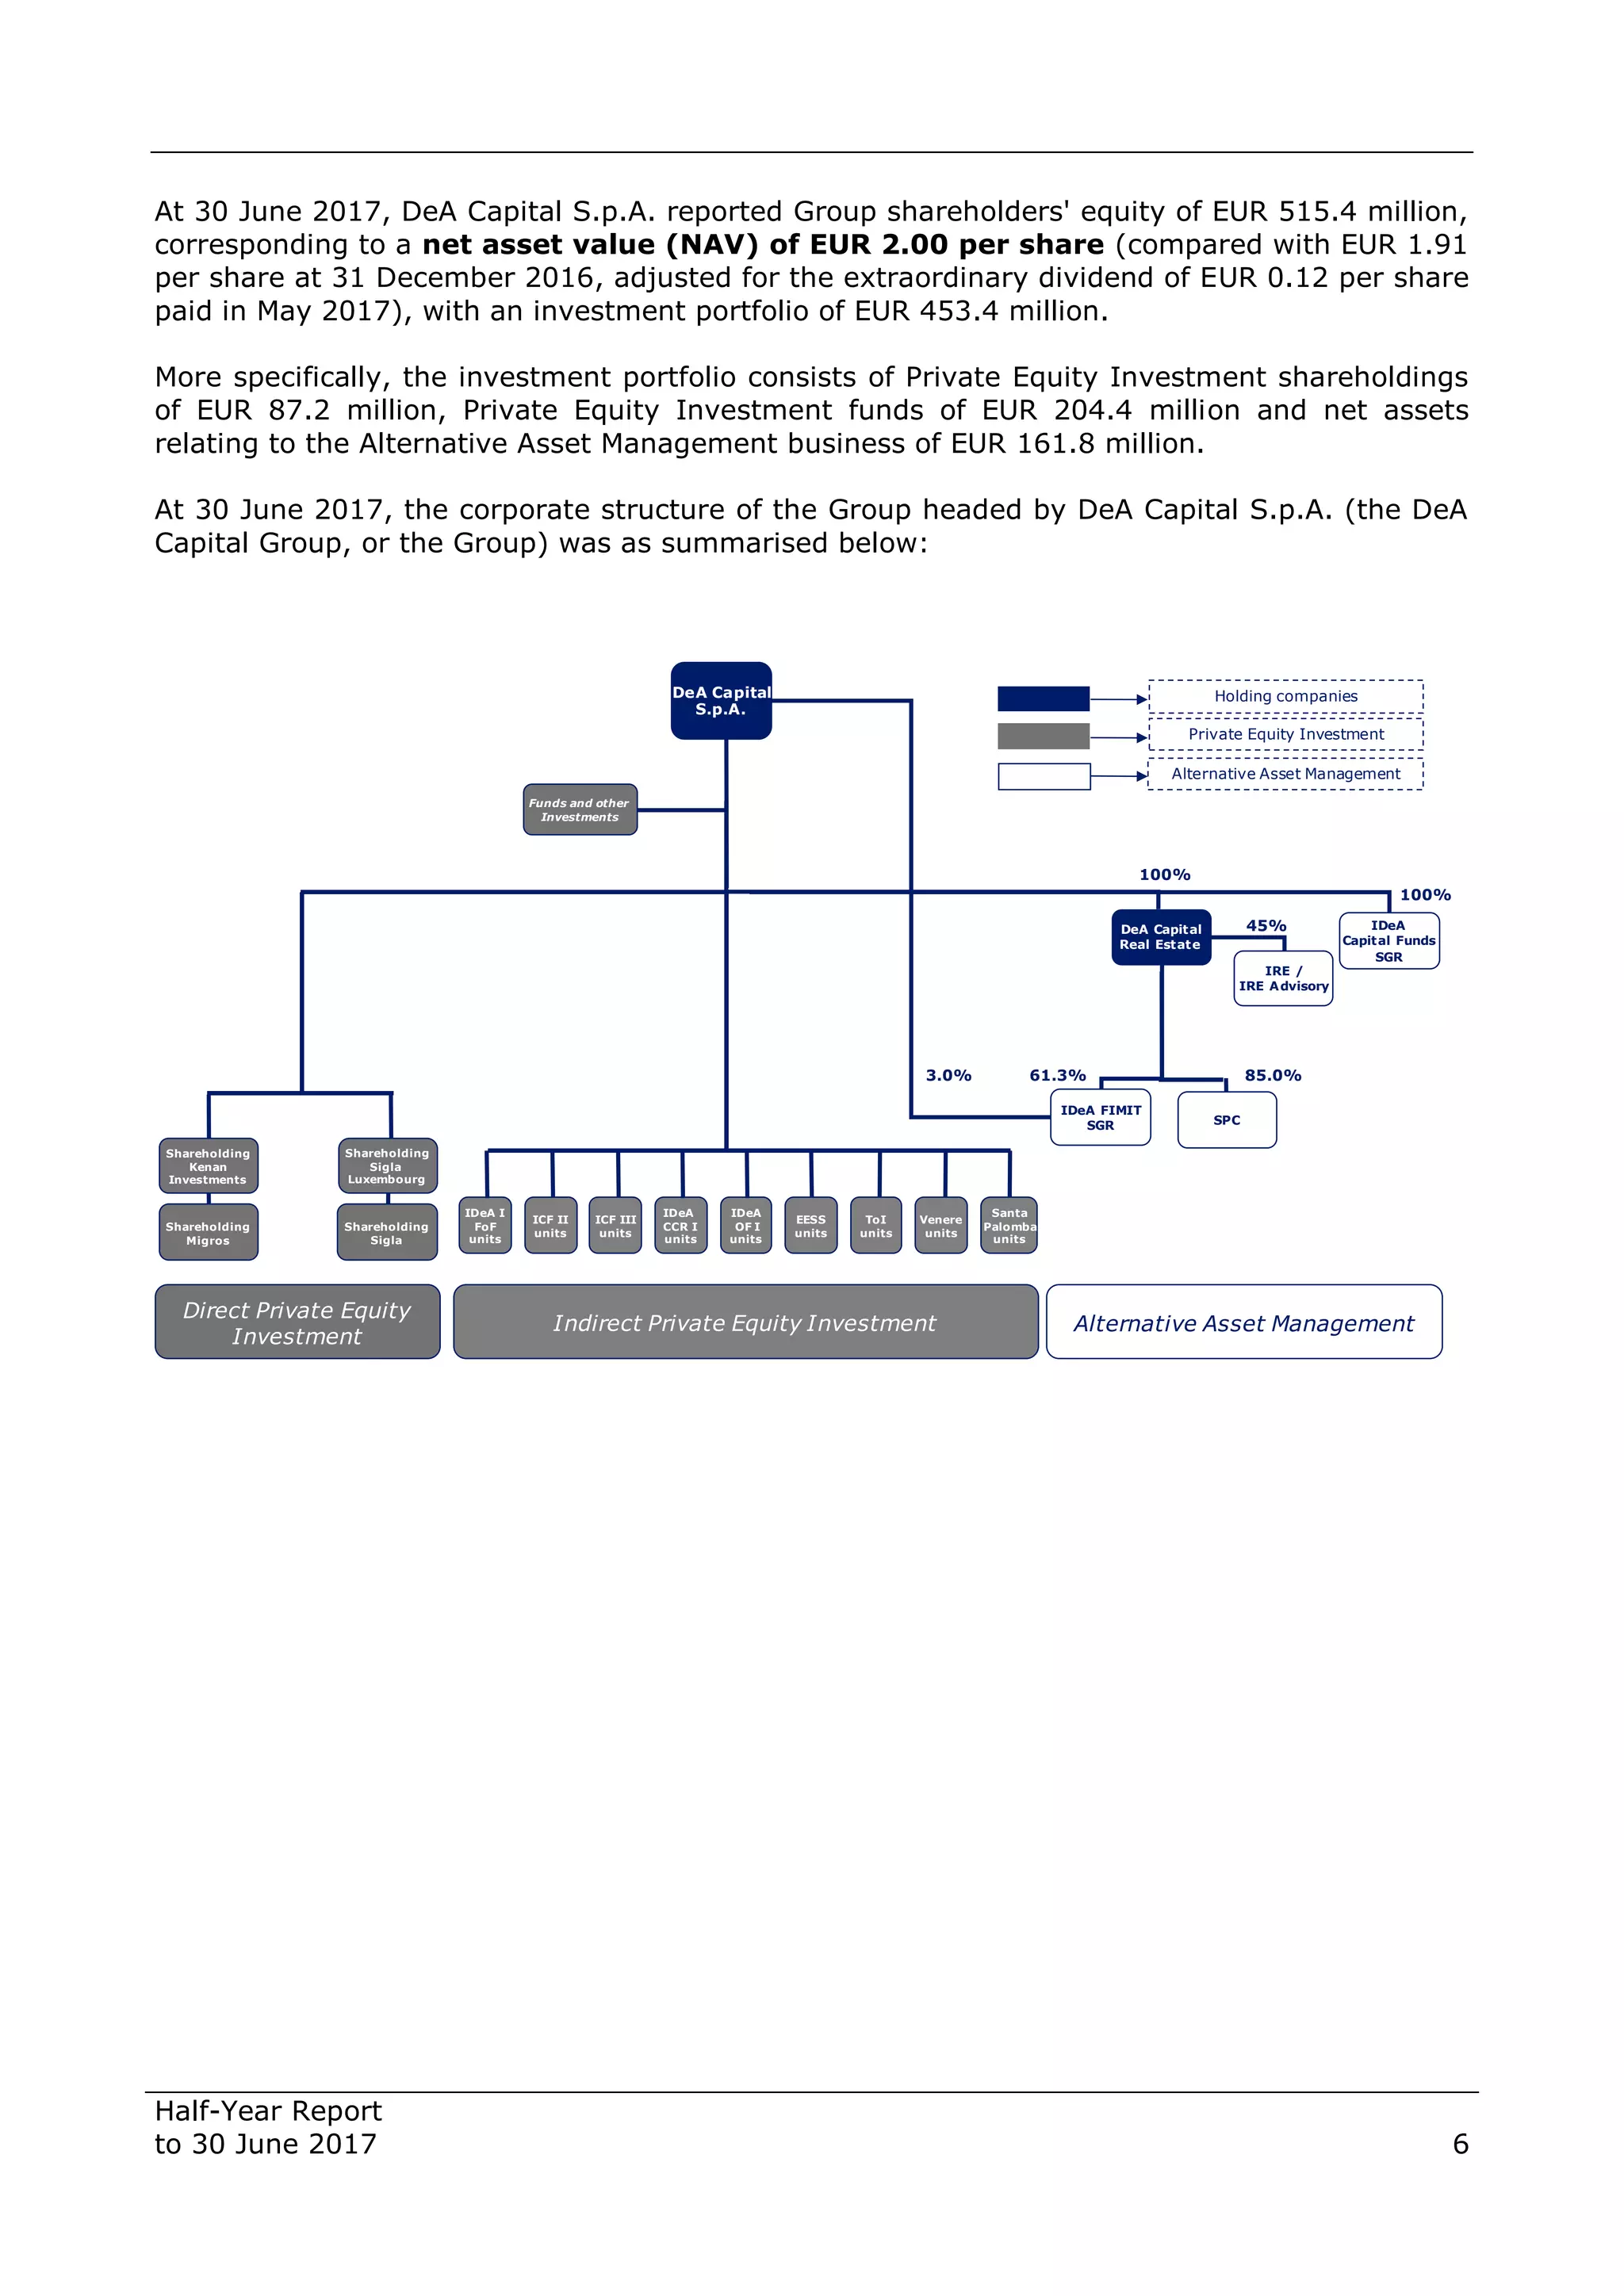


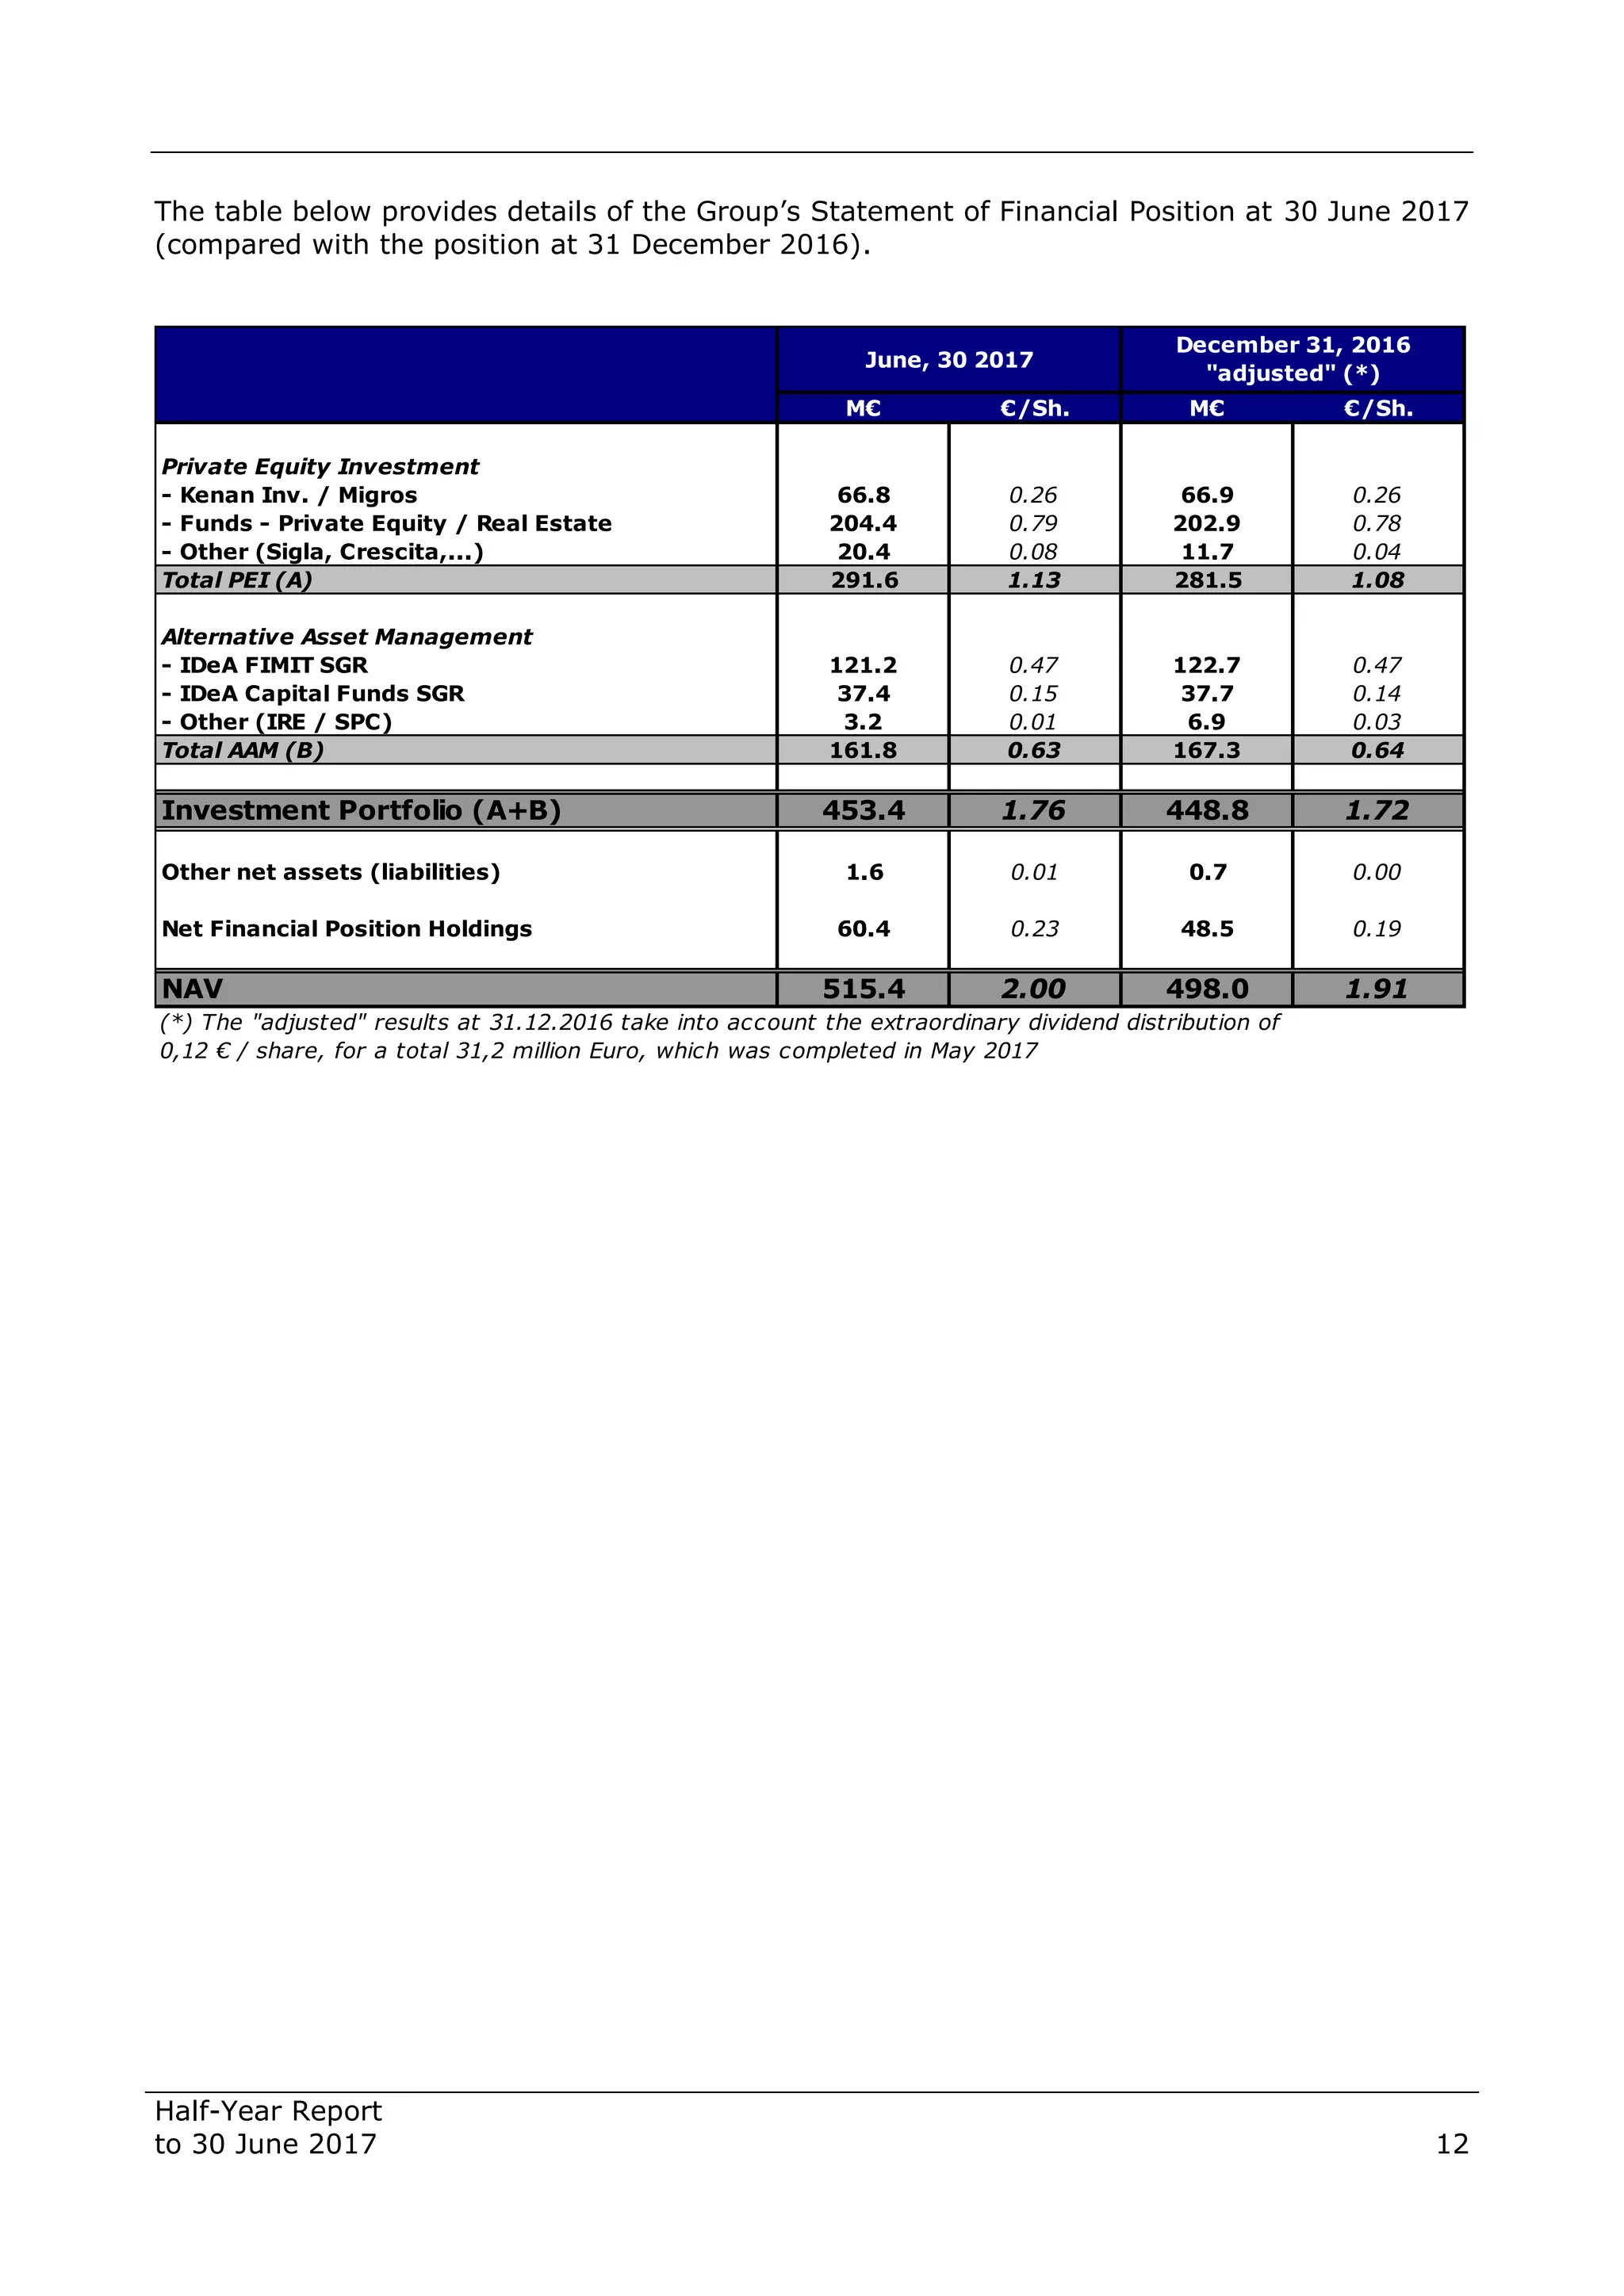


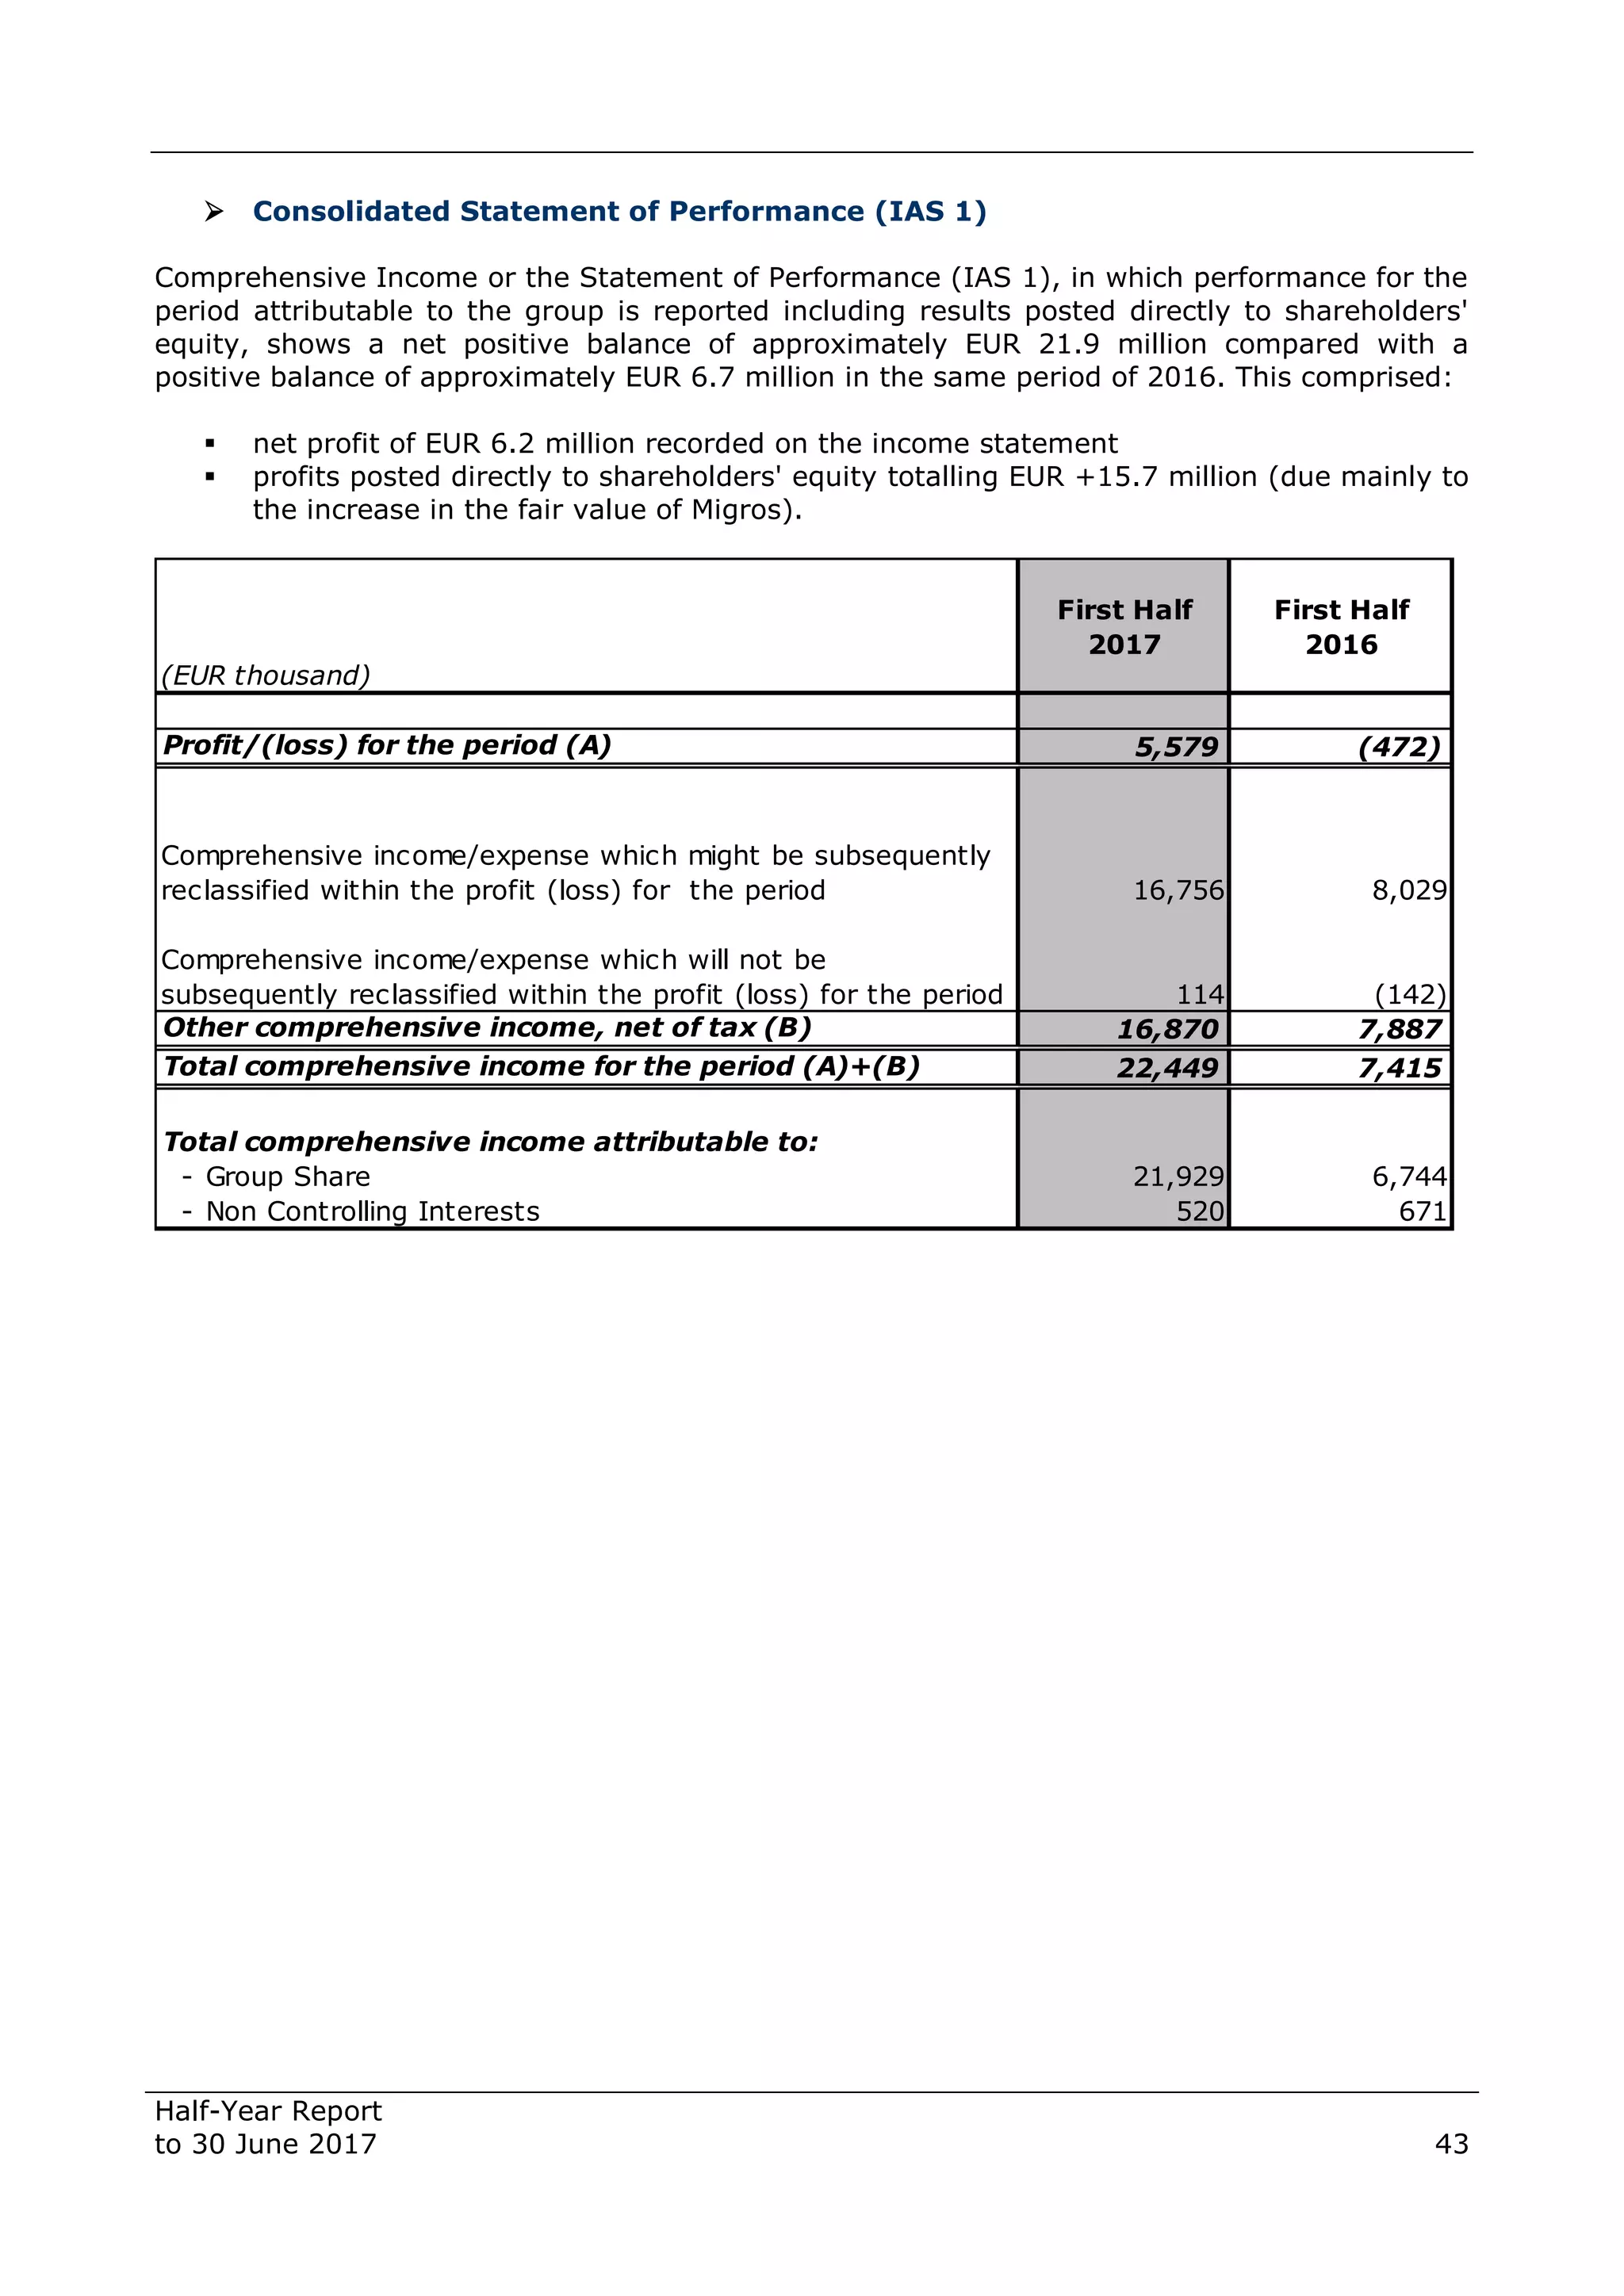


The document is a half-year report for DeA Capital S.p.A. for the period ending June 30, 2017. It provides key financial information including: - The Group's net asset value increased to EUR 515.4 million, corresponding to a net asset value per share of EUR 2.00. - The investment portfolio totalled EUR 453.4 million, including private equity investments of EUR 291.6 million and alternative asset management assets of EUR 161.8 million. - The Group reported a net profit of EUR 6.2 million and comprehensive income of EUR 21.9 million for the first half of 2017.


