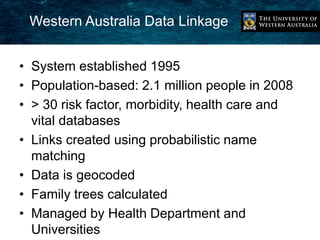
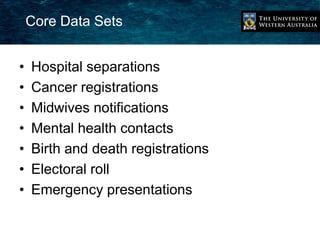
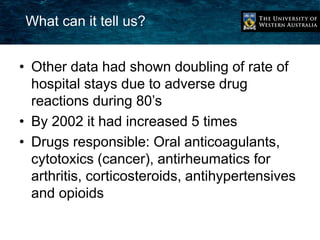
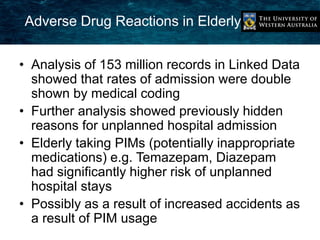
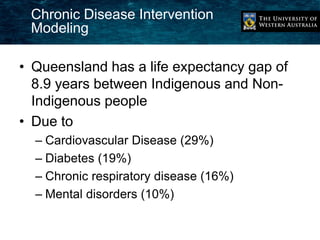
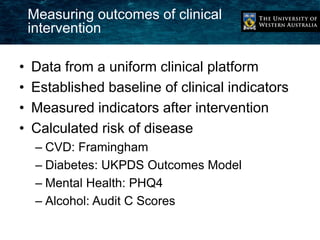
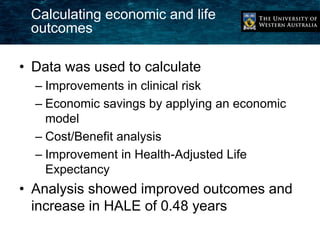
Leveraging data-driven innovation in 
aging societies 
Associate Professor David Glance
Introduction 
• Two examples of data-driven innovation 
• Western Australian Data Linkage System 
– Discovery of causes of unplanned hospital stays 
in elderly 
– True rates of adverse drug reactions in the elderly 
• Institute of Urban Indigenous Health 
– Chronic disease intervention outcomes through 
risk and economic modeling 
– Geographic modeling of administrative data for 
service planning
Western Australia Data Linkage 
• System established 1995 
• Population-based: 2.1 million people in 2008 
• > 30 risk factor, morbidity, health care and 
vital databases 
• Links created using probabilistic name 
matching 
• Data is geocoded 
• Family trees calculated 
• Managed by Health Department and 
Universities
Core Data Sets 
• Hospital separations 
• Cancer registrations 
• Midwives notifications 
• Mental health contacts 
• Birth and death registrations 
• Electoral roll 
• Emergency presentations
What can it tell us? 
• Other data had shown doubling of rate of 
hospital stays due to adverse drug 
reactions during 80’s 
• By 2002 it had increased 5 times 
• Drugs responsible: Oral anticoagulants, 
cytotoxics (cancer), antirheumatics for 
arthritis, corticosteroids, antihypertensives 
and opioids
Adverse Drug Reactions in Elderly 
• Analysis of 153 million records in Linked Data 
showed that rates of admission were double 
shown by medical coding 
• Further analysis showed previously hidden 
reasons for unplanned hospital admission 
• Elderly taking PIMs (potentially inappropriate 
medications) e.g. Temazepam, Diazepam 
had significantly higher risk of unplanned 
hospital stays 
• Possibly as a result of increased accidents as 
a result of PIM usage
Chronic Disease Intervention 
Modeling 
• Queensland has a life expectancy gap of 
8.9 years between Indigenous and Non- 
Indigenous people 
• Due to 
– Cardiovascular Disease (29%) 
– Diabetes (19%) 
– Chronic respiratory disease (16%) 
– Mental disorders (10%)
Measuring outcomes of clinical 
intervention 
• Data from a uniform clinical platform 
• Established baseline of clinical indicators 
• Measured indicators after intervention 
• Calculated risk of disease 
– CVD: Framingham 
– Diabetes: UKPDS Outcomes Model 
– Mental Health: PHQ4 
– Alcohol: Audit C Scores
Calculating economic and life 
outcomes 
• Data was used to calculate 
– Improvements in clinical risk 
– Economic savings by applying an economic 
model 
– Cost/Benefit analysis 
– Improvement in Health-Adjusted Life 
Expectancy 
• Analysis showed improved outcomes and 
increase in HALE of 0.48 years
Geographic planning for chronic 
disease 
• IUIH has increased number of clinics to 16 
• Calculating clinic services based on 
geocoded administrative data (Medicare 
claims) 
• Can only do this because of a centralised 
collection of information that is coded
Data Analysis in Clinical 
Provisioning 
• Importance of centralised and linked data 
• Applying models of risk, outcomes and 
economics. 
• Feed into performance measures 
• Pitfalls: 
– Understanding the underlying motivations of 
data 
– Linkage issues 
– Incomplete or false data 
– Inaccurate or unacceptable models

David Glance gfke 2014

  • 1.
    Leveraging data-driven innovationin aging societies Associate Professor David Glance
  • 2.
    Introduction • Twoexamples of data-driven innovation • Western Australian Data Linkage System – Discovery of causes of unplanned hospital stays in elderly – True rates of adverse drug reactions in the elderly • Institute of Urban Indigenous Health – Chronic disease intervention outcomes through risk and economic modeling – Geographic modeling of administrative data for service planning
  • 3.
    Western Australia DataLinkage • System established 1995 • Population-based: 2.1 million people in 2008 • > 30 risk factor, morbidity, health care and vital databases • Links created using probabilistic name matching • Data is geocoded • Family trees calculated • Managed by Health Department and Universities
  • 4.
    Core Data Sets • Hospital separations • Cancer registrations • Midwives notifications • Mental health contacts • Birth and death registrations • Electoral roll • Emergency presentations
  • 5.
    What can ittell us? • Other data had shown doubling of rate of hospital stays due to adverse drug reactions during 80’s • By 2002 it had increased 5 times • Drugs responsible: Oral anticoagulants, cytotoxics (cancer), antirheumatics for arthritis, corticosteroids, antihypertensives and opioids
  • 6.
    Adverse Drug Reactionsin Elderly • Analysis of 153 million records in Linked Data showed that rates of admission were double shown by medical coding • Further analysis showed previously hidden reasons for unplanned hospital admission • Elderly taking PIMs (potentially inappropriate medications) e.g. Temazepam, Diazepam had significantly higher risk of unplanned hospital stays • Possibly as a result of increased accidents as a result of PIM usage
  • 7.
    Chronic Disease Intervention Modeling • Queensland has a life expectancy gap of 8.9 years between Indigenous and Non- Indigenous people • Due to – Cardiovascular Disease (29%) – Diabetes (19%) – Chronic respiratory disease (16%) – Mental disorders (10%)
  • 8.
    Measuring outcomes ofclinical intervention • Data from a uniform clinical platform • Established baseline of clinical indicators • Measured indicators after intervention • Calculated risk of disease – CVD: Framingham – Diabetes: UKPDS Outcomes Model – Mental Health: PHQ4 – Alcohol: Audit C Scores
  • 9.
    Calculating economic andlife outcomes • Data was used to calculate – Improvements in clinical risk – Economic savings by applying an economic model – Cost/Benefit analysis – Improvement in Health-Adjusted Life Expectancy • Analysis showed improved outcomes and increase in HALE of 0.48 years
  • 10.
    Geographic planning forchronic disease • IUIH has increased number of clinics to 16 • Calculating clinic services based on geocoded administrative data (Medicare claims) • Can only do this because of a centralised collection of information that is coded
  • 11.
    Data Analysis inClinical Provisioning • Importance of centralised and linked data • Applying models of risk, outcomes and economics. • Feed into performance measures • Pitfalls: – Understanding the underlying motivations of data – Linkage issues – Incomplete or false data – Inaccurate or unacceptable models