Download as PDF, PPTX


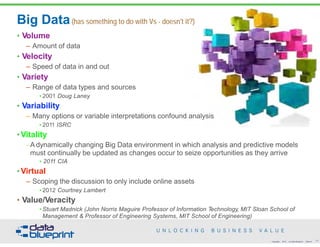
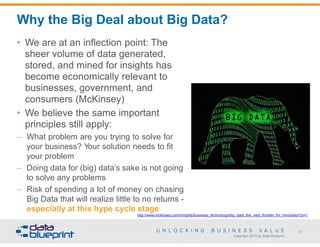
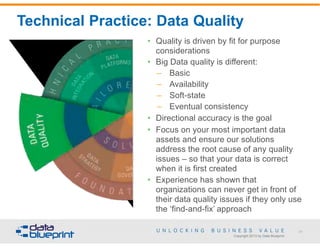
![Non-von Neumann Processing/Efficiencies
• von Neumann
bottleneck
(computer science)
– "An inefficiency inherent in
the design of any von
Neumann machine that
arises from the fact that
most computer time is
spent in moving
information between
storage and the central
processing unit rather than
operating on it"
[http://encyclopedia2.thefreedictionary.com/von+Neumann+bottleneck]
• Michael Stonebraker
– Ingres (Berkeley/MIT)
– Modern database
processing is
approximately 4%
efficient
• Many big data
architectures are
attempts to address
this, but:
– Zero sum game
– Trade characteristics
against each other
• Reliability
• Predictability
– Google/MapReduce/
Bigtable
– Amazon/Dynamo
– Netflix/Chaos Monkey
– Hadoop
– McDipper
• Big data techniques
exploit non-von
Neumann processing
8 33Copyright 2015 by Data Blueprint Slide #](https://image.slidesharecdn.com/frameworkfornosqlhadoophandout-150610152815-lva1-app6892/85/Data-Ed-A-Framework-for-no-sql-and-Hadoop-33-320.jpg)


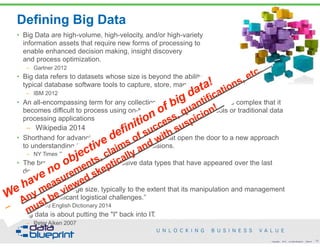
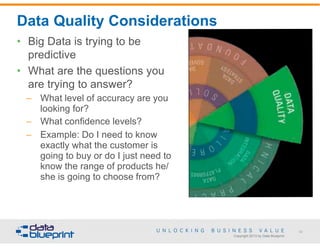
![Foundational Practice: Data Architecture
• Common vocabulary expressing
integrated requirements ensuring
that data assets are stored,
arranged, managed, and used in
systems in support of
organizational strategy [Aiken
2010]
• Most organizations have data
assets that are not supportive of
strategies
• Big question:
– How can organizations more
effectively use their information
architectures to support
strategy implementation?
90
Copyright 2013 by Data Blueprint](https://image.slidesharecdn.com/frameworkfornosqlhadoophandout-150610152815-lva1-app6892/85/Data-Ed-A-Framework-for-no-sql-and-Hadoop-87-320.jpg)

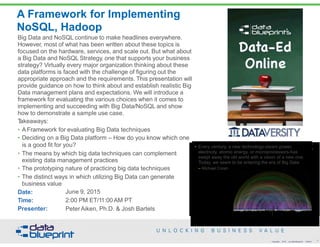
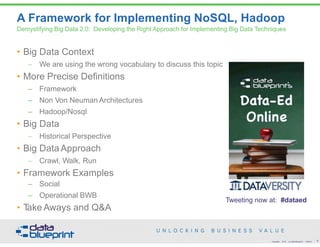
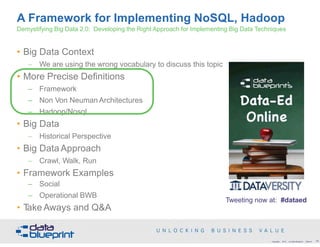
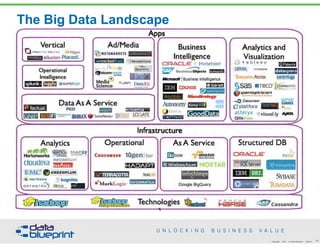
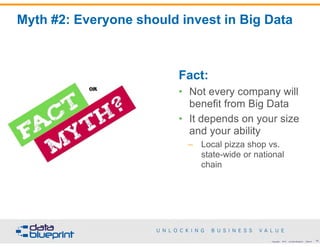
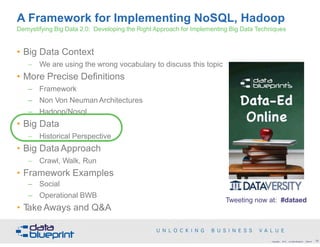
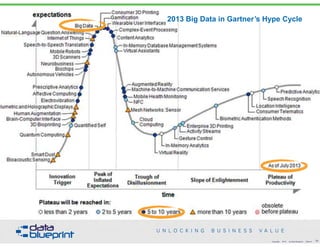
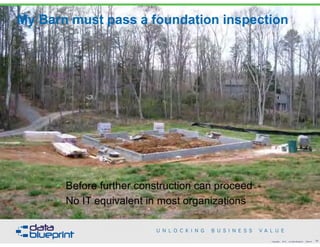
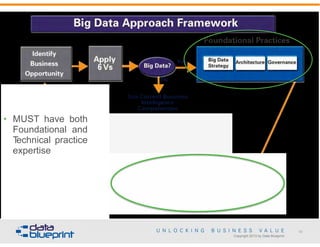
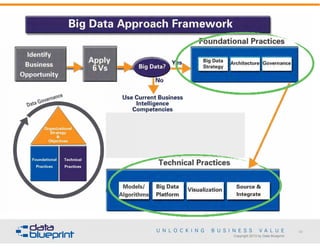
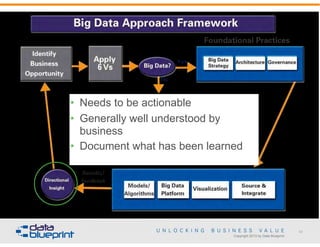
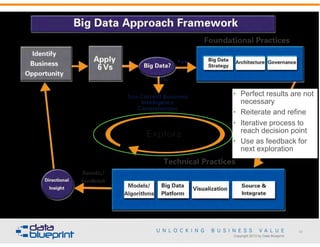
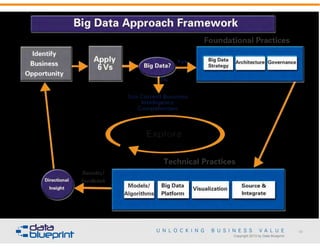
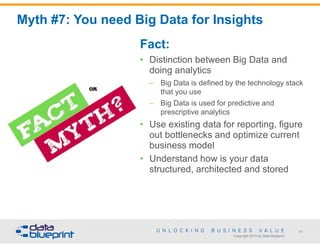
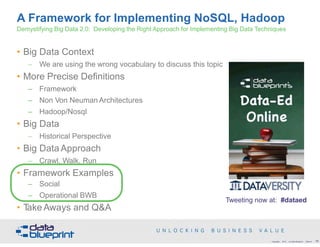
The document presents a framework for effective implementation of big data and NoSQL strategies that align with business objectives. It discusses the misconceptions surrounding big data terminology and offers guidance on selecting appropriate data platforms. Key topics include big data techniques, historical context, and the importance of integrating new data management approaches to generate business value.