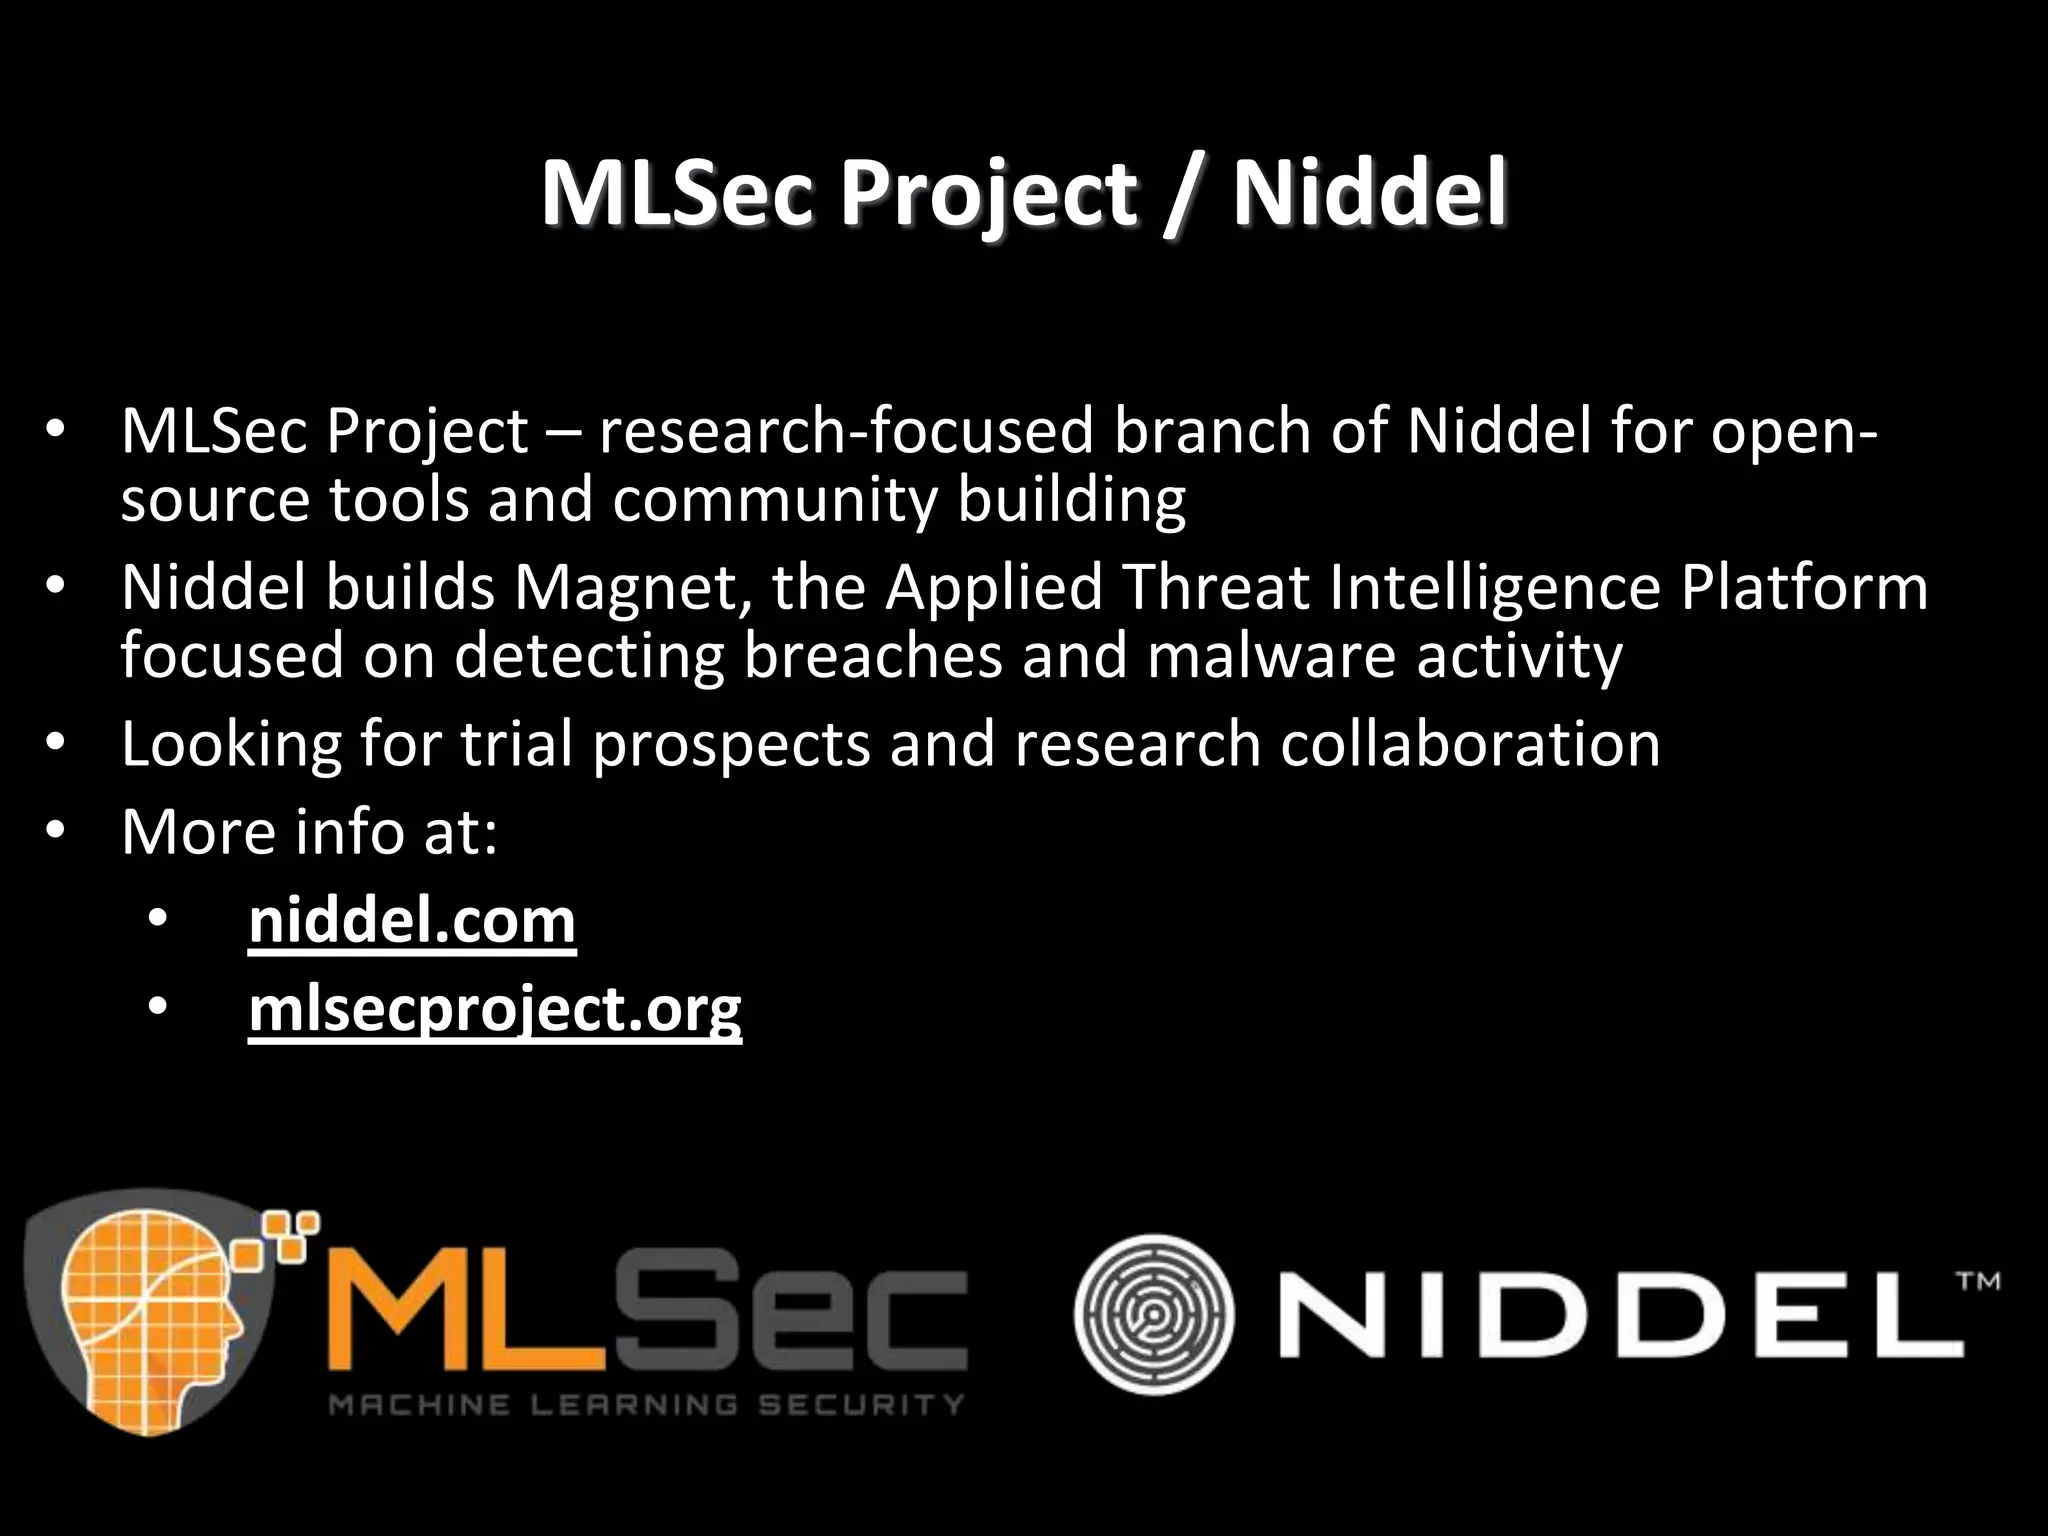
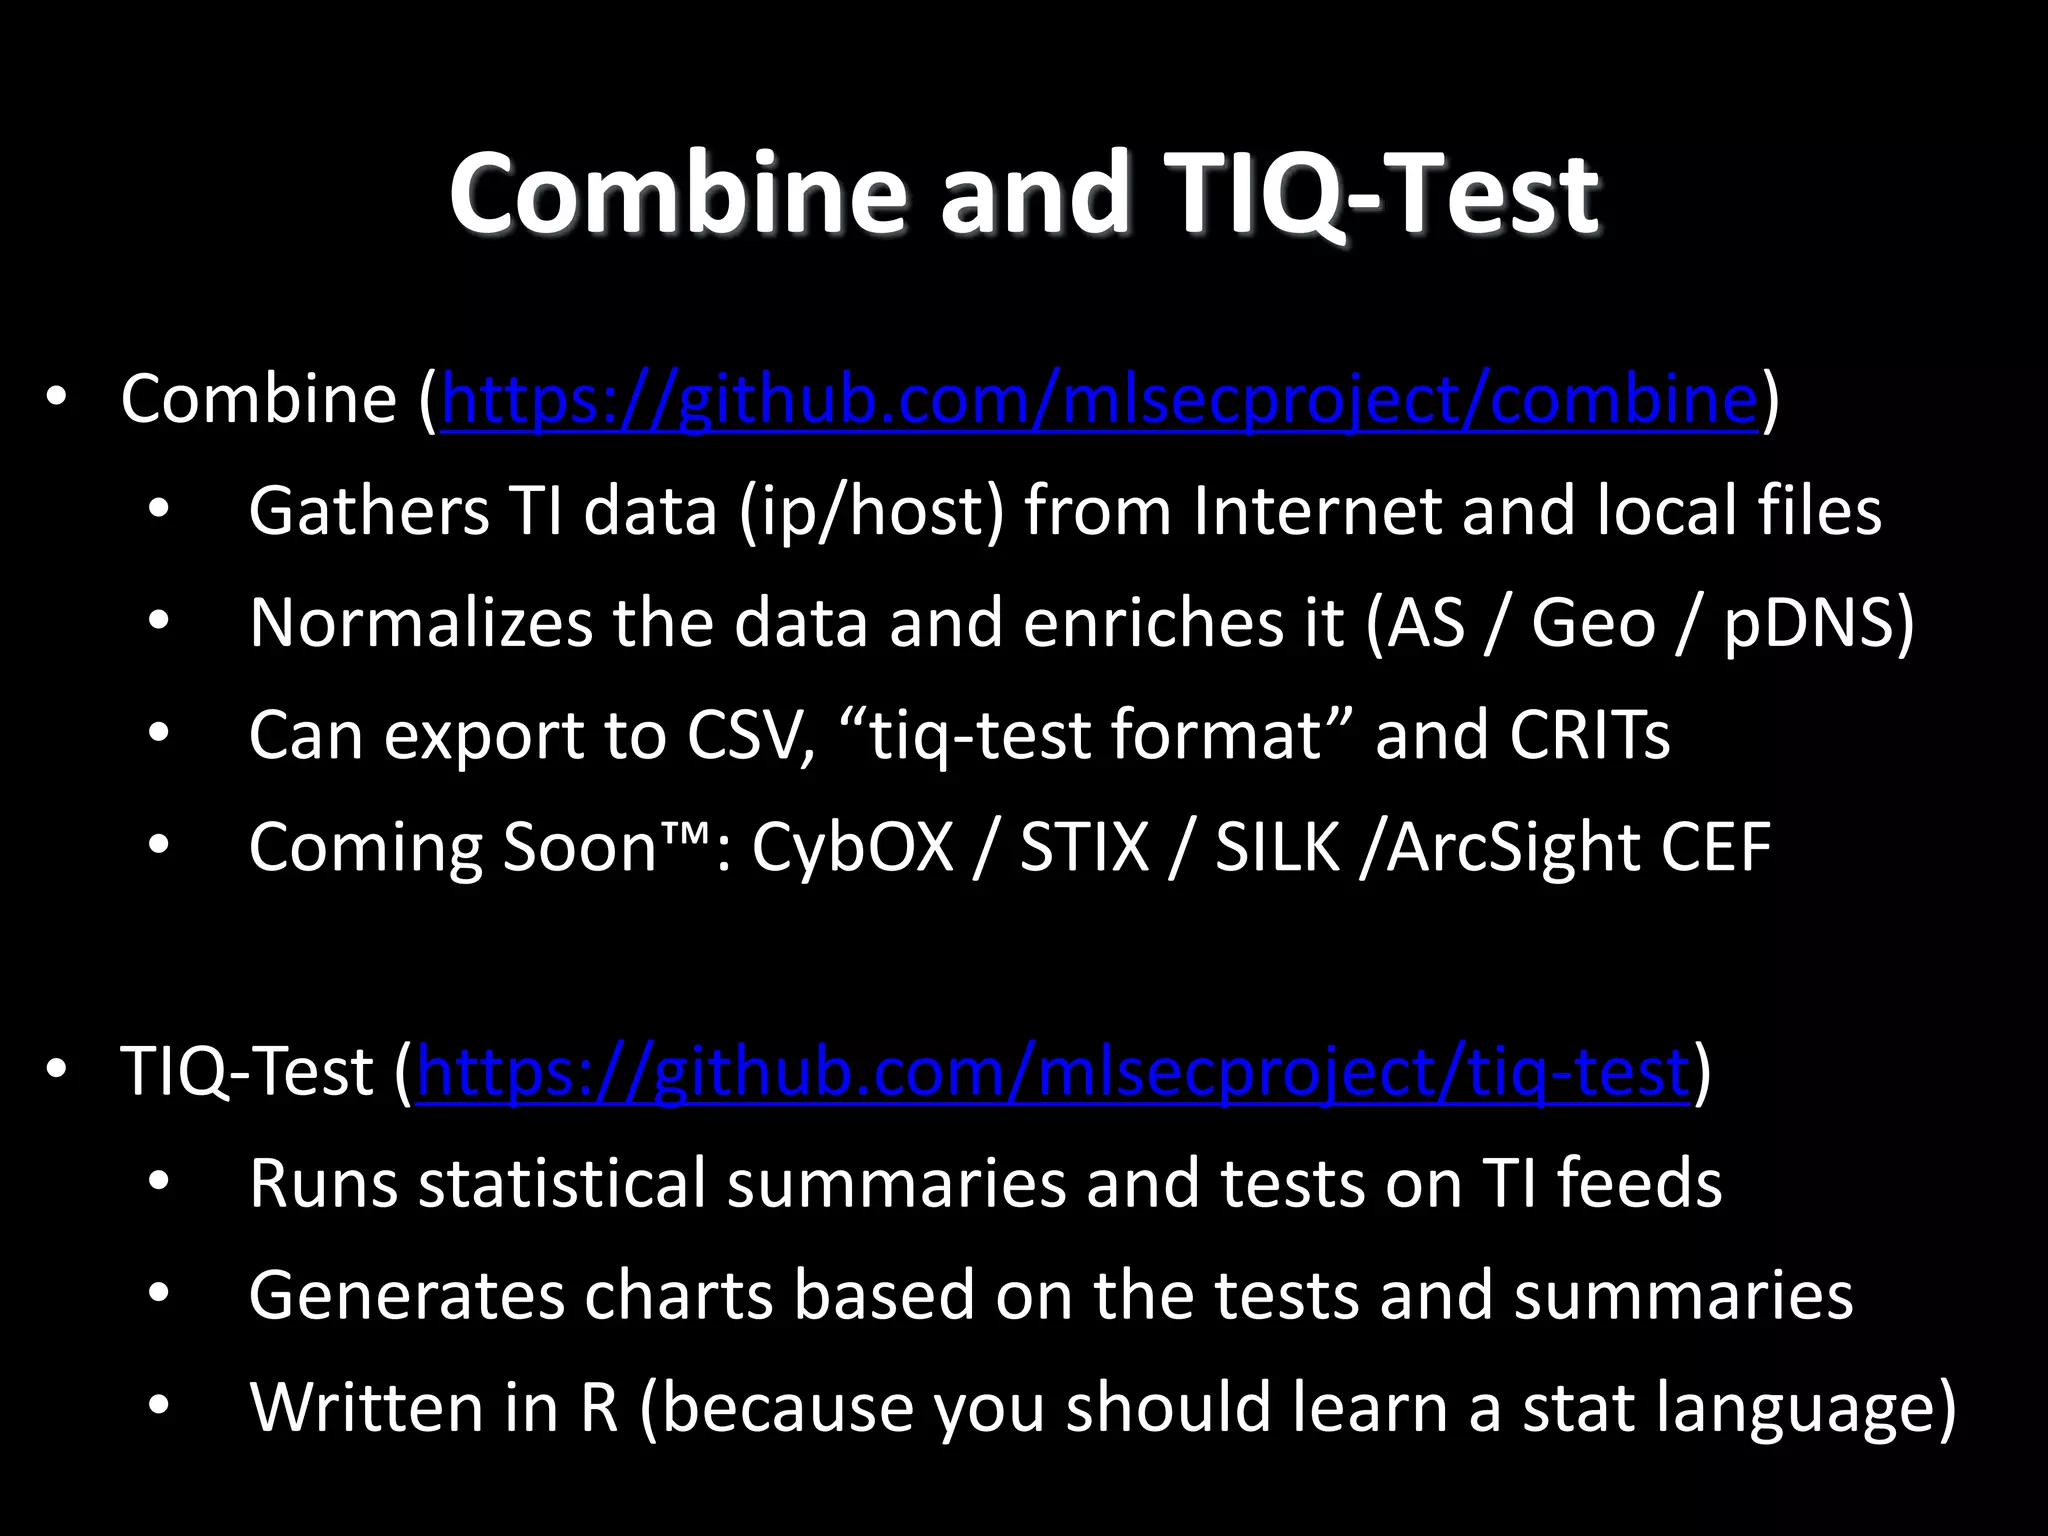
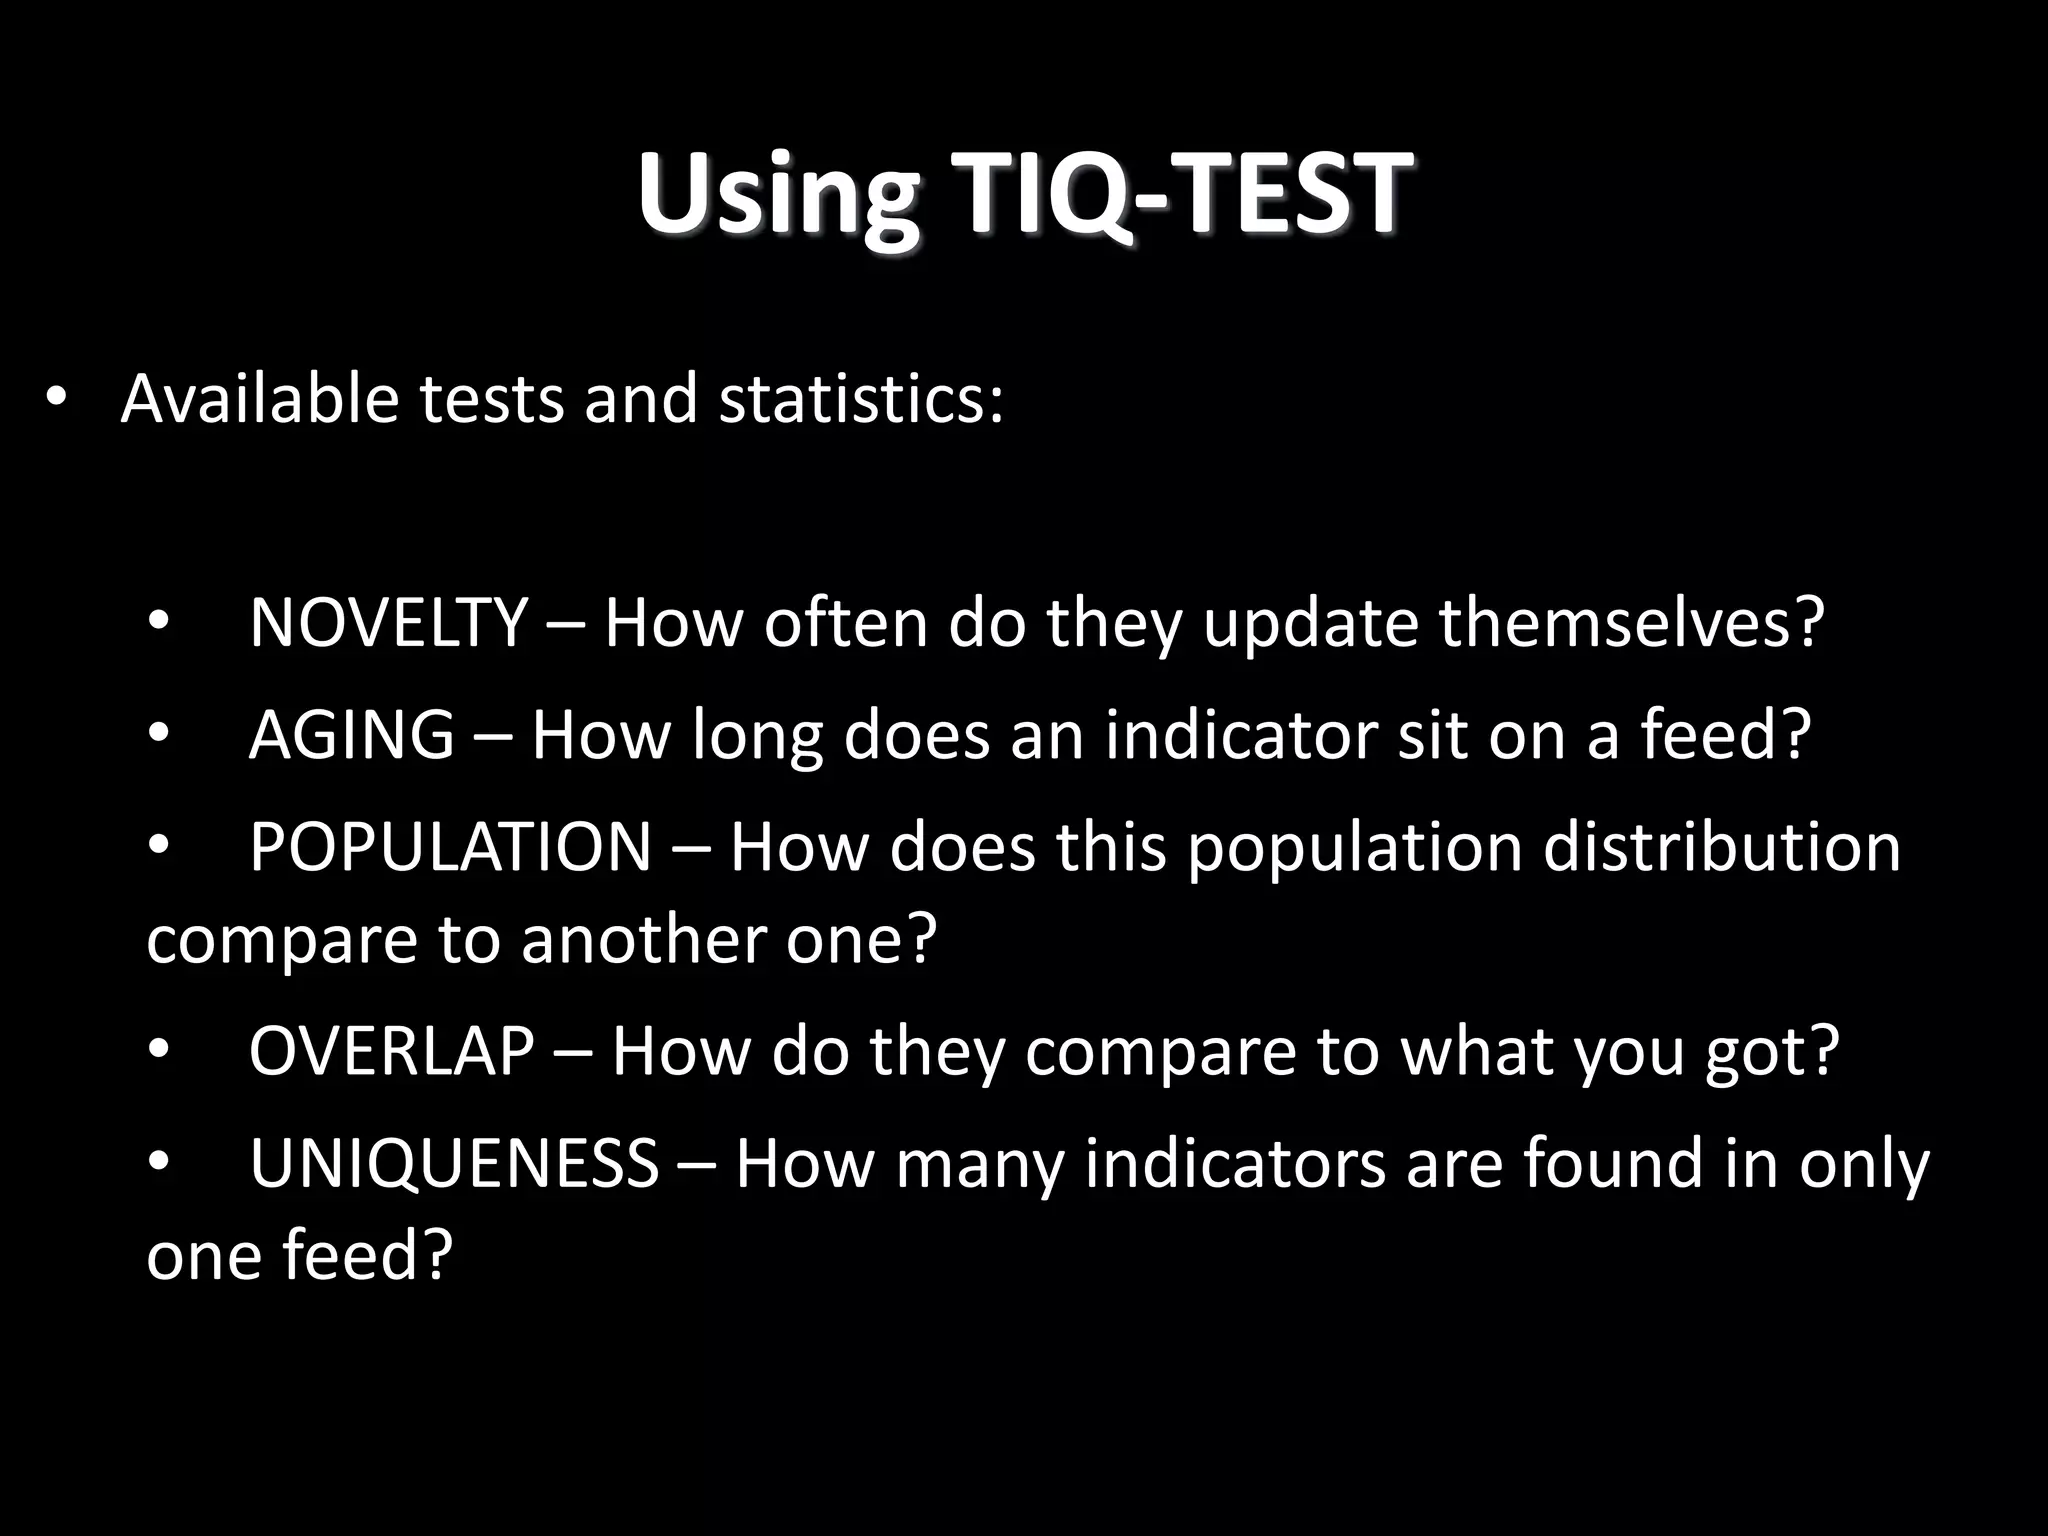
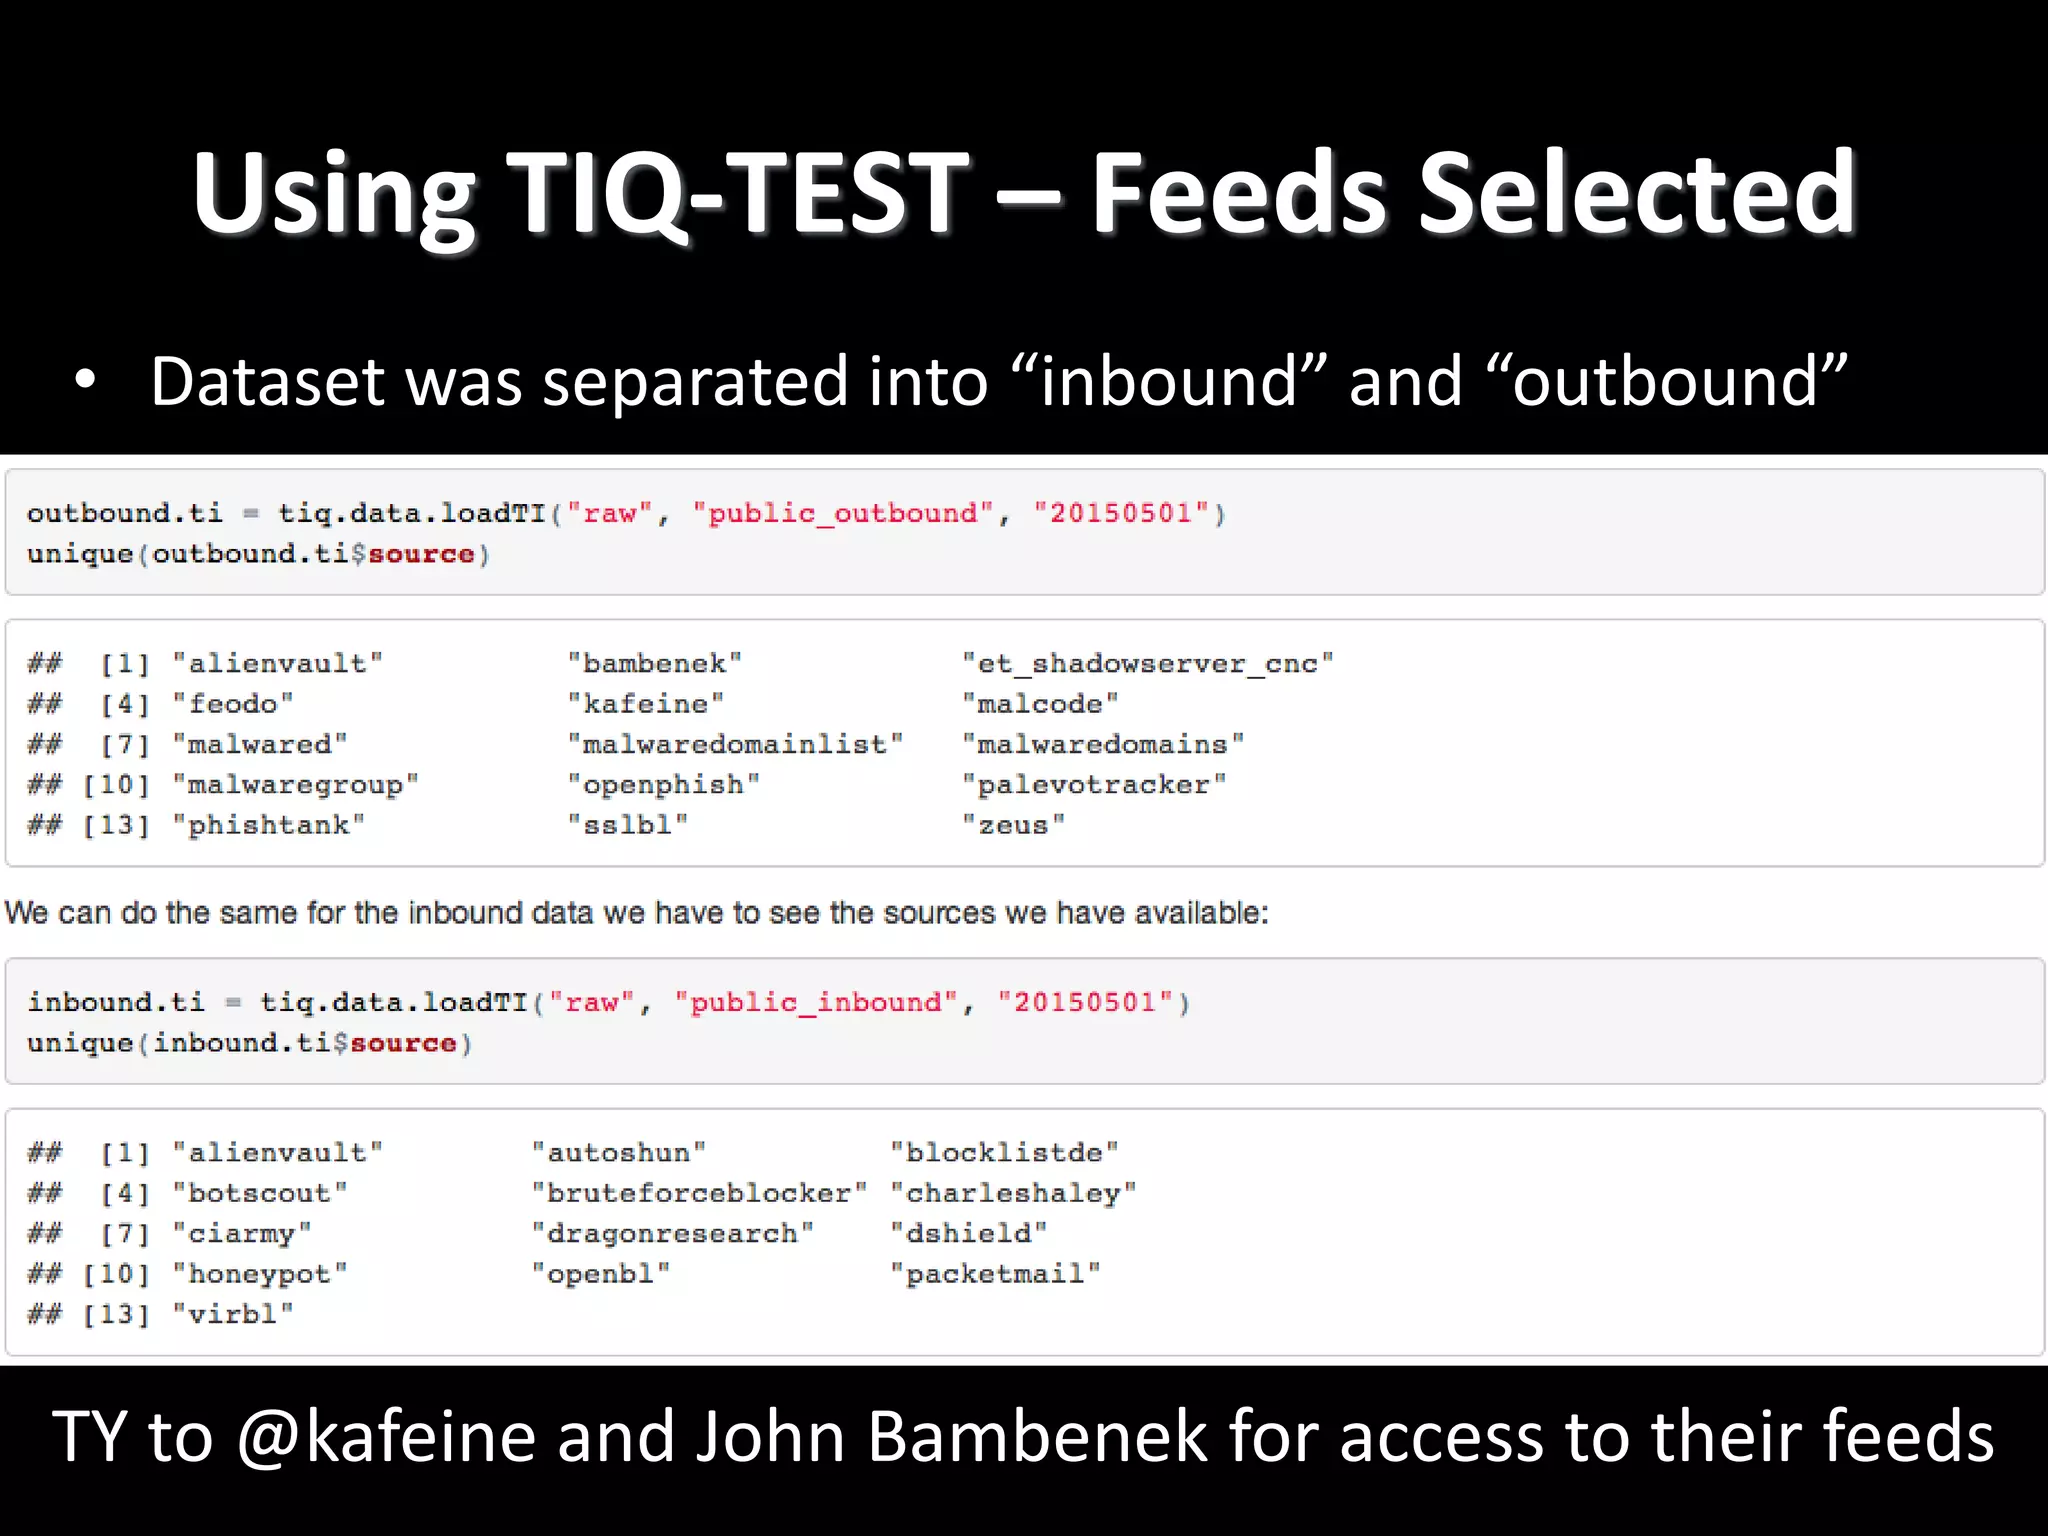
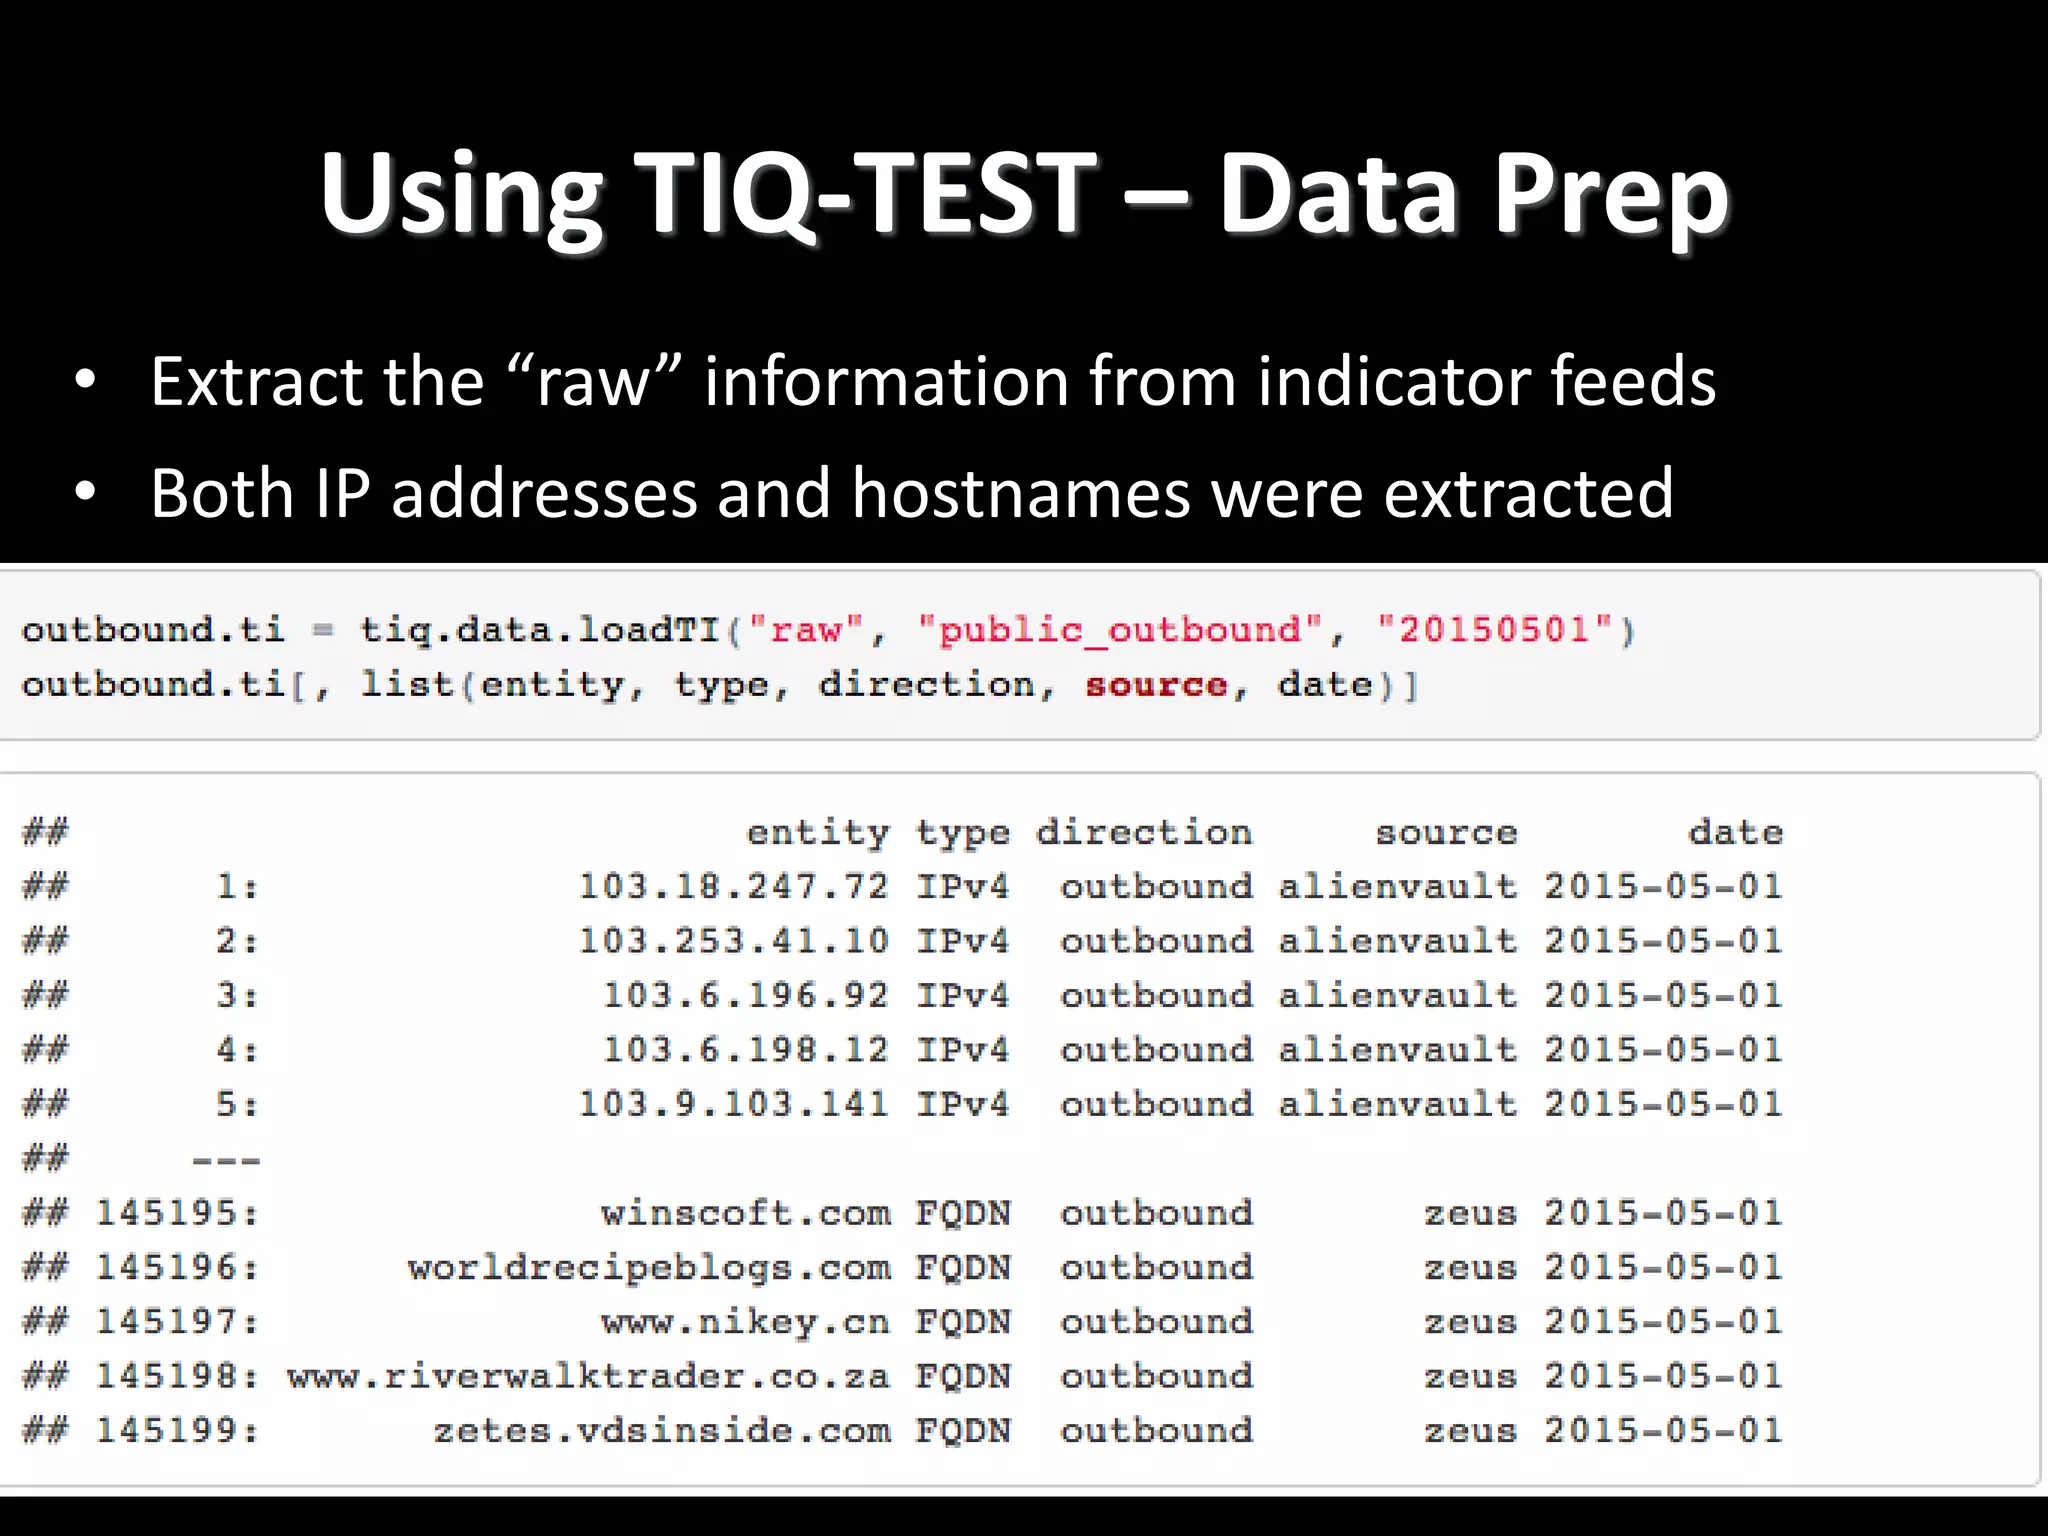
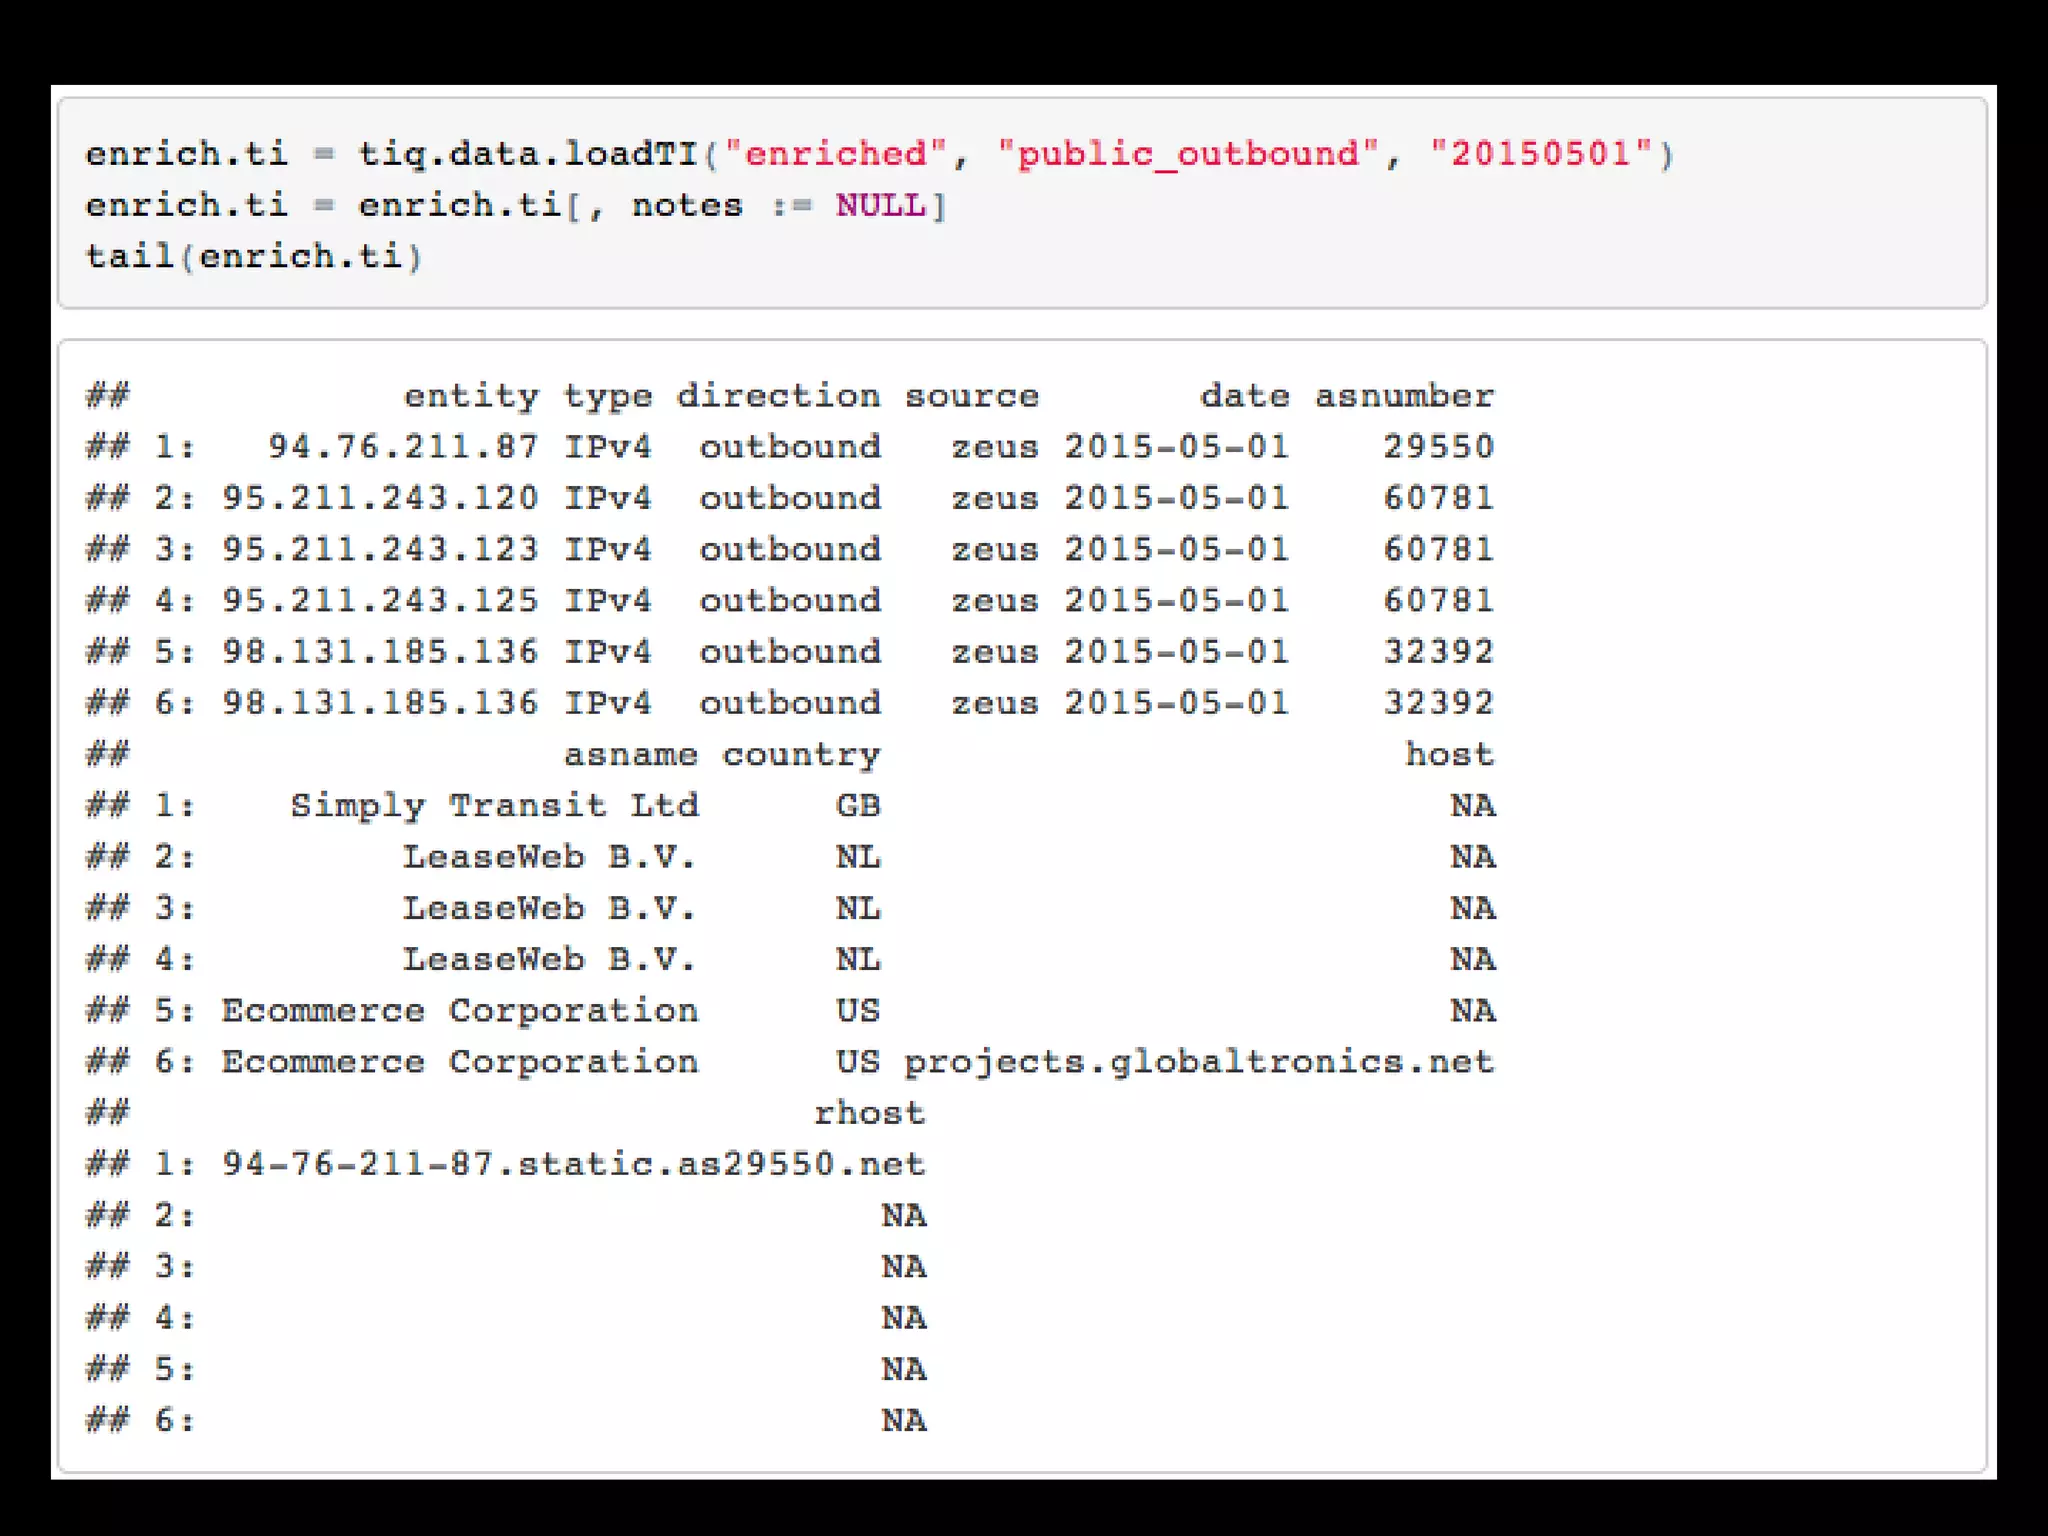
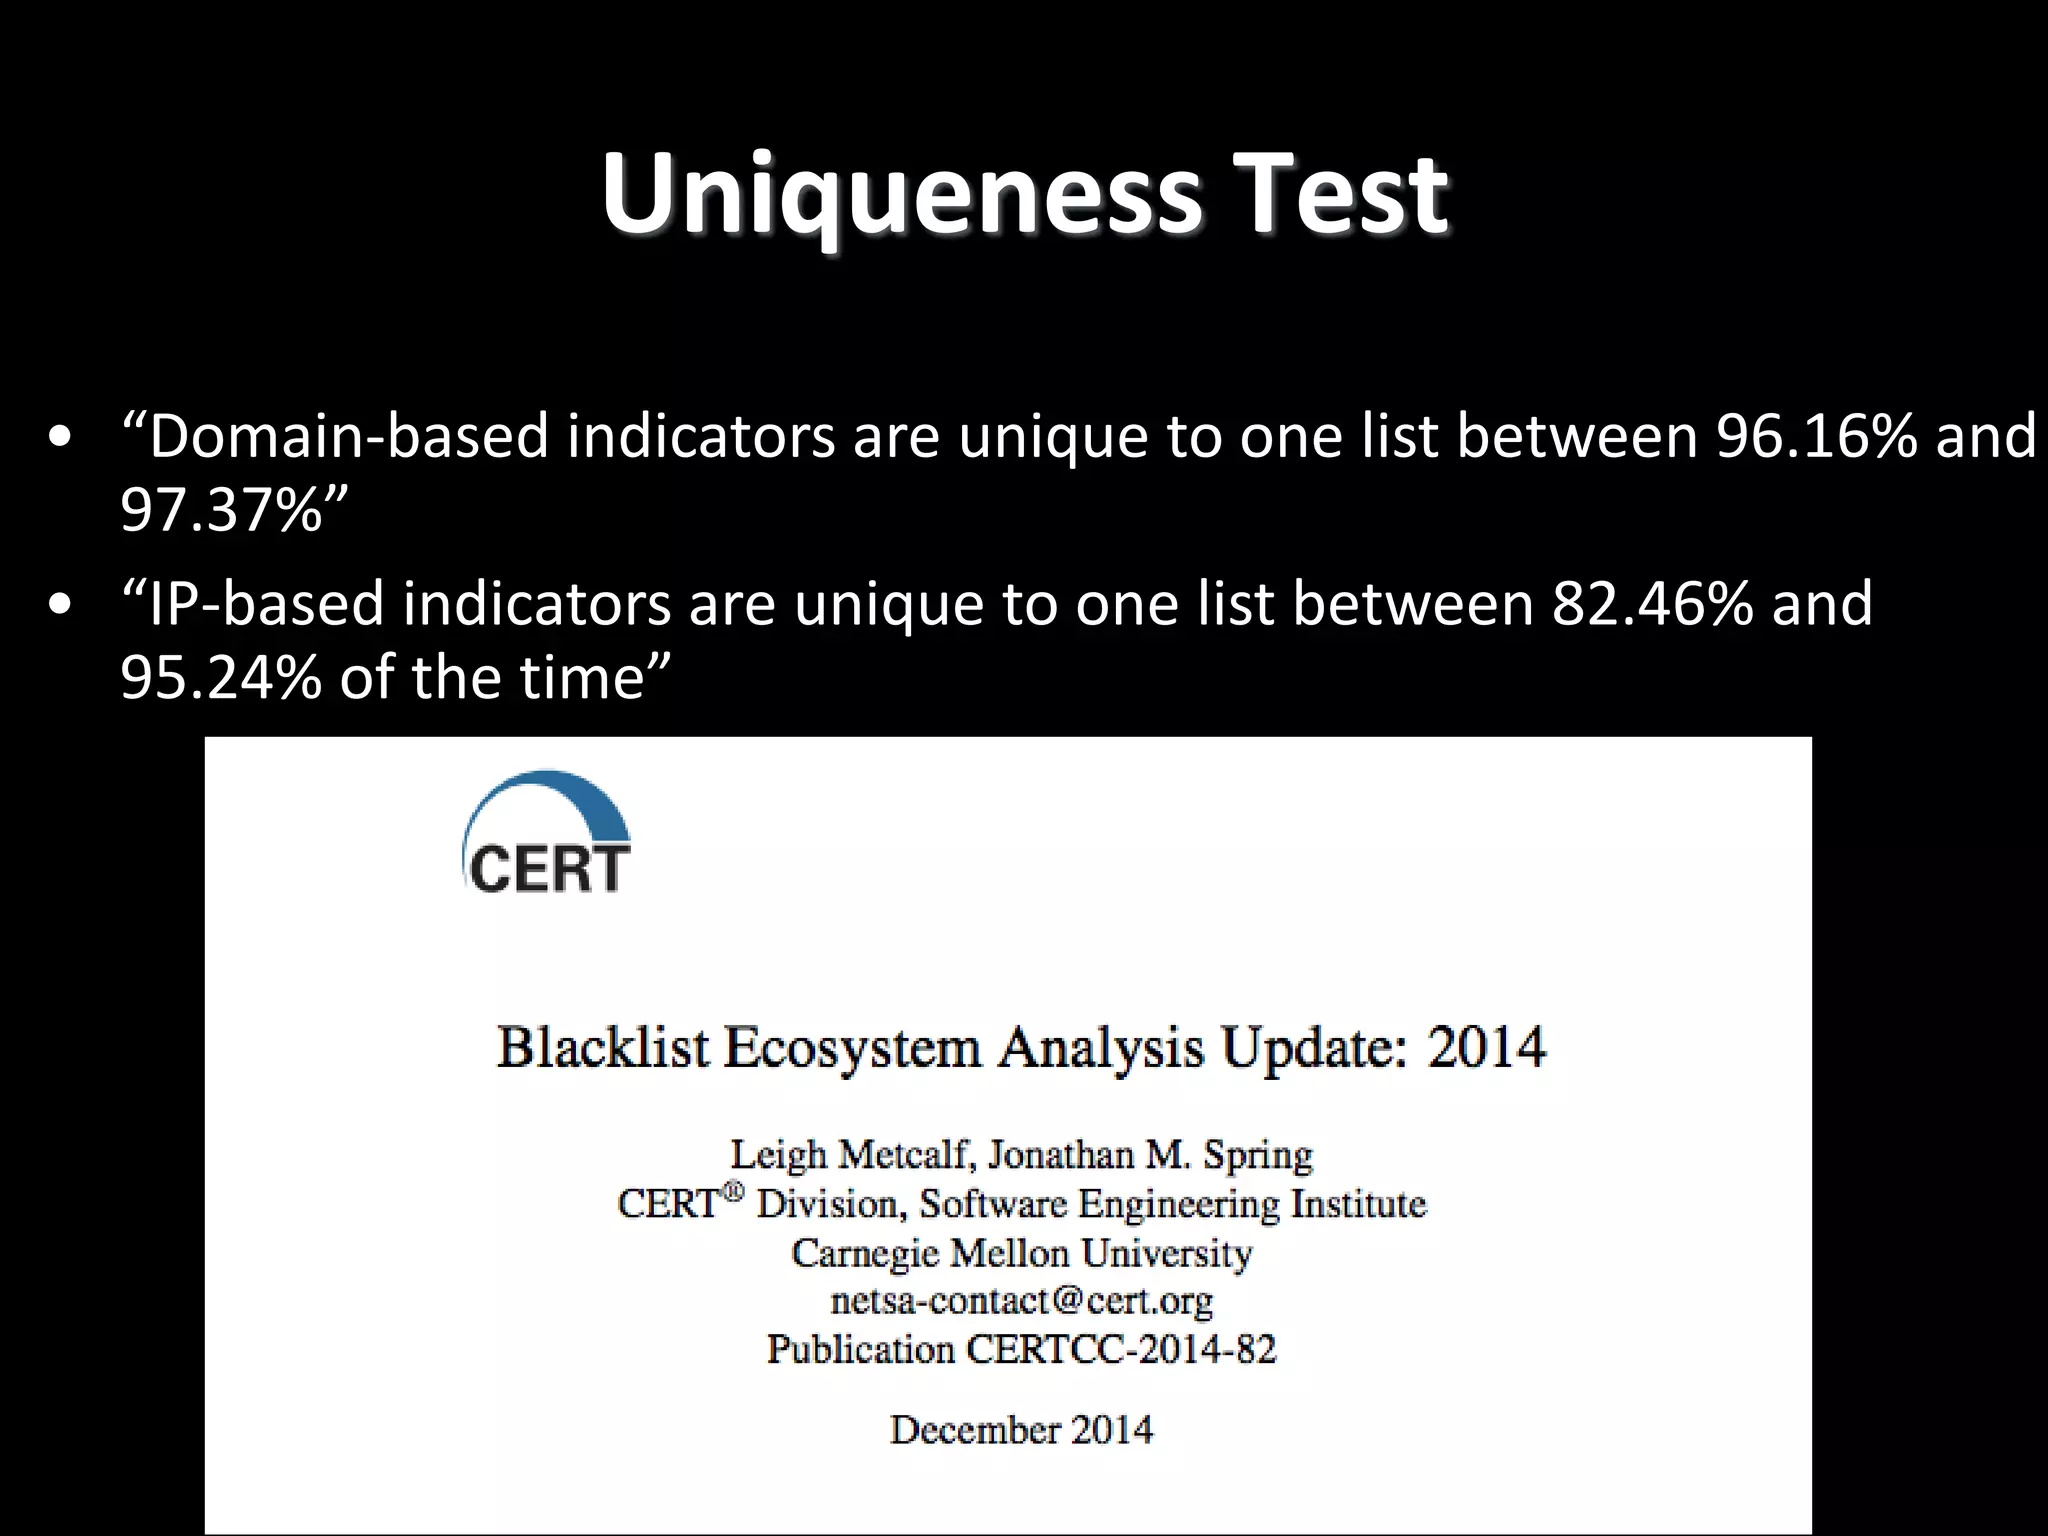
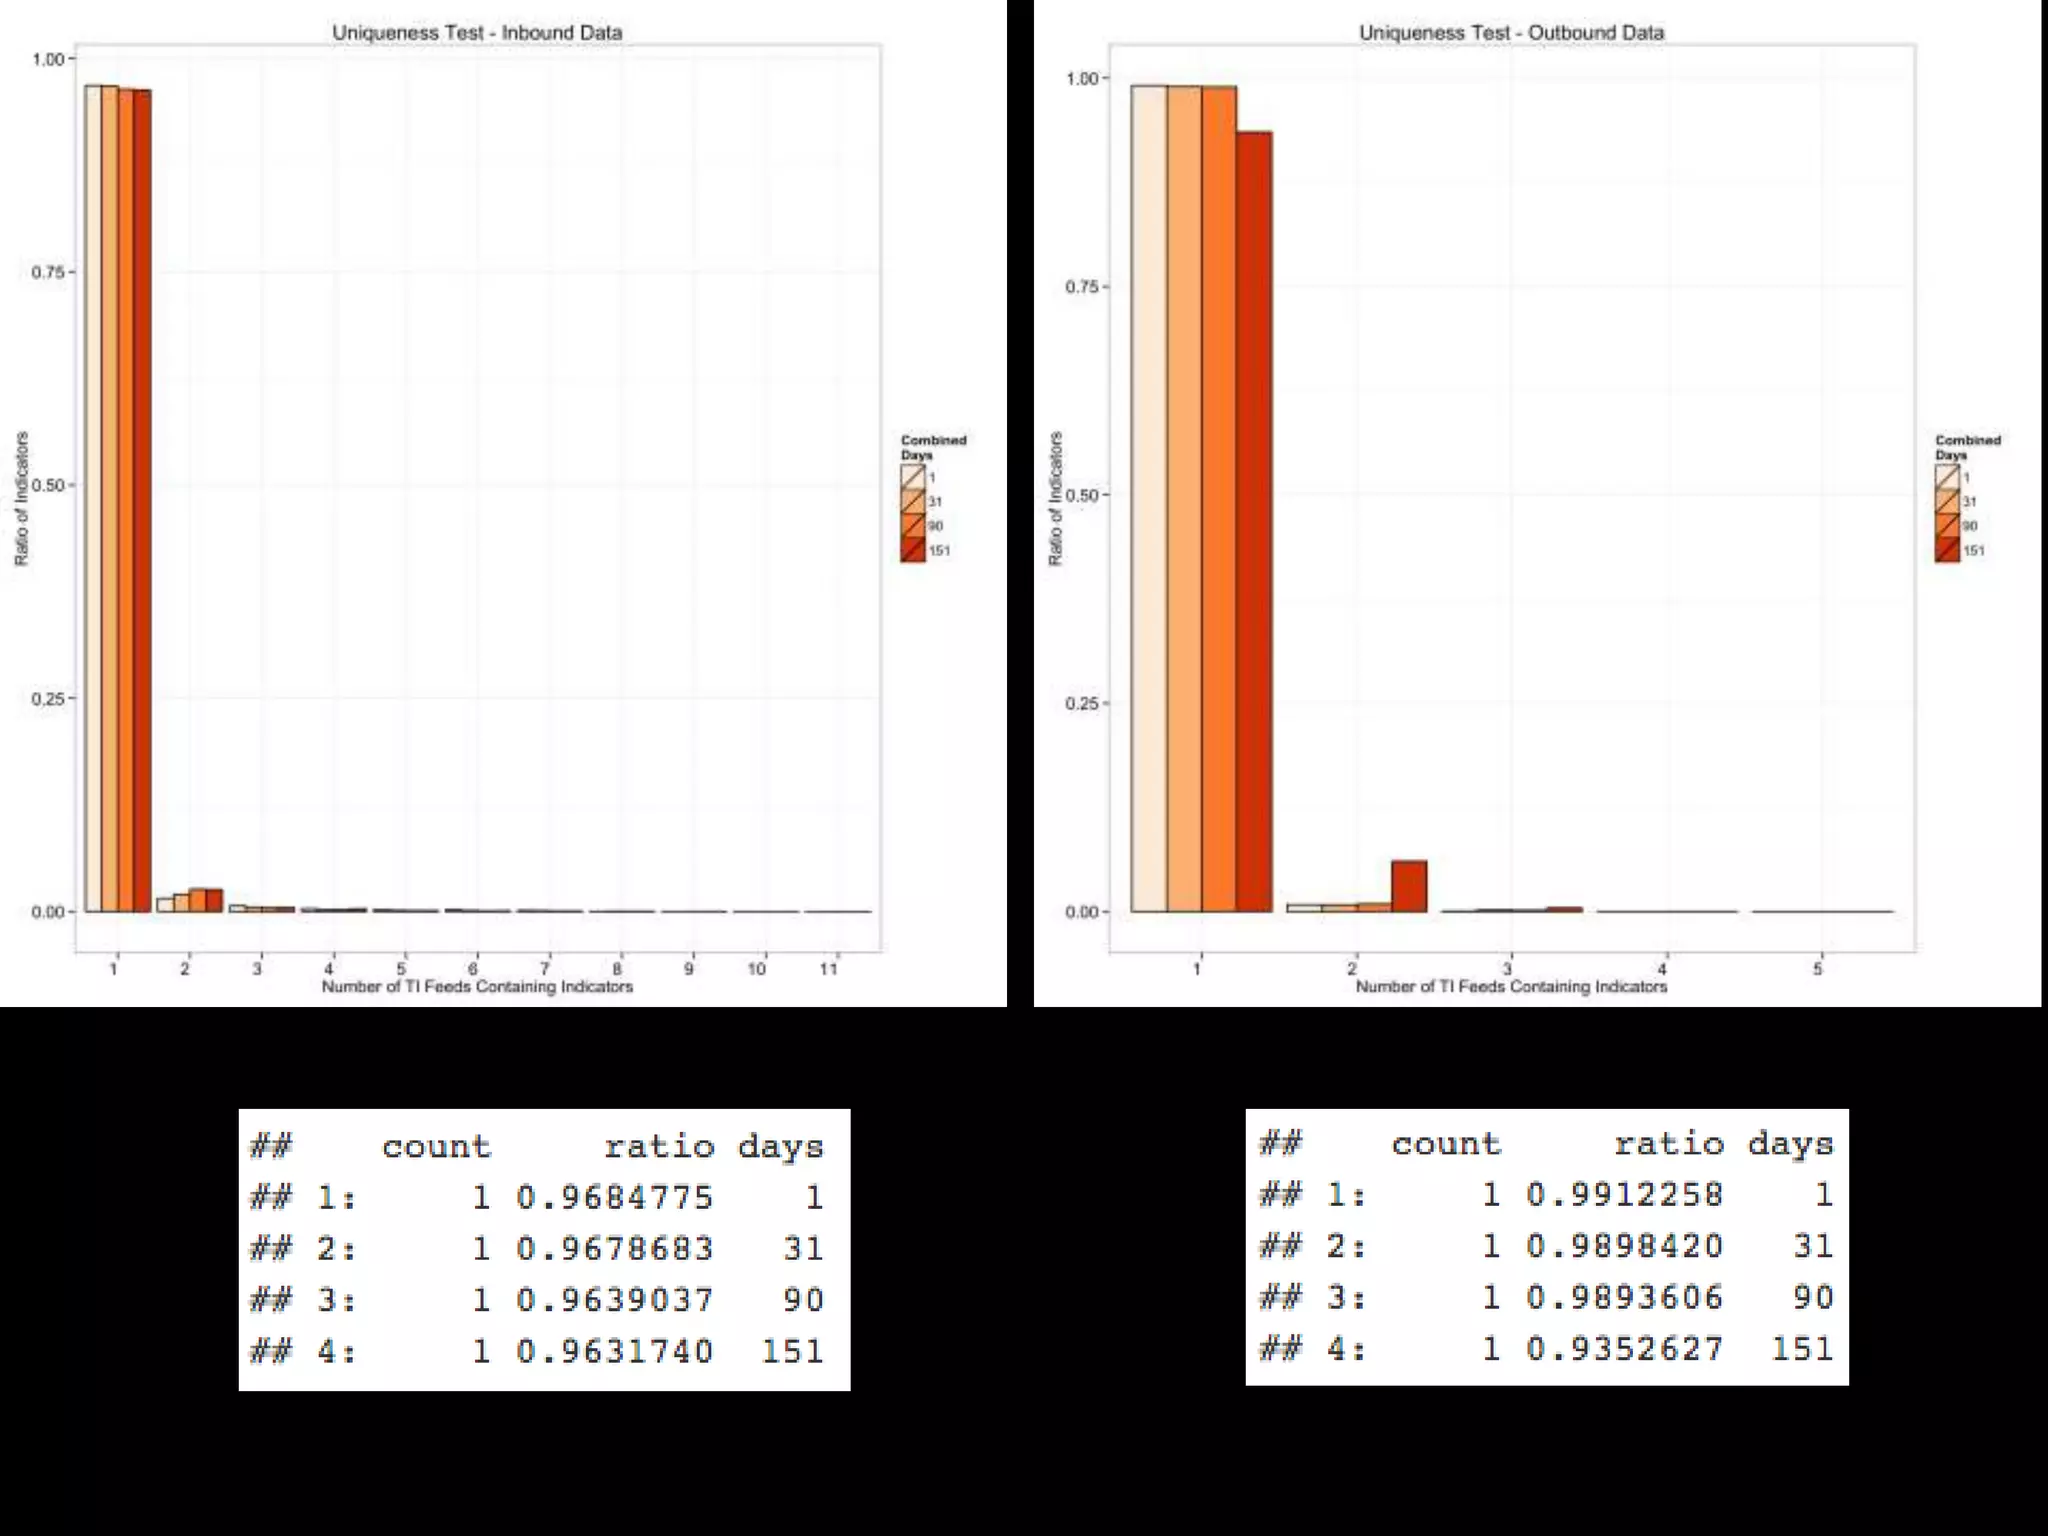
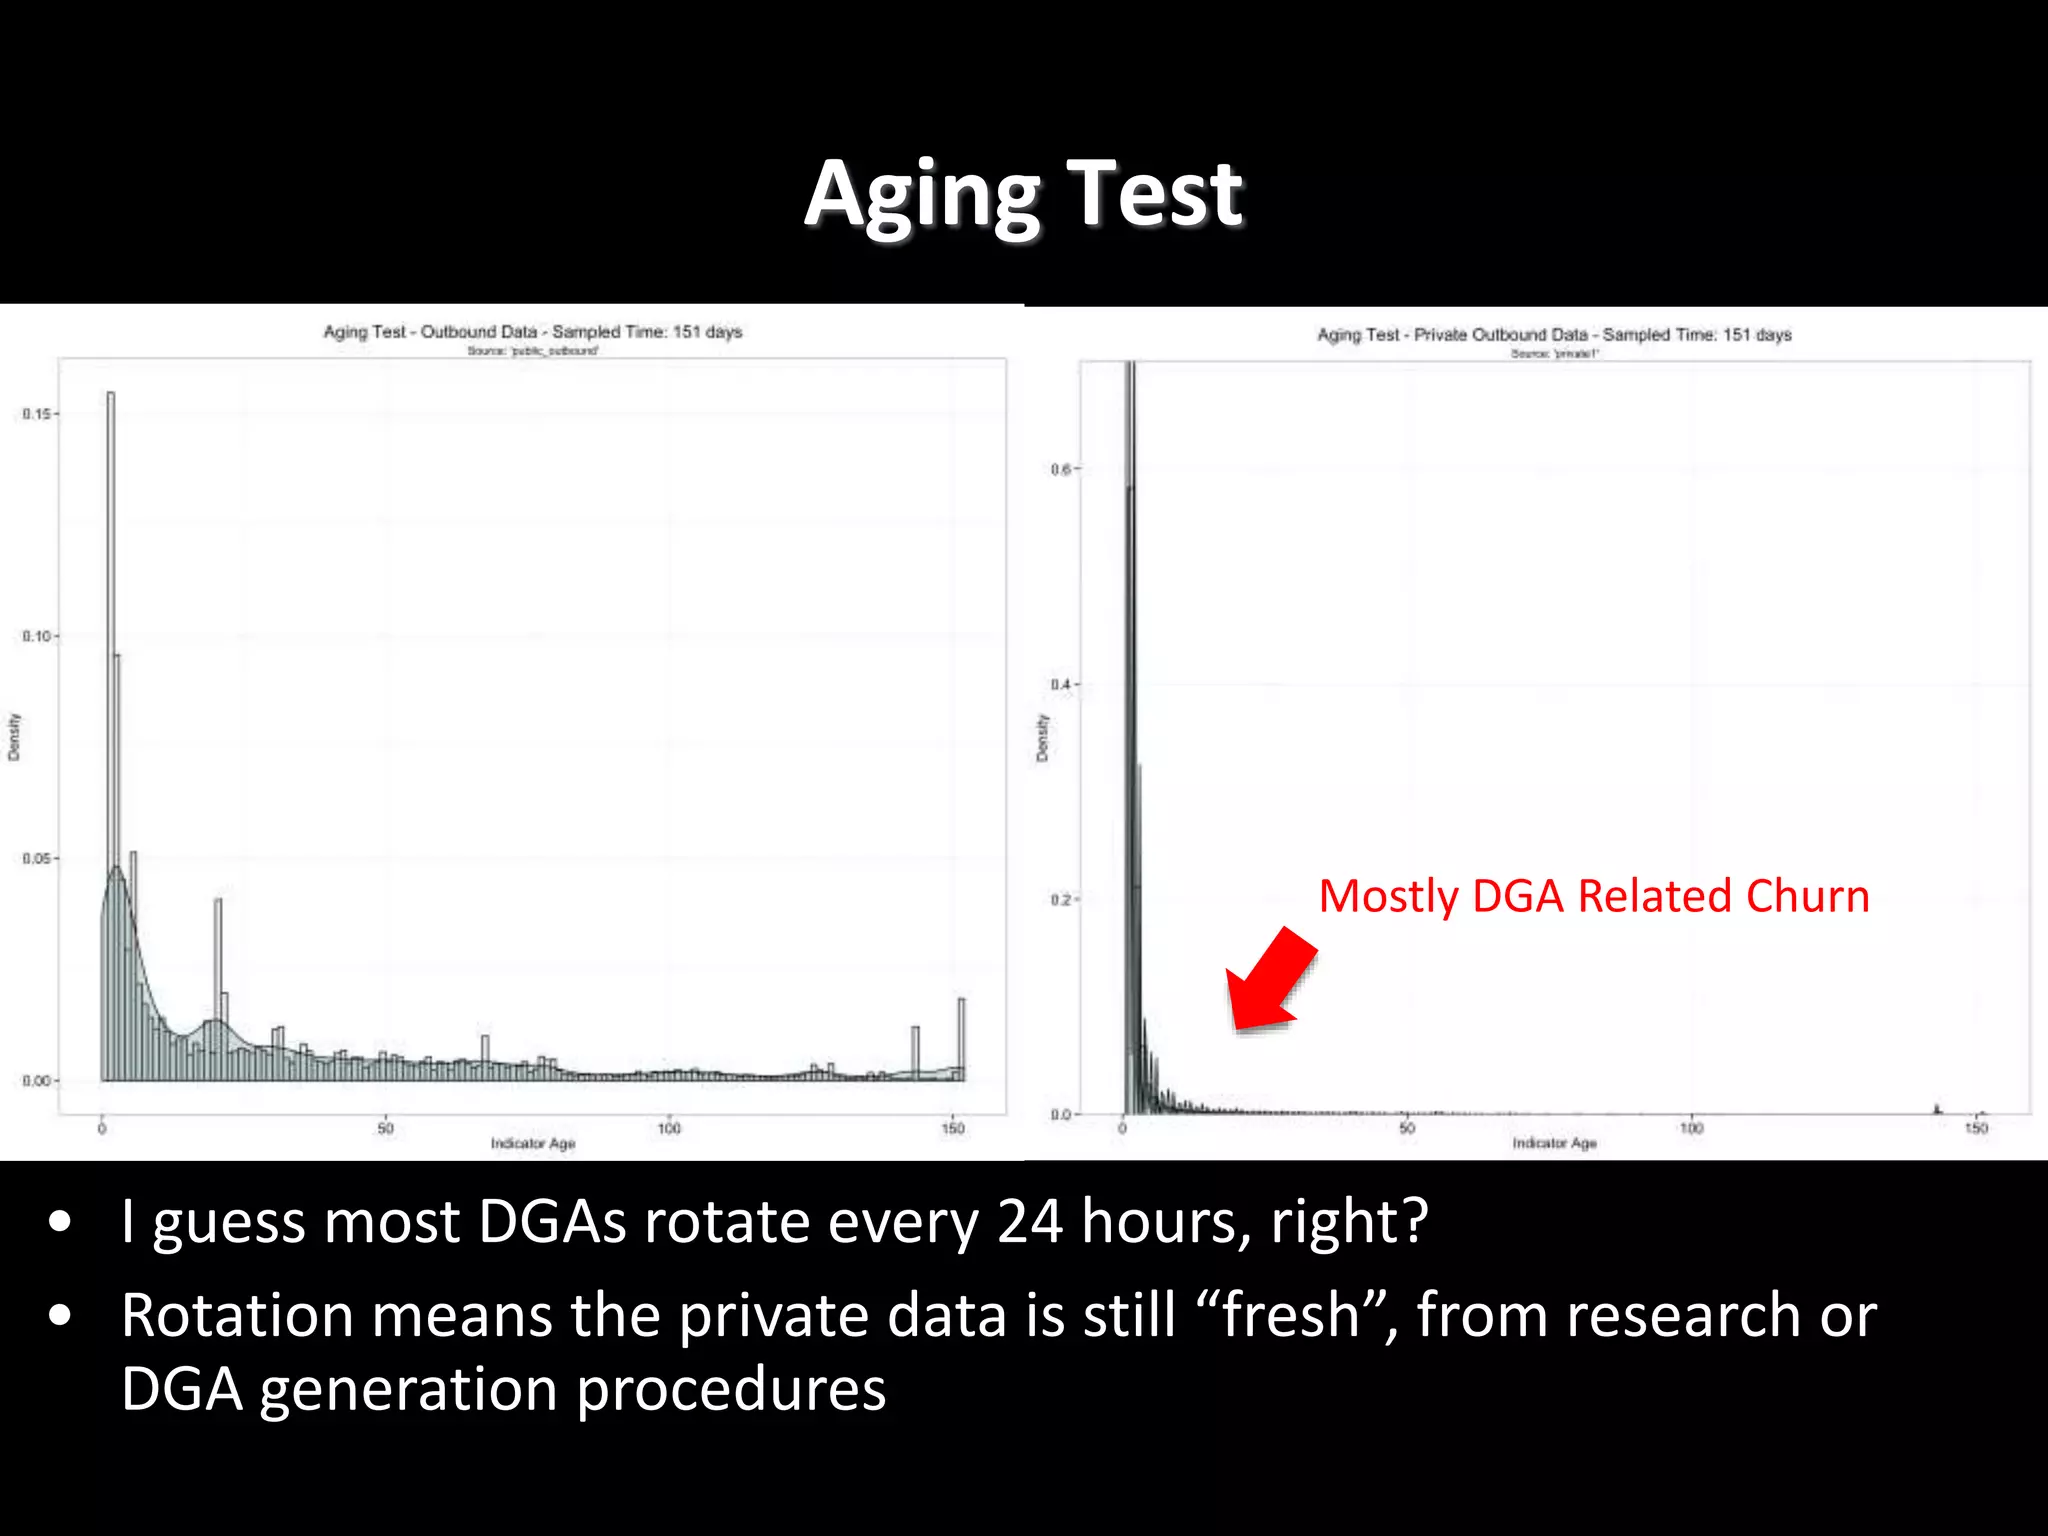
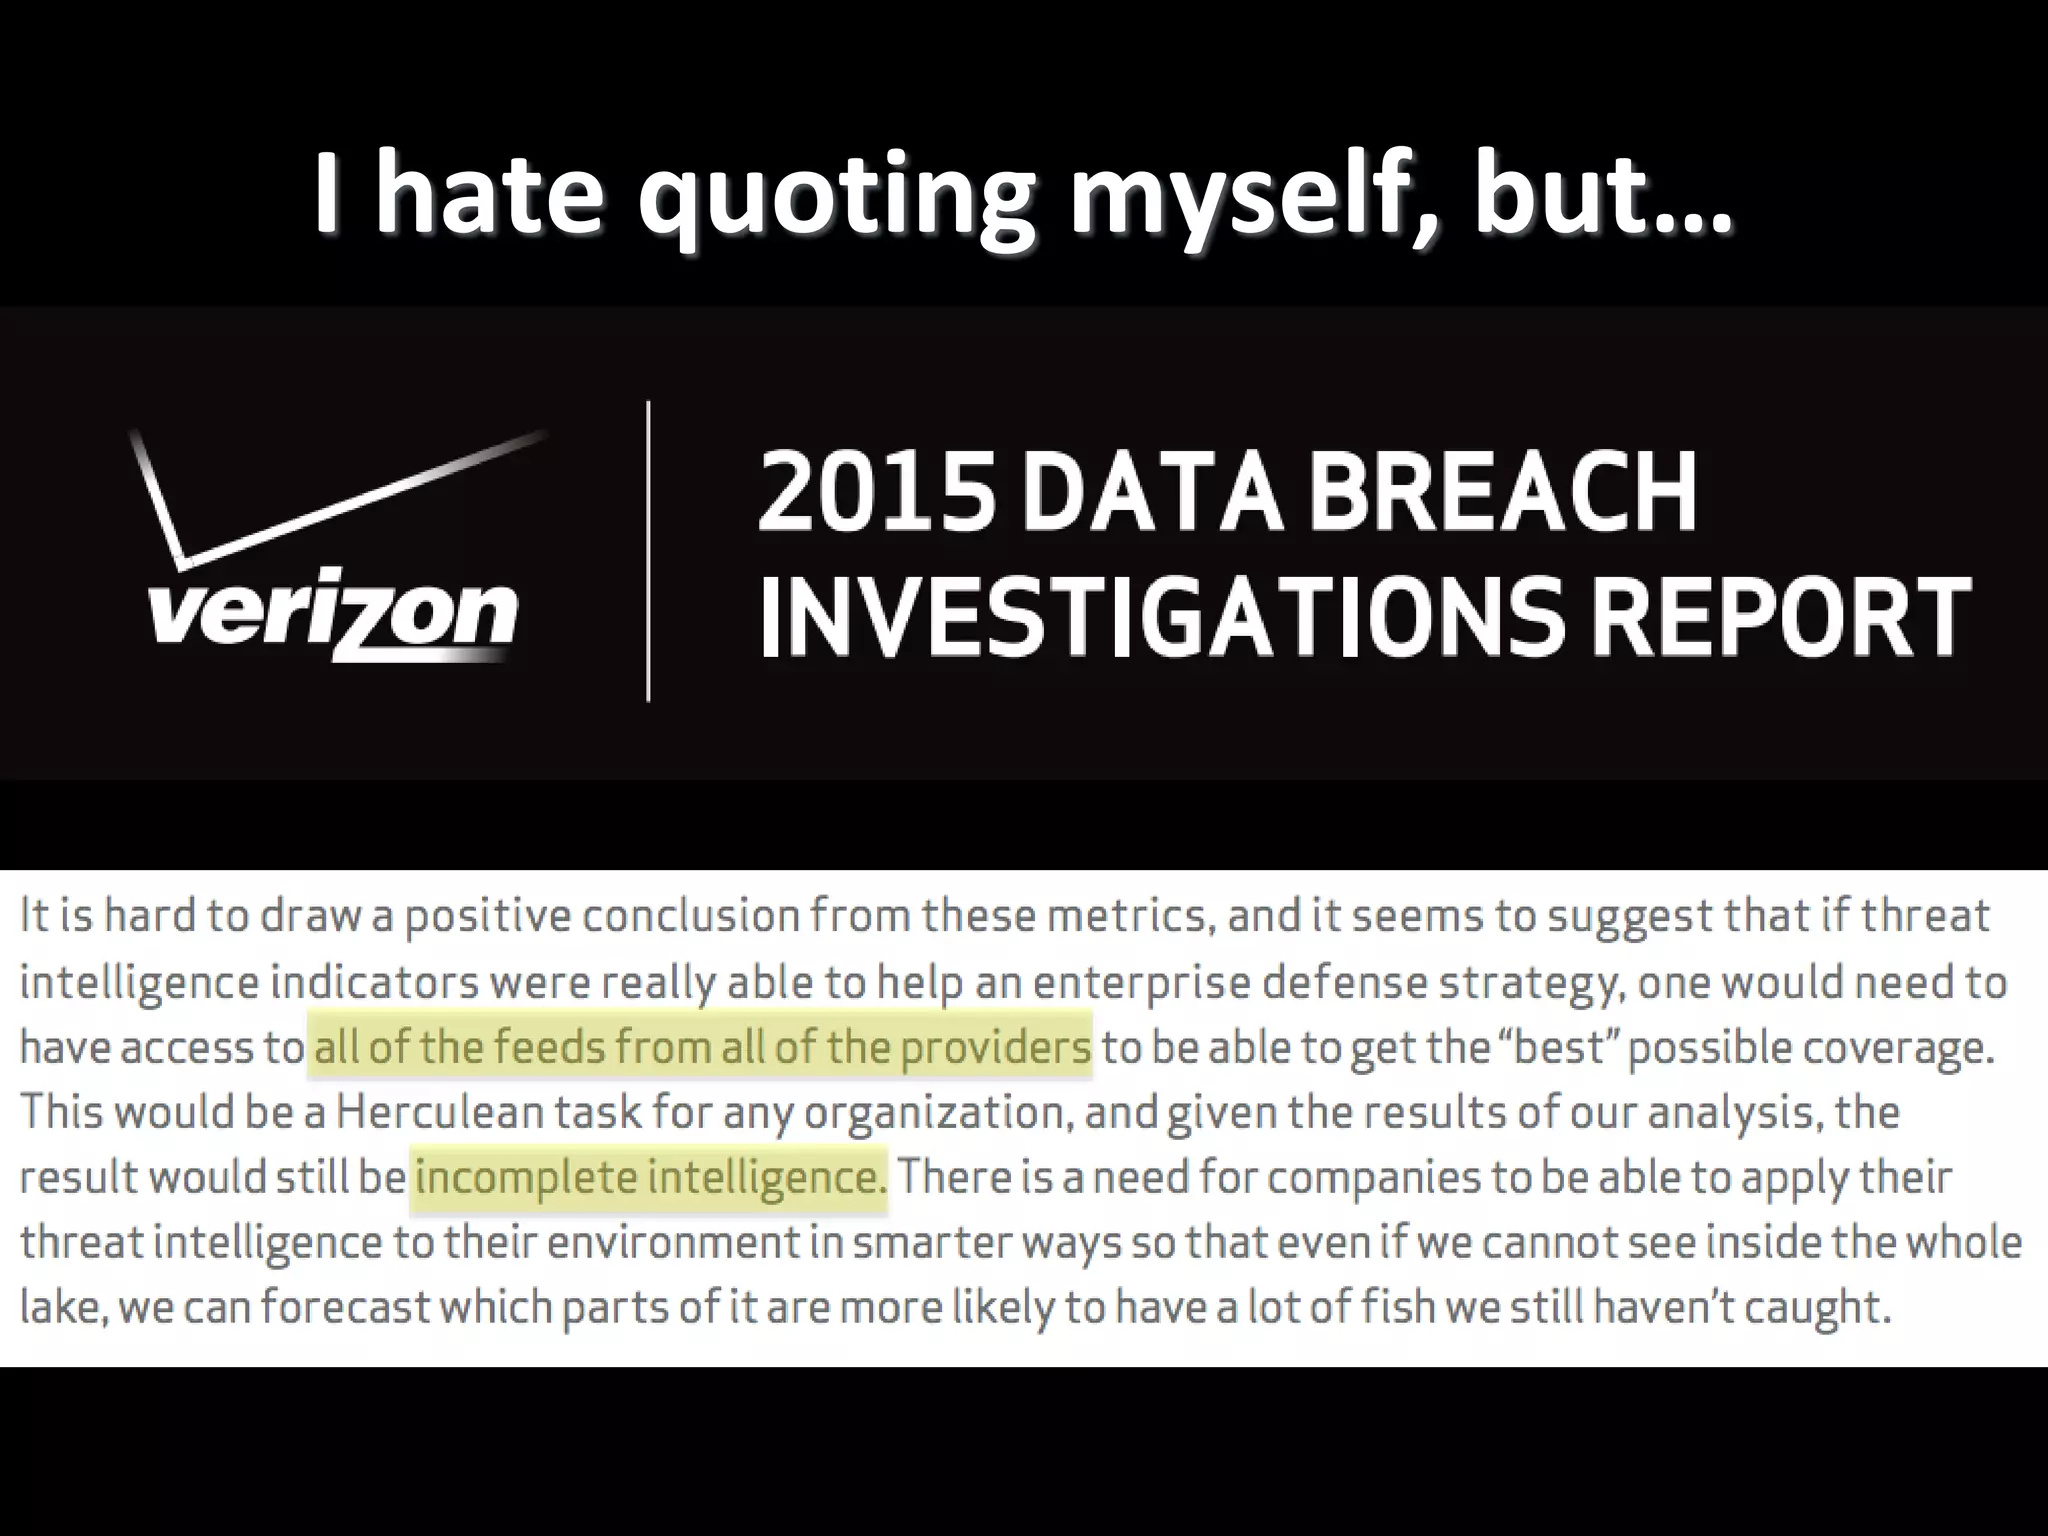
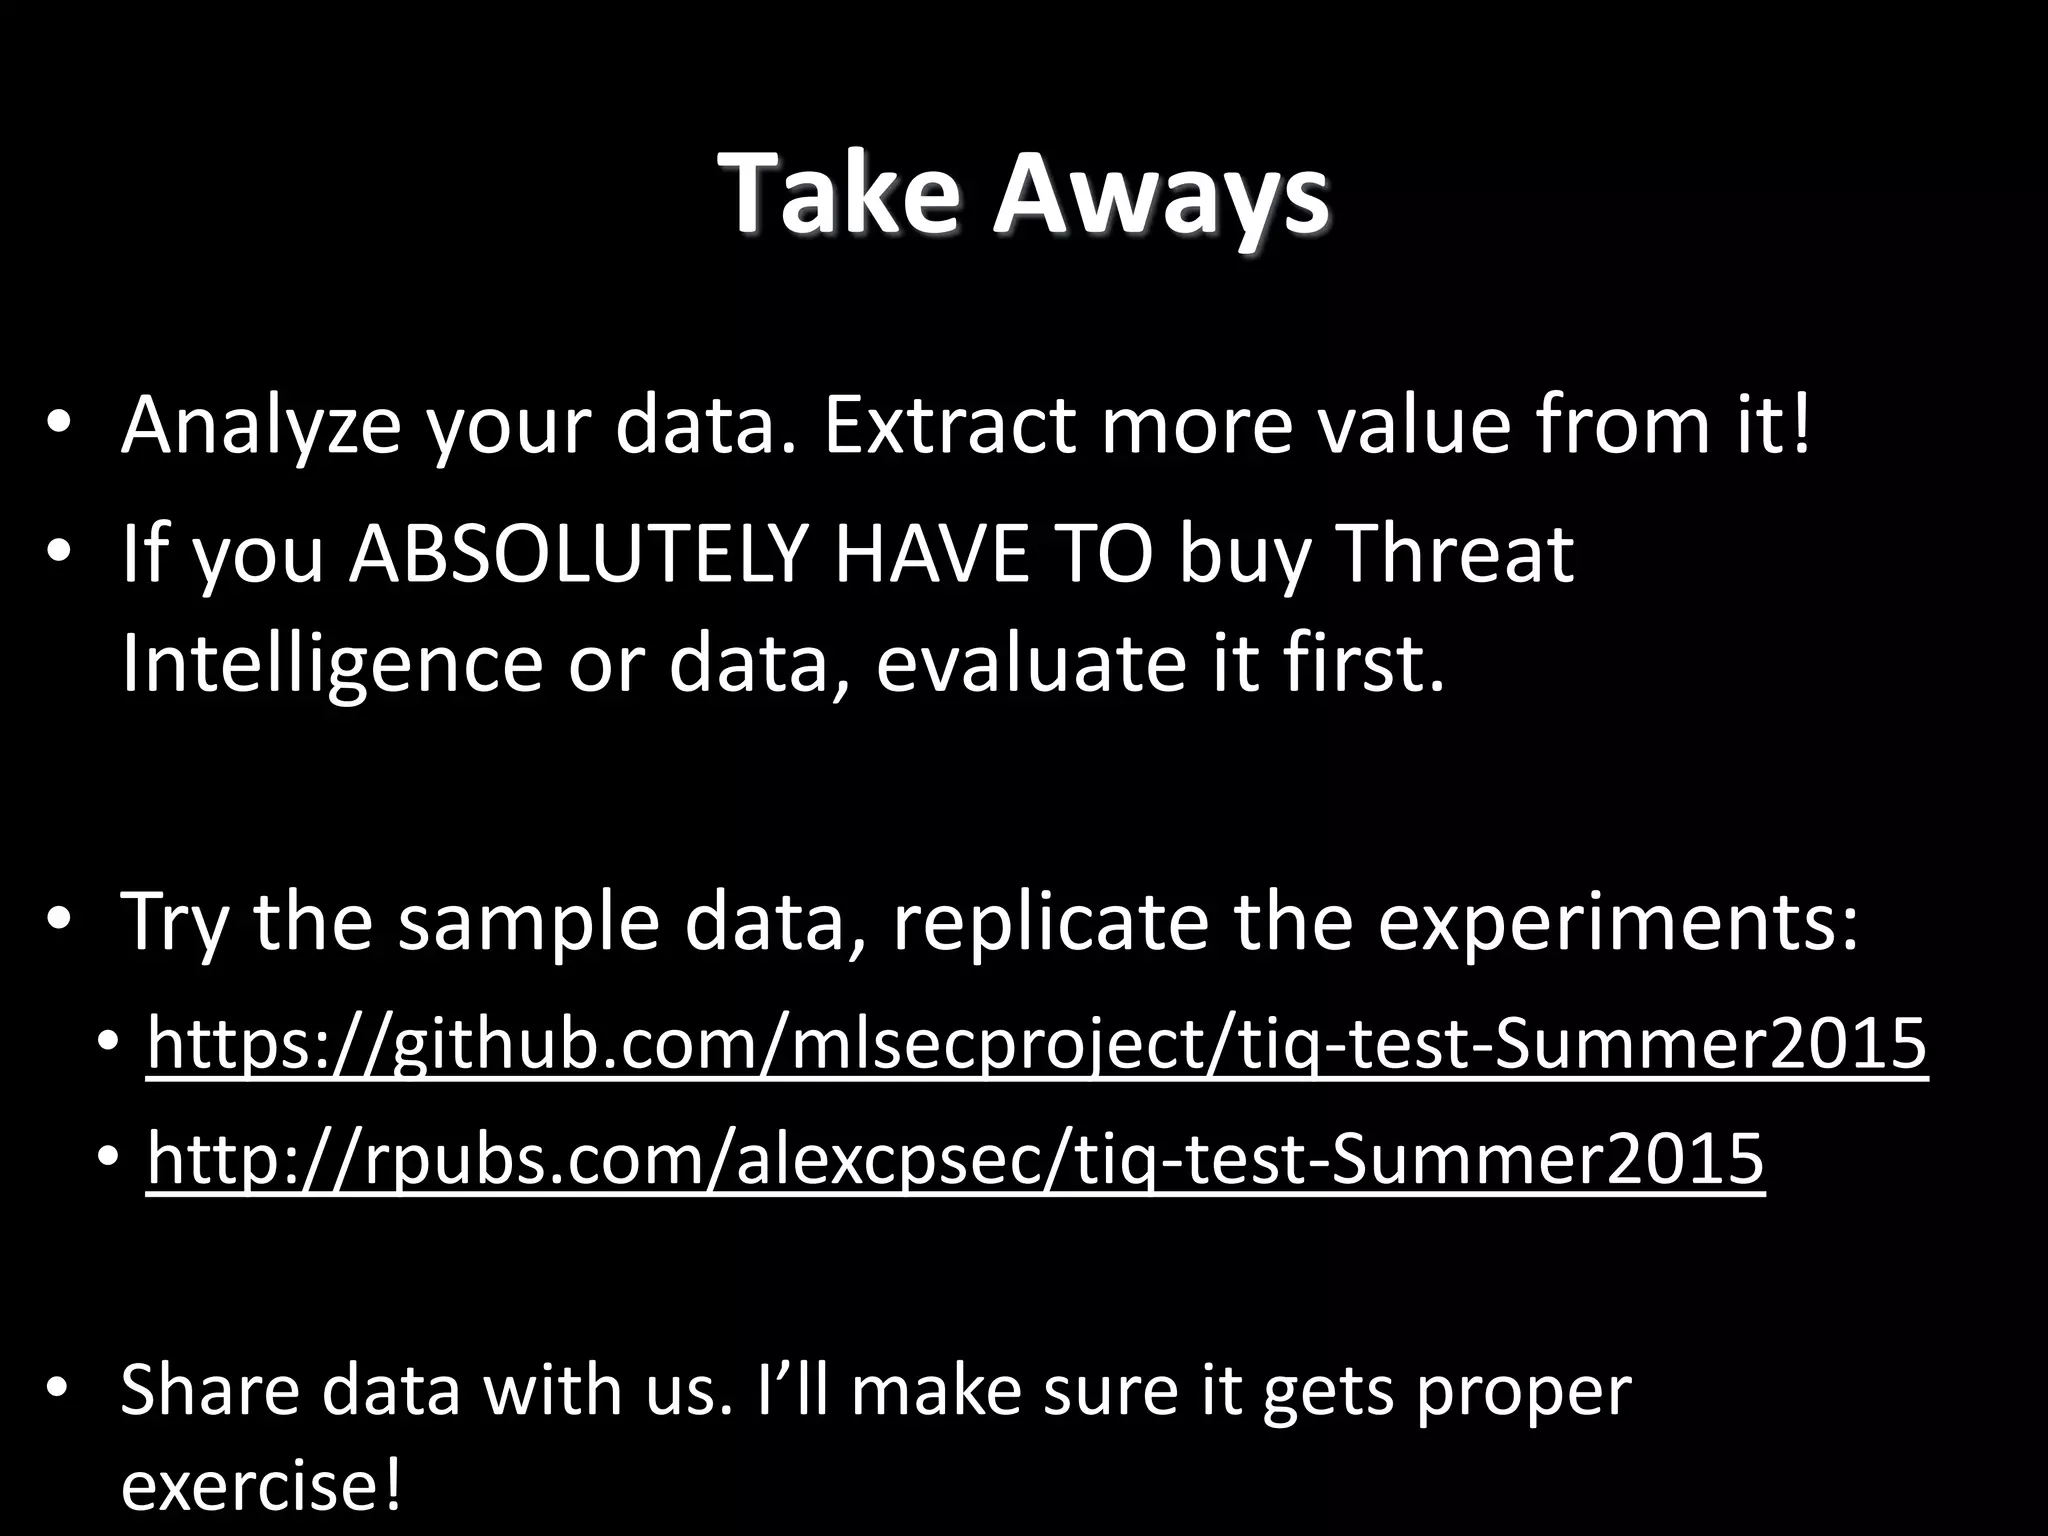
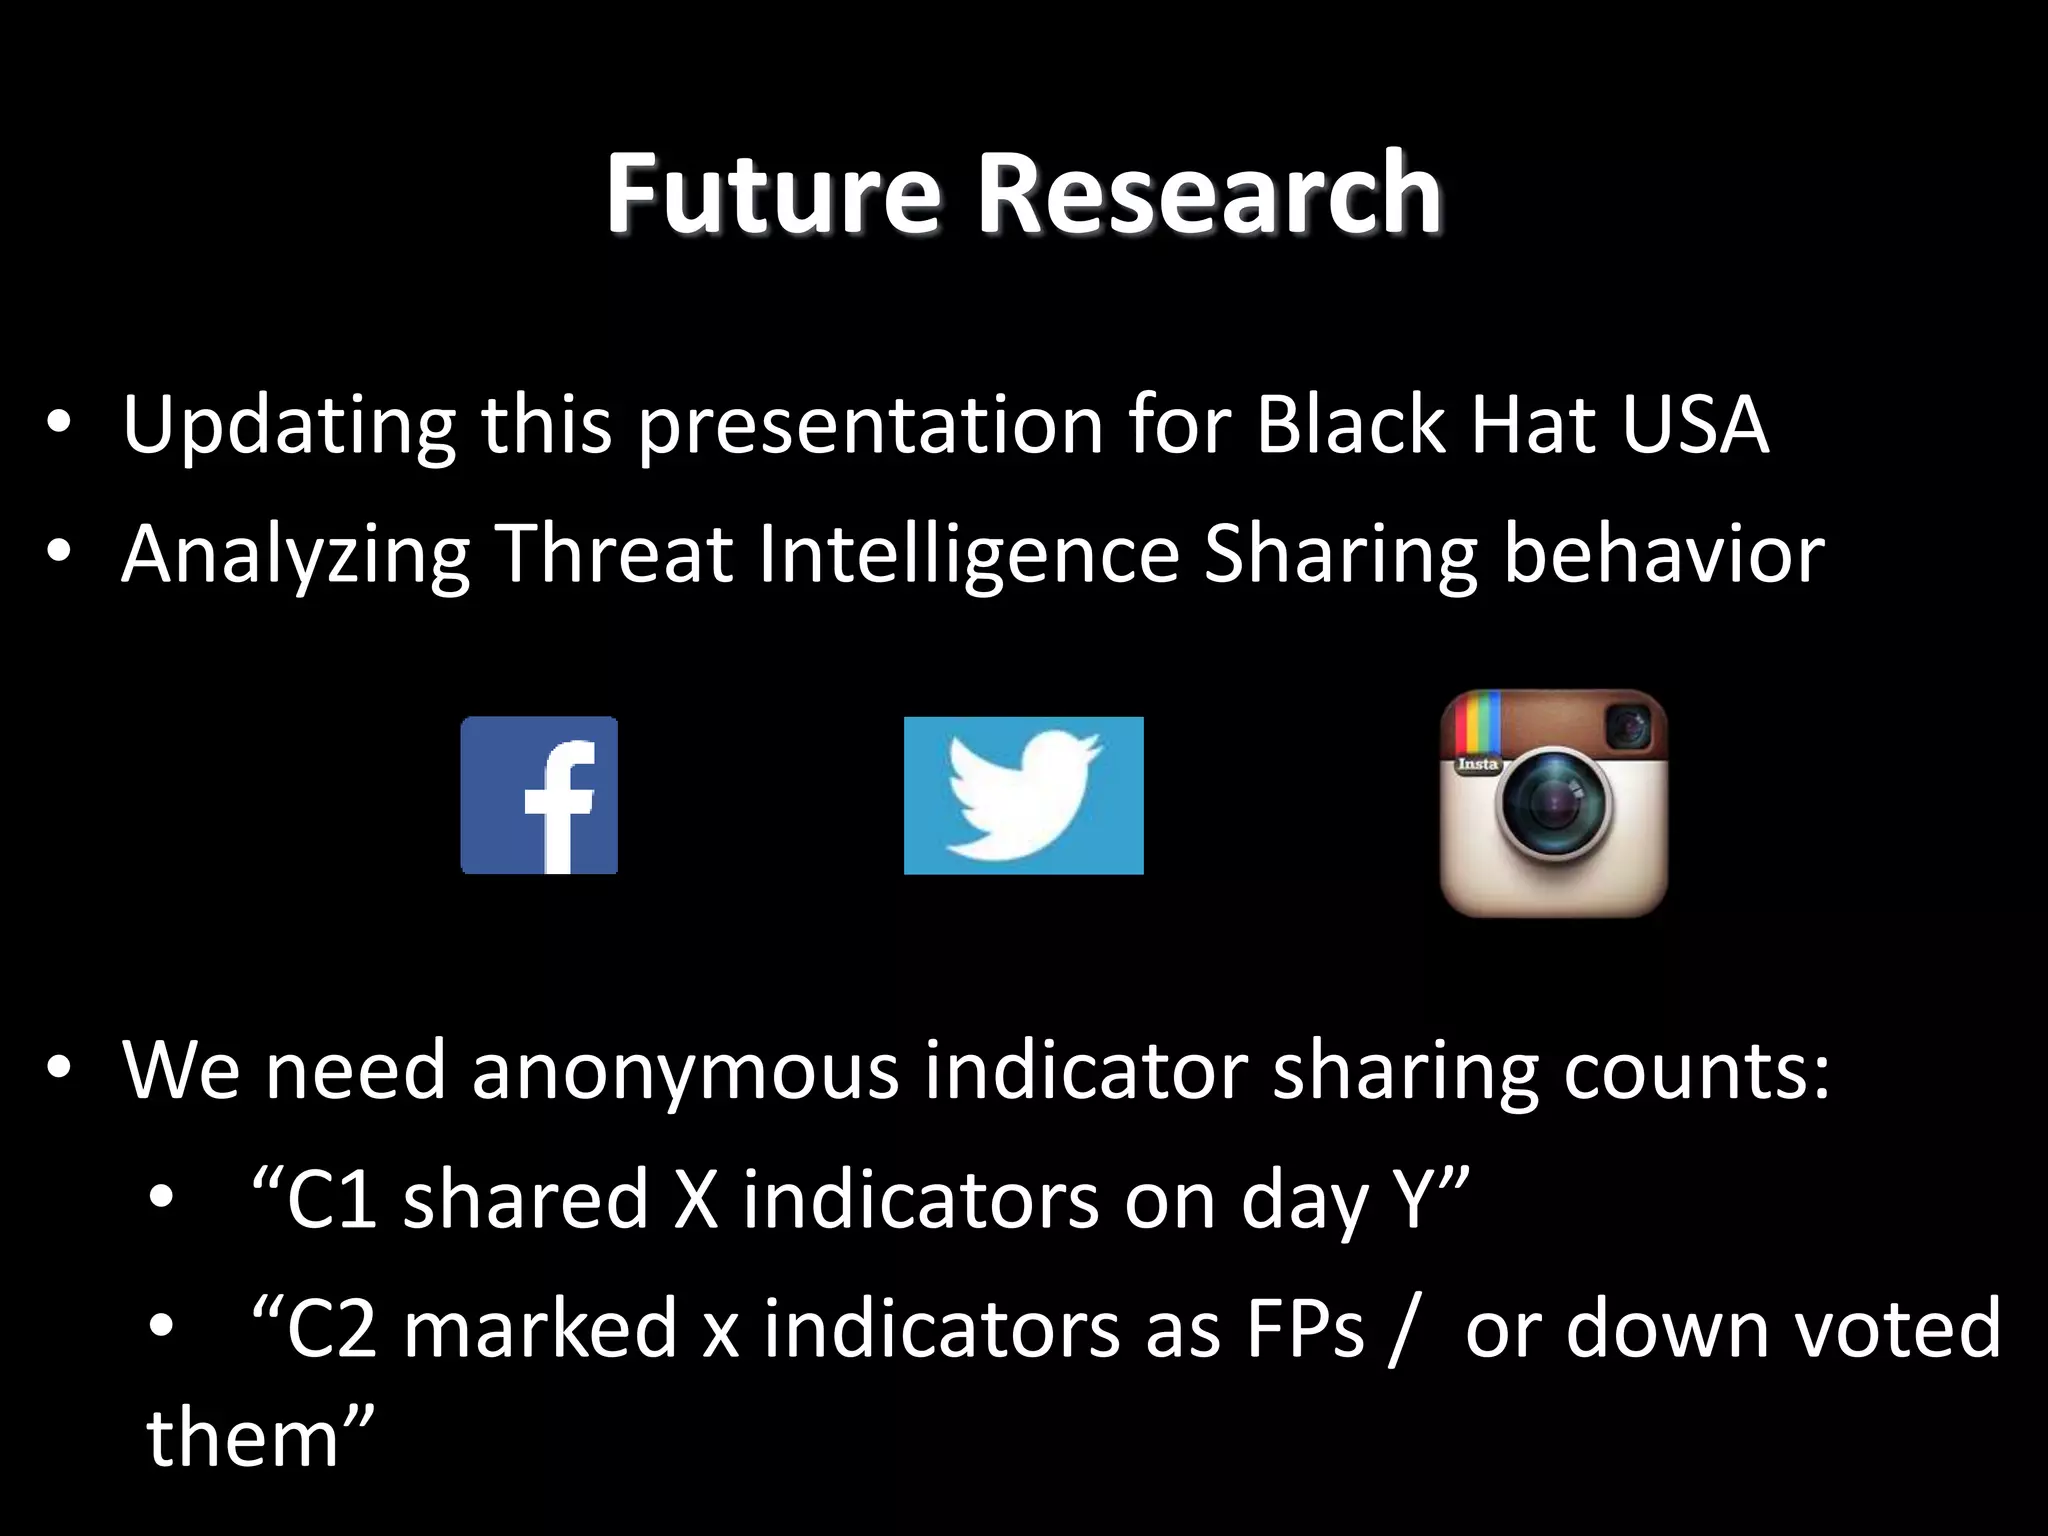
Data-Driven Threat Intelligence: Useful
Methods and Measurements for
Handling Indicators (#ddti)
Alex Pinto
Chief Data Scientist
Niddel / MLSec Project
@alexcpsec
@MLSecProject
Alexandre Sieira
CTO
Niddel
@AlexandreSieira
@NiddelCorp
MLSec Project / Niddel
• MLSec Project – research-focused branch of Niddel for open-
source tools and community building
• Niddel builds Magnet, the Applied Threat Intelligence Platform
focused on detecting breaches and malware activity
• Looking for trial prospects and research collaboration
• More info at:
• niddel.com
• mlsecproject.org
• Cyber War… Threat Intel – What is it good for?
• Combine and TIQ-test
• Using TIQ-test
• Dataset description
• Tests and more tests
• Use case: Feed Comparison
• Future research direction
Agenda
What is TI good for (1) Attribution
What is TI good for anyway?
TY to @bfist for his work on http://sony.attributed.to
What is TI good for (2) – Cyber Maps!!
TY to @hrbrmstr for his work on
https://github.com/hrbrmstr/pewpew
What is TI good for anyway?
• (3) How about actual defense?
• Strategic and tactical: planning
• Technical indicators: DFIR and monitoring
Affirming the Consequent Fallacy
1. If A, then B.
2. B.
3. Therefore, A.
1. Evil malware talks to 8.8.8.8.
2. I see traffic to 8.8.8.8.
3. ZOMG, APT!!!
Combine and TIQ-Test
• Combine (https://github.com/mlsecproject/combine)
• Gathers TI data (ip/host) from Internet and local files
• Normalizes the data and enriches it (AS / Geo / pDNS)
• Can export to CSV, “tiq-test format” and CRITs
• Coming Soon™: CybOX / STIX / SILK /ArcSight CEF
• TIQ-Test (https://github.com/mlsecproject/tiq-test)
• Runs statistical summaries and tests on TI feeds
• Generates charts based on the tests and summaries
• Written in R (because you should learn a stat language)
Using TIQ-TEST
• Available tests and statistics:
• NOVELTY – How often do they update themselves?
• AGING – How long does an indicator sit on a feed?
• POPULATION – How does this population distribution
compare to another one?
• OVERLAP – How do they compare to what you got?
• UNIQUENESS – How many indicators are found in only
one feed?
• https://github.com/mlsecproject/tiq-test-Summer2015
Using TIQ-TEST – Feeds Selected
• Dataset was separated into “inbound” and “outbound”
TY to @kafeine and John Bambenek for access to their feeds
Using TIQ-TEST – Data Prep
• Extract the “raw” information from indicator feeds
• Both IP addresses and hostnames were extracted
Using TIQ-TEST – Data Prep
• Convert the hostname data to IP addresses:
• Active IP addresses for the respective date (“A” query)
• Passive DNS from Farsight Security (DNSDB)
• For each IP record (including the ones from hostnames):
• Add asnumber and asname (from MaxMind ASN DB)
• Add country (from MaxMind GeoLite DB)
• Add rhost (again from DNSDB) – most popular “PTR”
Using TIQ-TEST – Data Prep Done
Novelty Test
Measuring added and dropped
indicators
Novelty Test - Inbound
Aging Test
Is anyone cleaning this mess up
eventually?
INBOUND
OUTBOUND
Population Test
• Let us use the ASN and
GeoIP databases that we
used to enrich our data as a
reference of the “true”
population.
• But, but, human beings are
unpredictable! We will
never be able to forecast
this!
Is your sampling poll as random as
you think?
Can we get a better look?
• Statistical inference-based comparison models
(hypothesis testing)
• Exact binomial tests (when we have the “true” pop)
• Chi-squared proportion tests (similar to
independence tests)
Overlap Test
More data can be better, but make
sure it is not the same data
Overlap Test - Inbound
Overlap Test - Outbound
Uniqueness Test
Uniqueness Test
• “Domain-based indicators are unique to one list between 96.16% and
97.37%”
• “IP-based indicators are unique to one list between 82.46% and
95.24% of the time”
Intermission
• “You Data Scientists and your
algorithms, how quaint.”
• “Why aren’t you doing some
useful research like nation-state
attribution?”
OPTION 1: Cool Story, Bro!
OPTION 2: How can I use this
awesomeness on my data?
• How about using TIQ-TEST to evaluate a private intel feed?
• Trying stuff before you buy is usually a good idea. Just sayin’
• Let’s compare a new feed, “private1”, against our combined
outbound indicators
Use Case: Comparing Private Feeds
Population Test
Population Test
Population Test
Aging Test
• I guess most DGAs rotate every 24 hours, right?
• Rotation means the private data is still “fresh”, from research or
DGA generation procedures
Mostly DGA Related Churn
A++ WOULD
THREAT INTEL
AGAIN
(or would I?)
I hate quoting myself, but…
Take Aways
• Analyze your data. Extract more value from it!
• If you ABSOLUTELY HAVE TO buy Threat
Intelligence or data, evaluate it first.
• Try the sample data, replicate the experiments:
• https://github.com/mlsecproject/tiq-test-Summer2015
• http://rpubs.com/alexcpsec/tiq-test-Summer2015
• Share data with us. I’ll make sure it gets proper
exercise!
Future Research
• Updating this presentation for Black Hat USA
• Analyzing Threat Intelligence Sharing behavior
• We need anonymous indicator sharing counts:
• “C1 shared X indicators on day Y”
• “C2 marked x indicators as FPs / or down voted
them”
Thanks!
• Q&A?
• Feedback!
”The measure of intelligence is the ability to change."
- Albert Einstein
Alex Pinto
@alexcpsec
@MLSecProject
@NiddelCorp
Alexandre Sieira
@AlexandreSieira
@MLSecProject
@NiddelCorp

Data-Driven Threat Intelligence: Useful Methods and Measurements for Handling Indicators

  • 1.
    Data-Driven Threat Intelligence:Useful Methods and Measurements for Handling Indicators (#ddti) Alex Pinto Chief Data Scientist Niddel / MLSec Project @alexcpsec @MLSecProject Alexandre Sieira CTO Niddel @AlexandreSieira @NiddelCorp
  • 2.
    MLSec Project /Niddel • MLSec Project – research-focused branch of Niddel for open- source tools and community building • Niddel builds Magnet, the Applied Threat Intelligence Platform focused on detecting breaches and malware activity • Looking for trial prospects and research collaboration • More info at: • niddel.com • mlsecproject.org
  • 3.
    • Cyber War…Threat Intel – What is it good for? • Combine and TIQ-test • Using TIQ-test • Dataset description • Tests and more tests • Use case: Feed Comparison • Future research direction Agenda
  • 4.
    What is TIgood for (1) Attribution
  • 5.
    What is TIgood for anyway? TY to @bfist for his work on http://sony.attributed.to
  • 6.
    What is TIgood for (2) – Cyber Maps!! TY to @hrbrmstr for his work on https://github.com/hrbrmstr/pewpew
  • 7.
    What is TIgood for anyway? • (3) How about actual defense? • Strategic and tactical: planning • Technical indicators: DFIR and monitoring
  • 8.
    Affirming the ConsequentFallacy 1. If A, then B. 2. B. 3. Therefore, A. 1. Evil malware talks to 8.8.8.8. 2. I see traffic to 8.8.8.8. 3. ZOMG, APT!!!
  • 9.
    Combine and TIQ-Test •Combine (https://github.com/mlsecproject/combine) • Gathers TI data (ip/host) from Internet and local files • Normalizes the data and enriches it (AS / Geo / pDNS) • Can export to CSV, “tiq-test format” and CRITs • Coming Soon™: CybOX / STIX / SILK /ArcSight CEF • TIQ-Test (https://github.com/mlsecproject/tiq-test) • Runs statistical summaries and tests on TI feeds • Generates charts based on the tests and summaries • Written in R (because you should learn a stat language)
  • 10.
    Using TIQ-TEST • Availabletests and statistics: • NOVELTY – How often do they update themselves? • AGING – How long does an indicator sit on a feed? • POPULATION – How does this population distribution compare to another one? • OVERLAP – How do they compare to what you got? • UNIQUENESS – How many indicators are found in only one feed?
  • 11.
  • 13.
    Using TIQ-TEST –Feeds Selected • Dataset was separated into “inbound” and “outbound” TY to @kafeine and John Bambenek for access to their feeds
  • 14.
    Using TIQ-TEST –Data Prep • Extract the “raw” information from indicator feeds • Both IP addresses and hostnames were extracted
  • 15.
    Using TIQ-TEST –Data Prep • Convert the hostname data to IP addresses: • Active IP addresses for the respective date (“A” query) • Passive DNS from Farsight Security (DNSDB) • For each IP record (including the ones from hostnames): • Add asnumber and asname (from MaxMind ASN DB) • Add country (from MaxMind GeoLite DB) • Add rhost (again from DNSDB) – most popular “PTR”
  • 16.
    Using TIQ-TEST –Data Prep Done
  • 17.
    Novelty Test Measuring addedand dropped indicators
  • 18.
  • 19.
    Aging Test Is anyonecleaning this mess up eventually?
  • 20.
  • 21.
  • 22.
    Population Test • Letus use the ASN and GeoIP databases that we used to enrich our data as a reference of the “true” population. • But, but, human beings are unpredictable! We will never be able to forecast this!
  • 24.
    Is your samplingpoll as random as you think?
  • 25.
    Can we geta better look? • Statistical inference-based comparison models (hypothesis testing) • Exact binomial tests (when we have the “true” pop) • Chi-squared proportion tests (similar to independence tests)
  • 27.
    Overlap Test More datacan be better, but make sure it is not the same data
  • 28.
  • 29.
  • 30.
  • 31.
    Uniqueness Test • “Domain-basedindicators are unique to one list between 96.16% and 97.37%” • “IP-based indicators are unique to one list between 82.46% and 95.24% of the time”
  • 33.
  • 34.
    • “You DataScientists and your algorithms, how quaint.” • “Why aren’t you doing some useful research like nation-state attribution?” OPTION 1: Cool Story, Bro!
  • 35.
    OPTION 2: Howcan I use this awesomeness on my data?
  • 36.
    • How aboutusing TIQ-TEST to evaluate a private intel feed? • Trying stuff before you buy is usually a good idea. Just sayin’ • Let’s compare a new feed, “private1”, against our combined outbound indicators Use Case: Comparing Private Feeds
  • 37.
  • 38.
  • 39.
  • 40.
    Aging Test • Iguess most DGAs rotate every 24 hours, right? • Rotation means the private data is still “fresh”, from research or DGA generation procedures Mostly DGA Related Churn
  • 43.
  • 44.
    I hate quotingmyself, but…
  • 45.
    Take Aways • Analyzeyour data. Extract more value from it! • If you ABSOLUTELY HAVE TO buy Threat Intelligence or data, evaluate it first. • Try the sample data, replicate the experiments: • https://github.com/mlsecproject/tiq-test-Summer2015 • http://rpubs.com/alexcpsec/tiq-test-Summer2015 • Share data with us. I’ll make sure it gets proper exercise!
  • 46.
    Future Research • Updatingthis presentation for Black Hat USA • Analyzing Threat Intelligence Sharing behavior • We need anonymous indicator sharing counts: • “C1 shared X indicators on day Y” • “C2 marked x indicators as FPs / or down voted them”
  • 48.
    Thanks! • Q&A? • Feedback! ”Themeasure of intelligence is the ability to change." - Albert Einstein Alex Pinto @alexcpsec @MLSecProject @NiddelCorp Alexandre Sieira @AlexandreSieira @MLSecProject @NiddelCorp

Editor's Notes

  • #4 During this presentation I’ll be making a quick introduction on some important concepts and our views on what threat intelligence is and the many useful things that can and cannot be done with it. Then, Mr. Pinto will present a couple of open source tools made available at the MLSec Project GitHub repository and an analysis of the metrics we gathered from a set of publicly available and private threat intelligence feeds.
  • #5 Based on what you read on the media and one some online marketing material, attribution is one of the sexiest parts about threat intelligence. If you understand your adversaries, their intent and capabilities, there is a lot you can do within your risk management and even business decisions to better prepare yourself. However, if you want to be realistic you’ll have to admit that as in the case demonstrated here, attribution is really hard to do. This reflects both on the cost of of getting good CTI data with attribution. Also it is not reasonable to expect that any significant proportion of attacks out there will be attributed at all, given the sheer amount of smaller threat actors out there.
  • #6 This is beautifully illustrated by the Sony breach controversy. So data science to the rescue! The good humored sony.attributed.to website creates plausible attribution reports for the Sony hack. It is based on data sampled from actual attacks data in the VERIS and DBIR databases consistent with how frequently threat actors, locations and methods are actually used.
  • #7 One other really common application of threat intelligence is building a threat map. After all, how else will upper management know that your team really has what it takes to prevent pandas, bears and even maybe capybaras from infiltrating your networks? Who knows what those samba-dancing Brazilian hackers are up to, after all? Fear not, now there’s an open source threat map that you can use called Pew pew. And you don’t even need to stand up your own honeypots. Pew pew displays plausible attack patterns that are sampled randomly from public data made available by Arbor Networks. So it is exactly as useful as the real thing.
  • #8 But seriously, what about using the threat intelligence data to actually defend organizations? The high level data is awesome to help with the high level decisions, of course. However, how do you go about using the technical indicators? It’s straightforward enough to pull a list of IP addresses, domain names and URLs into SIEMs or IDS rules. As Gavin Reid mentioned in his talk yesterday, this can be a great way to reduce the time it takes to detect a novel threat and bypass the detection, rule writing and policy update cycle of your sensors. However, this has to be done with great care.
  • #9 Threat intelligence feeds are mostly providing indicators of things that malware does: for example IP addresses, domain names and URLs they communicate with. Knowing this can be invaluable for all sorts of investigation and forensics activities. But we really believe the holy grail is detection. A breach detection example the fallacy: some malware observed talking to a destination does NOT mean that all communication towards that destination is indicative of malware. Also you need evaluate the quality and the applicability of the indicators you are consuming (and perhaps paying for) to decide which combination of sources is optimal for your organization. Now Mr. Pinto will tell you a bit about two open source projects we develop to help you perform such an evaluation.
  • #11 TESTING THE DATA Population is tricky: - Could mean the entire world (all IPv4 space) - Should ideally mean your world (use your data)
  • #12 2014 was not a leap year 150k outbound 300k inbound 450k X 365 -> 164,250,000 / 165 MILLION
  • #14 28 feeds
  • #16 - For the hostname / domains feeds: - We extracted the "active" IP addresses for those hostnames on the dates they were reported (using pDNS from Farsight Security) - Passive DNS query of active "A" responses on the reported day (from 00:00 to 23:59) - For this experiment, we got rid of "non-public IPs" (localhost, RFC1918) - Then for each IP record (including the ones got above) enrich it with: - asnumber and asname (from MaxMind ASN DB) - country (from MaxMind GeoLite DB) - rhost - the more popular reverse DNS entry ("PTR") from passive DNS on that date
  • #17  - Then for each IP record (including the ones got above) enrich it with: - asnumber and asname (from MaxMind ASN DB) - country (from MaxMind GeoLite DB) - rhost - the more popular reverse DNS entry ("PTR") from passive DNS on that date - we are not playing around with this on this talk, data is too sparse
  • #19 NOVELTY: Always request a trial of the data feed (15/30 days) Measure addition and churn
  • #20 OVERLAP
  • #21 OVERLAP
  • #22 OVERLAP
  • #23 POPULATION: We will use the ASN and GEO databases as our population - They should cover all the existing IPv4 space, give or take a few anomalies With this, we can simulate a draw from this population for people that are going to be attacking us because human beings are unpredictable and will never be able to forecast where the attacks are coming from right? :troll: ----- COUNTRY / ASN (graphs of country proportions on different feeds)
  • #24 Inbound – Turkey WINS! US is highly above the population average, and CN is slightly below
  • #25 ---- HYPOTHESIS TESTING OF PROPORTIONS (explain exact binom test vs. Chi-squared)
  • #26 ---- HYPOTHESIS TESTING OF PROPORTIONS (explain exact binom test vs. Chi-squared)
  • #27 -> Explain the diferences - These differences describe a higher probability of specific actors targeting you from specific locations (GEO/ASN) in relation to a completely random actor. - Was one of the 1st features I used for MLSec
  • #31 Get 100 fish in a pond Tag all Get 100 more fish – how many were tagged? 5?-> 20x more fish
  • #34 Intermission