Download as PDF, PPTX
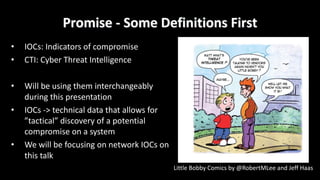


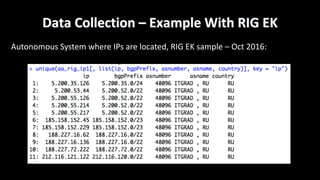
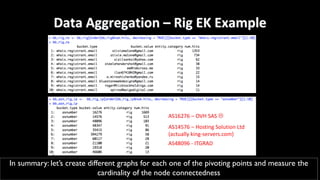
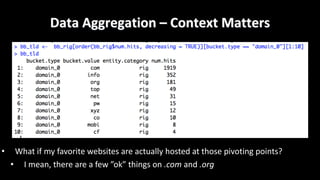
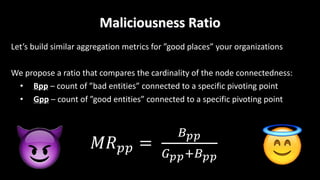
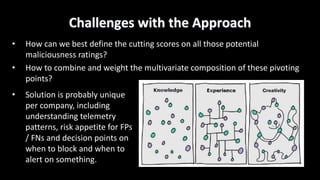

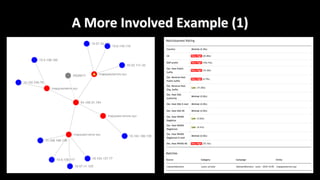
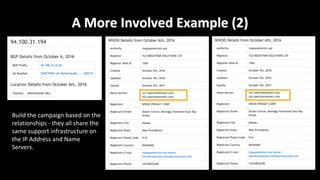


This document discusses applying data science techniques to indicator of compromise (IOC)-based detection. It describes challenges with using IOCs, including quality issues and high volume. The document proposes using data enrichment and aggregation to identify relationships between IOCs and measure their "maliciousness ratio" and "rating". This provides context to better determine if an IOC represents a true compromise. The approach aims to make threat intelligence more useful at scale.