Download as PDF, PPTX
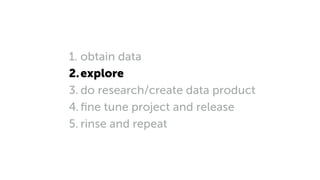
![What we
[data scientists]
do](https://image.slidesharecdn.com/evsvgr4frhkudgdnwppq-signature-9e3a1d80d064dbcf9fecc4ef4e7691e0430a26e15a1fd23f3285ced01f27a502-poli-150114123428-conversion-gate02/85/Sampling-An-an-often-overlooked-art-in-exploratory-data-analysis-3-320.jpg)


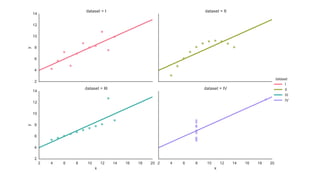


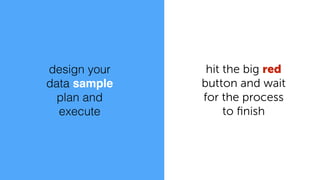


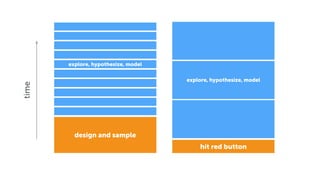
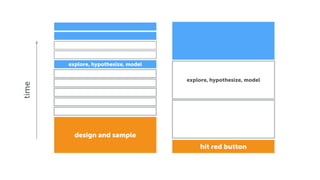


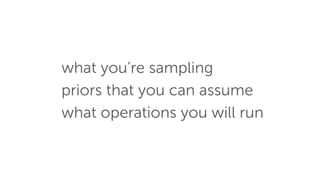


The document discusses sampling in exploratory data analysis. It notes that sampling is an often overlooked art and provides some key considerations for sampling, including what data is being sampled, any prior assumptions that can be made, and what operations or analyses will be performed on the sampled data. The document advocates for designing a sampling plan and executing it rather than simply hitting a "big red button" to analyze all available data, in order to gain insights faster through an iterative process of exploring, hypothesizing, and modeling on sampled data.


