The document describes a data science approach to predict winning fantasy cricket teams on the Dream 11 platform using player performance data and algorithms like greedy and knapsack. It emphasizes the importance of sports analytics, which has evolved from baseball to include various sports, particularly cricket, employing statistical methods to inform team selections and enhance decision-making. The authors built a predictive model that improves the likelihood of success by analyzing player data, utilizing Python libraries for regression analysis and data visualization.
![DATA SCIENCE APPROACH TO PREDICT THE WINNING
FANTASY CRICKET TEAM—DREAM 11 FANTASY SPORTS
Sachin Kumar S [1]
, Prithvi H V [2]
, C. Nandini [3]
[1] [2]
Final Year Students, Department of CSE, DSATM, Bengaluru, Karnataka, India
[3]
Head of the CSE Department, DSATM, Bengaluru, Karnataka, India
sachinsks1999@gmail.com[1]
hvprithvi09@gmail.com[2]
hodcse@dsatm.edu.in [3]
Abstract— The evolution of digital technology and the
increasing popularity of sports inspired the innovators to
take the experience of users with a proclivity towards sports
to a whole new different level, by introducing Fantasy
Sports Platforms (FSPs). The application of Data Science
and Analytics is Ubiquitous in the Modern World. Data
Science and Analytics opens doors to gain a deeper
understanding and helps in the decision making process.
We firmly believed that we could adopt Data Science to
predict the winning fantasy cricket team on the FSP,
Dream-11. We built a predictive model that predicts the
performance of players in a prospective game. We used a
combination of Greedy and Knapsack Algorithms to
prescribe the combination of 11 players to create a fantasy
cricket team that has the most significant statistical odds of
finishing as the strongest team—thereby giving us a higher
chance of winning the pot of bets on the Dream-11 FSP. We
used PyCaret Python Library to help us understand and
adopt the best Regressor Algorithm for our problem
statement to make precise predictions. Further, we used
Plotly Python Library to give us visual insights on the team,
and player’s performances by accounting for the statistical,
and subjective factors of a prospective game. The interactive
plots help us to bolster the recommendations of our
predictive model. You either win big, win small or lose your
bet based on the performance of the player’s selected for
your fantasy team in the prospective game, and our model
increases the probability of you winning big.
Keywords—Sports Analytics, Cricket Analytics,
Fantasy League Analytics, Predictive Analytics, Statistical
Analysis, ML Classification Algorithms, ML Regression
Algorithms, Extra Trees Regressor, PyCaret, Cloud
Computing, Data Visualization, Interactive Plots, Plotly
Python, Greedy Algorithm, Knapsack Algorithm.
I. INTRODUCTION
The term “Sports Analytics” gained widespread popularity in
the field of Sports as well as in the field of Statistical Analysis
following the release of a book titled “Moneyball: The Art of
Winning an Unfair Game,” by Michael Lewis [1], in the year
2003 and this popularity surmounted when the movie
“Moneyball [2]” was released in the year 2011. In the story
of “Moneyball,” the Oakland Athletics General Manager,
Billy Beane, who was also a former ballplayer, uses
analytical methods to derive insights from the Player’s
historical data and makes pivotal decisions for his team, the
Oakland A’s. He relied intensely on the application of
analytics to construct an aggressive baseball team on a
minimal budget, and his team set the world record for
winning 20 consecutive games in the history of Baseball.
After the success of Oakland Athletics in the game of
Baseball by using Sabermetrics, an analytical approach
adopted by Billy Beane to select low-cost players with high
on-base percentage, many Baseball teams jumped-in on the
strategy. This breakthrough success of Analytics to make
decisions in Sports made people adopt it not only in Baseball
but also in Basketball, American Football, Soccer, Tennis,
Cricket, and every other major, highly popular organized
sport.
Sports Analytics came into existence with the
experimentation of Statistical Analysis methods on the data
of Baseball in the 1970s by the statisticians of the Society for
American Baseball Research (SABR). After its proven
success by Billy Beane in the field of Baseball in optimizing
player’s and team’s performance, people worldwide started
experimenting with the datasets of Football, Hockey,
Basketball, Soccer, Tennis, and Cricket. In the modern world,
Sports Analytics is found to be used in almost every
organized sport that is played. Today, we have Sports
Analytics put into use in all primary sports right from Team-
Selection and On-field decision making to business aspects
of the sport. The development of this domain had its roots
primarily from Statistics, Game Theory, and Decision
Sciences, and today, the field also uses Machine Learning and
Modern Analytical Approaches to drive decisions for the
team and the game itself.
With the application of Sports Analytics, we can get
insights on the Sports Market, Assess Players and their
Performances, rank participating teams, Predict Player’s
score and team’s score in a prospective game, Make Game
Day Decisions to deliver a win, Promote Team Brands and
improve the team’s income, optimize and manage team’s
budget and finances. With such a wide range of applications,
we have to consider the varied methodologies for each of
these applications and select the best methods to maximize
the outcome of the application of analytics. Literally, in the
modern world, every decision in every major sport is made
based on analytics, but this knowledge is highly esoteric and
not known to most of the people who are not into the field of
Analytics related to Sports and Sporting Events.](https://image.slidesharecdn.com/datascienceapproachtopredictthewinningfanta-240702105405-fac8d2cf/85/Data_Science_Approach_to_predict_the_winning_Fanta-pdf-1-320.jpg)
![Sports Analytics is the process that involves
gathering all relevant historical statistical data of players to
develop a hypothesis based on statistical analysis and
generate insights that come handy in making decisions for the
team. There are two primary aspects when it comes to Sports
Analytics, and these aspects apply to all kinds of Organized
Games, and they are: “on-field analytics” and “off-field
analytics.” On-field analytics deals with the improvisation of
the Player’s performance or the team’s performance on the
field using insights from analytical reports. Off-field
analytics deals with the business and market of sports. This
becomes useful when the team has to consider a particular
budget for a tour and pick players who suit the team’s total
budget for the tour. Sports Analytics is a more generalized
term, and its application, although similar, has different
approaches and outcomes in various sports. Usually, in every
game, there is a blend of both the aspects in making decisions
for a Team Selection and also for another decision making
related to the team. In our case, to predict a winning fantasy
cricket team, we employ both On-field and Off-field analytics
for decision making. On-field helps us identify the best
performers in the given set of “n” players, Off-field analytics
help us pick 11 top players suiting our budget of 100 credit
scores as set by Dream-11 FSP.
In the field of Sports Analytics concerning any
sport, the most quintessential requirement to generate better
analytics with the available empirical data on the competition
is by asking the right questions and using the correct
methodology to answer those questions. There can be more
than one way to solve a problem, but the most desirable and
efficient way always yields better results and better
predictions. In cricket, there is a plethora of data available on
the players and their strengths and weaknesses against rival
teams and their performances in various pitches around the
world. To make a Team selection or decision for the team,
asking the right questions is a start, and answering those
questions with the right tools and most-proven methods is a
necessity because the most reliable tools and techniques yield
better predictions.
Building winning sports teams and successful sports
businesses are more likely when data and models guide the
decisions. Sports analytics is a source of competitive
advantage. To apply the analytics feasibly to gain a
competitive advantage in sports, we should initially grasp the
sport itself—the sports industry, the organized sports
business, on-field factors and incidents, and courts of play.
We have to envision and discern how to work with the data if
sports recognize viable and verified data sources, gather
relevant datasets to extract useful information, arrange, and
model them to make it viable for investigation. Also, we need
to learn from the data to consider how to assemble models
from the information. Data cannot represent themselves.
Informative pivotal forecasts do not emerge out of thin air.
We must gain from information and build models that work.
II. LITERATURE REVIEW
There is a plethora of literature available on Sports Analytics
and its application to make decisions for sports like Baseball,
Football, Basketball, and Soccer, and Tennis. However, there
exists only a fewer number of pivotal research articles on the
use of Sports Analytics in the Sport of Cricket. In this section,
we will give you an overview of the evolution of Sports
Analytics from Baseball to Cricket, and different methods
employed by different authors to make outcome predictions
and team selections in the field of sports.
To introduce anyone to the vast field of Organized
Sports Analytics, the best place to start with is the book
“Moneyball: The Art of Winning an Unfair Game [1]”, a
book by Michael Lewis, published in 2003. The story of this
book revolves around the General Manager of the Team,
Oakland Athletics, Mr. Billy Beane, who set a world record
by delivering 20 consecutive wins to the team with a minimal
budget. The team was suffering from the shortage of funds,
and Mr. Billy Beane adopted the principle of Sabermetrics,
an Analytical approach to choose players for the team who
cost relatively way less in price and had a more significant
on-base percentage and slugging percentage. His choice of
the on-base percentage and slugging percentage as better
indicators of offensive success was by the use of rigorous
statistical analysis. The Oakland A’s’ victory in the MLB
Tournament in 2002 is a history that will last as long as the
field of Sports and Sports Analytics holds water. James came
up with the invented model the Sabermetrics, the year 1980
to sketch the science of analytics applied to the sport of
baseball in honor of the Society for American Baseball
Research (SABR), which was established in the year 1971.
Yet, this analytical tool was not applied in practice because
the Organization and members of the baseball team selection
believed that a statistical tool could not surpass their years of
experience. However, in the 2002 MLB Tournament, they
were disproved by Billy Beane’s use of Sabermetrics for
selecting his Oakland A’s Team. Beane’s success was a result
of Alderson’s recommendation to Beane: they recognized
which statistical tool most closely correlates the scoring of
runs and other factors of the sport with the winning of the
game, and at the same time the same factors that were
undervalued by the rest of the baseball teams to make a
selection decision. His analysis was that a player with an on-
base percentage of .295 was paid around 4 million USD and
a player who showcased an on-base percentage of .260 was
paid only around 200 thousand USD. However, in the actual
game setting, this overrated measure did not make much of a
difference in delivering the most anticipated victory to the
team all the time. Therefore, based on this analysis and the
intuition, Billy Beane hired the player with an on-base
percentage of .260 for a price that is a throw-away price when
compared to buying a player with an on-base percentage of
.295. Following the success of the Oakland A’s in the MLB
Tournament, analytics departments emerged in all the
baseball team front offices.
Although the advent of Sports Analytics began with
the game of Baseball in the early 1980s, the earliest organized
sport was the Game of Cricket. We have reliable data on the
scorecards of the games played since 1697 in the game of
cricket. The record-keeping of games is what that gave rise to
the introduction of Statistics and Analytics into the field of
Sports. Of all the sorted out sports appreciated in America,
it's maybe not astonishing that the one quintessential game to](https://image.slidesharecdn.com/datascienceapproachtopredictthewinningfanta-240702105405-fac8d2cf/85/Data_Science_Approach_to_predict_the_winning_Fanta-pdf-2-320.jpg)
![involve numbers as a prominent piece of its soul would be
Baseball. Each occasion that happens in a ball game does as
such with barely any undisclosed amounts: there are always
nine defenders in the similar general territory, one-hitter,
close to three base sprinters, close to 2 outs. There is no
persistent whirlwind of action as in b-ball, soccer, or hockey;
the occasions don't depend vigorously upon player
arrangements as in football; there are no turnovers and no
clock—each play is a discrete occasion. Thus, the advent of
Sports Analytics took place with the game of Baseball. In
spite of the availability of data for the game of cricket since
1697, the actual application of Analytics into organized
sports happened with the game of Baseball. The most
prominent reason for this unsung popularity of the sport,
cricket in the field of Analytics was because it was not so
popular in America. It was Americans that started applying
statistics to sports data and Baseball was the most famous
American Sport.
Spots that display the quintessential characteristic
of placing two teams on a field of some size with a ball that
is advanced towards a goal line has been around for as long
as the human civilizations. The advent of the majestic game
football is evolutionary and the fact that there exist different
versions and variations of the game Football is perplexing.
By the era of the 19th century, football was the game that was
cherished by all the schools and universities across the world
and prominently in the American, European and African
Countries. With no authority governed by a revered central
board at the time, each major school and/or university
adopted a different variation of the sport depending on the
surroundings of the university and the land that was available.
Hence, we have the Association Football or the Soccer
version of Football, and the rugby version of the football. In
spite of these variations of the game, there were rudimentary
data that was recorded judiciously since 19th century. Thus
the application of Sports Analytics is somewhat viable in
these games. In 1979, the revered organization, NCAA
introduced an efficient metric called the “passer efficiency
rating” as a reliable means to evaluate quarterbacks beyond
touchdown passes and total yard and in the modern football
games, all sorts of data are being recorded. Thus, the
application of Analytics to these games are delivering more
satisfactory results.
The third American sport that saw the application of
Sports Analytics in recent years was Basketball. Like the
game football, the game basketball was also cherished by
colleges and imminent universities before the sport turned
into an international organized sport with over a billion fans
revering and following the sport in their routine lives. NBA
Analysts are one of the highest-paid in the world and they run
analytics on the game of Basketball to make decisions for the
NBA Teams. In the information-rich era of the present-day
modern world, the relationship between sports and numbers
is closer than ever before. With the ease of access to all
information publically available to anyone with internet
access, it is easier than ever before to get the data about any
organized sport and analyses can be run by anyone interested
with a spreadsheet application to derive potential insights
about the game from form of the game to the numbers that
talk about the business of the sport. It is no longer as difficult
as it was in the 1970s when people had to refer the newspaper
to get statistical information about the sports and use a pocket
calculator to perform statistical analysis on the aggregated
information and report them with a manual typewriter.
The one paper that served as the base for conducting
our research is Increased Prediction Accuracy in the Game of
Cricket using Machine Learning [12]. In this paper, the
author states that Player Selection is the most pivotal task that
depicts the chances of a win or loses in the game of cricket.
He considers various factors, such as the opposition team, the
venue, his consistency, and current form (player statistics),
etcetera, and mentions that the players’ performance depends
on these variables. In his paper we understand that the team
management, the coach, and the captain select the best
playing 11 players for each match from a squad of 15 to 30
players by analyzing the statistics and characteristics of the
players. This paper [12] attempts to classify the performance
of Batsman and Bowlers in One Day International (ODI)
matches into five classes labeled from 1 to 5: 1 being the least
performers category and 5 being the top performers. The
author mentioned the use of four Multiclass Classification
Supervised Learning Algorithms- Naïve Bayes, Random
Forest, Multiclass SVM, Decision Trees- in this paper. The
paper predicted the class to which a player belongs to in a
prospective game by predicting the range in which a batsman
will score runs, and a bowler might take wickets. The paper
suggests that Random Forests Classifier Model provides
better predictions than the other three classification models
he adopted. In his research, the Random Forests showed 90%
accuracy in predicting Batsman’s performance and 92% in
predicting bowler’s performance. The author did not use the
regression models to predict player’s performance. Instead,
he grouped the runs scored and wickets taken into five
buckets with a considerable range and
predicted in which class a player might stand in the
prospective game. The author used only ODI Player’s dataset.
This paper allowed us to question the use of classifier models
and test out Regressor Models on Player’s our gathered
player’s performance dataset of 3100 matches in three-game
formats: ODI, IPL, and T20.
Some trends and articles that inspired the authors of
[12] are: Muthuswamy and Lam [21] predicted the
performance of Team India’s current bowlers (In 2008)
against the top seven international cricket teams using
backpropagation network and radial basis network function.
They predicted how many runs an Indian bowler might
concede and how many wickets he might take in a
prospective ODI match. Barr and Kantor [22] proposed
criteria for comparing a pool of recommended players and
selecting batsmen for the team in limited-overs cricket. The
criterion suggests players who are likely to hit crazy
boundaries and help the team or at least get out and offer other
players a chance when they find it challenging to give their
best. Iyer and Shard [23] showed how to use neural networks
for predicting player performances and classify the batsmen
and bowlers separately into three optimal categories –
performer, moderate, and failure. This ideology served as the
base for the authors of [12] to classify the players into five
buckets. Surprisingly, our base paper authors neglected to use
Neural Networks. However, in our case, we believed that](https://image.slidesharecdn.com/datascienceapproachtopredictthewinningfanta-240702105405-fac8d2cf/85/Data_Science_Approach_to_predict_the_winning_Fanta-pdf-3-320.jpg)
![Neural Networks Training time is very high. So, we stuck
with Regressor Algorithms without exploiting the
capabilities of a Neural Network. Next, Jhanwar and Paudi
[24] predicted the outcome of a cricket game by comparing
and analyzing the strengths of the two participating teams.
Finally, Mukharjee [25] applied Social Network Analysis to
rate batsmen and bowlers in team performance. Here, he
predicted the outcome of a player’s performance as High,
Average, and Low based on his popularity on Twitter. The
author tried to find a correlation between popularity and
performance, which is exciting but not practical.
The literature that gave us confidence in using
subjective factors of the game for predicting player’s
performance in a prospective game was authored by Kalanka
P. Jayalath [26]. Unpredictable variables such as Home-field
Advantage, Coin-toss Result, Bat-first or second, and Day
Gave vs. Day-and-Night game format have some impact on
every cricket game. The author of A Machine Learning
Approach to Analyze ODI Cricket Predictors [26] attempted
to analyze the impact of these unpredictable variables on ODI
Cricket matches by quantifying their significance. The author
used three models in quantifying the significance of
unpredictable variables. They are Logistic Regression
Analysis, Classification Trees, and Regression Trees. The
paper proved that Unpredictable variables do have a pivotal
impact on the outcome of every cricket game. The
quantitative value of this impact was very high on some
teams, while other teams did show some that these variables
mattered on a scale of moderate to less. The author did
generalize the concept of Home-grounds to Continents to
which a team belonged. However, in our research, we were
confident to adopt the Stadium Location as a metric feature
for determining players’ performance.
We would also like to acknowledge the work of
researcher Tinniam V Ganesh for publishing his package-
yorkpy [27] and nine articles [28] to [36] on how to use
effectively use the same. Yorkpy is built to be used for
analyzing performances of cricketers based on match data
from Cricsheet. Yorkpy helped us enormously in procuring
the usable CSV data tables in our python environment by
performing feature engineering, and data transformations on
the 3100 cricket match YAML files downloaded from
cricsheet.org [40]. Yorkpy’s several other functions helped us
gain a more in-depth understanding of Sports Analytics
applied to Cricket. Also, we would like to mention that the
author, Tinniam V Ganesh, responded to us when we reched
out to him personally, and he clarified by helping us
understand his work, and resolved issues we faced while
using his package. It was a serendipitous encounter for us
when a function of his package that was intended for
conversion of T20 format cricket matches YAML files
worked flawlessly when used for converting ODI game
format YAML files. When we analyzed how it worked, we
found that the function for coverting YAML files to CSV
“convertYaml2PandasDataframeT20” was a pure function
that was highly generic, which motivated us to write
functions that are pure functions and abstract.
III. METHODOLOGY
In this paper, I’d like to split the methodology
section into six sub-sections: Getting Data, Feature
Engineering, Data Visualization, and Machine Learning,
Data Engineering, and Dream Team Recommending module.
Before I help you cognize the approach adopted to
develop our product for predicting the statistically
undefeatable fantasy cricket teams in ODI, IPL, and
International T20 format cricket games, I’d like to give you a
brief architecture of our product and explain it in seven steps.
All the sub-sections except the Machine Learning
sub-section will be briefly explained in the Architecture sub-
module, and you will be introduced to the Machine Learning
sub-module in detail after the Architecture section.
A. ARCHITECTURE
Fig 3.a: Architecture of the Product](https://image.slidesharecdn.com/datascienceapproachtopredictthewinningfanta-240702105405-fac8d2cf/85/Data_Science_Approach_to_predict_the_winning_Fanta-pdf-4-320.jpg)
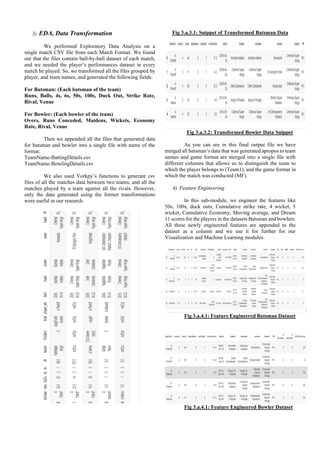
![1) Identify Reliable Data Sources
To solve any data science problem, data is
quintessential requirement. We began by reviewing the
research literature in the field, blogs & articles, and learnt
what others have done in the past pertaining to the field of
Fantasy Sports, Sports Analytics, and Predictions of Player
performances in Cricket and Dream-11. Then we identified
relevant data sources used by the authors of the literature for
analysis and modeling. In our case, the base paper had used
data from espncricinfo [38] website. But, the dataset had
player’s overall statistics, and we were looking for player’s
performance data in each match he played recorded as a
single row. There was no ready-made dataset available for
our problem statement. However, we found the reference to
Cricsheet [37] in Yorkpy [27] package’s github repository.
We found ball-by-ball dataset for every cricket match in ODI,
T20, and IPL format recorded since the year 2000. Yet, we
had to perform feature engineering on this dataset to get
playe’s performance data in every match he had played as a
single row of the team’s data table.
Fig 3.a.1: Data Source (CricSheet.org)
2) Data Scraping, and Data Extraction
We identified reliable data source at cricsheet.org
where we got dataset of 3100 cricket matches files (1529
ODI, 756 IPL, 815 T20) of past two decades. The files were
available in YAML format, and we scrapped it and extracted
the data into CSV files using the already available specific
functions to do the job in the YorkPy Python Package.
Fig 3.a.2.1: Snippet of Scrapped YAML Data
Fig 3.a.2.2: Snippet of Transformation logic output
converting a single YAML file to CSV file
As you can see in Fig 3.2.1, the transformed dataset
has 38 columns and it is impossible to attach a snippet of the
same in this document. We have effectively converted all
the 3100 YAML Files to CSV in this task. All the
transformed CSV files are ball-by-ball dataset of shape
(no.of balls played in the game, 38).](https://image.slidesharecdn.com/datascienceapproachtopredictthewinningfanta-240702105405-fac8d2cf/85/Data_Science_Approach_to_predict_the_winning_Fanta-pdf-5-320.jpg)
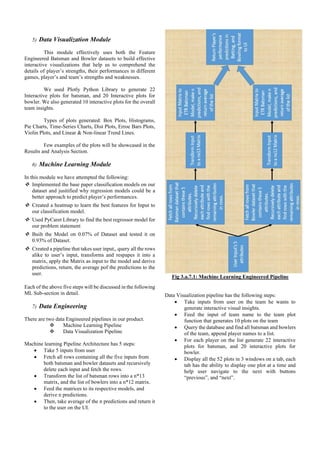
![Fig 3.a.7.2: Data Visualization Engineered Pipeline
Further, the Team recommendation module is called
as the last step in the Machine learning pipeline. This event
has no trigger associated and is an independent module.
Hence, it is not mentioned in the Machine learning pipeline
architecture.
Tools used for creating the Pipelined architecture
are: Flask, and Airflow to run the DAGs on the GCP VM.
8) Fantasy Dream Team Recommendation for
the standard 100 Credits Budget
In a prospective game between two teams, we have
22 participating players. However, for the selection of our
fantasy dream team, we have the following conditions:
1. Cannot select more than 7 players from one team
2. Cannot exceed the credit limit of 100 points.
3. Must select 11 players for your team
To perform this selection 11 players within the budget we
used a combination of Knapsack and Greedy Algorithms. Our
selection algorithm recommends you players for your team
such that the expected dream-11 score of your team is
maximum, and the credits used for selecting 11 such players
will cost you <=100 credits.
Fig 3.a.8: Team Recommendation Logic
B. MACHINE LEARNING SUB-SECTION
In this sub-section, we will give you a brief
overview on the approaches we took to test our base-paper
models, select the right model for our problem statement, and
implementation details.
1) Testing Base Paper Classification Models
At first, after visualizing the player’s performances
we realized that bucketing the players based on their
performance when we had more than one data-point of the
players was not an optimal approach. We firmly believed that
Regressor models is the best-fit for our problem statement.
However, we had to support our theory practically and hence
we choose to fit our dataset to classifier models and measure
the prediction accuracy.
def customknapSack(W, wt, val, n, L):
K = [[{"weight": 0, "items": []}
for x in range(W + 1)] for x in range(n + 1)]
# Build table K[][] in bottom up manner
for i in range(n + 1):
for w in range(W + 1):
if i == 0 or w == 0:
K[i][w] = {"weight": 0, "items": []}
elif wt[i-1] <= w and len(K[i-1][w-wt[i-1]]["items"])
< L:
print(K[i-1][w-wt[i-1]]["items"])
if val[i-1] + K[i-1][w-wt[i-1]]["weight"] > K[i-
1][w]["weight"]:
bigger = list(K[i-1][w-wt[i-1]]["items"])
bigger.append(val[i-1])
K[i][w] = {"weight": K[i-1][w-wt[i-1]]
["weight"] + val[i-1], "items": bigger}
else:
K[i][w] = {"weight": K[i-1][w]["weight"],
"items": K[i-1][w]["items"]}
else:
K[i][w] = K[i-1][w]
return K[n][W]
# Driver program to test above function
n = len(val)
val.sort(reverse=True)
val = [x for _, x in sorted(zip(val, val))]
wt = [x for _, x in sorted(zip(val, wt))]
print(val, wt, valRatio)
print(customknapSack(W, wt, val, n, L))](https://image.slidesharecdn.com/datascienceapproachtopredictthewinningfanta-240702105405-fac8d2cf/85/Data_Science_Approach_to_predict_the_winning_Fanta-pdf-8-320.jpg)
![Surprisingly, few of the models did perform well
when asked to classify players dream-11 scores in buckets of
10. The results are in the figure below.
Fig 3.b.1.1: Classifier Model’s Accuracy for predicting
Batsman Dream-11 Scores into buckets of range 10
Fig 3.b.1.2: Classifier Model’s Accuracy for predicting
Batsman Dream-11 Scores into buckets of range 10
The accuracy of predicting a player's Dream-
11score in buckets of 10 is quite acceptable. However,
practically speaking, even a difference of 4 points will put us
1000s of rank away from the first optimal fantasy team's rank.
Hence, we proposed the method of Regression to predict the
Dream-11 scores of the player's performance prediction. Now
the job at hand was to find the best of the best regressor
models to make predictions for our problem statement.
2) Finding Best Prediction Regressor Model
We had to choose the best regression model for
making predictions, and we thought of testing out all sorts of
regression models that exists to determine the best. This was
a very laborious task. However, luckily, we had PyCaret
Library [39] for our rescue.
We sampled 10%of our entire batsman and bowler
datasets. We fit it to all the 22 Scikit-Learn’s regressor
models available in the PyCaret Package’s Environment. And
we executed the code to compare and evaluate all the models
and give us the best Regressor Model with a Maximum
acceptable R2 Score. The PyCaret Library did a fascinating
job and recommended us the go with the Extra Trees
Regressor Model. The recommendation output is the figure
below.
Fig 3.b.2.1: PyCaret’s Recommendation for the Best
Learning Prediction Model for our dataset
We knew that an R2 Score of 0.99 was quite
alarming and made us believe that the model was over fitted.
But, when we analyzed the case for over-fitting if was
surprising that our model did not overfit for the following
reasons:
• Learning Rate is higher than Testing rate.
• The correlation between the features chosen and
label to be predicted is very high.
The below graphs will support that the model was
not over fitted on our dataset.](https://image.slidesharecdn.com/datascienceapproachtopredictthewinningfanta-240702105405-fac8d2cf/85/Data_Science_Approach_to_predict_the_winning_Fanta-pdf-9-320.jpg)
![Fig 3.b.2.2: Learning Curve for ETR Model
Fig 3.b.2.3: Batsman Data Feature Importance Plot for
ETR Model
Fig 3.b.2.4: Prediction Error Plot for ETR Model
3) Building a Real World Usable ML Predictor
Now after learning that ETR was the best learning
prediction model for our dataset, we knew that we had to
build our model and store it as a picked file to generate
predictions. We sampled 50% of our dataset freshly, and
trained our model on this sampled dataset. Then, we fitted the
unseen 50% of dataset by our model to make predictions,
surprisingly we achieved the almost the same R2 score as
predicted by the PyCaret Library. The results are shown
below.
Fig 3.b.3.1: Prediction R2 Score for ETR Model on
Batsman Dream-11 Score Predictions
Fig 3.b.3.2: Prediction R2 Score for ETR Model on
Bowler Dream-11 Score Predictions
Our ML Predictor takes the following list of Input values to
derive predictions on the Dream-11 Score of the player.
For Batsman:
train_feature=['batsman','MF', 'team1', 'team2', 'venue',
'runs', 'balls', '4s', '6s', '50s', '100s', 'ducks', 'SR']
For Bowler:
Features=['bowler', 'MF', 'team1', 'team2', 'venue', 'overs', 'ru
ns', 'maidens', 'wicket', 'econrate', '4 wicket', '5 wicket']](https://image.slidesharecdn.com/datascienceapproachtopredictthewinningfanta-240702105405-fac8d2cf/85/Data_Science_Approach_to_predict_the_winning_Fanta-pdf-10-320.jpg)
![However, in real world, it is quite preposterous to
expect the user to know all the exact values for these inputs.
We can only expect the user to enter the following inputs: [
'Player', 'MF', 'team1', 'team2', 'venue']. So we need to extract
all rows from the dataset that has all these 5 inputs and
recursively delete each input feature and extract all rows until
all 5 features are deleted and we have a list of rows that can
be used as input for our model.
Now, after getting the list of the rows, we must
transform the list into a two dimensional matrix that has “n”
rows, and “12” columns if the data is extracted from batsman
dataset, and “11” columns if the data is extracted from
bowler’s dataset. Then, we fit the data matrix to the respective
prediction models and derive the predictions and give the user
the average of all the predictions.
If the player is an all-rounder then, the user will see
two prediction values for the player in both batting and
bowling format, and his predicted dr11 scores will be
summed. Therby, we considered the factors of usability and
knowledge of users to derive predictions.
IV. CONCLUSIONS & FUTURE WORK
• We sampled and used only 10% of the entire dataset to
learn the best regression model for our dataset and
problem statement using PyCaret.
• The Auto-ML PyCaret library suggested us to go with
the Extra Trees Regressor Model (ETR) to attain the
maximum precise predictions.
• When ETR ML Model was used with the 100% of
dataset with a Train-Test Split of 7:3, we got an R2 score
of 0.99 for batsman dream-11 scores predictions, and an
R2 score of 0.97 for bowler dream-11 scores predictions.
• Hence, with our product we proved that to predict the
performance of a player in a prospective game, we must
use regressor models and not classification models as
suggested by our base paper.
Further, to make our model better, we must construct a
pipeline that scrapes data of every new match from the
cricsheet website, and perform the transformations, and
feature engineering and update the data as rows to our
batsman and bowler datasets.
REFERENCES
[1] Lewis, Michae. Moneyball: The Art Of Winning An
Unfair Game. New York : W.W. Norton, 2004.
[2] Miller, Bennett, Michael De Luca, Rachael Horovitz,
Brad Pitt, Steven Zaillian, Aaron Sorkin, Stan Chervin,
et al. 2012. Moneyball. Culver City, CA: Sony Pictures
Home Entertainment.
[3] Optimal Sports Math, Statistics, and Fantasy Robert
Kissell-James Poserina - Academic Press, an Imprint Of
Elsevier – 2017
[4] Analytical Research Topics in Sport Management Gi-
Yong Koo - 2012
[5] Economic Theory Of Professional Team Sports, The: An
Analytical Treatment Stefan Késenne - Edward Elgar
Publishing Limited – 2007
[6] E. Nsolo, ‘Prediction models for soccer sports analytics’,
Dissertation, 2018.
[7] Sport Business Analytics: Using Data To Increase
Revenue and Improve Operational Efficiency C.
Harrison-Scott Bukstein - Crc Press, Taylor Et Francis
Group – 2017
[8] Sports Analytics and Data Science: Winning the Game
with Methods and Models Thomas Miller - Pearson
Education, Inc – 2016
[9] Sports Math: an Introductory Course in the Mathematics
Of Sports Science and Sports Analytics Roland Minton -
Crc Press, Taylor & Francis Group – 2017
[10] Sports Performance, Measurement and Analytics: the
Science Of Assessing Performance, Predicting Future
Outcomes, Interpreting Statistical Models, and
Evaluating the Market Value Of Athletes Lorena Martin
- Pearson Education, Inc. – 2016
[11] Sports Research with Analytical Solution Using Spss
Verma - Wiley – 2016
[12] Kalpdrum Passi and Niravkumar Pandey. (2018)
INCREASED PREDICTION ACCURACY IN THE
GAME OF CRICKET USING MACHINE LEARNING.
International Journal of Data Mining & Knowledge
Management Process (IJDKP) Vol.8, No.2, March 2018.
10.5121/ijdkp.2018.8203
[13] Jhawar, Madan & Pudi, Vikram. (2016). Predicting the
Outcome of ODI Cricket Matches: A Team Composition
Based Approach.
[14] Ahmed, Faez & Deb, Kalyanmoy & Jindal, Abhilash.
(2013). Multi-objective optimization and decision
making approaches to cricket team selection. Applied
Soft Computing. 13. 402–414.
10.1016/j.asoc.2012.07.031.
[15] J Ross Quinlan. C4.5: Programs for Machine Learning.
3. 1993, p. 302
[16] ] Himani Sharma and Sunil Kumar. “A Survey on
Decision Tree Algorithms of Classification in Data
Mining”. In: International Journal of Science and
Research 5.4 (2016), pp. 2094–2097.
[17] J. Han, M. Kamber and J. Pei, Data Mining: Concepts
and Techniques, 3rd Edition ed., Waltham: Elsevier,
2012.
[18] L. Breiman, "Random Forests," Machine Learning, vol.
45, no. 1, pp. 5-32, 2001.
[19] T. K. Ho, "The Random Subspace Method for
Constructing Decision Forests," IEEE transactions on
pattern analysis and machine intelligence, vol. 20, no. 8,
pp. 832-844, August 1998.
[20] L. Breiman, J. Friedman, C. J. Stone and R. A. Olshen,
Classification and regression trees, CRC Press, 1984.
[21] S. Muthuswamy and S. S. Lam, "Bowler Performance
Prediction for One-day International Cricket Using
Neural Networks," in Industrial Engineering Research
Conference, 2008.](https://image.slidesharecdn.com/datascienceapproachtopredictthewinningfanta-240702105405-fac8d2cf/85/Data_Science_Approach_to_predict_the_winning_Fanta-pdf-11-320.jpg)
![[22] G. D. I. Barr and B. S. Kantor, "A Criterion for
Comparing and Selecting Batsmen in Limited Overs
Cricket," Operational Research Society, vol. 55, no. 12,
pp. 1266-1274, December 2004.
[23] S. R. Iyer and R. Sharda, "Prediction of athletes
performance using neural networks: An application in
cricket team selection," Expert Systems with
Applications, vol. 36, pp. 5510-5522, April 2009.
[24] M. G. Jhanwar and V. Pudi, "Predicting the Outcome of
ODI Cricket Matches: A Team Composition Based
Approach," in European Conference on Machine
Learning and Principles and Practice of Knowledge
Discovery in Databases (ECMLPKDD 2016 2016),
2016.
[25] S. Mukherjee, "Quantifying individual performance in
Cricket - A network analysis of batsmen and bowlers,"
Physica A: Statistical Mechanics and its Applications,
vol. 393, pp. 624-637, 2014.
[26] A MACHINE LEARNING APPROACH TO
ANALYZE ODI CRICKET PREDICTORS 2018
Kalanka P. Jayalath International Journal of Sports
Analytics 4 (2018) 73-84 DOI 10.3233/JSA-170175 IOS
Press
[27] Tinniam V Ganesh (2020). yorkpy: Python package
version0.0.11. https://pypi.org/project/yorkpy/
[28] Tinniam V Ganesh, 2018. Pitching yorkpy short of good
length to IPL Part1. [Blog] Medium, Available at:
https://gigadom.in/2018/12/28/pitching-yorkpy-short-
of-good-length-to-ipl-part-1.
[29] Tinniam V Ganesh, 2019. Pitching yorkpy on the middle
and outside off-stump to IPL Part2. [Blog] Medium,
Available at: https://gigadom.in/2019/01/27/pitching-
yorkpyon-the-middle-and-outside-off-stump-to-ipl-part-
2/.
[30] Tinniam V Ganesh, 2019. Pitching yorkpy on the middle
and outside off-stump to IPL Part3. [Blog] Medium,
Available at: https://gigadom.in/2019/02/03/pitching-
yorkpyswinging-away-from-the-leg-stump-to-ipl-part-
3/.
[31] Tinniam V Ganesh, 2019. Pitching yorkpy in the block
hole Part 4 [Blog] Medium, Available at:
https://gigadom.in/2019/02/26/pitching-yorkpy-in-the-
block-hole-part-4/.
[32] Tinniam V Ganesh, 2019. yorkpy takes a hat-trick, bowls
out Intl. T20s, BBL and Natwest T20!!!. [Blog] Medium,
Available at: https://gigadom.in/2019/03/03/yorkpy-
takes-a-hat-trick-bowls-out-intl-t20s-bbl-and-natwest-
t20/.
[33] Tinniam V Ganesh, 2019. Analyzing T20 matches with
yorkpy templates. [Blog] Medium, Available at:
https://gigadom.in/2019/03/10/analyzing-t20-matches-
with-yorkpy-templates/.
[34] Tinniam V Ganesh, 2020. Ranking T20 players in Intl
T20, IPL, BBL and Natwest using yorkpy.
[Blog] Medium, Available at:
https://gigadom.in/2020/02/29/ranking-t20-players-in-
intl-t20-ipl-bbl-and-natwest-using-yorkpy/
[35] Tinniam V Ganesh, 2020. Big Data-5: kNiFi-ing through
cricket data with yorkpy. [Blog] Medium, Available at:
https://gigadom.in/2020/03/06/big-data-5-knifi-ing-
through-cricket-data-with-yorkpy/
[36] Tinniam V Ganesh, 2020. Big Data 6: The T20 Dance of
Apache NiFi and yorkpy. [Blog] Medium, Available at:
https://gigadom.in/2020/03/20/big-data-6-the-t20-
dance-of-apache-nifi-and-yorkpy/
[37] Cricsheet: https://cricsheet.org/
[38] ESPN-Cricinfo: http://stats.espncricinfo.com/
[39] PyCaret.org. PyCaret, April 2020. URL
https://pycaret.org/about. PyCaret version 1.0.0.](https://image.slidesharecdn.com/datascienceapproachtopredictthewinningfanta-240702105405-fac8d2cf/85/Data_Science_Approach_to_predict_the_winning_Fanta-pdf-12-320.jpg)


