This document outlines a proposed project to develop a system that uses data mining of football player statistics to provide predictions and risk assessments to aid sports betting. It will collect statistics from two Spanish league players over three seasons and create algorithms to find patterns. These will be used to generate percentage-based predictions of players scoring goals in different scenarios. The system aims to address issues with how bookmakers advertise odds and analyze whether bets statistically offer good value based on player data trends. Resources available for the project include spreadsheet, database, web and software development applications to potentially create a website or application to deliver the predictive system.
![Niall Brooke
1.5.6 Dreamweaver Disadvantages
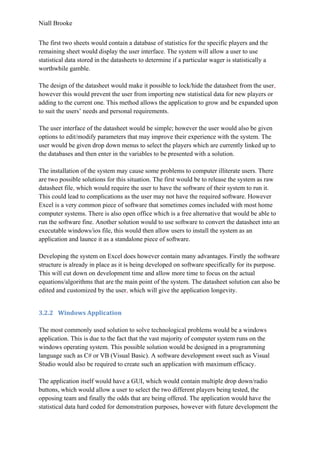
Dreamweaver’s simple interface can also be a drawback as it limits the learning of code as it
offers a point and click solution. Dreamweaver can also limit itself sometimes when it tries to
connect to things in a certain way and will not allow other particular options.
1.6 Current Solutions
It is a known fact that it is impossible to predict the result of every single football match as
there are far too many variables that could change at any given moment. However there are
many different ways to greatly increase the percentage chance of predicting the result. There
are some current solutions that have been researched and developed. The most common
research into predicting a football match is to review the current form of two teams playing
and any past fixtures they have played against one another.
Mathew Tucker of the University of Southampton developed a website that used multiple
algorithms in an attempt to predict football results with a higher success rate by factoring in
the players themselves. The system would constantly pull data from the BBC Sport website
and store it on a database taking into account how the team’s winning percentage is altered
depending upon each individual player. Essentially the system would get more accurate over
a longer period of time as there would be more data to compare. He was also was able to
factor in the Bookmakers by pulling data from an odd’s comparison website which allowed
him to check if the odds matched his system and if it was worth putting on a wager. [1]
The system isn’t entirely unique however it does combine many different variables that can
provide some interesting results. After testing the system it was clear there were many flaws
that needed to be fixed. The main one was that players who were in form at the present time
were in fact lowering the winning percentage of their team as the past data shows them to be
a weak link. However it did still correctly predict some results, which in reality were obvious
bookmaker’s favourites, so it was clear the system wasn’t very reliable.
The Seoul National University published a paper proposing a very comprehensive framework
for sports prediction. The framework is quite unique in 2 ways; it uses a rule based reasoner
and a Bayesian Network component. The reasoner allows the system to still forecast the
results of matches even if there is very little data available. The framework also takes into
account real times scores, which are very rare in other predictors; in essence it is more of a
simulator. Strategies and tactics that teams use are also reviewed and incorporated into the
framework, to create a very carefully constructed system. [2]
Both of these systems are good in their own way however, they both are only focusing on the
result of a team. Each team has 11 players and each one of them would be able to impact the
result of the game so that is a total of 21 extra variables compared to a system that focusing
on 1 player. Each one of these players would have hundreds of possible variables themselves
this makes calculating an exact percentage or likelihood very unreliable. A solution could
however also incorporate the teams overall likelihood of winning to add more accuracy to an
algorithm.](https://image.slidesharecdn.com/71a7744b-a233-4de9-8cc4-5503d0b0e4af-170130173226/85/Niall_Brooke_Project_final-docx-10-320.jpg)
![Niall Brooke
2 Literature Review
There have been many research papers into sports prediction, which go into depth about the
variables and algorithms that can be used to forecast the result of a sporting event.
Subsequently there is also a vast amount of research into the odds and statistics that are
involved with gambling, this can also be factored in with sports wagering. During this
literature review all these topics will be covered and there will also be an in-depth look at
machine learning in general showcasing and any possible methods can be used in sports
environment.
2.1 Machine Learning
Machine learning is a form of artificial intelligence, which essentially is a system that can
learn from data. This can be useful for situations such as detecting spam Email messages or
finding patterns in sports statistics. There are many different methods of machine learning
that can be implemented in a system, two of the most popular are decision tree’s and
Bayesian networks. Decision trees’ are used as a predictive model to observe previous data
in order to show an end target. Bayesian networks on the other hand are a mix of incidence
diagrams and Bayes theorem. They display the conditional probability and the relationships
between different variables.
2.1.1 Bayesian Networks
In modern times Bayesian networks have been increasingly used as tool for modelling
statistical problems. They have also frequently been used by in the reliability analysis
community. A reliability analyst tends to be someone who gives their input to a decision
problem. Studies in areas like this tend to be unclear due to the random fluctuations. The end
result should be made into a statistical model of random variables. The model should be
mathematically accurate but also be clear and easy to understand for the decision maker. It is
vital that a set of parameters are fully specified by statistical or judgement data. Due to both
of these sources of data being less than perfect it is important to formalise to reduce the
amount of parameters needed in the model [3].
In a statistical environment the figures that are sought after tend to be conditional
probabilities or deduced from these numbers. Due to all of these requirements there has been
a lot more focus on the traditional and flexible frameworks such as fault trees. One
framework that has stood out is set of Bayesian network modules. Bayesian networks
originally came from the area of artificial intelligence. They were used as an effective
framework for understanding uncertain knowledge. Bayesian networks can be found
originated from Almond and Barlow [4].
The suggestion of using Bayesian networks for reliability analysis has led to a flurry in
research regarding comparing the classical reliability formalisms and Bayesian networks.
Features from both modelling and analysis of reliability block diagrams have been also
compared to Bayesian networks, which have shown that they have many advantages over the
traditional frameworks. In recent times however other more general reliability models have
been compared with Bayesian related formalisms [5] and [6].](https://image.slidesharecdn.com/71a7744b-a233-4de9-8cc4-5503d0b0e4af-170130173226/85/Niall_Brooke_Project_final-docx-11-320.jpg)
![Niall Brooke
Bayesian networks over the years have had many different uses such as finding software
reliability [7], find faults in systems and maintenance modelling [8]. However they are very
commonly used to find software system reliability. It is very popular as it combines multiple
sources of information to generate a global construction of information. Fenton [9] displayed
that the vastness of well-founded underlying theory of Bayesian networks can provide a good
amount significant advantages. Woff [10] designed a series of software tests using Bayesian
networks and concluded they are well suited for these problems.
Typically it is common to see discrete variables in the Bayesian network community.
However it is must be noted that the reliability analysis would be very limited if only discrete
variables were considered. So it is important for them not to limit themselves in that
particular way. Instead it is important to use both continuous and discrete variable models.
Overall Bayesian networks are considered to constitute a modelling framework which tends
to be typically easy for domain experts to use and of course in the reliability field. In research
common aims and goals are being targeted by the Bayesian network community.
Bayesian networks belong to the Graphic models family. These are graphical elements, which
are used to display the unknown. Each node represents a random variable while in between
them lays the dependencies along with random variables. The dependencies found in the
graphical model are determined using known statistical methods. Graphical models with
undirected edges are typically referred to as Markov networks. These types of networks are
known to present a solid definition of any two different nodes based on the concept of the
Markov blanket. These types of networks are commonly used in computer vision [11].
2.1.2 Graphics model link
Bayesian networks are also linked to another graphics model commonly known as a directed
acrylic graph. This tends to be found in machine learning and artificial societies. Bayesian
Networks are very focused on a mathematical element however are also very unique. They
allow an effective representation of joint probability distribution over a set of random
variables [12].
The structure that is typically found in a directed acrylic graph is split into two different
sections; the nodes and the vertical edges. The nodes are used to represent random variables
and are displayed as circles defined by the variable name. The edges are however are the
direct dependence among with variables and are depicted as arrows between nodes [13]. Due
to the design of the directed acrylic graph it is impossible for an individual node to be its own
ancestor or descendant. This means that this condition is very important because of possible
factorization of the joint collection of probability nodes [14].](https://image.slidesharecdn.com/71a7744b-a233-4de9-8cc4-5503d0b0e4af-170130173226/85/Niall_Brooke_Project_final-docx-12-320.jpg)
![Niall Brooke
A Bayesian Network is similar to that of a conditional independence statement. This is
typically the case when each variable is independent of its nondescendants, depending upon
the state of its parents. This can be used to greatly reduce the amount of parameters that are
required to define the joint probability distribution of the variable [15]
2.1.3 Bayesian networks in sport
Bayesian networks are also used to create predictive models for sports such as football.
Knowledge can be gathered from experts or statistics to help determine to main factors than
can effects the result of a football match. These factors are very complex and are evidence
that it isn’t just luck that determines a match. It is in situations like this in which Bayesian
networks excel. It is possible for a domain expert to have collaboration with a Bayesian
network expert to create a network showcasing the importance of the relationships between
the main factors involved to determine the direction of each effect in the network. Fenton
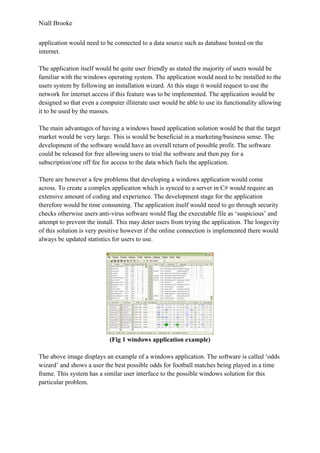
[16] compared an experts Bayesian network to analyse the results of Tottenham hotspurs in
the 1995/1996 and 1996/1997 seasons.
(Fig 1 a Bayesian network for of Tottenham hotspurs in the 1995/1996 and 1996/1997 season)
Fenton used an expert Bayesian network, which provided excellent results over the cross
season test periods. This model didn’t take into account the players training regime in-
between the two seasons ignoring key attributes. This helped to show how that an expert
Bayesian network can be used to select the key features. Fenton concluded that the overall
procedure of machine learning with Bayesian networks provided two main positive outcomes
understanding and prediction. Even though logically speaking the more understanding we
have the better our predictions should be. It is however possible to make accurate predictions
without a substantial amount of knowledge. The understanding that is gained from learning
different processes allows the construction of models that demonstrate the relationship
between two different models. [16]](https://image.slidesharecdn.com/71a7744b-a233-4de9-8cc4-5503d0b0e4af-170130173226/85/Niall_Brooke_Project_final-docx-13-320.jpg)
![Niall Brooke
2.2 Bookmakers
Gambling has now become an integral part of the sports ecosystem. In recent years sports
betting companies have had a massive boom in their market due to online gambling.
However with all of its success the sports betting market has never been too far away from
controversy.
Sports wagering can be tracked all the way back to the original Olympic Games in Greece
whereby athletes would compete in many different events such as foot races, hurdles and
even free style fighting. These athletes would be rewarded with winnings however the
majority of money would be won in the crowd. The spectators would wager on the outcomes
of these events winning or losing entire estates at a time. Even before that the gambling can
be traced back to the Romans, who swore it was a metaphor for life itself.
Sports betting can be found in almost every sport in this day and age. Bookmakers have 100’s
of different ways to bet on single events to entice more wagers. Bookmakers use algorithms
to find patterns to predict and produce their odds. They will always put the odds in their
favour so that they can be sure to produce a profit. However from time to time they may
make a mistake or inside information may be leaked which can cause a flurry of bets and
cause the Bookmakers to close bets.
2.2.1 Gambling market
Financial markets and sports wagering are very similar, both involve investors with
heterogeneous beliefs looking to make a profit. Sports’ betting is a zero-sum game with two
traders on each side of the transaction with large amounts of money at stake.
With financial and sporting markets being so similar it is peculiar that they are organised in
such different ways. In the financial market the price constantly fluctuates to match the
supply and demand. The main goal of the market makers is to match up the buyers and
sellers. However the bookmakers in sports wagering tend to announce a price (such as the
odds for a horse to win a race or team to win a game) after this changes in the prices are very
rare and sometimes not at all [17]. If the price chosen is not the market clearing price then
that bookmaker could take a big loss [18]. If the betters notice that a bookmaker has made a
mistake with their price they can exploit this, which will lead to a big loss. Bookmakers are
categorically different in the way that casinos have risks on their games of chance such as
roulette and blackjack. This is due to the fact that these games have odds that favour the
house and with a mass amount of people playing they are guaranteed to make a profit. On the
contrary with bookmakers if they make a mistake with the odds they can make a big loss,
even in the long run. Small groups of skilled gamblers who can consistently make a profit can
be financially disastrous for bookmakers. These gamblers could either amass a huge bankroll
or sell their winning formula to others and increase the overall problem.](https://image.slidesharecdn.com/71a7744b-a233-4de9-8cc4-5503d0b0e4af-170130173226/85/Niall_Brooke_Project_final-docx-14-320.jpg)
![Niall Brooke
Although the system which bookmakers implement is peculiar there are a few ways in which
it can be very profitable. Bookmakers are very knowledgeable and have vast amount of
resources allowing them to equalise the amount of money wagered on each outcome,
presenting them with a profit regardless of the outcome as the bookmaker will charge a
commission of the bet’s known as ‘the vig’ [19]. Due to this strategy Bookmakers tend not to
focus directly on the winner of the outcome but forecasting how wagers will be placed.
Popular depictions of how bookmakers react is stressed here [20].
The second main strategy is if the bookmakers are statistically more accurate at predicting the
outcome of sporting events than the customers placing wagers. In this scenario the
bookmaker would always be able to set the correct price as it would equalise the probability
that a bet placed on either side of a wager is a winner. However this would mean that the
bookmaker would only win the commission and not the overall wager placed as it would
have now been cancelled out by covering other losses. Unlike the previous methods the
bookmakers would actually lose if the gamblers are more skilled at predicting the outcome of
an event.
The final method for bookmakers can be very profitable as it combines the positives from
both previous strategies. If the bookmaker is better at predicting the results of games but also
can effectively predict the betters themselves, they can make profits more than that just of
their commission. By systematically setting the ‘wrong’ prices for games they can start to
control how wagers are placed and then create a larger profit margin for themselves. For
example if a local bookmaker knew that customers had a trend of betting for the local team,
they could skew the odds against that particular team. However there are also constraints to
this as it couldn’t be done on a mass scale as betters who know the ‘correct’ odds could
generate a profit if the posted price diverts too much from its true form [21].
2.3 Sports Prediction
Sports forecasting is becoming ever more important in the world of sport, effecting teams
sponsors, the media and mainly the fans who are making wagers online. There has been a
surge of demand for professional advice regarding the results of sporting events. This is
typically delivered in the form of tipsters or pundits [22]. Betting odds themselves now are
used as a form of forecasting as they provide an overall prediction. Fixed odds on the other
hand are sourced from the expert predictions of the bookmakers [23].](https://image.slidesharecdn.com/71a7744b-a233-4de9-8cc4-5503d0b0e4af-170130173226/85/Niall_Brooke_Project_final-docx-15-320.jpg)
![Niall Brooke
2.3.1 Prediction markets
Prediction markets were originally used in political election results [24] and later even in
business outcomes [25]. It is now increasingly used in an attempt to predict all different types
of sporting events. This shows that prediction markets provide their own method of sports
forecasting. Essentially they are a massive group of individuals connected via the Internet
who are sharing virtual market stocks which will then have an effect on the future value of
shares depending on the market situation. When a particular outcome which is linked to a
specific market situation occurs each virtual stock bought receives a cash payoff. An example
of this would be £1 if a team wins and £0 otherwise. In prediction markets each individual
provides their own knowledge to the market so the stock prices are a representation of the
combined wisdom of everyone involved, thus creating the prediction [26].
Due to the vast amount of different forecasting methods questions have been raised as to how
effective they are. There have been studies that research the performance of betting odds and
tipsters’ methods [22]. However there has never been extensive research into a comparison
with these methods and prediction markets [27]. There is also not much research into any
possible similarities between multiple forecast methods. This could be very effective if they
were to be combined in a weighting-based overall method. However this may be beneficial to
the grand scale as if it was openly available the average sports fan may be able to take
advantage. This also aids sports betting companies such as bookmakers to improve their own
forecasts.
2.3.2 Forecasting methods
2.3.2.1 Prediction markets
The general consensus of prediction markets suggests that markets in fact solve information
problems [28]. A competitive market can achieve market efficiency through different price
mechanisms. The most effective proven method of aggravating the balance is by depriving
the individuals of information [29]. This means that the prices in a competitive market will
show a reflection of the public and private information from the individuals thus providing a
good predictor [26]. These qualities make them a very promising method to solve many
different information problems [30].
There are many online prediction markets based around sport, they will trade virtual stocks
related top future market situations, which are directly linked to the results of sporting events.
The cash pay-out of the shares of virtual stocks depends upon the actual outcome of the
fixture. This means that the price of one of the virtual stocks should then match the prediction
markets aggregate prediction of the event outcome.
The participants of a Prediction market will use their own judgment and expectations of the
result to work out the true value of the related share of virtual stock. Accordingly they will
then proceed to compare their expected cash share with the prediction markets aggregate
expectation. If the potential profit from the virtual portfolio exceeds expectations it will then
be in the general interest of the prediction market to reveal their transactions to aid the overall](https://image.slidesharecdn.com/71a7744b-a233-4de9-8cc4-5503d0b0e4af-170130173226/85/Niall_Brooke_Project_final-docx-16-320.jpg)
![Niall Brooke
strategy. This leads to participants in the future revealing their true expectations of the market
through buying and selling activities [22] Due to the individuals making their expectations
tradable a prediction market can then create a market of its own about future situations
whereby participants will compete according to their own expectations. Research has been
conducted studying empirical data, which supports the informational efficiency of such
markets [30].
2.3.2.2 Tipsters
Professional forecasts are often made sports pundits/tipsters whose predictions are normally
broadcast through media. Tipsters tend to be experts of a particular sport who will not use
any type of model to predict a result but rather use their personal experience [31]. They will
tend to only offer forecasts on popular fixtures typically with a close connection to betting.
Due to the nature of the forecast there are no financial consequences caused from the result of
the tipsters.
There is clear evidence from research that the actual forecast accuracy from a tipster is very
limited [31]. It is show than tipsters tend to perform better overall than random forecasting
methods however they come out worse than systems that always forecast a home win. This
was showcased in study that 3 tipsters received on average 42%, 41% and 43.5% while a
home win system received 47.5% [27]. The study also showed that football tipsters will tend
to have a lower average of predicting correct results as an average football fan.
2.3.2.3 Betting odds
A vast amount of analysis into economics and business research suggests that betting odds
can provide a very effective forecasting method [32]. Bookmakers will determine a set of
fixed odds determined upon their expectations of matches’ outcome based on probabilities.
Fixed odds rarely change however an influx of ‘in play’ betting odds are constantly changing.
3 Problem Requirements
3.1 Problem Specification
The problem itself can be split into multiple sections. These can in turn be solved individually
to create a final solution. The main areas which need to be resolved are: the data source, user
interaction, the calculations and finally the output.
3.1.1 Data Source
Statistical football data on individual players needs to be collected and stored so that it can
later be manipulated. The data collected needs to detail every aspect that may affect a
player’s chance of scoring a goal in a game. This will cover what competitions the player
scores the most goals in and if the game was at home or away. The data will also need to
include the minutes in which a player had previously scored, this is to aid in match betting.
Having data determined how likely a player is to score at any given moment in a game the
opposing team will also need data collected relating to the selected player. The data will
depict how often a said player on average scores against a team of that standard. Even the](https://image.slidesharecdn.com/71a7744b-a233-4de9-8cc4-5503d0b0e4af-170130173226/85/Niall_Brooke_Project_final-docx-17-320.jpg)
![Niall Brooke
4.2 Data
The data collected was the backbone of the system, due to the solution being based around
data mining. The data was sourced from a reliable historical sports website [ref] and then
entered into two different datasheets for each of the players. The datasheet was set out with
all the dates of matches and the time in-between. The time in-between was added for the
possibility of future calculations that takes into account how long the player has
rested/travelled from game to game. This could massively affect the performance of a player
if they had an international fixture on the other side of the world a few days before a league
fixture. Fatigue is an element that will be incorporated in the future and will be discussed
more in detail later in the paper. The data collected was stored in the form of simple digits
between 1-3 this was to make calculations and data input easier. If a player scored a goal in a
game a variety of data would be logged. First if the player started the game and if the match
itself was been played at home or away. The competition in which the player was competing
in i.e. the league or cup. Information regarding any goals the player scored such as the total
and minute it was achieved in. The datasheet can easily be modified to incorporate more
variables as the system expands.
4.3 Algorithm
The Algorithm is the heart the solution it will take the values generated from multiple
different equations to create an overall figure. In this project the overall aim was to generate a
percentage of how likely a football player was to score in a game depending upon a selection
of variables the user has chosen.
4.3.1 Statistical Percentage
Initially stats of Wayne Rooney of Manchester united were looked at to see if data mining
could in fact help predict whether it was possible to predict if a player would score. A test
was done by taking Rooney’s previous stats to create an average which could then be used to
make a prediction. The game in question was in 2012 between Manchester United and Stoke
City. Using statistics from the previous 3 seasons a week before the game it was shown that
he was very likely to score at least 1 goal. This was because Rooney had a 61% Chance of
scoring against any team with a 24% Chance of it being the first goal. There was an 87%
Chance of Manchester United scoring at least 1 goal against any team and 29% Chance of
Stoke City not conceding at least 1 goal against any team. Meaning that there is a 79%
chance Manchester United will score at least 1 goal vs. Stoke City. Rooney then had a 48%
Chance of scoring against Stoke city with a 19% Chance of it being the first goal. In the
game Rooney scored 2 goals however he wasn’t the first goal scorer which mimics the
statistics. This initial test research encouraged the current algorithm which takes into account
the individuals performances in different competitions and how their goal scoring ratio will
fluctuate depending on if the players is playing at home or away. Depending on what
variables have selected a different calculation is made by combining different equations from
the datasheet.](https://image.slidesharecdn.com/71a7744b-a233-4de9-8cc4-5503d0b0e4af-170130173226/85/Niall_Brooke_Project_final-docx-25-320.jpg)


![Niall Brooke
5.3 Result Analysis
The 5 results showed on average that the developed system was more effective than then
bookmakers algorithm, however this may have just been coincidence as only a small amount
of games were tested. From viewing the odds the bookmaker gave out is clear that they try to
keep a similar pattern unless something drastic happens such as an injury. This is an
interesting system as always have low odds for Messi & Ronaldo to score no matter who they
are playing. Even though these two players will end up scoring a high ratio of goals they will
never score 100% of the time in every game. This is because even though for instance
Messi’s goal ratio is higher than his overall games played, he may have scored multiple times
in one match and therefore skewing the statistics.
5.3.1 Method Analysis
The solution which has been developed and implemented has many different levels of depth
and complexity. The variables are the key factors this system compared to other systems
which are currently out who focus only on the teams variables are very rarely attempt to even
include the players into their equations. However there may be a reason for this as players
can be very unpredictable.
5.3.2 Method Flaws
One flaw in which the system will come across is that individual players can be very
unpredictable as they are one person who has their own free will. This means that even if all
the statistics point to this player having a fantastic game and scoring at least 1 goal there may
other factors off the pitch. For instance a player may just have had some very bad news and
therefore they are not playing to their full potential. This may be why there are many team
based forecasting systems as they overall create an average of stability compared to 1
possibly unpredictable player. The system also has a draw back with the
5.3.3 Bookmakers calculations
Bookmakers have a way of working out their odds, each single match is individually
calculated. They work out every possible outcome before placing down any odds. This is an
example of how they calculate the distribution rate.
100% x (1 / [(1 / odds of [1]) + (1 / odds of [X]) + (1 / odds of [2])]
Taking in all of the information form the bookmaker and the system that was developed it is
clear than both have smart systems which can compete against each other without ever
finding a winner. Using a system such as this would defiantly be more beneficial for
customers than just betting on bets they believe look good, as it could all just be a ploy to
spend money.](https://image.slidesharecdn.com/71a7744b-a233-4de9-8cc4-5503d0b0e4af-170130173226/85/Niall_Brooke_Project_final-docx-35-320.jpg)

![Niall Brooke
7 References
[1] Matthew Tucker of the University of Southampton, 2010
[2] Byungho Min Jinhyuck Kim, Chongyoun Choe, Hyeonsang Eom, Robert Ian (Bob) McKay A Compound
Framework for Sports Prediction: The Case Study of Football School of Computer Science and Engineering,
Seoul National University, Seoul, Korea
[3] R.E. Barlow, Using influence diagrams C.A. Clarotti, D.V. Lindley (Eds.), Accelerated life testing and
experts’ opinions in reliability (1988), pp. 145–157
[4] Almond RG. An extended example for testing graphical belief. Technical Report 6, Statistical Sciences Inc.;
1992.
[5] S. Montani, L. Portinale, A. Bobbio Dynamic Bayesian networks for modeling advanced fault tree features
in dependability analysis Proceedings of the sixteenth European conference on safety and reliability, A.A.
Balkema, Leiden, The Netherlands (2005), pp. 1415–1422
[6] Boudali H, Dugan JB. A temporal Bayesian network framework. Presented at the fourth international
conference on mathematical methods in reliability (MMR-04), Santa Fe, NM; 2004
[7] M. Bouissou, F. Martin, A. Ourghanlian Assessment of a safety-critical system including software: a
Bayesian belief network for evidence sources Proceedings of the annual reliability and maintainability
symposium (1999), pp. 142–150
[8] H. Langseth, B.H. Lindqvist A maintenance model for components exposed to several failure modes and
imperfect repair K. Doksum, B.H. Lindqvist (Eds.), Mathematical and statistical methods in reliability, quality,
reliability and engineering statistics, World Scientific, Singapore (2003), pp. 415–430
[9] N.E. Fenton, B. Littlewood, M. Neil, L. Strigini, A. Sutcliffe, D. Wright Assessing dependability of safety
critical systems using diverse evidence IEE Proc Software Eng, 145 (1) (1998), pp. 35–39
[10] D. Wooff, M. Goldstein, F. Coolen Bayesian graphical models for software testing IEEE Trans Software
Eng, 28 (5) (2002), pp. 510–525
[11] Jordan, M.I. (1999). Learning in Graphical Models, MIT Press, Cambridge.
8hWroJ:www.timostich.de/resources/thesis.pdf.
[12] [3] Pearl, J. (1988). Probabilistic Reasoning in Intelligent Systems, Morgan Kaufmann, San Francisco.
[13] Griffiths, T.L. & Yuille, A. (2006). A primer on probabilisticinference, Trends in Cognitive Sciences
Supplement to special issue on Probabilistic Models of Cognition, 10(7), 1–11.
[14] Pearl, J. & Russel, S. (2001). Bayesian networks.Report (R-277), November 2000, in Handbook of Brain](https://image.slidesharecdn.com/71a7744b-a233-4de9-8cc4-5503d0b0e4af-170130173226/85/Niall_Brooke_Project_final-docx-40-320.jpg)
![Niall Brooke
Theory and Neural Networks, M. Arbib, ed, MIT Press,Cambridge, pp. 157–160.
[15] [6] Spirtes, P., Glymour, C. & Schienes, R. (1993). Causation
Prediction and Search, Springer-Verlag, New York.
[16] N.E. Fenton, B. Littlewood, M. Neil, L. Strigini, A. Sutcliffe, D. Wright Assessing dependability of safety
critical systems using diverse evidenceIEE Proc Software Eng, 145 (1) (1998), pp. 35–39
[17] Ali, M. (1977). ‘Probability and utility estimates for racetrack bettors’, Journal of Political Economy, vol.
85, (August), pp. 803–15.
[18] Asch, P., Malkiel, B. and Quandt, R. (1984). ‘Market efficiency in racetrack betting’, Journal of Business,
vol. 57, pp. 165–75.
[19] Avery, C. and Chevalier, J. (1999). ‘Identifying investor sentiment from price paths: the case of football
betting’, Journal of Business, vol. 72, (October), pp. 493–21.
[20] Clemen, R. and Winkler, R. (1986). ‘Combining economic forecasts’, Journal of Business and Economic
Statistics, vol. 4, (January), pp. 369–91.
[21] DellaVigna, S. and Malmendier, U. (2003). ‘Contract design and self-control: theory and evidence’,
unpublished manuscript, University of California-Berkeley Department of Economics.
[22] ] Forrest D, Goddard J, Simmons R. 2005. Odds-setters as forecasters: the case of English football.
International
Journal of Forecasting 21: 551–564.
[23] Pope PF, Peel DA. 1989. Information, prices and efficiency in a fixed-odds betting market. Economica 56:
323–
341
[24] Forsythe R, Rietz TA, Ross TW. 1999. Wishes, expectations and actions: a survey on price formation in
electionstock markets. Journal of Economic Behaviour and Organization 39: 83–110
[25] Dahan E, Lo AW, Poggio T, Chan NT, Kim A. 2006. Securities trading of concepts (STOC). Working
paper,
University of California, Los Angeles.
[26] Spann M, Skiera B. 2003. Internet-based virtual stock markets for business forecasting. Management
Science 49:
1310–1326.
[27] ] Andersson P, Edman J, Ekman M. 2005. Predicting the World Cup 2002 in Soccer: performance and
confidence
of experts and non-experts. International Journal of Forecasting 21: 565–576.
[28] Hayek FA. 1945. The use of knowledge in society. American Economic Review 35: 519–530.](https://image.slidesharecdn.com/71a7744b-a233-4de9-8cc4-5503d0b0e4af-170130173226/85/Niall_Brooke_Project_final-docx-41-320.jpg)
![Niall Brooke
[29] ] Smith MA, Paton D, Vaughan Williams L. 2006. Market efficiency in person-to-person betting.
Economica 73:
673–689
[30] Fama EF. 1970. Efficient capital markets: a review of theory and empirical work. Journal of Finance 25:
383–
417.
[31] Forrest D, Simmons R. 2000. Forecasting sport: the behaviour and performance of football tipsters.
International
Journal of Forecasting 16: 317–331.
[32] Gandar JM, Dare WH, Brown CR, Zuber RA. 1998. Informed traders and price variations in the betting
market
for professional basketball games. Journal of Finance 53: 385–401](https://image.slidesharecdn.com/71a7744b-a233-4de9-8cc4-5503d0b0e4af-170130173226/85/Niall_Brooke_Project_final-docx-42-320.jpg)