Download to read offline
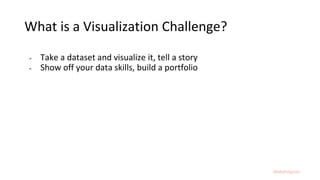
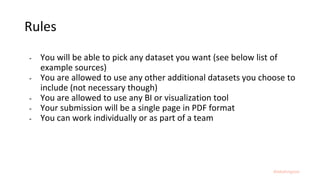
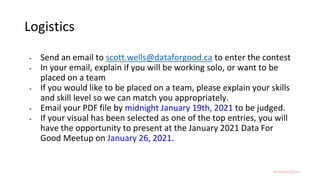
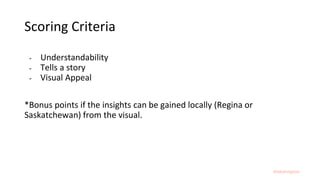
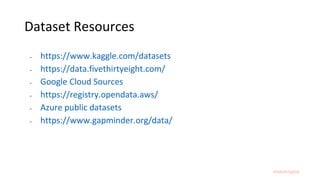
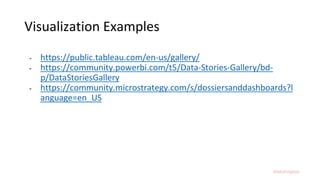


This document announces a visualization challenge hosted by Data for Good to encourage the use of data skills to tell stories with data visualizations. Participants can choose any public dataset to visualize and must submit a single-page PDF by a deadline to be judged on understandability, how well it tells a story, and visual appeal. Bonus points will be given to visualizations that use local Saskatchewan data. Top submissions will be featured on the Data for Good social media and presented at an upcoming meetup. Contact information and examples of visualization tools and public datasets are provided.


![[DSC Europe 25] Josip Saban - Career building for data professionals.pptx](https://cdn.slidesharecdn.com/ss_thumbnails/zroflcttkm1vmli0txea-josip-saban-career-building-for-data-professionals-260123083019-587cdb8c-thumbnail.jpg?width=640&height=640&fit=bounds)


